

Abstract
Background
Physicians naturally form networks. Networks could form a rational basis for Accountable Care Organizations (ACOs) for defined populations of Medicare beneficiaries.
Objectives
To use methods from network science to identify naturally occurring networks of physicians that might be best suited to becoming ACOs.
Research Design, Subjects, and Measures
Using nationally representative claims data from the Medicare program for CY 2006 on 51 hospital referral regions (HRRs), we used a network-science based community-detection algorithm to identify groups of physicians likely to have pre-established relationships. We examined the proportion of care delivered within communities and compared our results to potential ACOs organized around single hospitals.
Results
We studied 4,586,044 Medicare beneficiaries from 51 HRRs who were seen by 68,288 active physicians practicing in those HRRs. The median community-based network ACO had 150 physicians with 5,928 ties whereas the median hospital-based network ACO had 96 physicians with 3,276 ties. Seventy-seven percent of physician visits occurred with physicians in the community-based networks as compared with 56% with physicians in the hospital-based networks; however, just 8% of specialist visits were to specialists within the hospital-based networks as compared with 60% of specialist visits within the community-based networks. Some markets seemed better suited to developing ACOs based on network communities than others.
Conclusions
We present a novel approach to identifying groups of physicians that might readily function as ACOs. Organic networks identified and defined in this natural and systematic manner already have physicians who exhibit close working relationships, and who, importantly, keep the vast majority of care within the networks.
Keywords: Medicare, Accountable Care Organizations, Social Networks
The recently affirmed Patient Protection and Affordable Care Act (ACA) of 2010 is a source of great optimism for many. It promises to extend health insurance coverage to most uninsured Americans while also including features to increase the efficiency and quality of our health care system. The ACA includes a recently launched demonstration program for Accountable Care Organizations (ACOs), which began operation in 2012. ACOs represent an important step toward reform of the payment system, placing systems of care at risk for the total spending incurred by patients. ACOs, however, work within the framework of the current fee-for-service system that also guarantees beneficiaries the flexibility to go to any participating provider they choose. Consequently, organizations that choose to become ACOs assume substantial risk without being given tools to exercise influence over patient choices.
ACOs require the participation of groups of physicians, with or without hospitals. What is not clear, however, is how to best identify groups of physicians who will together form an ACO.1 The current approach is to let ACOs self-identify in that the ACO identifies the physicians that will be included in the ACO for purposes of assignment of patients. An alternative approach, explored here, would be to utilize prior care patterns to identify groups of physicians that appear most ready to become accountable for a defined population of patients on the basis of their documented pre-existing care patterns.
Identifying ACOs based on care patterns can be done using the tools of social network analysis. Using administrative claims, one can identify physician networks based on shared patients, wherein physicians are the “nodes” and “ties” connect physicians who share patients. 2–4 Within such networks, one can potentially identify pre-existing “communities” of physicians who are more inter-connected than would be expected by chance using computational algorithms developed for studying such networks.5–8 The methods for identifying such communities are not dependent on hospital or integrated delivery system affiliation and therefore can be useful for identifying groups of physicians that might or might not be best suited to becoming ACOs. The extent to which such organically defined networks overlap with pre-existing physician organizations or integrated delivery systems would be useful information to organizations contemplating becoming ACOs or to payers looking to identify appropriate organizations for such contracting arrangements.
We used a network community detection method to identify groups of physicians using comprehensive, national data from the Medicare program from 51 markets. We identify communities of physicians in each of these markets and examine the proportion of care delivered within these communities. As a point of comparison, we then compared our results to those that would be obtained by organizing ACOs around single hospitals based on their extended hospital medical staff (EHMS) as proposed by Fisher and colleagues, which is another method that has been proposed for empirically identifying ACOs.9 The EHMS approach assigns physicians to the single hospital where the plurality of their inpatient work is done, or where their patients receive inpatient care.
Methods
Overview
The presence of shared patients identified with administrative data can be used to discern ties relevant to patient care among pairs of physicians and, hence, can be used to define physician networks.10 Here, we use physician encounter data from the Medicare program for 100% of patients living in randomly-sampled hospital referral regions (HRRs) and define networks where the connections between individual physicians are identified on the basis of patient sharing. We then apply a mathematical algorithm to identify “communities” of inter-connected physicians within each area, wherein each physician is assigned to a single community, and we describe the composition of these community-based networks.5,6,11,12
Data Sources
To maximize data on shared patients among physicians practicing in local areas, we obtained data for 100% of Medicare beneficiaries (including those under age 65) living in 50 market areas (defined as hospital referral regions (HRRs)) randomly sampled with probability proportional to their size as well as the Boston HRR; this was the maximum amount of data CMS would release. HRRs represent regional markets for tertiary care defined based on cardiovascular and neurosurgical procedures.13 We excluded patients enrolled in Medicare Advantage since we did not have claims for these patients. We obtained information on physician specialty and practice location directly from the claims submitted by each physician.
Identifying the Sharing of Patients and Constructing Physician Networks
We identified shared patients based on significant encounters from physician claims submitted to Medicare. These data can then be used to count the number of patients shared by each pair of physicians and to create physician networks based on shared patients. More details on defining significant encounters and our methods for creating physician networks are available in the Technical Appendix (Supplemental Digital Content 1).
Assigning Patients to Physicians
We assigned beneficiaries to a primary care physician (PCP) using an algorithm that matched the beneficiary to the PCP who provided the plurality of his/her evaluation and management (E&M) visits over the study year. In cases where a beneficiary had no contact with a PCP, she was assigned to a specialist physician using the same algorithm. Our assignment algorithm prioritizes PCPs because the ACO regulations specify ACO assignment on the basis of primary care contact.14
Assigning Physicians to a Primary Hospital and Creating Hospital-Based Networks
We assigned each physician with an office located in a sampled HRR (assessed using the plurality of their submitted claims) to a principal hospital based on where they filed the plurality of inpatient claims or, if they did not perform any inpatient work, to the hospital where the plurality of patients they saw received inpatient care.9,15 For comparison with our community-based networks, we also defined networks based on these hospital assignments among physicians in the same hospital. In addition, we also identified the second most frequently used hospital for each physician in the hospital-based networks to determine if two hospitals should be included when determining care within a network.9
Identifying Network “Communities”
To uncover the community structure of each HRR network, we applied an algorithm introduced by Newman11 and refined by Newman and Girvan12 that detects groups within networks that share more ties than would be expected by chance alone.8 This so-called modularity maximization algorithm assigns each physician to a single community, and communities are comprised of distinct, non-overlapping groups of physicians. The null model incorporated in the method adjusts for the fact that nodes (physicians) with high degree are more likely to be connected than nodes with low degree. The community detection process is depicted schematically in Figure 1 and more details are provided in the Technical Appendix.
Figure 1. Example of community-network construction for a very small HRR.
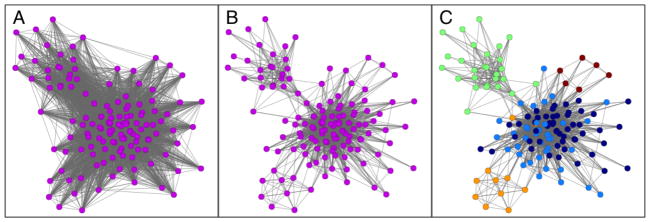
We start from the claims data, which can be represented as a bipartite network connecting physicians to their patients (not shown). This network is then projected to a unipartite or one-mode network, which in this case consists of physicians only (the nodes), and ties connect two or more physicians if they have shared patients. This typically results in a very tightly knit network as shown in panel A. Each network tie is then assigned a “strength”, which is a number that quantifies the number of patients any two physicians share. In order for a tie to exist between them, by definition the physicians must share at least one patient, but many share several more. Because most of the connections between physicians turn out to be weak, corresponding to just one or two shared patients, we filter the network by keeping, for each physician, only the strongest 20% of their ties. Note that for a tie to be retained between any two physicians, the tie has to fall in the top 20% for each physician. The tie thresholding process results in a sparser network with arguably only the more influential connections left in place (panel B).. Finally, we apply the method of modularity maximization to detect network communities, which are sets of densely connected nodes. In panel C, we show the outcome of community detection, and color the nodes based on their community assignments. For example, the green nodes in the upper left corner form a fairly densely connected group with few connections to nodes in other communities. This is an example of a community-network.
Hospitals were then assigned to communities based on where community members admitted their patients. Since ACOs likely would need to concentrate their hospital care within a select set of hospitals, we included for analysis up to 2 hospitals that shared the most admissions for patients cared for by community members. Of note, hospitals could be assigned to more than one community, although physicians could only be assigned to a single community. Our approach, which starts by thresholding the network and then proceeds to the actual community detection, is depicted in Figure 1.
Network Measures
For each community-based and hospital-based network, we calculate several measures, including the number of patients shared by the physicians and the proportion of network ties that are to other physicians within the network. Degree is defined as the number of other physicians within the network who are connected to a physician through patient sharing. To account for Medicare patient volume, we calculated the “adjusted degree” by dividing each physician’s degree by the total number of Medicare patients the physician shared with other physicians.
Statistical Analyses
We excluded from our analyses community and hospital networks with fewer than 3,000 assigned patients. Although this exclusion resulted in the elimination of a substantial number of small hospital networks (314) and a smaller number of community networks (28), this only resulted in excluding approximately 2% of physicians and 1% of patients from our analyses. Although ACO regulations require a minimum of 5,000 Medicare patients in order to participate in the program, those patients are assigned over a three-year period so we elected to use a somewhat lower threshold.
We first describe the community-based and hospital-based networks in each of the 51 HRRs. We then calculated the percentage of hospitalizations, emergency room visits, and physician visits that occur within networks defined by community membership or by hospital affiliation. We also aggregated these results to the HRR level by taking a weighted average across all defined networks within an HRR. Finally, because community-based networks were generally larger than hospital-based networks, we computed adjusted rates estimated for the median sized community and median size hospital network to make these comparable.
All statistical analyses were performed with SAS, version 9.2 (Cary, NC).16 All network analyses were implemented with Python, NetworkX, and R. We visualized networks using the Fruchterman-Reingold algorithm as implemented in igraph to optimally position physicians in the visualizations based on their patient-sharing relations, illustrating the coherence of the community assignments to this spring-embedder algorithm.17 This study was approved by the institutional review board at Harvard Medical School.
Results
We studied 4,586,044 Medicare beneficiaries from 51 hospital referral regions who were seen by 68,288 active physicians practicing in those HRRs. Descriptive information about the HRRs is presented in Table 1. The mean number of Medicare beneficiaries per HRR was 138,011 (range, 19,424–619,957). The mean number of physicians was 1,339, and almost two-thirds of physicians were specialists. The average number of hospitals per HRR after eliminating hospital networks with fewer than 3000 patients was 8 and the similar number of detected network communities was 6.
Table 1.
Hospital Referral Region Characteristics (51 HRRs)
| Number of: | Mean | Minimum | Maximum |
|---|---|---|---|
| Beneficiaries | 138,011 | 19,424 | 619,957 |
| Physicians (Total) | 1,339 | 135 | 8,197 |
| Primary Care | 545 | 68 | 3,158 |
| Specialist | 795 | 67 | 5,180 |
| Hospital Networks* | 18 | 2 | 45 |
| Hospitals Networks+ | 8 | 1 | 36 |
| Community Networks* | 7 | 3 | 17 |
| Community Networks+ | 6 | 2 | 17 |
HRRs are as defined by the Dartmouth Atlas of Health Care
Hospitals and Communities with 5 or more PCPs included
Hospitals and Communities with at least 3,000 assigned patients
Network Characteristics
After excluding networks with fewer than 3,000 assigned patients, we identified 411 hospital-based networks and 310 community-based networks (Table 2). The median number of physicians per community-based network was 150, who were linked together by 3,169 ties, whereas the hospital networks had a median of 96 physicians linked together by 3,276 ties. The median number of other physicians in the community network to whom a physician was connected per 100 Medicare beneficiaries cared for (adjusted degree) was 17 (range, 3–48) whereas the median adjusted degree for hospital networks was 16 (range, 2–48). Sixty-one percent of ties in communities were to other physicians in the community as compared with 30% of ties in hospital networks.
Table 2.
Network Characteristics of Community and Hospital Networks
| Communities (n=273) | Hospitals (n=416) | |
|---|---|---|
|
| ||
| Median (range) | Median (range) | |
|
| ||
| Number of Physicians | 165 (21, 2470) | 96*** (15, 1074) |
| % PCP (mean) | 43 (19, 72) | 44 (18, 79) |
| Number of Ties | 4427 (104,253588) | 2214*** (84, 71802) |
| Threshold | 2 (1, 6) | 2** (1, 8) |
| Adjusted Degree | 27 (3, 202) | 22*** (4, 176) |
| Physician Connections | 626 (200, 1802) | 572* (111, 1866) |
| % ties within the Network | 50 (13, 99) | 29*** (3, 94) |
| % patients shared within the Network | 69 (17, 100) | 49*** (7, 98) |
| Percent with at least 1: | ||
| Orthopedist | 97 | 97 |
| Ophthalmologist | 95 | 92 |
| Cardiologist | 96 | 87*** |
| Neurologist | 91 | 82** |
| Psychiatrist | 84 | 76* |
| Dermatologist | 85 | 75* |
| Gastroenterologist | 86 | 82 |
Significance test compares the mean values.
p<0.05
p<0.01
p<0.001
Community networks more commonly included at least one physician from specialties such as orthopedics and cardiology. For instance, 91% of community networks had at least one neurologist compared with 82% of hospital networks (p<.01, Table 2).
We also identified the second most commonly used hospital for each community-and hospital-based network in order to examine whether a second hospital should be included for the purpose of determining care within the network. If two hospital-based networks were to form an ACO together, each of two hospitals should serve as the second choice hospital for admission for doctors from the other hospital; however, for most hospitals (73%), the second most commonly used hospital had a different hospital than the first as its most commonly used hospital. Thus, hospital-based networks that included both the primary and secondary hospital could not be constructed using this approach as the second hospital and its affiliated physicians would usually have a third hospital as its most common alternative. In contrast, this is not an issue for community-based networks, because these networks were detected solely based on patient sharing.
Defining Location of Care Based on Network Type
Table 3 presents data on the proportion of care delivered within hospital-based and community-based networks. The first two columns present the mean proportion of each type of care for both types of networks. Because the amount of care within a network is higher with larger networks, the next two sets of columns present model-estimates based on networks of a standardized size because, in general, hospital-based networks are smaller than the community-based networks we observe. The sizes were chosen to reflect the size of the median hospital-based network (n=96 physicians) and the median community network (n=150 physicians). Finally, the last set of columns show HRR-level results to determine if particular markets seem better suited for targeting for ACO formation.
Table 3.
Percentage of Care in ACOs defined by Hospitals and Communities with at Least 5 PCPs and 3000+ Patients
| Mean % of care Provided in Networks Defined Based on: | Mean % of Care Provided in Network after adjusting for Network Size equal to the median sized hospital (n=96)1 | Mean % of Care Provided in Network after adjusting for Network Size equal to the median sized community (n=165)1 | Weighted Mean (range) % of care provided in Network across the 51 HRR Markets: | |||||
|---|---|---|---|---|---|---|---|---|
| Hospitals (n=416) | Communities (n=273) | Hospitals (n=416) | Communities (n=273) | Hospitals (n=416) | Communities (n=273) | Hospitals (n=416) | Communities (n=273) | |
| Admissions (one hospital per community) | 66 | 73** | 66 | 70## | 68 | 74 | 60 (35–92) | 71 (42–91) |
|
| ||||||||
| Admissions (up to 2 hospitals) | -- | 75 | -- | 79 | -- | 77 | -- | 73 (43–99) |
|
| ||||||||
| Emergency Room Visits (one hospital per community) | 37 | 41** | 37 | 42### | 34 | 40### | 31 (18–51) | 40 (18–59) |
|
| ||||||||
| Emergency Room Visits (up to 2 EDs) | -- | 41*** | -- | 45### | -- | 42### | -- | 40 (25–56) |
|
| ||||||||
| Physician Visits | 40 | 77*** | 39 | 74### | 37 | 77### | 33 (18–45) | 74 (39–89) |
|
| ||||||||
| PCP Visits | 72 | 91*** | 72 | 91### | 70 | 91### | 60 (41–82) | 88 (57–97) |
|
| ||||||||
| Specialty Visits | 8 | 61 | 8 | 56 | 9 | 63 | 6 (3–15) | 60 (19–83) |
p<0.05
p<0.01
p<0.001
p<0.05
p<0.01
p<0.001
Significance tests derived from the same regression model adjusted for number of physicians and the log number of physicians.
HRR is hospital referral region (as defined by the Dartmouth Atlas of Health Care). Percent of care refers to the percent of visits by affiliated patients that occur with physicians or hospitals assigned to the specific network.
On average, 67% of hospital admissions were in the assigned hospital, and 70% of community admissions were to the most frequently used hospital when limiting to one hospital per community (p<.05). When allowing a second participating hospital per community (since communities are not hospital-based), 76 percent of admissions occurred within the community. The proportion of emergency room visits within the network also was similar for both community and hospital-based networks at about 40%, but again these were slightly higher for community-based networks (p<.05). For physician visits, 39% of all visits occurred with physicians in the hospital-based networks as compared with 75% with physicians in the community-based networks (p<.001). Just 8% of specialist visits were to specialists within the hospital-based network as compared with 60% of specialist visits within the community-based network (p<.001). Results adjusted to the median sized hospital network and median-sized community network followed a similar pattern. Plots by network size of the proportion of visits within the network for PCPs and specialists are presented in the Technical Appendix.
The weighted average of the percent of admissions occurring within the community when limiting to 2 hospitals ranged from 43% in one HRR to 99% in another HRR (Table 3, right columns). Similarly, the number of physician visits occurring within communities within a market ranged from 36% to 89%. Figure 2 presents network depictions from 2 different HRRs. In Tallahassee, FL, there are 12 hospital-based networks and 4 community-based networks. The communities appear to define clear sets of tightly linked physicians as well as their accompanying hospitals, whereas there is considerable overlap among hospital-defined networks. A similar pattern is evident in Norfolk, VA.
Figure 2. Depiction of Hospital Networks and Community Networks in Tallahassee, FL (Panels A and B), and Norfolk, VA (panels C and D).

The figure depicts networks in the same HRRs based on hospital affiliation (panels A and C) and community detection (Panels B and D). Colors indicate hospital/community affiliation.
Discussion
Controlling escalating costs of care while also maintaining or improving quality likely will require new payment models that promote improved communication and coordination among providers caring for populations of patients. The use of ACOs, which are reimbursed based on a fixed budget with potential sharing of both upside and downside risk, is the most prominent policy option currently being implemented by the Centers for Medicare and Medicaid Services to accomplish these aims. ACOs, however, will face significant challenges related to Medicare beneficiaries’ right to seek care outside of their organizations. Here, we present a novel method that can be used to define organizations or groups of providers that might readily function as ACOs. Members of networks defined in this manner already exhibit close working relationships and, importantly, maintain the vast majority of care within these organic network communities. Thus, ACOs defined in this way might be the most ready to become accountable for the care they deliver.
An alternative approach would define extended hospital medical staff (EHMS) networks for each hospital, which includes care provided by both the primary hospital and the second most commonly used hospital for physicians in the hospital-based network.9 A prior paper describing this approach suggests that, defined this way, much of the care delivered would be provided by these groupings of physicians and two hospitals. We see a number of limitations associated with this approach. First, although one can define an EHMS for each hospital, these EHMS’s will be non-exclusive and overlapping. For instance, if the second most preferred hospital for hospital A is hospital B, but the second most preferred hospital for Hospital B is hospital C, then physicians potentially would be members of multiple, competing ACOs. Although this might be reasonable for some specialists, the lack of a single strong affiliation likely would lessen both the accountability and management influence of any one particular ACO. Similarly, if many of the secondary hospitals are referral institutions, the affiliated physicians of the referral hospital would be aligned with multiple ACOs, so it might be difficult for any one ACO to influence their behavior. In contrast, our approach using community detection partitions physicians into mutually exclusive, non-overlapping networks of physicians, even if some share use of the same hospital(s).
Another logical approach to defining ACOs would be based on ownership or formal affiliation to a network of hospitals. These formal organizational constructs, however, do not always conform to actual patient-sharing that we observe in a community, as seen in Figure 2. For instance, 67.2% of community physicians would have been assigned to the same hospital. In contrast, 91.5% of physicians assigned to a hospital network using our methods would have been assigned to the same community network. Thus, although there is overlap, we are identifying substantially different constructs. Although, as ACOs evolve, these organizations might exert pressure on member physicians to restrict care to within the ACO, this will require overcoming years of accumulated referral and patient-sharing practices, and it would likely require substantial changes in both clinician and patient behavior as well as changes in existing care and referral patterns. To the extent that our organically defined networks closely overlap with formal organizational constructs, these organizations would be ideal organizations to enter ACO-like arrangements. In fact, community-based network detection methods could be used to assess to what extent physicians within formal networks are closely connected, suggesting they may be well-suited to function as an ACO, or to follow the evolution of such organizations over time as they enter into risk arrangements.
Finally, our approach identifies specific markets that might be ripe for experimentation. To the extent that particular markets appear to have identified care patterns with lesser degrees of overlap, these markets represent opportunities for more systemic changes that might accompany becoming ACOs. Alternatively, markets characterized by more overlapping hospital networks and indistinct network communities may have much more difficult times succeeding under these arrangements. Thus, our community detection approach suggests ways to identify where intervention is required prior to assuming bundled payments and what groups may be ready to experiment with bundled payments because of their preexisting, organic care patterns.
Our study has several limitations. First, we discerned networks based on a single year of Medicare data from 2006 who were living in one of 51 HRRs. We do not believe the age of the data is a problem, and, in any case, it is always difficult to obtain and analyze Medicare data without several years passing, given how such data are released. Moreover, in contrast to many other studies, we had comprehensive data on care for all FFS Medicare beneficiaries delivered in these areas during that time period. Future work ideally would use longitudinal data to validate our approach using one year of data to define the networks and a second year of data to quantify care delivery. An additional consideration is that we may have missed some visits by patients living near the periphery of their HRR, but we believe we captured most of patients’ care, since HRRs were defined based on where patients get care. Second, we lacked data from other insurers in the market and so could only discern relationships relevant to the FFS Medicare population (84% of the Medicare population in 2006).18 Although we believe that these patient-sharing relationships are unlikely to be insurer-specific, future work using all payer datasets would be needed to confirm this. Third, we could not incorporate data on market characteristics, such as the extent of provider group consolidation and/or integration with hospitals. Although such relationships are likely important contributors to the types of ties we discern from our data, our methods are agnostic to the presence of these types of formal arrangements. Such consolidation is likely one explanation for the wide variation we see across HRRs. It is also likely that in some markets, there will be substantial overlap between the community and hospital networks that we defined based on these factors. Fourth, community-based networks, as operationalized here, tended to be larger than hospital-based networks. Although our analyses sought to control for these differences, these larger networks naturally will encompass more care, which is actually an advantage from the point of view of how ACO’s are defined. Finally, we recognize that forming ACOs strictly from empirical patient-sharing data using a method such as ours may be difficult to implement, even if the ascertainment of the candidate ACOs is not. But, at least initially, the approach might be especially easy to explore in areas where organically defined networks closely overlap with formal organizational constructs.
In conclusion, we describe a novel approach for identifying naturally occurring networks of physicians who work together to provide the majority of care to affiliated patients. These networks of physicians have emerged organically and have established relationships and patterns of sharing and caring for patients. Thus, these methods might be especially suited to identifying organizations of physicians that have the highest potential to succeed in delivering coordinated and integrated care, as well as markets that seem to be especially ripe for experimentation with ACOs. Finally, because of their easy availability, claims can also be used as a passive and inexpensive monitoring tool for ACOs by policy makers over time.
Supplementary Material
Acknowledgments
Supported by a grant from the National Institute on Aging (P-01 AG-031093).
References
- 1.Fisher ES, McClellan MB, Bertko J, et al. Fostering accountable health care: moving forward in Medicare. Health Aff. 2009;28:w219–w31. doi: 10.1377/hlthaff.28.2.w219. [DOI] [PMC free article] [PubMed] [Google Scholar]
- 2.Barnett ML, Christakis NA, O’Malley J, Onnela JP, Keating NL, Landon BE. Physician patient-sharing networks and the cost and intensity of care in US hospitals. Med Care. 2012;50:152–60. doi: 10.1097/MLR.0b013e31822dcef7. [DOI] [PMC free article] [PubMed] [Google Scholar]
- 3.Landon BE, Keating NL, Barnett ML, et al. Variation in patient-sharing networks of physicians across the United States. Jama. 2012;308:265–73. doi: 10.1001/jama.2012.7615. [DOI] [PMC free article] [PubMed] [Google Scholar]
- 4.Barnett ML, Landon BE, O’Malley AJ, Keating NL, Christakis NA. Mapping physician networks with self-reported and administrative data. Health Serv Res. 2011;46:1592–609. doi: 10.1111/j.1475-6773.2011.01262.x. [DOI] [PMC free article] [PubMed] [Google Scholar]
- 5.Fortunato S. Community detection in graphs. Physics Reports. 2010;486:75–174. [Google Scholar]
- 6.Porter MA, Onella J-P, Mucha PJ. Communities in networks. Notices of the Amercian Mathematical Society. 2009:56. [Google Scholar]
- 7.Mucha PJ, Richardson T, Macon K, Porter MA, Onnela J-P. Community structure in time-dependent multiscale, and mutiplex networks. Science. 2010:328. doi: 10.1126/science.1184819. [DOI] [PubMed] [Google Scholar]
- 8.Pollack CE, Weissman G, Bekelman J, Liao K, Armstrong K. Physician social networks and variation in prostate cancer treatment in three cities. Health Serv Res. 2012;47:380–403. doi: 10.1111/j.1475-6773.2011.01331.x. [DOI] [PMC free article] [PubMed] [Google Scholar]
- 9.Fisher ES, Staiger DO, Bynum JPW, Gottlieb DJ. Creating Accountable Care Organizations: The extended hospital medical staff. Health Aff. 2006;26:w44–w57. doi: 10.1377/hlthaff.26.1.w44. [DOI] [PMC free article] [PubMed] [Google Scholar]
- 10.Barnett ML, Landon BE, O’Malley AJ, Keating NL, Christakis NA. Mapping physician networks with self-reported and administrative data. Health Serv Res. 2011 doi: 10.1111/j.1475-6773.2011.01262.x. Published online before print. [DOI] [PMC free article] [PubMed] [Google Scholar]
- 11.Newman ME. Fast algorithm for detecting community structure in networks. Phys Rev E Stat Nonlin Soft Matter Phys. 2004;69:066133. doi: 10.1103/PhysRevE.69.066133. [DOI] [PubMed] [Google Scholar]
- 12.Newman ME, Girvan M. Finding and evaluating community structure in networks. Physical Review E. 2004;69:026113. doi: 10.1103/PhysRevE.69.026113. [DOI] [PubMed] [Google Scholar]
- 13.Dartmouth Medical School Center for the Evaluative Clinical Sciences. Dartmouth Atlas of Health Care. American Hospital Publishing, Inc; 1998. [PubMed] [Google Scholar]
- 14.Centers for Medicare and Medicaid Services DoHaHS, editor. Federal Register. 2011. Medicare Program; Medicare Shared Savings Program: Accountable Care Organizations; Final Rule; pp. 67802–990. [PubMed] [Google Scholar]
- 15.Bynum JP, Bernal-Delgado E, Gottlieb D, Fisher ES. Assigning Ambulatory Patients and their Physicians to Hospitals: A Method for Obtaining Population-Based Provider Performance Measurements. Health Serv Res. 2007;42:45–62. doi: 10.1111/j.1475-6773.2006.00633.x. [DOI] [PMC free article] [PubMed] [Google Scholar]
- 16.SAS. [Accessed 7/12/11, 2011];2011 at http://www.sas.com/
- 17.Fruchterman TMJ, Reingold EM. Graph drawing by force-directed placement. Software-Practice and Experience. 1991;21:1129–64. [Google Scholar]
- 18.Kaiser Family Foundation. Medicare Advantage Fact Sheet. 2010. [Google Scholar]
Associated Data
This section collects any data citations, data availability statements, or supplementary materials included in this article.