

Abstract
Abuse of prescription opioids is a growing problem. The number of methadone pain pills distributed now exceeds liquid methadone used in opioid treatment, and the increases in buprenorphine indicators provide evidence of the need to monitor and intervene to decrease the abuse of this drug. The need for additional and improved data to track trends is discussed, along with findings as to the characteristics of the users and combinations of drugs. Data on toxicities related to methadone or buprenorphine, particularly in combination with other prescribed drugs, are presented and clinical implications and considerations are offered. These findings underscore the need for physicians to be aware of potential toxicities and to educate their patients regarding these issues.
INTRODUCTION
Abuse of prescription opioids, pain medications, is a growing problem.1–3 The number of Drug Abuse Warning Network (DAWN) emergency department visits for opiates/opioids increased by 81% between 2004 and 2007,4 and the increase is seen in both those opiate drugs that have been on the market for many years and in the newer drugs. DAWN emergency department cases with a mention of hydrocodone singly or in combinations increased from 80,291 in 2004 to 153,456 in 2007 and methadone increased from 48,864 to 69,506. In comparison, buprenorphine and its combinations increased from 1,001 to 10,229 cases. This paper uses publicly available data to examine trends in the use of methadone and buprenorphine in the United States, the characteristics of the users, the formulations of the substances, and their use in combination with other drugs.
Understanding the reasons underlying increases in the use of opioid medications can be complicated. There has been little research on the factors involved in these adverse events, such as the formulation of the opioid drug (liquid, single ingredient or in combination), case type (suicide, adverse reaction, etc.), underlying physical and mental condition of the affected individual, combinations of drugs involved (including serum levels and toxicology reports), dosing instructions given to the patient, source of the drug, reasons for use, and ease of access to nonprescribed pharmaceutical drugs through illegal methods. Many of the new drugs fall into International Classification of Diseases-10 (ICD-10)5 categories such as “Other Synthetic Narcotics,” “Other Opioids,” and “Other and Unspecified Narcotics,” which currently do not provide data on a specific drug. Thus, for this paper, a number of different data sources have been accessed to try to understand this growing trend.
Buprenorphine was first marketed in the United States in 1985 as a Schedule V narcotic analgesic. Until 2002, it was only available as a low-dose (0.3 mg/ml) injectable formulation under the brand name Buprenex®. In October 2002, the Food and Drug Administration (FDA) approved two buprenorphine products (Suboxone® and Subutex®) for the treatment of narcotic addiction. Both products are high dose (2 mg and 8 mg) sublingual tablets. Subutex® is a single entity buprenorphine product and Suboxone® is a combination product with buprenorphine and naloxone in a 4:1 ratio, respectively. Buprenorphine has been classified as a Schedule III drug.
Methadone, a pharmaceutical opioid used in the treatment of opioid dependence since 1964, is currently marketed as oral concentrate (10 mg/ml), oral solution (5 and 10 mg/5 ml), tablet (5, 10, and 40 mg), injectable (10 mg/ml), and powder (50, 100, and 500 mg/bottle for prescription compounding). As of January 1, 2008, the 40 mg dispersible tablets (diskettes) are no longer approved by the FDA for use in the management of pain. Methadone is a Schedule II drug.
METHODOLOGY
Data from surveys, prescriptions, poison control centers, emergency room visits, treatment admissions, deaths, retail shipments, and toxicology laboratory data were retrieved from online sources, special data runs by the agencies collecting the data, and from agency publications. Very few of the datasets could report whether or not the affected individuals had taken drugs prescribed for them. Texas data were provided by the Department of State Health Services and analysis was by the author. The U.S. treatment data as collected in the Treatment Episode Data Set (TEDS) was available online and chi-square statistics were calculated using the statistical programs included in the Substance Abuse and Mental Health Data Archive.6 The DAWN and the Researched Abuse, Diversion and Addiction-Related Surveillance (RADARS®) were the only datasets available for this paper that reported whether or not the cases involved adverse reactions to the medicine prescribed for the individual. In addition, the DAWN tables provided to the author by the Substance Abuse and Mental Health Services Administration (SAMHSA) included measures of significant changes over time.
SURVEY DATA
The National Survey on Drug Use and Health (NS-DUH) is conducted by the Office of Applied Studies of SAMHSA. It collects information on the prevalence, patterns, and consequences of alcohol, tobacco, and illegal drug use and abuse in the U.S. civilian noninstitutionalized population, ages 12 and older. In 2008, a total of 68,736 individuals were sampled in this survey, which is representative of the U.S. general population.
The number of Americans who used pain relievers non-medically in their lifetimes increased from 29.6 million in 2002 to 34.9 million in 2008. Some 928,000 of these individuals reported lifetime use of methadone in 2002, compared to 1.8 million in 2008. The prevalence of lifetime use of methadone in 2007 was 0.5% for those in age group 12–17 years, 2.0% for those in age group 18–25 years, and 0.5% for 26 and older.7–10 The survey did not query for use of buprenorphine.
PRESCRIPTIONS WRITTEN
SDI Vector® reported that the total number of prescriptions filled at retail outlets for methadone increased from 863,039 in 2000 to 4,439,850 in 2008. The largest increase was in prescriptions for the 10 mg tablet, which comprised 75% of the oral solid dose prescriptions in 2000 but increased to 85% of the doses in 2008. The number of prescriptions for Suboxone® increased from 225,014 in 2004 to 3,154,795 in 2008 and the number of prescriptions for Subutex® increased from 42,211 to 263,878 in the same time period. By 2008, the 8/2 mg formulation comprised 85% of the Suboxone® prescriptions and the 8 mg formulation comprised 71% of the Subutex® prescriptions.11
POISON CONTROL CENTER CALLS FOR HUMAN EXPOSURE TO DRUGS
The National Poison Data System of the American Association of Poison Control Centers reported the number of human exposure calls made about buprenorphine and methadone to all poison control centers across the nation (Table 1).
TABLE 1.
Methadone and buprenorphine calls to the U.S. poison control centers: 2000–2008
| All methadone exposures | Methadone deaths | All buprenorphine exposures | Buprenorphine deaths | |
|---|---|---|---|---|
| 2000 | 1,387 | 26 | 13 | 0 |
| 2001 | 1,914 | 35 | 21 | 0 |
| 2002 | 2,696 | 58 | 29 | 0 |
| 2003 | 3,126 | 44 | 104 | 0 |
| 2004 | 3,885 | 75 | 318 | 2 |
| 2005 | 4,256 | 84 | 580 | 1 |
| 2006 | 4,555 | 108 | 909 | 3 |
| 2007 | 5,025 | 121 | 1,590 | 1 |
| 2008 | 4,765 | 103 | 2,607 | 2 |
Source: National Poison Data System, American Association of Poison Control Centers.
RADARS® collects data on acute and chronic exposures from 47 of 60 U.S. poison centers. Table 2 shows the combinations of drugs in the calls to RADARS® in 2008 that mentioned human exposure to methadone or buprenorphine12 as well as the combination of calls to Texas poison control centers that reported human exposure to these two drugs. The drugs in Table 2 are listed as they were reported by the various datasets.
TABLE 2.
Other drugs mentioned in combination with methadone or buprenorphine in public datasets*
| METHADONE
| |||||
|---|---|---|---|---|---|
| RADARS PCC-2008 | TEXAS PCC-2008 | DAWN ED-2007 | NCHS DEATHS-2005 | RADARS DEATHS (2003–2008) |
TEXAS DEATHS-2007 |
| methadone only (49%) alcohol (3%)† |
methadone only (55%) other benzodiazepines (12%) |
methadone only (38%) alcohol (3%) |
methadone only (31%) benzodiazepines (4%) |
methadone only (33%) alcohol (7%)† |
methadone only (31%) alprazolam (19%) |
| amitriptyline | alprazolam (7%) | alprazolam (2%) | benzodiazepines + other drugs (4%) |
amitriptyline (8%)† | carisoprodol (6%) |
| amphetamine | carisoprodol (2%) | carisoprodol | cocaine (13%) | atypical antipsychotics (9%)† |
cocaine (14%) |
| anticonvulsants (2%)† | clonazepam (3%) | clonazepam | other opiates (3%) | benzodiazepines (52%)† | hydrocodone (15%) |
| antihistamines | cocaine | cocaine (2%) | cocaine (7%)† | other benzodiazepines (17%) |
|
| atypical antipsychotics (2%) |
diazepam (1%) | duloxetine | hydrocodone (7%)† | quetiapine (2%) | |
| beta blockers | heroin | fluoxetine | other anticonvulsant (7%)† |
||
| carisoprodol (2%)† | hydrocodone (5%) | heroin (3%) | other narcotic (8%)† |
||
| cocaine (2%)† | marijuana | hydrocodone | SSRIs (8%)† | ||
| cyclobenzaprine | MDMA | marijuana | |||
| heroin | morphine (2%) | MDMA (ecstasy) | |||
| hydrocodone (3%)† | olanzapine | methamphetamine | |||
| marijuana | oxycodone | morphine | |||
| morphine | PCP | narcotic analgesics | |||
| other muscle relaxants |
pregabalin (2%) | olanzapine | |||
| other antidepressants (1%)† |
promethazine | oxycodone (2%) | |||
| other narcotics (3%)† |
quetiapine (2%) | quetiapine | |||
| other sedative/ hypnotics |
trazodone | unspecified benzodiazepines |
|||
| oxycodone (3%)†
SSRIs (1%)† trazodone |
zolpidem | zolpidem | |||
| BUPRENORPHINE
| |||
|---|---|---|---|
| RADARS® PCC-2008 | TEXAS PCC-2008 | DAWN ED-2007 Buprenorphine + Naloxone |
DAWN ED-2007 Buprenorphine Only |
| buprenorphine only (59%) |
buprenorphine only (68%) |
buprenorphine + naloxone only (40%) |
alcohol |
| alcohol (2%)† | other benzodiazepines (24%) |
alcohol | alprazolam |
| acetaminophen | alprazolam (3%) | alprazolam | citalopram |
| amphetamines | carisoprodol (3%) | buproprion | clonidine |
| antianxiolytics/ antipsychotics |
diazepam (3%) | carisoprodol | cocaine |
| anticonvulsants (2%)† | escitalopram | clonazepam | dextromethorphan + guaifenesin |
| antidepressants (1%)† | hydrocodone | clonidine | heroin |
| antihistamine | methadone | cocaine | hydrocodone |
| atypical antipsychotics (2%)† |
quetiapine (1%) | cyclobenzaprine | marijuana |
| benzodiazepines (7%)† | trazadone (3%) | fentanyl | methadone |
| carisoprodol | heroin (6%) | morphine | |
| clonidine | hydrocodone | olazapine | |
| cocaine (1%)† | hydromorphone | other benzodiazepines | |
| heroin | lithium | other narcotics | |
| hydrocodone (2%)† | lorazepam | oxycodone | |
| marijuana | marijuana | quetiapine | |
| methadone (3%)† | methadone | tramadol | |
| methylphenidate | modafinil | ziprasidone | |
| other muscle r elaxants |
other benzodiazepines | ||
| other/unknown narcotics (63%)† |
oxycodone | ||
| other prescription or otc |
paroxetine | ||
| oxycodone (1%)† | quetiapine | ||
| SSRIs (1%)† | risperidone | ||
| tramadol | sertaline | ||
| trazodone | trazadone zolpidem |
||
Includes drug with or without acetaminophen. Drugs are listed using the terminology from each dataset. Those without percentage normally compose less than 1% of the drugs examined except for DAWN, where suppression rules prevented reporting actual percentages.
More than two substances may be involved; percentages may not equal 100%.
The number of calls to the Texas centers mentioning buprenorphine increased from 18 in 1998 to 121 in 2008. Of the 2008 buprenorphine calls, 95% involved Suboxone®, 2% involved Subutex®, and 4% involved Buprenex®.13 From 1998 to 2008, the number of calls about 5 and 10 mg methadone tablets increased from 29 to 870, while the number of calls involving 40 mg diskettes increased from 1 to 61 and the number involving liquid increased from 5 to 11. The number of calls reporting an “unknown” methadone formulation increased from 51 to 227 in this time frame.
Of the 2008 human exposure calls to the Texas poison centers, 52% of the buprenorphine cases and 43% of the methadone cases were in females. The average age of those exposed to buprenorphine was 34.9 years and for calls involving methadone, 35.9 years.
EMERGENCY ROOM CASES
DAWN ED, which is conducted by SAMHSA, collects data on drug-related visits to a sample of the nation’s emergency departments (EDs) and estimates the number of drug-related ED visits for the United States. In 2007, there were an estimated 3,998,228 drug-related ED visits, and 483,612 involved narcotic analgesics. Between 2004 and 2007, the number of visits involving a mention of methadone increased from 48,864 to 69,506 (p = .05), while the number of visits involving buprenorphine alone or in combination with naloxone increased from 1,001 to 10,229 (p = .002).14 There were 214,432 heroin cases in 2000 and 188,162 in 2007, a nonsignificant decrease.
In 2007, 43% of the methadone visit patients were females, 74% of visits were by Whites, while 9% were by Blacks, and 6% were by Hispanics. Some 47% of the buprenorphine visits involved females and 87% of visits were by Whites; the proportions that were Black or His-panic were not estimated because of the DAWN suppression rules regarding small numbers of cases or Relative Standard Errors. For both substances, the highest rates of visits were for those with age of 21–24 years, but overall, the methadone patients were older, with higher rates continuing through ages 45–54 before declining (Fig. 1).
FIGURE 1.
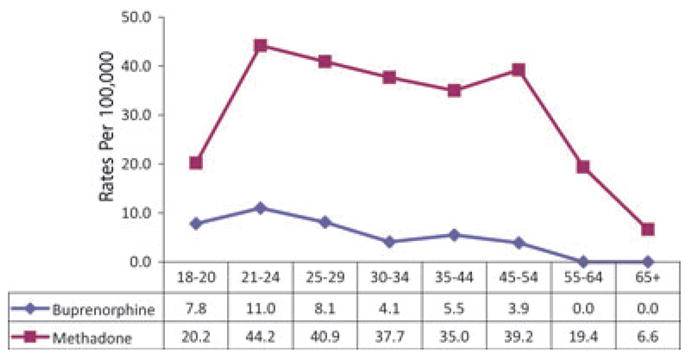
Age groups of buprenorphine and methadone ED visits: DAWN 2007.
In terms of case type, 78% of the methadone visits involved nonmedical use, which includes misuse or abuse, taking a higher than prescribed or recommended dose of a pharmaceutical, taking a pharmaceutical prescribed for another individual, malicious poisoning of the patient by another individual, and documented substance abuse involving pharmaceuticals. Ten percent of the methadone visits were seeking detoxification, 7% had an adverse reaction in which the patient took his or her own medication as prescribed but had a reaction or side effect, and 5% involved a suicide attempt. For buprenorphine cases (buprenorphine alone or in combination with naloxone), 70% involved nonmedical use and 16% involved adverse reactions.15
The drugs most often mentioned in combination with methadone or buprenorphine are listed in Table 2, and between 2004 and 2007, significant increases were noted in visits involving methadone in combination with other pharmaceutical drugs (83% increase) and visits involving a combination of methadone, alcohol, illicit drugs, and other pharmaceuticals (233% increase) (Table 3).
TABLE 3.
DAWN ED cases involving methadone and combinations*
| 2004 | 2005 | 2006 | 2007 | p value change 2004–2007 | |
|---|---|---|---|---|---|
| Methadone only | 20,025 | 19,286 | 22,750 | 26,138 | 0.274 |
| Methadone + alcohol only | 2,600 | 1,667 | 1,823 | 2,068 | 0.433 |
| Methadone + other pharmaceuticals only | 10,878 | 14,477 | 17,018 | 19,891 | 0.002 |
| Methadone + illicits only | 6,449 | 6,359 | 6,233 | 5,956 | 0.494 |
| Methadone + other pharms + illicits only | 5,057 | 7,178 | 7,018 | 7,138 | 0.353 |
| Methadone + alcohol + other pharms only | 1,764 | 2,165 | 2,213 | 3,096 | 0.166 |
| Methadone + alcohol + illicits only | 1,072 | 1,208 | 1,979 | 1,820 | 0.238 |
| Methadone + alcohol + illicits + other pharmaceuticals | 1,019 | 1,085 | 1,146 | 3,398 | 0.044 |
Because of weighting and Relative Standard Errors, apparent increases in other types of combinations were not statistically significant.
TREATMENT
TEDS is SAMHSA’s data system that collects information on admissions to facilities that are licensed or certified by the State substance abuse agencies. Depending on the State’s reporting requirements, private and for-profit facilities that do not receive federal or state money may or may not be included. Buprenorphine is one of the drugs included in the “other opiate” category, but it cannot be specifically identified in TEDS.
From 1992 to 2007, the number of persons who were admitted to treatment programs across the United States with a primary problem with opiates other than heroin or methadone increased from 12,357 (0.8% of all admissions in 1992) to 85,422 (4.7% in 2007) (Fig. 2). The number of persons with a primary problem with heroin increased from 168,321 (10.9% of all admissions) in 1992 to 246,871 (13.6%) in 2007, while the number of admissions for illegal or street methadone increased from 1,198 (0.1% of all admissions) in 1992 to 5,094 (0.3%) in 2007.16,17
FIGURE 2.

U.S. treatment admissions by primary substance: TEDS 1992–2007.
In comparison to individuals entering treatment dependent on heroin, individuals with a primary problem with other opiates or street methadone were less likely to be male or persons of color (Table 4). They were younger, less likely to report currently injecting drugs, more likely to be first admissions, were better educated, were more likely to be employed, more likely to enter drug treatment with other psychiatric problems, and more likely to have begun their opiate use later.
TABLE 4.
Characteristics of the U.S. clients entering treatment as reported on TEDS: 2007*
| Heroin | Illicit methadone | Other opiates* | |
|---|---|---|---|
| n | 246,871 | 5,094 | 85,422 |
| Percentage male | 69 | 53 | 54 |
| Percentage White | 52 | 85 | 89 |
| Percentage Black | 22 | 6 | 4 |
| Percentage Hispanic | 23 | 7 | 4 |
| Percentage entering treatment at age 35+ | 55 | 40 | 36 |
| Percentage began use at age 18–20 | 24 | 17 | 20 |
| Percentage use daily | 71 | 67 | 62 |
| Percentage reporting current IV use | 64 | 15 | 14 |
| Percentage first admissions | 23 | 39 | 43 |
| Percentage referred by criminal justice | 12 | 15 | 16 |
| Percentage self-referred | 64 | 50 | 51 |
| Percentage homeless | 19 | 6 | 6 |
| Percentage employed | 16 | 27 | 29 |
| Percentage < GED or year 12 completed | 63 | 67 | 75 |
| Percentage with psychiatric problem | 37 | 33 | 25 |
| Percentage with no health insurance† | 55 | 60 | 55 |
Includes codeine, hydrocodone, hydromorphone, meperidine, morphine, opium, oxycodone, pentazocine, propoxyphene, tramadol, and other drugs with morphine-like effects. Nonprescription methadone excluded.
Health insurance included private, medicaid, medicare/tricare.
TEDS data run 16 April, 2009.
Yet there have been some important shifts in the characteristics of these populations, with the proportion of male clients with a problem with illicit methadone decreasing from 63% in 1992 to 53% in 2007 and the proportion of male heroin clients increasing from 66% to 69%. The proportion of White illicit methadone clients increased from 67% to 85%, the proportion of White other opiate clients increased from 85% to 89%, and the proportion of White heroin clients increased from 46% to 52% between 1992 and 2007. Injection as the current route of administration has decreased: the proportions who reported injecting their primary, secondary, or tertiary drug at admission dropped between 1992 and 2007 from 74% to 64% for heroin clients, from 33% to 15% for illicit methadone clients, and from 32% to 14% for other opiates. All changes were significant at p < .0001.
The 2007 treatment clients reported very different patterns in terms of their second problem drugs (Table 5). For those with a primary problem with heroin, cocaine/crack was the second most common drug problem, while for those with a primary problem of nonprescription methadone, other opiates were the second problem drugs. Those with primary problems with other opiates were more likely to report no other drug problem or to report problems with alcohol, cocaine/crack, or marijuana.18
TABLE 5.
Second problem drug for clients entering treatment with a primary problem with heroin, nonprescription methadone, or other opiates: TEDS 2007
| Heroin | Non-Rx methadone | Other opiates | |
|---|---|---|---|
| None (%) | 29.4 | 22.7 | 31.1 |
| Alcohol (%) | 12.7 | 7.9 | 15 |
| Cocaine/Crack (%) | 35.9 | 7.9 | 15 |
| Marijuana (%) | 7.6 | 9.4 | 14.7 |
| Heroin (%) | 0 | 10.5 | 6.4 |
| Non Rx-methadone (%) | 0.9 | 0.1 | 1.9 |
| Other opiates (%) | 6.6 | 26.6 | 3.3 |
| “Downers”* (%) | 3.5 | 10.3 | 11.0 |
| Other drugs (%) | 3.4 | 4.6 | 1.6 |
“Downer” includes benzodiazepines, other tranquilizers, barbiturates, other sedatives/hypnotics.
Data run 16 April, 2009.
SAMHSA’s 2007 National Survey of Substance Abuse Treatment Services (N-SSATS), an annual census of 14,359 facilities providing substance abuse treatment, reported that 23% of all clients in treatment were receiving buprenor-phine or methadone, with 3,032 (1%) receiving buprenor-phine and 262,684 (99%) receiving methadone.19 N-SSATS does not survey those physicians who might be prescribing buprenorphine for opioid dependence in their private practices.
The rates for receiving methadone or buprenorphine treatment were higher in the northeast census region and lowest in the midwest (Table 6).
TABLE 6.
Indicators of presence of buprenorphine and methadone in selected data sets: 2007 and 2008
| NFLIS–% of all cases examined: 2008 | N-SSATS clients/100,000: 2007 | ARCOS dosage units/100,000: 2008 | |
|---|---|---|---|
| Buprenorphine | Buprenorphine | Buprenorphine | |
| Midwest | 0.6 | 0.7 | 3553.0 |
| Northeast | 3.6 | 1.3 | 6057.0 |
| South | 1.6 | 1.2 | 5597.0 |
| West | 0.5 | 1.1 | 5312.0 |
| Methadone | Methadone | Methadone | |
| Midwest | 1.9 | 59.4 | 3575.0 |
| Northeast | 2.7 | 170.4 | 7061.0 |
| South | 3.8 | 80.5 | 5337.0 |
| West | 2.0 | 80.3 | 5573.0 |
DEATHS
Death data from the National Center for Health Statistics (NCHS) are classified according to the ICD-10 codes, which group drugs together into nonspecific codes that may not identify the drugs separately. “Methadone” has its own classification, but “Other Opioids” include morphine, oxycodone, hydrocodone, codeine, and percodan, as well as other opioid formulations. “Other Synthetic Narcotics” include buprenorphine, fentanyl, meperidine, and propoxyphene, and “Other and Unspecified Narcotics” includes narcotics and opiates not otherwise categorized. Thus, it is not currently possible to identify buprenor-phine deaths from other deaths in the “Other Synthetic Narcotics” category.
Of the illicit substances in poisoning deaths across the United States, cocaine is the drug most likely to be mentioned, followed by “other opioids” (Fig. 3). Between 1999 and 2006, cocaine deaths increased from 3,832 to 7,475, other opioid deaths increased from 2,757 to 7,035, methadone deaths increased from 786 to 5,416, and heroin deaths increased from 1,964 to 2,090.20 Table 2 shows the combinations of drugs reported nationally by NCHS in deaths mentioning methadone.
FIGURE 3.

U.S. narcotic substances mentioned in poisoning deaths: NCHS 1999–2006.
Source: Warner et al., Methadone Deaths, 1999–2005, Findings from the National Vital Statistics, PowerPoint presentation.
Of the poisoning deaths with a mention of methadone by age group in 2005, 13% were ages 15–24 years, 22% were ages 25–34 years, 27% were ages 35–44 years, 29% were ages 45–54, 7% were ages 55–64 years, and 1% was 65 and older. The death rate in 2004–2005 for males was higher than for females, with the highest rate (5.8) for males at age 41 and the highest rate for females (3.9) at age 43.21
The National Poison Data System of the American Association of Poison Control Centers reports the outcomes of calls concerning human exposure to buprenorphine or methadone. Table 1 shows that the number of methadone exposures known to have resulted in a death increased from 26 in 2000 to 103 in 2008, while the number of known buprenorphine deaths increased from 0 in 2000 to 2 in 2008. It should be noted that the deaths reported by the poison centers are only a small portion of all the deaths, as the centers only report deaths that were followed up after a call to the center. Hence, if the center does not get a call, it will not know about a death.
Of the 213 methadone deaths reported to RADARS® from 2003 through 2008, 8% were ages 13–19, 29% were in their twenties, 17% were in their thirties, 25% were in their forties, and 14% were aged 50 and older. The source of the drug was unknown in 75% of the cases, with 16% being the decedent’s own medication, 8% from family member or friend, 2% bought on the street, and 0.5% stolen. Of the formulations involved in the deaths, 72% were unknown, 24% were tablets, 3% were liquid, and 0.5% were diskettes. The exposure reasons were unknown for 57% of the deaths, with abuse/misuse as the reason in 32%, suicide as the motive in 10%, and therapeutic error as the reason in 2% of the deaths.22 Table 2 shows the combinations of drugs involved with methadone as reported by the poison centers.
Of the 2007 Texas deaths with a mention of methadone, 34% were female, 73% were White, 5% were Black, and 22% were Hispanic. Average age was 39 years, with 7% being age 19 and younger, 21% in their twenties, 18% in the thirties, 30% in their forties, and 25% age 50 and older. The 2007 methadone deaths reported by Texas poison control centers and those 2005 poisoning deaths with methadone as reported by NCHS were older than those reported by RADARS®.
The number of overdose deaths of clients in Texas narcotic treatment programs has remained fairly level over time (Fig. 4), although the proportion of these overdose deaths has decreased from 20% of all methadone deaths in 2000 to 6% in 2007.23 In most cases, the toxicological findings on these methadone treatment clients did not indicate if the methadone serum concentrations were within the therapeutic range.
FIGURE 4.
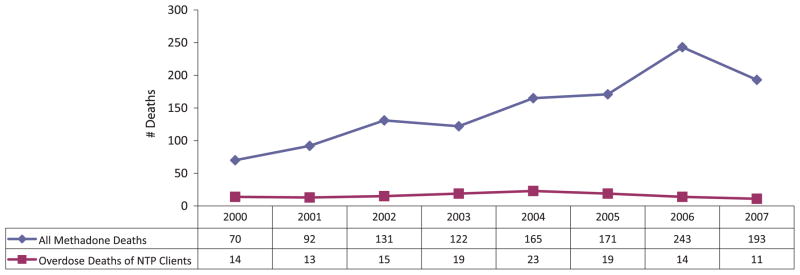
Texas deaths with a mention of methadone: 2000–2007.
The combinations of drugs being used with methadone are changing. The proportion of Texas deaths involving combinations with prescription or licit drugs (which may or may not have been prescribed for the individual) increased from 17% in 1992 to 46% in 2007, while combinations involving illicit drugs such as cocaine decreased from 25% to 15%.
TOXICOLOGY FINDINGS
The National Forensic Laboratory Information System (NFLIS), sponsored by the Drug Enforcement Administration (DEA), is a program that collects results from toxicological analyses conducted by state and local forensic laboratories on substances seized in law enforcement operations. As of September 2008, 47 state forensic laboratory systems and 94 local or municipal forensic laboratories representing a total of 259 individual labs, were participating in NFLIS. Delaware, New Hampshire, Rhode Island, and Vermont did not report to NFLIS in 2008.
NFLIS is an important indicator of the availability of different drugs on the street as measured by the proportion of items examined (Fig. 5). In 2000, of the 667,501 items examined, 503 were methadone. In 2008, of the 1,393,621 items examined, 7,525 were methadone. There were 15 buprenorphine items examined in 2000 as compared to 4,034 in 2008.24
FIGURE 5.

Buprenorphine and methadone items as proportion of all NFLIS items submitted to federal, state, and local laboratories: 2000–2008.
NFLIS shows different geographic patterns of drugs identified by census region (Table 6). As with the other indicators, buprenorphine was more often identified in the northeast, while methadone was more often identified in the south. It should be noted that the rates for the northeast may be even higher since three of the four states that did not report to NFLIS are in that region.
DISTRIBUTION OF PRESCRIPTION DRUGS
DEA’s Automation of Reports and Consolidated Orders System (ARCOS) reports sales of prescription drugs, and it provides evidence of the increases in sales of methadone and buprenorphine. Since 2000, the distribution of methadone reflects the increased use of 5 and 10 mg methadone tablets for analgesia (Fig. 6). In 2008, for the first time, more grams of the 5 mg and 10 mg tablets were distributed than liquid methadone and the drop in 40 mg units reflects the limitation on their distribution as of January 2008. In 2008, 90% of the 5 and 10 mg tablets were purchased by pharmacies and 97% of the liquid methadone was purchased by narcotic treatment programs.25
FIGURE 6.

Distribution of methadone in the United States by formulation: ARCOS 2000–2008.
The increase in the use of buprenorphine since its approval for use in the treatment of opioid dependence is shown in Figure 7. ARCOS is the one source that provides information about the use of buprenorphine as distributed to both narcotic treatment programs and private physicians prescribing the drug for narcotic treatment or treatment of pain. Ninety-four percent of the Suboxone® and Subutex® tablets were distributed through pharmacies; only 1% was distributed to narcotic treatment programs in 2008.
FIGURE 7.
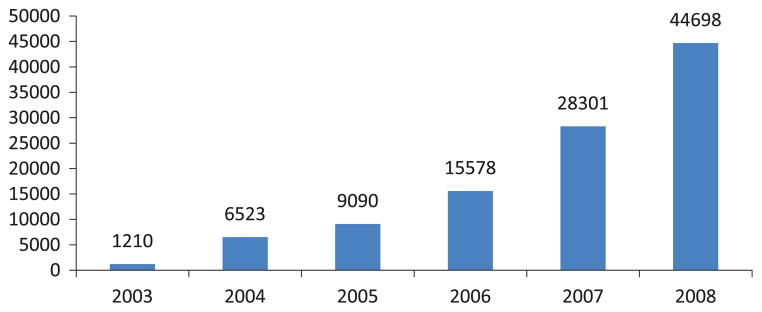
Dosage units of buprenorphine per 100,000 population: ARCOS 2003–2008.
More doses of methadone and buprenorphine were sold in the northeast census region with the lowest amounts in the midwest (Table 6).
DISCUSSION
This paper has reviewed publicly available data relating to use, abuse, misuse, and distribution of methadone and buprenorphine. These individual data sets are constrained by significant limitations. Data are neither available on buprenorphine admissions to treatment nor on deaths involving the drug. Information is inconsistent on formulation of the drugs used, sources of the drugs, age groups of users, available years of data (2006 vs. 2008), whether the drugs were prescribed for the individual, and the frequency of combinations of these two drugs with other drugs. Yet, when these pieces of information are drawn together, a clearer picture emerges.
Between 2000 and 2008, the number of methadone tablets (5, 10, and 40 mg) sold through retail outlets increased from 110,670,209 to 728,344,627, the number of human exposure calls to poison control centers increased from 1,387 to 4,765, the number of methadone items identified by NFLIS laboratories increased from 503 to 7,525, and grams of methadone shipped as reported to ARCOS increased from 1,826 to 5,283. The number of methadone cases seen in DAWN emergency rooms increased from 48,864 to 69,506 between 2004 and 2007, and the number of deaths in NCHS with a mention of methadone increased from 786 to 5,416 between 1999 and 2006.
The proportional increases in buprenorphine indicators are much larger, but this is due to the fact the nonin-jectable formulation did not come to market until 2002. Between 2000 and 2008, the number of poison control center human exposure calls increased from 13 to 2,607, and between 2004 and 2008, the number of Suboxone® tablets sold at the retail level increased from 7,707,099 to 106,537,708, and the number of Subutex® tablets increased from 1,397,294 to 10,119,599. The number of NFLIS items identified as buprenorphine increased from 15 to 4,034 between 2000 and 2008 and the number of buprenorphine dosage units reported by ARCOS increased from 1,210 to 44,698 between 2003 and 2008. The number of DAWN ED cases increased from 1,001 to 10,229 between 2004 and 2007. These increases are indications of the exposures to and diversion of the drug since 70% of the DAWN cases were reported to be related to nonmedical use of the drug.
Depending on the data source, anywhere from 38% to 55% of the poison control center and DAWN ED methadone cases involved only methadone, as did 31–33% of the deaths involving methadone. However, these data indicate that the majority of these adverse events and deaths involved methadone in combination with other drugs. According to the Texas death data, combinations of methadone involving only illicit drugs are decreasing, while combinations involving prescription opioids (whether prescribed or not), are increasing.
The use of methadone for pain, as compared to treatment for opioid dependence, can be tracked through data reporting the formulation of the drug. According to the 2008 ARCOS data, distribution of the 5 mg and 10 mg methadone tablets has now surpassed distribution of the liquid used in narcotic treatment programs and Texas poison control center statistics confirm the increases in calls involving the tablets. Further, RADARS® data reported that formulation of methadone was unknown for 72% of deaths, but 24% of deaths could be attributed to methadone tablets and 3% of deaths were traced to methadone liquid. These data, when considered with the ARCOS data and Texas data, appear to point to the increasing role of methadone tablets used in the treatment of pain as a more prevalent source of methadone toxicity than methadone from narcotic treatment programs where the drug is dosed in a liquid form.
The data showed the methadone user was more likely to be male (depending on the dataset, between 53% and 67%), White (74% and 77%), with the highest prevalence of use among those of ages 21–24, according to NSDUH, DAWN, and NCHS. However, their use of methadone continued over the years with adverse events noted in Texas poison center calls at an average age of 36, the highest death rates in NCHS being 41 years for males and 43 years for females, and DAWN ED visits continuing at high levels through ages 45–54.
Buprenorphine numbers are scarcer due to ICD-10 coding. However, the rapid increases in buprenorphine as documented in the number of prescriptions written, poison center exposures, DAWN, NFLIS, and ARCOS provide evidence of the need to monitor the potential abuse of this drug. Buprenorphine cases are less likely to occur among males (47–53% females) and less likely to occur in persons of color (87% White in DAWN). The age group seen most often in DAWN data was 21–24 years and the average age for the Texas poison center calls was 35 years.
Buprenorphine is also a more difficult drug to track, since it can be prescribed for pain, for opioid treatment by office-based practitioners, as well as for use in opioid treatment programs. Thus, there is no reliable way to determine the level of buprenorphine distributed for pain as compared to office-based narcotic treatment, although ARCOS reported that only 1% of the buprenorphine tablets were distributed to narcotic treatment programs.
As of 2008, there is even less data on Subutex® in comparison to Suboxone®. Because of the small numbers of Subutex® cases, DAWN suppression rules limited analysis of the data and the numbers of different combinations could not be determined. The data do not tell us if Subutex® users differ in terms of sociodemographic characteristics. However, the increases in the number of Subutex® prescriptions should be recognized. The buprenorphine/naloxone combination tablet is recommended for use in the treatment of opioid addiction,26 with limited use for Subutex®, which is reserved for pregnant, opioid-dependent women. However, methadone is still considered the standard of care for the treatment of these women27 and the limited use for pregnant women seems unlikely to be the source of the large increase in Subutex® prescriptions. One possibility is that physicians are prescribing this formulation for the treatment of opioid dependence when patients complain that the combination tablet is not well-tolerated. Another possibility is that physicians prescribe Subutex® for treatment of pain (an indication that is not FDA-approved). The greater abuse liability for the buprenorphine-alone formulation is also confirmed by the data in this review and underscores the need for physicians to carefully consider appropriate use of buprenorphine-alone formulations, given the literature on injection of Subutex®.28–30
Additional data are needed on reasons for use of these two drugs. DAWN reported 7% of the methadone cases were adverse reactions to the patient’s own drugs and 16% of the buprenorphine cases also sought help for adverse reactions. The RADARS® data reported 16% of the methadone decedents took their own medications and therapeutic error was the exposure reason in 2% of the deaths. Determining the role of drugs taken by the patient as prescribed, compared to using nonprescribed drugs or drugs taken in a manner not prescribed, is a major concern. The fact that the number of overdose deaths of clients in Texas narcotic treatment programs remained stable while the total number of methadone deaths in the state increased is evidence that the problem with methadone-associated deaths is not related to diversion of methadone from narcotic treatment programs.
Analysis of the NFLIS, N-SSATS, and ARCOS data found that availability of the two drugs differed by census region, with more buprenorphine used in treatment, distributed, and found in toxicology examinations in the northeast. More methadone was examined in toxicology laboratories in the south, with more methadone used in treatment and distributed in the northeast. Because these three datasets can be specific as to location (ARCOS and N-SSATS are available at the zip code level), tracking “hot spots” where levels of distribution and seizures are high, but with no opioid treatment programs present to distribute methadone or buprenorphine can be a way to identify areas warranting additional attention by law enforcement and licensing boards for diversion or inappropriate prescribing.
Methadone and buprenorphine must also be considered in the context of heroin and other opiates. Heroin indicators including treatment admissions, DAWN ED visits, and NCHS death data have remained fairly constant over time while indicators for other opiates have increased. Since 1992, the gender and racial characteristics of the clients having problems with illicit methadone have changed so that by 2007, they more closely resembled other opiate clients. All treatment clients, whether heroin-addicted, illicit methadone-addicted, or other opiates-addicted had substantial rates of psychiatric illness (range: 25–37%) (Table 4).
In addition, the secondary-problem drugs are different in these groups. Some 31% of the individuals with a problem with other opiates reported no second problem, as did 29% of the heroin clients; but only 23% of those using illicit methadone reported no other drug problem. And there was variation in the secondary-problem drugs reported by those who did have problems (Table 5). Given the demographic similarities between the illicit methadone and other opiate clients, the perceptions among users about illicit methadone might be changing from use that had been primarily to prevent withdrawal from heroin to now using methadone to prevent withdrawal from other opiates. In brief, these data raise the question of whether methadone is now considered as just “another opiate” by users. It appears that two very different groups of opioid users (heroin vs. other opiates + nonprescribed methadone) are emerging as treatment seekers. Clinicians need to be aware of the different treatment needs in terms of use with different drug combinations, mental health treatment needs, and social support networks or lack thereof.
Another issue of significant concern in these data is the high rate of use of other drugs, both licit and illicit in combination with methadone and buprenorphine. DAWN ED cases show significant increases in cases involving methadone and other pharmaceuticals as well as methadone in combination with alcohol, other illicit drugs, and other pharmaceuticals (Table 3). Similarly, a myriad of other drugs in combination with methadone and with buprenorphine have been reported in data collected through RADARS®, NCHS, Texas deaths, DAWN ED, and the Texas poison centers (Table 2).
Consistently, co-occurring use of benzodiazepines, particularly alprazolam, has been reported in both methadone and buprenorphine DAWN ED, poison center, and death mentions (Table 2). These findings might be expected, given recent findings from the NSDUH, which show a significant increase (p = .05) in misuse of tranquilizers from 2002 to 2006.31 Further, the most commonly misused tranquilizers among lifetime nonmedical users were Valium® (diazepam), Xanax® (alprazolam), Ativan® (lorazepam), and Klonopin® (clonazepam), in that order.32 The rate of benzodiazepine use in the population of methadone- and buprenorphine-treated patients is high. Lifetime use of ben-zodiazepines in methadone-maintained patients has been reported to be as high as 94%.33 In addition, Iguchi and colleagues reported that diazepam, lorazepam, and alpra-zolam were frequently used by methadone clients for their “high” producing effects and for selling to produce income. They also reported that, in contrast, chlordiazepoxide and oxazepam had much lower ratings of “high” and were less likely to be obtained for getting “high” or for resale.33 Similar findings for buprenorphine with benzodiazepines have also been reported.34–36
Not all methadone- and buprenorphine-treated individuals seek benzodiazepines with the intent to abuse these drugs. Many of these patients experience significant anxiety, insomnia, and withdrawal symptoms that lead to requests for ancillary medications;37,38 benzodiazepines are often the drugs prescribed for these symptoms. One of the clinical dilemmas in treating such patients is the differentiation of true psychiatric disorders from drug-seeking behavior. However, with exceptions to be discussed below, a sound clinical approach to psychiatric complaints in this population is to monitor for a period of time rather than prescribing immediately; select nonbenzodiazepine interventions whenever possible (e.g., cognitive-behavioral therapy); and, if necessary, utilize certain of the selective serotonin reuptake inhibitors (below) for anxiety and depressive symptoms; address other co-occurring drug and alcohol abuse that may be contributing to the symptoms presented; and provide education on sleep hygiene.
Close monitoring of the use of benzodiazepines and use of long-acting medications such as clonazepam are preferred and must be undertaken if they are to be prescribed. These medications should be prescribed for a short (e.g., 2–4 months) period to prevent development of tolerance and dependence.39 Further, frequent re-assessment to determine positive benefit (e.g., increase in level of function) should be documented. If improvement does not occur, it should lead the clinician to question the benefit of the ben-zodiazepine treatment, given the risks that are apparent from the data in this paper.
Aside from misuse/abuse/overuse of these drugs with methadone and buprenorphine that can lead to toxicity, there are other important pharmacological reasons to expect that benzodiazepines in combination with opioids might produce adverse events and even deaths. Benzodi-azepines, like opioids, depress the central nervous system, albeit via different pharmacological mechanisms. One of many effects of the binding of an opioid agonist to the mu opioid receptor is sedation and altered mental status.40 Ben-zodiazepines produce similar effects, but via binding to the gamma-aminobutyric acid (GABA)-A receptor, producing increased chloride ion flow into the neuron and resulting in decreased membrane excitability.41 A combined pharmaco-dynamic effect of these drugs can be to depress the central nervous system to the point of toxicity. Indeed, what little information exists on pharmacokinetic interactions between methadone and benzodiazepines indicates little in the way of significant interactions.42 Pharmacokinetics studies between buprenorphine and benzodiazepines have not been reported to date, despite several reports of buprenorphine toxicity in humans co-abusing these drugs.43,44 The paucity of studies available in this area of research underscores the need for it to be undertaken.
Another area of concern identified from the data in this paper is the toxicity data related to methadone and buprenorphine in combination with licit medications likely prescribed for medical and psychiatric conditions. Of greatest concern is the consistent reporting of adverse events and deaths across data sets (Table 2), in which methadone or buprenorphine occur in combination with psychotrop-ics such as selective serotonin reuptake inhibitors (in particular, fluoxetine, paroxetine, fluvoxamine, sertraline, citalopram, and escitalopram). While these drugs are not known to produce mood-altering effects (e.g., “high,” sedation), they share a common property of inhibition of cytochrome (CYP)P450 2D6,45 an enzyme that plays a role in methadone metabolism.46,47 Further, norfluoxetine, a metabolite of fluoxetine, and fluvoxamine potently inhibit CYP P450 3A4, which is important to the metabolism of methadone and buprenorphine. CYP 450 2C19 is also important to the metabolism of buprenorphine and its function is inhibited by fluoxetine and fluvoxamine.48 Inhibition of the metabolism of long-acting opioids such as methadone and buprenorphine could lead to toxicity, which appears to be the case based on the data in this study. Clinicians need to be aware of the potential for such toxicities and judiciously prescribe these medications.
If an SSRI must be used in methadone-maintained patients, selecting those that do not affect both CYP 450 2D6 and 3A4 would be preferable (choices would include parox-etine, sertraline, and citalopram, escitalopram). If there is a clinical need for use of these medications in methadone-maintained patients, monitoring should be considered to include a baseline cardiogram with a repeated cardiogram after 2 weeks at a stable dose of antidepressant medication in order to follow the cardiac QT interval that can increase should methadone metabolism be inhibited, leading to greater exposure.49 Patients receiving these medications should also be monitored for any increased opioid effects that they may be experiencing. Evidence of toxicity should trigger re-evaluation and alteration of the treatment plan. Another consideration is the use of buprenor-phine in patients needing an opioid therapy, but who would also benefit from an SSRI treatment of a mental disorder due to its ceiling effect at which increasing exposure is not associated with increasing opioid effects.50 Further, buprenorphine metabolism is less likely to be affected by SSRIs that primarily effect CYP 450 2D6, but not CYP 450 3A4 (e.g., paroxetine, sertraline, citalopram, escitalopram).51
Other medications mentioned as being present in cases of toxicity or deaths related to methadone or buprenorphine use and that inhibit the function of CYP 2D6 include dulox-etine, clomipramine, doxepin, perphenazine, and hydrox-yzine. These medications are commonly used for treatment of psychiatric disorders including depression and anxiety as well as psychosis (perphenazine). Amitriptyline, frequently used for the treatment of depression as well as chronic pain, is mentioned in RADARS® data for methadone. This medication is not only itself sedating with potential for pharma-codynamic interactions with methadone and, potentially, buprenorphine, but it is an inhibitor of both CYP 450 3A4 and 2D6.52 Similarly, atypical antipsychotics, specifically quetiapine, olanzapine, and risperidone are mentioned in association with methadone and buprenorphine use. Que-tiapine has been reported to be abused by injection and nasal insufflation, particularly with cocaine in a combination referred to as a “Q-ball.”53 It is an inhibitor of CYP 450 2D6 and is an inhibitor of the efflux transporter p-glycoprotein.54 Quetiapine should not be considered a first-line treatment of anxiety or psychosis in methadone or buprenorphine-maintained patients. Interestingly, risperi-done and olanzepine do not inhibit metabolic enzymes related to methadone or buprenorphine metabolism, but have been cited in toxicity reports.55,56
It is beyond the scope of this paper to discuss the potential interactions of every drug mentioned in these adverse events related to methadone and buprenorphine use. However, it is useful for clinicians to be aware of the wide variety of substances that may be associated with toxicities in patients treated with these opioid therapies or who are abusing these medications. What are the implications? Do these data indicate that physicians should avoid the use of many psychotropic and analgesic drugs in patients with opioid dependence? We would suggest that this paper only provides information that a clinician can use in considering treatment plans. When possible, clinicians might want to avoid medications known to have the potential to produce pharmacokinetic or pharmacodynamic interactions in patients. Another possible consideration is to undertake a genetic test to determine the level of activity of a patient’s CYP2D6 enzyme, since there are well-documented genetic polymorphisms in this enzyme that include both rapid and poor metabolism of drugs.57
Clinicians should become accustomed to considering the possibility of drug interactions with medications they prescribe. These data underscore the need to educate patients about the potential for adverse drug interactions when these medications are used together—or when they are misused or abused together. Patients should ideally be receiving medications from one prescriber; when this is not possible, it is imperative that prescribing clinicians work together to avoid such toxicities. Patients must be educated about the need not to share medications and to use medications only as prescribed. Further, they must be told about possible side effects that should be reported to the treatment provider so that rapid intervention(s) can be made if needed. Patient treatment agreements outlining these parameters of treatment may be useful in this population.
This confusing picture underscores the need for significant improvement of the indicators, particularly as new abuse-resistant opioid drugs come to market. New drugs are being introduced, but they are placed in ICD-10 codes such as Other Synthetic Narcotics, which are nonspecific. However, since 2003, the narrative text on the death certificate (referred to as “death certificate literals”) has been retained by NCHS for analysis and work is underway to translate details on the death certificates into data that can expand the nonspecific ICD-10 code categories. In addition, some states with centralized medical examiner systems, such as New Mexico,58 Florida,59 and Utah,60 have information on the specific drugs and formulations, but they cannot be used to provide national information, since drugs and drug use patterns, particularly use of the opi-oids, vary across the states. The 2007 SAMHSA Methadone Mortality Meeting recommended that uniform nomenclature, case definitions, and standards for toxicological testing be used to encourage uniform reporting by medical examiners and coroners and to support analysis.61 This recommendation for standardization was expanded to include all the drug-related deaths in a SAMHSA Expert Panel meeting in August, 2009.
Improvement in the collection and reporting of indicator data is needed if FDA and the manufacturers are to meet the requirements of the Risk Evaluation and Mitigation Strategies (REMS).62 The key elements of the REMS will be education and certification for prescribers, pharmacists, other healthcare providers, or institutions that dispense or directly administer covered opioid products, as well as patient education. The REMS will also use metrics to assess the success of the REMS program in decreasing abuse and misuse of opioids while ensuring they remain available for patients who suffer daily from chronic pain. The available data systems discussed in this paper need to be fully supported and the data reported by manufacturers to FDA under REMS must be freely available to researchers and public health officials who must monitor the effects in their areas.
While improvements to data collection systems are essential to improving public health related to prescription opioid abuse, the data collected and presented in this paper make several important points. First, they underscore the rapid increases in prescribing of methadone and buprenor-phine, the substantial and sobering statistics showing large increases in toxicities and deaths related to misuse of these drugs, and the increases in narcotic trafficking with these medications. Second, the toxicities reported with these drugs in combination with other drugs, particularly other licit medications, underline the lack of understanding or consideration by physicians of the possible toxic effects related to drug interactions. While only a few of these data show which toxicities occurred in those prescribed these medications versus those who illicitly obtained and abused these drugs, it is still incumbent on physicians to be aware of potential toxicities and to educate their patients regarding these issues. The data in this manuscript may help to assist with that process.
Acknowledgments
Supported by grant K24 DA 023359 from the National Institute on Drug Abuse, Bethesda, Md (Dr. McCance-Katz).
Footnotes
Many individuals contributed to this paper, and we wish to acknowledge Elizabeth Crane and Rong Cai, DAWN; June Howard, ARCOS; Liqun L Wong, NFLIS; Elise Bailey, RADARS®; Mathias Forrester, Texas Poison Centers; An-nette Kowalski, DSHS; Li-Hui Chen and Margaret Warner, CDC, NCHSC; Kim France and Kevin Holman, Covidien; and Steven Marcus, New Jersey Poison Information & Education System.
Declaration of Interest
The authors report no conflict of interest. The authors alone are responsible for the content and writing of the paper.
References
- 1.Hall A, Logan J, Toblin R, et al. Patterns of abuse among unintentional pharmaceutical overdose fatalities. JAMA. 2008;300:2613–2620. doi: 10.1001/jama.2008.802. [DOI] [PubMed] [Google Scholar]
- 2.Paulozzi L, Budnitz D, Yongli X. Increasing deaths from opi-oid analgesics in the United States. Pharmacoepidemiol Drug Saf. 2006;15:618–627. doi: 10.1002/pds.1276. [DOI] [PubMed] [Google Scholar]
- 3.Fingerhut LA. Increases in methadone-related deaths: 1999–2004. National Center for Health Statistics; [Accessed March 19, 2009]. Available at: http://www2d.cdc.gov/ncidod/ts/print.asp. [Google Scholar]
- 4.U.S. Department of Health and Human Services, Substance Abuse and Mental Health Services Administration, Office of Applied Studies. Special data runs, Excel-All_sup_1created on April 23, 2009. [Google Scholar]
- 5. [Accessed March 31, 2009];International Statistical Classification of Diseases and Related Health Problems 10th Revision, Version for 2007. Available at: http://apps.who.int/classifications/apps/icd/icd10online/
- 6.U.S. Department of Health and Human Services, Substance Abuse and Mental Health Data Archive. [Accessed April 29, 2009]; Available at: http://www.icpsr.umich.edu/cocoon/SAMHDA/DAS3/00056.xml.
- 7.U.S. Department of Health and Human Services, Substance Abuse and Mental Health Services Administration. NHSDA Series H-22, DHHS Publication No SMA 03–3836. Office of Applied Studies; Rockville, MD: 2003. Results from the 2002 National Survey on Drug Use and Health: National Findings. Table 1.107 A & B. [Google Scholar]
- 8.U.S. Department of Health and Human Services, Substance Abuse and Mental Health Services Administration. NSDUH Series H-27, DHHS Publication No SMA 05–4061. Office of Applied Studies; Rockville, MD: 2005. Overview of Findings from the 2004 National Survey on Drug Use and Health. Tables 1.129 A and B. [Google Scholar]
- 9.U.S. Department of Health and Human Services, Substance Abuse and Mental Health Services Administration. NSDUH Series H-30, DHHS Publication No SMA 06–4194. Office of Applied Studies; Rockville, MD: 2006. Results from the 2005 National Survey on Drug Use and Health: National Findings. Table 1.28 A&B. [Google Scholar]
- 10.U.S. Department of Health and Human Services, Substance Abuse and Mental Health Services Administration, Office of Applied Studies. NSDUH Series H-36, DHHS Publication No SMA 09–4343. Rockville, MD: 2009. Results from the 2008 National Survey on Drug Use and Health: National Findings. Detailed tables 1.89 A&B. [Google Scholar]
- 11.SDI Vector data provided by Covidien, June 8, 2009.
- 12.RADARS. 2008 human exposure calls. data run April 10, 2009. [Google Scholar]
- 13.Texas Department of State Health Services, Texas Poison Center Network. special data run, April 3, 2009. [Google Scholar]
- 14.U.S. Department of Health and Human Services, Substance Abuse and Mental Health Services Administration, Office of Applied Studies. Special data runs, April 24, 2009. [Google Scholar]
- 15.U.S. Department of Health and Human Services, Substance Abuse and Mental Health Services Administration, Office of Applied Studies. Special data runs, May 5, 2009. [Google Scholar]
- 16.U.S. Department of Health and Human Services, Substance Abuse and Mental Health Services Administration, Office of Applied Studies. OAS Series #S-45, HHS Publication No (SMA) 09–4360. National Admissions to Substance Abuse Treatment Services; Rockville, MD: 2009. Treatment Episode Data Set (TEDS) Highlights—2007. [Google Scholar]
- 17.U.S. Department of Health and Human Services, Substance Abuse and Mental Health Services Administration, Office of Applied Studies. DASIS Series: S-29, DHHS Publication No (SMA) 05–4118. National Admissions to Substance Abuse Treatment Services; Rockville, MD: 2005. Treatment Episode Data Set (TEDS): 1993–2003. [Google Scholar]
- 18.U.S. Department of Health and Human Services, Substance Abuse and Mental Health Services Administration, Office of Applied Studies; ICPSR, editor. Original data prepared by Synec-tics for Management Decisions, Incorporated. Ann Arbor, MI: Inter-university Consortium for Political and Social Research [producer and distributor]; 2007. Treatment Episode Data Set (TEDS), 1992–2005. Concatenated data [Computer file] Data downloaded on April 15, 2008. [Google Scholar]
- 19.U.S. Department of Health and Human Services, Substance Abuse and Mental Health Services Administration, Office of Applied Studies. Data on Substance Abuse Treatment Facilities, DASIS Series: S-44, DHHS Publication No (SMA) 08–4348. Rockville, MD: 2008. National Survey of Substance Abuse Treatment Services (N-SSATS): 2007. [Google Scholar]
- 20.Warner M, Chen LH, Makuc DM. NCHS data brief, no 22. Hyattsville, MD: National Center for Health Statistics; 2009. Increase in fatal poisonings involving opioid analgesics in the United States, 1999–2006. [PubMed] [Google Scholar]
- 21.Warner M, Fingerhut L, Chen Li-H. Methadone deaths, 1999–2005, Findings from the National Vital Statistics System, National Center for Health Statistics. PowerPoint presentation dated; November 2008. [Google Scholar]
- 22.RADARS System Poison Center Methadone Mortality Data, April 14, 2009.
- 23.Maxwell J. Poster, Increases in Methadone-Related Adverse Events. Is it pills or liquid? American Conference on Pain Medicine; New York City. April 2008. [Google Scholar]
- 24.U.S. Department of Justice, Drug Enforcement Administration. NFLIS 25 Most Frequently Identified Substances. data downloaded May 15, 2009. [Google Scholar]
- 25.U.S. Department of Justice, Drug Enforcement Administration. Special data runs, April 29, 2009 and May 9, 2009. [Google Scholar]
- 26.McNicholas L. Clinical guidelines for the use of buprenorphine in the treatment of opioid addiction: A treatment improvement protocol (TIP 40) Rockville, MD: U.S. Department of Health and Human Services, Substance Abuse and Mental Health Services Administration, Center for Substance Abuse Treatment; 2004. [PubMed] [Google Scholar]
- 27.Jones H, Johnson R, Jasinski D, et al. Buprenorphine versus methadone in the treatment of pregnant opioid-dependent patients: Effects on the neonatal abstinence syndrome. Drug Alcohol Depend. 2005;79:1–10. doi: 10.1016/j.drugalcdep.2004.11.013. [DOI] [PubMed] [Google Scholar]
- 28.Alho H, Sinclair D, Vuori E, et al. Abuse liability of buprenorphine-naloxone tablets in untreated IV drug users. Drug Alcohol Depend. 2007;103:25–29. doi: 10.1016/j.drugalcdep.2006.09.012. [DOI] [PubMed] [Google Scholar]
- 29.Obadia Y, Perrin V, Feroni I, et al. Injecting misuse of buprenorphine among French drug users. Addiction. 2001;96:267–272. doi: 10.1046/j.1360-0443.2001.96226710.x. [DOI] [PubMed] [Google Scholar]
- 30.Sporer K. Buprenorphine: A primer for emergency physicians. Ann Emergency Med. 2004;43:580–584. doi: 10.1016/j.annemergmed.2003.11.006. [DOI] [PubMed] [Google Scholar]
- 31.United States Department of Health and Human Services. Substance Abuse and Mental Health Services Administration. Office of Applied Studies. National Survey on Drug Use and Health, 2006 [Computer file] ICPSR21240-v4. Ann Arbor, MI: Inter-university Consortium for Political and Social Research [distributor]; 2009–08–12. [DOI] [Google Scholar]
- 32.Colliver J, Kroutil L, Dai L, et al. DHHS Publication No SMA 06–4192, Analytic Series A-28. Rockville, MD: Substance Abuse and Mental Health Services Administration, Office of Applied Studies; 2006. Misuse of prescription drugs: Data from the 2002, 2003, and 2004 National Surveys on Drug Use and Health. [Google Scholar]
- 33.Iguchi M, Handelsman L, Bickel W, et al. Benzodiazepine and sedative use/abuse by methadone maintenance clients. Drug Alcohol Depend. 1993;32:257–266. doi: 10.1016/0376-8716(93)90090-d. [DOI] [PubMed] [Google Scholar]
- 34.Nielsen S, Dietz P, Lee N, et al. Concurrent buprenorphine and benzo-diazepines use and self-reported opioid toxicity in opioid substitution treatment. Addiction. 2007;102:616–622. doi: 10.1111/j.1360-0443.2006.01731.x. [DOI] [PubMed] [Google Scholar]
- 35.Thirion X, Lapierre V, Micallef J, et al. Buprenorphine prescription by general practitioners in a French region. Drug and Alcohol Dependence. 2002;65:197–204. doi: 10.1016/s0376-8716(01)00161-2. [DOI] [PubMed] [Google Scholar]
- 36.Lavie E, Fatséas M, Denis C, et al. Benzodiazepine use among opiate-dependent subjects in buprenorphine maintenance treatment: Correlates of use, abuse and dependence. Drug Alcohol Depend. 2009;99:338–344. doi: 10.1016/j.drugalcdep.2008.07.017. [DOI] [PubMed] [Google Scholar]
- 37.Ross J, Teesson M, Darke S, et al. The characteristics of heroin users entering treatment: Findings from the Australian treatment outcome study (ATOS) Drug Alcohol Rev. 2005;24:411–418. doi: 10.1080/09595230500286039. [DOI] [PubMed] [Google Scholar]
- 38.Peles E, Schreiber S, Adelson M. Variables associated with perceived sleep disorders in methadone maintenance treatment (MMT) patients. Drug Alcohol Depend. 2006;82:103–110. doi: 10.1016/j.drugalcdep.2005.08.011. [DOI] [PubMed] [Google Scholar]
- 39.Lintzeris N, Nielsen S. Benzodiazepines, methadone and buprenor-phine: Interactions and clinical management. Am J Addict. doi: 10.1111/j.1521-0391.2009.00007.x. [DOI] [PubMed] [Google Scholar]
- 40.Trescot A, Datta S, Lee M, et al. Opioid pharmacology. Pain Physician. 2008;11(2 Suppl):S133–S153. [PubMed] [Google Scholar]
- 41.Nutt D, Malizia A. New insights into the role of the GABAA–benzodiazepine receptor in psychiatric disorder. Br J Psychiatry. 2001;179:390–396. doi: 10.1192/bjp.179.5.390. [DOI] [PubMed] [Google Scholar]
- 42.Preston K, Griffiths R, Cone E, et al. Diazepam and methadone blood levels following concurrent administration of diazepam and methadone. Drug Alcohol Depend. 1986;18:192–202. doi: 10.1016/0376-8716(86)90051-7. [DOI] [PubMed] [Google Scholar]
- 43.Nielsen S, Dietze P, Lee N, et al. Concurrent buprenorphine and benzodiazepines use and self-reported opioid toxicity in opioid substitution treatment. Addiction. 2007;102:616–622. doi: 10.1111/j.1360-0443.2006.01731.x. [DOI] [PubMed] [Google Scholar]
- 44.Mégarbane B, Hreiche R, Pirnay S, et al. Does high-dose buprenorphine cause respiratory depression? Possible mechanisms and therapeutic consequences. Toxicol Rev. 2006;25:79–85. doi: 10.2165/00139709-200625020-00002. [DOI] [PubMed] [Google Scholar]
- 45.Flockhart D. Drug Interactions: Cytochrome P450 Drug Interaction Table. Indiana University School of Medicine; 2007. [Accessed August 31, 2009]. Available at: http://medicine.iupui.edu/flockhart/table.htm. [Google Scholar]
- 46.Ferrari A, Coccia C, Bertolini A, et al. Methadone: Metabolism, pharmacokinetics, and interactions. Pharmacol Res. 2004;50:551–559. doi: 10.1016/j.phrs.2004.05.002. [DOI] [PubMed] [Google Scholar]
- 47.Gerber J, Rosenkranz S, Segal Y, et al. Effect of ritonavir/saquinavir on stereoselective pharmacokinetics of methadone: Results of AIDS Clinical Trials Group (ACTG) 401. J Acquir Immune Defic Syndr. 2001;27:153–160. doi: 10.1097/00126334-200106010-00010. [DOI] [PubMed] [Google Scholar]
- 48.Flockhart D. Drug Interactions: Cytochrome P450 Drug Interaction Table. Indiana University School of Medicine; 2007. [Accessed August 31, 2009]. Available at: http://medicine.iupui.edu/flockhart/table.htm. [Google Scholar]
- 49.Krantz M, Kutinsky I, Robertson A, et al. Dose-related effects of methadone on QT prolongation in a series of patients with torsades de pointes. Pharmacotherapy. 2003;23:802–805. doi: 10.1592/phco.23.6.802.32186. [DOI] [PubMed] [Google Scholar]
- 50.Walsh SL, Preston KL, Stitzer ML, et al. Clinical pharmacology of buprenorphine: Ceiling effects at high doses. Clin Pharmacol Ther. 1994;55:569–580. doi: 10.1038/clpt.1994.71. [DOI] [PubMed] [Google Scholar]
- 51.Flockhart D. Drug Interactions: Cytochrome P450 Drug Interaction Table. Indiana University School of Medicine; 2007. [Accessed August 31, 2009]. Available at: http://medicine.iupui.edu/flockhart/table.htm. [Google Scholar]
- 52.Bornstein S, Skopp G. An in vitro approach to potential methadone metabolic-inhibition interactions. Eur J Clin Pharmacol. 2007;63:821–827. doi: 10.1007/s00228-007-0327-z. [DOI] [PubMed] [Google Scholar]
- 53.Waters B, Kaustubh G. Intravenous Quetiapine-Cocaine Use (“Q-Ball”) Am J Psychiatry. 2007;164:173–174. doi: 10.1176/ajp.2007.164.1.173a. [DOI] [PubMed] [Google Scholar]
- 54.Uehlinger C, Crettol S, Chassot P, et al. Increased (R)-methadone plasma concentrations by quetiapine in cytochrome P450s and ABCB1 genotyped patients. J Clin Psychopharmacol. 2007;27:273–278. doi: 10.1097/JCP.0b013e3180592ad2. [DOI] [PubMed] [Google Scholar]
- 55.Physician’s Desk Reference. Prescribing information: Zyprexa (olanzepine) 2007;61:1830–1838. [Google Scholar]
- 56.Physician’s Desk Reference. Prescribing information: Risperdal (risperidone) 2007;61:1676–1682. [Google Scholar]
- 57.Vandel P, Talon JM, Haffen E, et al. Pharmacogenetics and drug therapy in psychiatry–the role of the CYP2D6 polymorphism. Curr Pharmaceutical Design. 2007;13:241–250. doi: 10.2174/138161207779313704. [DOI] [PubMed] [Google Scholar]
- 58.Shah N, Lathrop S, Landen M. Unintentional methadone-related overdose death in New Mexico (USA) and implications for surveillance, 1998–2002. Addiction. 2005;100:176–188. doi: 10.1111/j.1360-0443.2004.00956.x. [DOI] [PubMed] [Google Scholar]
- 59.Graham N, Merlo L, Goldberger B, et al. Methadone- and heroin-related deaths in Florida. Am J Drug Alcohol Abuse. 2008;34:347–353. doi: 10.1080/00952990802010892. [DOI] [PubMed] [Google Scholar]
- 60.Sims S, Snow L, Porucznik C. Surveillance of methadone-related adverse drug events using multiple public health data sources. J Biomed Inform. 2007;40:382–289. doi: 10.1016/j.jbi.2006.10.004. [DOI] [PubMed] [Google Scholar]
- 61.U.S. Department of Health and Human Services, Substance Abuse and Mental Health Services Administration, Center for Substance Abuse Treatment. [Accessed June 8, 2009];Summary Report of the: Methadone Mortality Meeting—A Reassessment. 2007 Available at: http://dpt.samhsa.gov/pdf/Methadone_Report_10%2018%2007_Brief%20w%20attch.pdf.
- 62.FDA Amendments Act of 2007 (FDAAA).