

Abstract
Background
About 39,000 patients were newly prescribed renal replacement therapy in Japan in 2011, resulting in a total of more than 300,000 patients being treated with dialysis. This high prevalence of treated end stage kidney disease (ESKD) patients is an emergent problem that requires immediate attention. We launched a prospective cohort study to evaluate population specific characteristics of the progression of chronic kidney disease (CKD). In this report, we describe the baseline characteristics and risk factors for cardiovascular disease (CVD) prevalence among this cohort.
Methods
New patients from 16 nephrology centers who were older than 20 years of age and who visited or were referred for the treatment of CKD stage 2–5, but were not on dialysis therapy, were recruited in this study. At enrollment, medical history, lifestyle behaviors, functional status and current medications were recorded, and blood and urine samples were collected. Estimated glomerular filtration rate (eGFR) was calculated by a modified three-variable equation.
Results
We enrolled 1138 patients, 69.6% of whom were male, with a mean age of 68 years. Compared with Western cohorts, patients in this study had a lower body mass index (BMI) and higher proteinuria. The prevalence of CVD was 26.8%, which was lower than that in Western cohorts but higher than that in the general Japanese population. Multivariate analysis demonstrated the following association with CVD prevalence: hypertension (adjusted odds ratio (aOR) 3.57; 95% confidence interval (CI) 1.82-7.02); diabetes (aOR 2.45; 95% CI 1.86-3.23); hemoglobin level less than 11 g/dl (aOR 1.61; 95% CI 1.21-2.15); receiving anti-hypertensive agents (aOR 3.54; 95% CI 2.27-5.53); and statin therapy (aOR 2.73; 95% CI 2.04-3.66). The combination of decreased eGFR and increased proteinuria was also associated with a higher prevalence of CVD.
Conclusions
The participants in this cohort had a lower BMI, higher proteinuria and lower prevalence of CVD compared with Western cohorts. Lower eGFR and high proteinuria were associated with CVD prevalence. Prospective follow up of these study patients will contribute to establishment of individual population-based treatment of CKD.
Keywords: Chronic kidney disease, Cohort study, Epidemiology, Cardiovascular disease, Nephrologist
Background
Chronic kidney disease (CKD) is a major global health problem. In Japan, about 13% of the adult population, i.e. approximately 13.3 million people, are estimated to have CKD [1]. According to the National Health and Nutrition Examination Survey (NHANES 1999–2004) in the US, the reported prevalence of CKD was 13.1%, which was a substantial increase over previous reports [2]. The incidence and prevalence of end stage kidney disease (ESKD) is also rapidly increasing, with patients of ESKD having to face the problems of poor outcome and high cost of renal replacement treatment. In Japan, about 39,000 patients were introduced to renal replacement therapy in 2011, resulting in more than 300,000 patients on dialysis [3].
CKD is also a well-known risk factor for cardiovascular mortality and morbidity [4-6]. Reportedly, patients with CKD are more likely to die of cardiovascular disease (CVD) than of progression to ESKD [7]. CVD risk factors, such as hypertension, diabetes and dyslipidemia, tend to be highly prevalent and poorly controlled in patients with CKD [8]. Studies have also shown that estimated glomerular filtration rate (eGFR) and/or albuminuria are associated with cardiovascular (CV) risk [9-11]. Thus, early recognition and treatment of CKD are important to prevent CVD.
We established a large prospective cohort study of Japanese people with CKD called the CKD-ROUTE study (CKD Research of Outcomes in Treatment and Epidemiology). The specific aim of the CKD-ROUTE study is to evaluate the relationship of CKD progression, cardiovascular events and mortality to patient characteristics, complications and treatment. The findings of this study will contribute to development of appropriate therapy for CKD in the Japanese population, whose characteristics are quite different from Western populations. The study is presently ongoing, although enrollment of patients has been completed. In this report, we address whether the basic characteristics and risk factors related to CVD prevalence in Japanese patients are different from those in other ethnic groups.
Methods
Study design and cohort participants
The CKD-ROUTE study is a prospective, observational cohort of a representative Japanese population with CKD stages 2–5 who are not on dialysis. Over 1000 participants were enrolled at the Tokyo Medical and Dental University Hospital and its 15 affiliated, larger than mid-sized clinical centers located in the Tokyo metropolitan area of Japan, where one third of the Japanese population lives. Most patients were referred from primary care clinics. At recruitment, written informed consent was obtained from all patients and their eligibility was determined. Approval for this study was obtained from the ethics committees of all institutions participating in the study (see Acknowledgments), and the research is being conducted in accordance with the ethical principles of the Declaration of Helsinki. The protocol was registered in UMIN Clinical Trials Registry (UMIN000004461).
Participants were eligible for inclusion if they: (1) newly visited or were newly referred to the participant nephrology centers from October 2010 to December 2011; (2) were over 20 years of age; and (3) had CKD stages 2 to 5 according to Kidney Disease Improving Global Outcomes (KDIGO) classification [12]. Stage 5 CKD patients were included in this study because a recent study showed that 35% of CKD stage 5 patients did not enter renal replacement therapy over a 3-year observation period [13]. The following patients were excluded from this study: (1) patients with malignancy that was found or treated within the previous 2 years; (2) transplant recipients; (3) patients with active gastrointestinal bleeding at enrollment; and (4) patients who did not provide written informed consent. Participants have been and will be followed up at 6-month intervals. The total observation period is 3 years after enrollment or until the start of dialysis, time of death, dropout from the study or withdrawal of informed consent.
The primary study outcome is decline in renal function, defined by reduction in eGFR. Secondary outcomes are incidence of CV events, initiation of dialysis, death, hospitalization, bone fractures, and changes in the levels of blood and urine biochemical measurements, blood pressure, bodyweight and body mass index (BMI).
Sample size
One of the major endpoints of the CKD-ROUTE study is initiation of dialysis. If the event rate of initiation of dialysis is presumed to be about 30% according to the rates shown in previous studies [13,14], in the case of 1000 subjects, the cumulative event number for the initiation of dialysis is expected to be around 300. This will have 80% power to detect a hazard ratio of 1.38 with a significant difference of 5% or less. Therefore, we considered the necessary sample size of this study as 1000 subjects.
Measurements
At enrollment, medical history, lifestyle behaviors (self-feeding ability) and current medications were recorded. Anthropometric measurements (height and weight) were obtained and BMI was calculated. Blood pressure (BP) was measured using a standard sphygmomanometer. Blood and urine samples were collected to measure white blood cell, hemoglobin (Hb), platelet, total protein, albumin, urea nitrogen, creatinine, sodium, potassium, chloride, calcium, phosphorus, alkaline phosphatase, intact parathyroid hormone (PTH), glucose, hemoglobin A1c (HbA1c), iron, unsaturated iron binding capacity, ferritin, C-reactive protein, urinary occult blood, urinary protein, and urinary creatinine. Estimated glomerular filtration rate (eGFR) was calculated using the modified three-variable Modification of Diet in Renal Disease (MDRD) equation developed by the Japanese Society of Nephrology to adjust for Japanese physical characteristics: eGFR = 194 × serum creatinine− 1.094 × age− 0.287 (if female, × 0.739) [15]. Since the therapeutic targets of treatment of renal anemia and dyslipidemia in the Japanese CKD guidelines are Hb over 11 g/dl and LDL-cholesterol below 120 mg/dl, respectively, anemia and dyslipidemia were defined as Hb < 11 g/dl and LDL-cholesterol ≥ 120 mg/dl [16]. Corrected calcium (Ca) was adjusted for serum albumin using the equation: Ca + (4 - serum albumin), if serum albumin was < 4g/dl. As the normal range of intact PTH is 10–65 pg/ml as measured by ECLIA, high intact PTH was defined as levels over 65 pg/ml. Urinary protein to creatinine ratios (UPCR) were measured because urinary albumin is not routinely measured due to a regulation of the Japanese Medicare system, and were categorized as: optimal, UPCR < 0.15 g/gCr (gram per gram creatinine); high, UPCR 0.15-0.49 g/gCr; and very high, UPCR ≥ 0.5 g/gCr. This categorization is recommended by Japanese CKD guidelines [17]. All participants are basically treated according to the standard treatment protocols recommended by the Japanese CKD guidelines [16,17].
Definition of hypertension, diabetes, etiology of kidney disease, and cardiovascular disease
Hypertension at entry was defined as systolic blood pressure (SBP) ≥ 140 mmHg, diastolic blood pressure (DBP) ≥ 90 mmHg, use of anti-hypertensive agents, or history of being diagnosed with hypertension. Diabetes was defined as either HbA1c ≥ 6.5% (National Glycohemoglobin Standardization Program (NGSP) method) or receiving anti-diabetic therapy. Etiology of kidney disease in each patient was determined by the physician who was treating the patient at the time of enrollment, based on patients’ past histories, clinical characteristics and findings, and histological findings in biopsied kidney specimens.
CVD was defined as a history of coronary heart disease (angina pectoris (AP), myocardial infarction (MI), or coronary revascularization), congestive heart failure (CHF), peripheral arterial disease (PAD) (necrosis, amputation or revascularization surgery), or stroke (cerebral infarction, transient ischemic attack, cerebral hemorrhage or subarachnoid hemorrhage). Prevalence of CVD at enrollment represented a composite of self-reported history of CVD or information provided by previous doctors.
Statistical analysis
Baseline characteristics are shown as mean ± standard deviation and median with interquartile ranges for continuous variables, while categorical data are presented as numbers and percentages. Analysis of variance and chi-square test were used to compare continuous and categorical variables across CKD stages, respectively. Multivariate logistic regression analysis was used to identify the relationship between the composite CVD prevalence and predictor variables.
Statistical analyses were performed using SPSS, version 20.0. P-value <0.05 was considered statistically significant.
Results
After excluding those who matched the exclusion criteria, we enrolled 1138 patients in this cohort from October 2010 to December 2011. Although we did not accurately count the number of those who were excluded in this registry, we speculate that a less than 5% of the new CKD stage 2–5 patients were excluded due to the exclusion criteria.
Baseline demographic characteristics and prevalence of cardiovascular disease
The baseline demographic characteristics of the study participants are shown in Table 1. Stage 3 was most common (41.3%), followed by stage 4 and 5. Enrollment of patients with stage 2 (8.3%) is a unique feature of this cohort. Mean patient age was 68 years, and 69.6% were male. Most patients were able to feed themselves (99.1%). Mean BMI was 23.7 kg/m2, while 32.8% of them were overweight (BMI ≥ 25 kg/m2). 37.1% of the patients were diabetic. Although the percentage of patients with diabetes was significantly higher in advanced CKD stages, HbA1c was not significantly different among CKD stages. Regarding the causes of CKD, the incidence of diabetic nephropathy was higher in advanced CKD stages, while nephrosclerosis and glomerulonephritis were more frequent in moderate CKD stages. Nephrosclerosis was the overall leading cause of CKD in this cohort, through CKD stage 2–5. CVD was prevalent in 26.8% of all the patients, and patients with advanced CKD were more likely to have CVD, the prevalence being 35.7% in stage 4 and 30.6% in stage 5 patients. Regarding the individual causes of CVD, the incidence of AP, MI, PAD and stroke were highest in stage 4 patients, the incidence of CHF gradually increasing with CKD progression (Figure 1).
Table 1.
Baseline demographics and prevalence of cardiovascular disease according to disease stage, the CKD-ROUTE study (Oct 2010 - Dec 2011)
| |
All |
Stage 2 |
Stage 3 |
Stage 4 |
Stage 5 |
P- value |
|---|---|---|---|---|---|---|
| n = 1138 | n = 95 | n = 470 | n = 364 | n = 209 | ||
| Age (years old) |
68 ± 14 |
57 ± 17 |
67 ± 13 |
71 ± 12 |
69 ± 14 |
<0.001 |
| |
70 [61–77] |
61 [46–71] |
70 [60–76] |
73 [64–78] |
70 [61–78] |
|
| Male gender |
792 |
57 |
361 |
255 |
119 |
<0.001 |
| |
69.6% |
60.0% |
76.8% |
70.1% |
56.9% |
|
| Self-feeding ability |
1118 |
94 |
460 |
360 |
204 |
0.744 |
| |
99.1% |
98.9% |
99.1% |
99.4% |
98.6% |
|
| BMI (kg/m2) |
23.7 ± 4.0 |
23.0 ± 4.0 |
23.7 ± 3.7 |
23.9 ± 4.1 |
23.8 ± 4.5 |
0.351 |
| |
23.3 [21.0 - 25.8] |
22.6 [20.6 - 25.4] |
23.5 [21.3 - 25.7] |
23.4 [21.0 - 26.4] |
23.0 [20.9 - 25.6] |
|
| BMI ≥ 25 kg/m2 |
328 |
20 |
129 |
115 |
64 |
0.473 |
| |
32.8% |
26.0% |
32.0% |
35.1% |
33.2% |
|
| Diabetes |
422 |
15 |
141 |
163 |
103 |
<0.001 |
| |
37.1% |
15.8% |
30.0% |
44.8% |
49.3% |
|
| HbA1c (NGSP) (%) |
6.1 ± 1.0 |
6.0 ± 1.1 |
6.1 ± 1.0 |
6.2 ± 1.0 |
6.1 ± 1.0 |
0.083 |
| |
5.9 [5.6 - 6.5] |
5.7 [5.5 - 6.1] |
5.9 [5.6 - 6.4] |
6.0 [5.6 - 6.6] |
5.9 [5.5 - 6.5] |
|
| Albumin (g/dl) |
4.0 ± 0.8 |
4.0 ± 0.6 |
3.8 ± 0.6 |
3.5 ± 0.6 |
3.8 ± 0.6 |
<0.001 |
| |
4.3 [3.7 - 4.5] |
4.1 [3.8 - 4.4] |
3.9 [3.5 - 4.2] |
3.6 [3.2 - 4.0] |
4.0 [3.5 - 4.3] |
|
| eGFR (ml/min per 1.73 m2) |
32.7 ± 18.7 |
72.1 ± 8.5 |
43.3 ± 8.2 |
22.0 ± 4.4 |
9.9 ± 3.0 |
<0.001 |
| |
29.8 [17.5 - 45.0] |
70.6 [64.9 - 79.7] |
43.2 [35.5 - 50.2] |
21.7 [17.9 - 25.6] |
9.8 [7.4 - 12.4] |
|
| SBP (mmHg) |
140 ± 22 |
139 ± 20 |
137 ± 22 |
140 ± 24 |
146 ± 22 |
<0.001 |
| |
138 [125–152] |
136 [125–150] |
135 [122–150] |
136 [125–154] |
143 [136–160] |
|
| DBP (mmHg) |
78 ± 15 |
83 ± 14 |
79 ± 15 |
75 ± 15 |
79 ± 15 |
<0.001 |
| |
78 [68–87] |
83 [74–92] |
79 [70–87] |
75 [64–83] |
78 [69–90] |
|
| Causes of CKD |
|
|
|
|
|
|
| Diabetic nephropathy |
287 |
10 |
74 |
116 |
87 |
<0.001 |
| |
25.5% |
10.5% |
16.0% |
32.0% |
42.2% |
|
| Nephrosclerosis |
451 |
23 |
214 |
159 |
55 |
|
| |
40.0% |
24.2% |
46.2% |
43.8% |
26.7% |
|
| Glomerulonephritis |
216 |
43 |
83 |
49 |
41 |
|
| |
19.2% |
45.3% |
17.9% |
13.5% |
19.9% |
|
| Others |
173 |
19 |
92 |
39 |
23 |
|
| |
15.4% |
20.0% |
19.9% |
10.7% |
11.2% |
|
| Prevalence of CVD |
305 |
7 |
104 |
130 |
64 |
<0.001 |
| 26.8% | 7.4% | 22.1% | 35.7% | 30.6% |
Continuous variables are presented as mean ± standard deviation and median with interquartile ranges. Categorical data are presented as numbers (n) of patients and percentages in each CKD stage. BMI body mass index, NGSP National Glycohemoglobin Standardization Program, eGFR estimated glomerular filtration rate, SBP systolic blood pressure, DBP diastolic blood pressure, CVD cardiovascular disease.
Figure 1.

Prevalence of individual causes of cardiovascular disease (CVD) stratified by CKD stages, the CKD-ROUTE study (Oct 2010 - Dec 2011). Angina pectoris (AP), myocardial infarction (MI), peripheral arterial disease (PAD) and stroke were highest in patients with stage 4 CKD; congestive heart failure (CHF) incidence gradually increased with CKD progression.
CVD risk factors at enrollment
Table 2 shows the other CVD risk factors not shown in Table 1. Overall, 90.2% of the participants had hypertension at enrollment, with significantly higher BP in patients with advanced CKD stages (Table 1 and 2). The percentage of patients treated with angiotensin II receptor blockers (ARB) or angiotensin converting enzyme inhibitors (ACEI) was 63.3%, and calcium channel blockers was 42.9%. The incidence of anti-hypertensive agent usage was significantly higher in advanced CKD groups.
Table 2.
Prevalence of non-renal risk factors for cardiovascular disease at enrollment, the CKD-ROUTE study (Oct 2010 - Dec 2011)
| |
All |
Stage 2 |
Stage 3 |
Stage 4 |
Stage 5 |
P- value |
|---|---|---|---|---|---|---|
| n = 1138 | n = 95 | n = 470 | n = 364 | n = 209 | ||
| Hypertension |
1027 |
69 |
406 |
348 |
204 |
<0.001 |
| |
90.2% |
72.6% |
86.4% |
95.6% |
97.6% |
|
| Anti-hypertensive therapy |
897 |
38 |
337 |
326 |
196 |
<0.001 |
| |
78.8% |
40.0% |
71.7% |
89.6% |
93.8% |
|
| ARB or ACEI |
720 |
29 |
282 |
271 |
138 |
<0.001 |
| |
63.3% |
30.5% |
60.0% |
74.5% |
66.0% |
|
| Calcium channel blockers |
488 |
13 |
173 |
180 |
122 |
<0.001 |
| |
42.9% |
13.7% |
36.8% |
49.5% |
58.4% |
|
| β blockers |
163 |
3 |
57 |
66 |
37 |
<0.001 |
| |
14.3% |
3.2% |
12.1% |
18.1% |
17.7% |
|
| α blockers |
76 |
0 |
22 |
36 |
18 |
0.001 |
| |
6.7% |
0.0% |
4.7% |
9.9% |
8.6% |
|
| Diuretics |
381 |
6 |
107 |
156 |
112 |
<0.001 |
| |
33.5% |
6.3% |
22.8% |
42.9% |
53.6% |
|
| Anemia |
|
|
|
|
|
|
| Hb (g/dl) |
13.7 ± 1.9 |
13.1 ± 1.9 |
11.2 ± 1.9 |
9.8 ± 1.5 |
11.9 ± 2.3 |
<0.001 |
| |
13.9 [12.8 - 14.9] |
13.2 [11.9 - 14.3] |
11.1 [9.9 - 12.4] |
9.8 [8.8 - 10.7] |
12.0 [10.2 - 13.6] |
|
| Hb < 11 g/dl |
404 |
7 |
64 |
169 |
164 |
<0.001 |
| |
35.6% |
7.4% |
13.6% |
46.6% |
78.5% |
|
| Iron deficiency |
142 |
6 |
46 |
61 |
29 |
0.013 |
| |
14.9% |
7.9% |
12.2% |
19.7% |
15.3% |
|
| Oral iron supplementation |
58 |
1 |
12 |
23 |
22 |
<0.001 |
| |
5.1% |
1.1% |
2.6% |
6.3% |
10.5% |
|
| ESA |
121 |
1 |
5 |
48 |
67 |
<0.001 |
| |
10.6% |
1.1% |
1.1% |
13.2% |
32.1% |
|
| Lipid abnormalities |
|
|
|
|
|
|
| Total cholesterol (mg/dl) |
218 ± 49 |
197 ± 48 |
185 ± 46 |
190 ± 51 |
194 ± 49 |
<0.001 |
| |
214 [190–248] |
193 [169–216] |
182 [153–217] |
180 [153–220] |
190 [162–220] |
|
| HDL-C (mg/dl) |
61 ± 20 |
55 ± 17 |
50 ± 16 |
51 ± 17 |
52 ± 17 |
<0.001 |
| |
59 [45–67] |
52 [42–63] |
48 [39–59] |
48 [38–59] |
50 [40–62] |
|
| HDL-C < 40 mg/dl |
229 |
11 |
76 |
89 |
53 |
<0.001 |
| |
22.5% |
12.8% |
18.2% |
27.7% |
27.7% |
|
| LDL-C (mg/dl) |
128 ± 42 |
111 ± 40 |
104 ± 39 |
109 ± 42 |
110 ± 41 |
<0.001 |
| |
124 [106–152] |
108 [87–130] |
101 [75–125] |
102 [78–126] |
107 [83–130] |
|
| LDL-C ≥ 120 mg/dl |
317 |
45 |
133 |
84 |
55 |
<0.001 |
| |
34.6% |
58.4% |
34.5% |
29.8% |
31.8% |
|
| Statin |
325 |
16 |
112 |
117 |
80 |
<0.001 |
| |
28.6% |
16.8% |
23.8% |
32.1% |
38.3% |
|
| Disorders of mineral metabolism |
|
|
|
|
|
|
| Corrected Ca (mg/dl) |
9.6 ± 0.5 |
9.5 ± 0.4 |
9.3 ± 0.5 |
9.2 ± 0.9 |
9.4 ± 0.6 |
<0.001 |
| |
9.6 [9.3 -9.9] |
9.5 [9.2 - 9.8] |
9.3 [9.0 - 9.6] |
9.2 [8.8 - 9.5] |
9.4 [9.1 - 9.7] |
|
| Corrected Ca < 8.4 mg/dl |
32 |
1 |
2 |
8 |
21 |
<0.001 |
| |
2.9% |
1.1% |
0.4% |
2.3% |
10.2% |
|
| P (mg/dl) |
3.3 ± 0.5 |
3.3 ± 0.6 |
3.5 ± 0.6 |
4.6 ± 1.3 |
3.6 ± 0.9 |
<0.001 |
| |
3.4 [3.0 - 3.6] |
3.3 [3.0 - 3.6] |
3.5 [3.1 - 3.9] |
4.4 [3.7 - 5.3] |
3.5 [3.1 - 4.0] |
|
| P ≥ 4.6 mg/dl |
102 |
0 |
6 |
14 |
82 |
<0.001 |
| |
9.4% |
0.0% |
1.3% |
4.0% |
40.2% |
|
| Intact PTH (pg/ml) |
46 ± 22 |
59 ± 37 |
103 ± 63 |
246 ± 156 |
109 ± 108 |
<0.001 |
| |
39 [33–56] |
51 [37–71] |
89 [60–129] |
218 [138–313] |
71 [45–129] |
|
| Intact PTH > 65 pg/ml |
496 |
11 |
116 |
200 |
169 |
<0.001 |
| |
55.1% |
15.9% |
32.2% |
68.0% |
95.5% |
|
| Urinalysis |
|
|
|
|
|
|
| UPCR (g/gCr) |
2.16 ± 3.23 |
1.40 ± 3.08 |
1.21 ± 2.48 |
2.37 ± 3.04 |
4.31 ± 3.99 |
<0.001 |
| |
0.74 [0.13 - 2.85] |
0.26 [0.07 - 1.14] |
0.24 [0.06 - 0.99] |
1.09 [0.23 - 3.40] |
3.16 [1.15 - 6.16] |
|
| UPCR ≥ 0.5 g/gCr |
591 |
36 |
159 |
224 |
172 |
<0.001 |
| 56.3% | 40.0% | 36.7% | 66.7% | 90.1% |
Continuous variables are presented as mean ± standard deviation and median with interquartile ranges. Categorical data are presented as numbers (n) of patients and percentages in each CKD stage. ARB angiotensin receptor blockers, ACEI angiotensin converting enzyme inhibitors, Hb hemoglobin, ESA erythropoiesis stimulating agent, LDL-C low density lipoprotein cholesterol, HDL-C high density lipoprotein cholesterol, TG triglycerides, Ca calcium, P phosphorus, PTH parathyroid hormone, UPCR urinary protein to creatinine ratio, g/gCr gram per gram creatinine.
Anemia (Hb < 11 g/dl) was present in 35.6% of the patients, the incidence being higher in advanced CKD stages. Iron deficiency (transferrin saturation (TSAT) < 20% and ferritin < 100 ng/ml) was seen in 14.9% patients, its incidence being highest in stage 4 patients. The percentage of patients receiving oral iron supplementation and erythropoiesis stimulating agents (ESA) increased in advanced CKD groups.
A trend existed between decreasing eGFR and the increasing percentage of patients with low HDL-cholesterol. The percentage of patients with high LDL-cholesterol was higher in stage 2 and stayed relatively low through stages 3 to 5. Statin therapy was prescribed in 28.6% of patients, the percentage significantly increasing in advanced CKD groups.
Low corrected serum calcium levels (< 8.4 mg/dl) and high phosphorus levels (≥ 4.6 mg/dl) were seen in patients with stage 5 CKD. The percentage of patients with high intact PTH levels (> 65 pg/ml) was 15.9% in stage 2, 32.2% in stage 3, 68% in stage 4 and 95.5% in stage 5 CKD, respectively. On urinalysis, UPCR was significantly higher in advanced CKD stages, with 90% of stage 5 CKD patients having a UPCR over 0.5 g/gCr.
Risk factors for the prevalence of CVD
The results of multiple logistic regression analysis of the risk factors that predict the prevalence of CVD at enrollment are shown in Table 3. Odds ratio was adjusted for age and gender. Hypertension, diabetes, advanced CKD stage and UPCR greater than 0.5 g/gCr were associated with high CVD prevalence. Receiving anti-hypertensive agents was associated with CVD prevalence. However, SBP over 130 mmHg at the first visit was not associated with CVD. Anemia (Hb < 11 g/dl), iron deficiency, use of oral iron supplementation and ESA were also associated with the prevalence of CVD. Low HDL-cholesterol and receiving lipid lowering therapy (use of statins) were associated with CVD. However, the odds ratio of LDL-cholesterol ≥ 120 mg/dl was 0.49, indicating that low LDL-cholesterol was associated with CVD risk. Hyperparathyroidism (intact PTH > 65 pg/ml) was found to be associated with CVD. However, low corrected serum calcium (< 8.4 mg/dl) and high serum phosphorus (≥ 4.6 mg/dl) were not associated with CVD risk. In addition, since we sometimes encounter patients with CHF that is unrelated to atherosclerotic diseases, we analyzed the factors associated with the prevalence of CVD that excludes CHF from the definition. All the risk factors were still significant, except for three factors, namely, anemia, use of ESA and use of oral iron supplementation (Additional file 1: Table S1).
Table 3.
Risk factors for the presence of cardiovascular disease, the CKD-ROUTE study (Oct 2010 - Dec 2011)
| Unadjusted OR [95% CI] | P- value | Adjusted OR [95% CI] | P- value | |
|---|---|---|---|---|
| Hypertension |
4.07 [2.10 - 7.90 ] |
<0.001 |
3.57 [1.82 - 7.02] |
<0.001 |
| Diabetes |
2.32 [1.77 - 3.03] |
<0.001 |
2.45 [1.86 - 3.23] |
<0.001 |
| BMI |
|
|
|
|
| Optimal BMI (18.5 to 24.9 kg/m2) |
1 (reference) |
|
1 (reference) |
|
| ≥ 25 kg/m2 |
1.10 [0.82 - 1.49] |
0.513 |
1.27 [0.93 - 1.74] |
0.130 |
| < 18.5 kg/m2 |
0.77 [0.43 -1.39] |
0.391 |
0.74 [0.40 - 1.36] |
0.329 |
| CKD stage |
|
|
|
|
| Stage 2 |
1 (reference) |
|
1 (reference) |
|
| Stage 3 |
3.57 [1.61 - 7.95] |
0.002 |
2.56 [1.14 - 5.78] |
0.023 |
| Stage 4 |
6.98 [3.14 - 15.53] |
<0.001 |
4.79 [2.12 - 10.81] |
<0.001 |
| Stage 5 |
5.55 [2.43 - 12.65] |
<0.001 |
4.37 [1.89 - 10.11] |
0.001 |
| UPCR |
|
|
|
|
| < 0.15 g/gCr |
1 (reference) |
|
1 (reference) |
|
| 0.15 to 0.49 g/gCr |
1.21 [0.78 - 1.89] |
0.402 |
1.23 [0.78 - 1.94] |
0.378 |
| ≥ 0.5 g/gCr |
1.55 [1.11 - 2.16] |
0.009 |
1.77 [1.26 - 2.50] |
0.001 |
| |
|
|
|
|
| SBP ≥ 130 mmHg |
0.90 [0.68 - 1.18] |
0.438 |
0.93 [0.70 - 1.23] |
0.600 |
| Anti-hypertensive therapy |
3.92 [2.53 - 6.07] |
<0.001 |
3.54 [2.27 - 5.53] |
<0.001 |
| Use of ARB or ACEI |
1.72 [1.29 - 2.29] |
<0.001 |
1.64 [1.22 - 2.20] |
0.001 |
| Use of calcium channel blocker |
1.55 [1.19 - 2.02] |
0.001 |
1.55 [1.18 - 2.03] |
0.002 |
| Use of diuretics |
1.61 [1.08 - 2.38] |
0.019 |
2.44 [1.84 - 3.24] |
<0.001 |
| Hb < 11 g/dl |
1.63 [1.24 - 2.13] |
<0.001 |
1.61 [1.21 - 2.15] |
0.001 |
| Iron deficiency |
2.03 [1.40 - 2.94] |
<0.001 |
2.41 [1.63 - 3.58] |
<0.001 |
| Use of ESA |
2.10 [1.43 - 3.10] |
<0.001 |
1.93 [1.29 - 2.89] |
0.001 |
| Use of oral iron supplementation |
2.01 [1.17 - 3.44] |
0.011 |
2.15 [1.22 - 3.80] |
0.008 |
| LDL-C ≥ 120 mg/dl |
0.44 [0.31 - 0.61] |
<0.001 |
0.49 [0.34 - 0.68] |
<0.001 |
| HDL-C < 40 mg/dl |
2.45 [1.80 - 3.35] |
<0.001 |
2.29 [1.66 - 3.16] |
<0.001 |
| TG ≥ 150 mg/dl |
0.81 [0.61 - 1.08] |
0.149 |
0.92 [0.69 - 1.23] |
0.575 |
| Use of statin |
2.48 [1.88 - 3.27] |
<0.001 |
2.73 [2.04 - 3.66] |
<0.001 |
| Corrected Ca < 8.4 mg/dl |
0.49 [0.19 - 1.30] |
0.152 |
0.46 [0.17 - 1.22] |
0.118 |
| P ≥ 4.6 mg/dl |
1.12 [0.72 - 1.76] |
0.611 |
1.34 [0.84 - 2.14] |
0.214 |
| Intact PTH > 65 pg/ml | 1.80 [1.33 - 2.43] | <0.001 | 1.86 [1.36 - 2.54] | <0.001 |
Odds ratio (OR) was adjusted by age and gender. CI confidence interval, BMI body mass index, UPCR urinary protein to creatinine ratio, g/gCr gram per gram creatinine, SBP systolic blood pressure, ARB angiotensin receptor blockers, ACEI angiotensin converting enzyme inhibitors, Hb hemoglobin, ESA erythropoiesis stimulating agent, LDL-C low density lipoprotein cholesterol, HDL-C high density lipoprotein cholesterol, TG triglycerides, Ca calcium, P phosphorus, PTH parathyroid hormone.
Figure 2 shows the prevalence of CVD in 11 categories classified based on CKD stages and proteinuria. Patients with stage 4 and 5 CKD with very high proteinuria were significantly associated with the prevalence of CVD.
Figure 2.
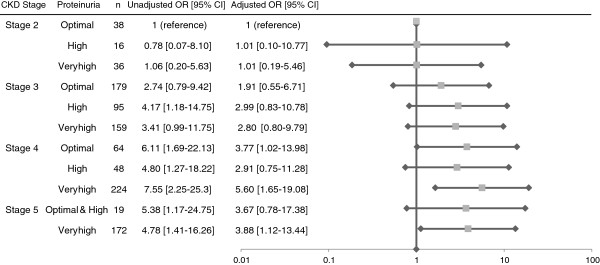
Prevalence of cardiovascular disease (CVD) in 11 categories classified by CKD stages and proteinuria, the CKD-ROUTE study (Oct 2010 - Dec 2011). Odds ratio (OR) was adjusted for age and gender. The reference category is the group with stage 2 and optimal proteinuria. Horizontal lines indicate 95% confidence intervals (95% CI) and the scales are logarithmic. eGFR lower than 30 ml/min per 1.73 m2 and very high proteinuria were significantly associated with the prevalence of CVD.
Discussion
The CKD-ROUTE study was established to identify the risk factors of CKD and effects of treatment on its progression. A unique characteristics of this study is that all enrolled patients are those who newly visited or were referred to our nephrology centers. This gives us information on the basic characteristics of the patients before they receive specific treatment from nephrologists, allowing clear evaluation of the efficacy of the treatment by nephrologists in a prospective manner. Although the dietary habits in Japan have been westernized, there are many differences between Japanese compared to Western populations, such as lower calorie intake, smaller body size and lower BMI [18,19]. It is highly possible that these differences affect the progression and treatment of CKD. The ROUTE study has the potential to help establish ethnic group-based CKD guidelines.
Keeping such differences in mind, at the completion of the enrollment, we addressed whether the basic characteristics of ROUTE patients are different from those of Western cohorts, such as those in the CRIC study in the US [20,21], CRISIS study in UK [22], and MERENA study in Spain [23]. As shown in Table 4, ROUTE participants were older, with a lower BMI, lower prevalence of diabetes, higher SBP and DBP, and lower prevalence of CVD. Thus, the patients in this cohort differ from Western populations in many aspects, with some of these differences probably reflecting basic physical and habitual differences among the ethnic groups.
Table 4.
Comparison of baseline characteristics of CKD cohort studies
| |
ROUTE |
CRIC [20],[21] |
CRISIS [22] |
MERENA [23] |
|---|---|---|---|---|
| |
Japan |
US |
UK |
Spain |
| n = 1138 | n = 3612 | n = 1325 | n = 1129 | |
| eGFR (ml/min per 1.73 m2) |
0 - 90 |
20 - 70 |
10 - 60 |
15 - 60 |
| Age (years) |
68 |
58.2 |
65.1 |
68 |
| Male gender (%) |
69.6 |
54 |
63.7 |
64 |
| BMI (kg/m2) |
23 |
32.1 |
|
28.4 |
| eGFR (ml/min per 1.73 m2) |
32.7 |
43.4 |
30.9 |
28 |
| Diabetes (%) |
37.1 |
47 |
32.4 |
40.8 |
| Hypertension (%) |
90.2 |
86 |
|
92.7 |
| SBP (mmHg) |
140 |
127.7 |
138.3 |
141 |
| DBP (mmHg) |
78 |
71.4 |
75.2 |
76 |
| ARB or ACEI (%) |
63 |
68 |
59.8 |
|
| Hb (g/dl) |
11.9 |
12.7 |
12.41 |
12.8 |
| LDL-C (mg/dl) |
110 |
102.5 |
|
116 |
| Ca (mg/dl) |
9.1 |
9.2 |
9.14 |
|
| P (mg/dl) |
3.6 |
3.7 |
3.72 |
3.7 |
| Intact PTH (pg/ml) |
109 |
53 |
93.2 |
145 |
| Prevalence of CVD (%) |
26.8 |
33.4 |
47.2 |
39.1 |
| Proteinuria (mean) |
2.16 g/gCr |
|
1.08 g/day |
1.2 g/day |
| Proteinuria (median) | 0.74 g/gCr | 0.17 g/day |
BMI body mass index, eGFR estimated glomerular filtration rate, SBP systolic blood pressure, DBP diastolic blood pressure, ARB angiotensin receptor blockers, ACEI angiotensin converting enzyme inhibitors, Hb hemoglobin, LDL-C low density lipoprotein cholesterol, Ca calcium, P phosphorus, PTH parathyroid hormone, CVD cardiovascular disease, g/gCr gram per gram creatinine.
Although the prevalence of CVD in ROUTE participants is lower than that in Western CKD cohorts (Table 4), it is still higher than that in the general Japanese population [24]. As summarized in Tables 1 and 2, many established risk factors of CVD showed a high prevalence in this cohort, with an increase in the prevalence of CVD with worsening CKD stage. We analyzed which factors could predict the prevalence of CVD at enrollment. This analysis is important because the determined factors in turn may predict the future occurrence of new CV events. As summarized in Table 3, many factors predicted the CVD prevalence at enrollment, some of which are discussed below.
As expected, hypertension and diabetes were associated with CVD prevalence. Although receiving anti-hypertensive therapy was an associated factor for CVD, SBP ≥ 130 mmHg at enrollment was not a significant predictor. This could be explained by the fact that patients with CVD were already prescribed anti-hypertensive drugs by primary care physicians, resulting in normalized BP. Interestingly, the adjusted odds ratio for the use of diuretics was higher than for other anti-hypertensive agents. A most likely explanation for this would be that participants with CVD have been prescribed diuretics for treatment of CHF or edema. Although not shown, the fact that 78.7% of the patients who experienced CHF used diuretics supports this explanation.
Increasing UPCR was also associated with the prevalence of CVD. Furthermore, as shown in Figure 2, the combination of advanced CKD stage and high proteinuria was significantly associated with CVD prevalence. It is of note that the amount of urinary protein excretion was high in ROUTE patients compared with the participants of Western CKD cohorts (Table 4). The reason for this is not immediately clear, but relatively poor control of BP may partly account for this. Also, the fact that the participants were new patients not previously treated by nephrologists, and were not given specific treatments could have contributed to this difference.
Dyslipidemia is a conventional CV risk factor that is also commonly observed in CKD patients, with an increasing incidence with progression of CKD stage [25]. Statins are the most important pharmacologic approach altering cholesterol levels, with more than one fourth of the patients in this study being treated by statins. Our data showed that although statin therapy was an associated factor for CVD, high LDL-cholesterol levels were not, suggesting that patients who had CVD were already prescribed lipid lowering drugs by primary care physicians, same as anti-hypertensive drugs.
Anemia was also an associated factor of CVD prevalence in this study. Patients with eGFR below 60 ml/min per 1.73 m2 are much more likely to have anemia, and the prevalence and severity of anemia increases with declining kidney function [26]. In the present study, more than almost half of the CKD stage 4 and 5 patients had anemia (Hb < 11g/dl), with an incidence of iron deficiency of 19.7% and 15.3% in these stages, respectively. However, the percentage of patients receiving oral iron or ESA therapy was only 5% and 10%, respectively, reflecting insufficient treatment by primary care physicians. Follow up of the cohort by nephrologists for adequate treatment will provide for the effect of treatment of anemia in CKD patients.
Conclusions
The ROUTE participants were characterized by low BMI, high proteinuria and low prevalence of CVD. Hypertension, diabetes, anemia, decreasing eGFR and increasing proteinuria are associated with the prevalence of CVD. Receiving anti-hypertensive agents, statin therapy and treatment for anemia are also associated with the prevalence of CVD. Prospective follow up of ROUTE participants treated by nephrologists will provide high quality evidence of the risk factors of progression of CKD and their appropriate treatment.
Abbreviations
ESKD: End stage kidney disease; CKD: Chronic kidney disease; CVD: Cardiovascular disease; eGFR: Estimated glomerular filtration rate; BMI: Body mass index; aOR: Adjusted odds ratio; NHANES: National health and nutrition examination surveys; CV: Cardiovascular; ROUTE: Research and outcome in treatment and epidemiology; NKF: National kidney foundation; K/DOQI: Kidney disease outcomes quality initiative; BP: Blood pressure; MDRD: Modification of diet in renal disease; Ca: Calcium; UPCR: Urinary protein to creatinine ratio; SBP: Systolic blood pressure; DBP: Diastolic blood pressure; HbA1c: Hemoglobin A1c; NGSP: National glycohemoglobin standardization program; AP: Angina pectoris; MI: Myocardial infarction; CHF: Congestive heart failure; PAD: Peripheral arterial disease; Hb: Hemoglobin; TSAT: Transferrin saturation; ESA: Erythropoiesis stimulation agent; PTH: Parathyroid hormone.
Competing interests
The authors declare that they have no competing interests.
Authors’ contributions
YN and SN contributed to the design of this study. SI managed the database, performed statistical analysis and drafted the manuscript. SS contributed to organizing the study and writing the manuscript. EK advised on statistical analysis. SI, YN, TO, SN, TT, YC, MK, RA, YN, YM, HT, TT, SK, EK, SI, MY, RO, MT, TK, KK, TR, SU and SS treated the patients and provided the patients’ data. All authors have read and approved the final manuscript.
Pre-publication history
The pre-publication history for this paper can be accessed here:
Supplementary Material
Risk factors for the presence of cardiovascular disease excluding congestive heart failure, CKD-ROUTE study (Oct 2010 - Dec 2011).
Contributor Information
Soichiro Iimori, Email: siimori.kid@tmd.ac.jp.
Yumi Noda, Email: ynodmed2@tmd.ac.jp.
Tomokazu Okado, Email: tokado.kid@tmd.ac.jp.
Shotaro Naito, Email: snaito.kid@tmd.ac.jp.
Takayuki Toda, Email: toda2170@tkgh.jp.
Yoshiko Chida, Email: nakanohd@nakanosogo.or.jp.
Michio Kuwahara, Email: kuwaharam@shuuwa-gh.or.jp.
Ryoichi Ando, Email: rando@musashino.jrc.or.jp.
Yasuhide Nishio, Email: yn24025772003@yahoo.co.jp.
Yoshitaka Maeda, Email: yoshimaeda43@yahoo.co.jp.
Hiroyuki Tanaka, Email: htanaka@ykh.gr.jp.
Teiichi Tamura, Email: ttamura@ykh.gr.jp.
Shigeaki Kimoto, Email: kimoto-s@mghp.ome.tokyo.jp.
Eiichiro Kanda, Email: tokyo.kyosai.kanda@gmail.com.
Seiji Inoshita, Email: inoshitase@bokutoh-hp.metro.tokyo.jp.
Momono Yoshikawa, Email: momono@gf7.so-net.ne.jp.
Rie Okutsu, Email: okutsu@toshima-hp.jp.
Masato Tajima, Email: Masato_Tajima@member.metro.tokyo.jp.
Takashi Kusaura, Email: kusaura-t@kkr.hiratsuka.kanagawa.jp.
Katsuki Kobayashi, Email: katsukik@cehpnet.com.
Tatemitsu Rai, Email: trai.kid@tmd.ac.jp.
Shinichi Uchida, Email: suchida.kid@tmd.ac.jp.
Sei Sasaki, Email: ssasaki.kid@tmd.ac.jp.
Acknowledgments
The authors are very grateful for the general support of Chugai Pharmaceutical Co., Ltd. The authors thank their clinical staffs, who understood the clinical importance of this study and who provided high-quality data. The authors especially thank all of the patients who participated in this study.
This study protocol was approved by the ethical review board of each institution. The approval numbers are listed below: Tokyo Medical and Dental University, school of medicine (No. 883); Tsuchiura Kyodo General Hospital (No. 212); Nakano General Hospital (number not specified); Shuuwa General Hospital (number not specified); Musashino Red Cross Hospital (number not specified); Tokyo Metropolitan Tama Medical Center (No. 17); JA Toride Medical Center (No. 104); Yokosuka Kyosai Hospital (number not specified); Ome Municipal General Hospital (No. 10); Tokyo Kyosai Hospital (number not specified); Tokyo Metropolitan Bokutoh Hospital (No. 20); Tokyo Metropolitan Otsuka Hospital (No. 2010–15); Toshima Hospital (number not specified); Tokyo Metropolitan Hiroo Hospital (number not specified); Hiratsuka Kyosai Hospital (number not specified); Clinical Research Center, Chiba-East National Hospital (No. 15).
References
- Imai E, Horio M, Watanabe T, Iseki K, Yamagata K, Hara S, Ura N, Kiyohara Y, Moriyama T, Ando Y. et al. Prevalence of chronic kidney disease in the Japanese general population. Clin Exp Nephrol. 2009;13(6):621–630. doi: 10.1007/s10157-009-0199-x. [DOI] [PubMed] [Google Scholar]
- Coresh J, Selvin E, Stevens LA, Manzi J, Kusek JW, Eggers P, Van Lente F, Levey AS. Prevalence of chronic kidney disease in the United States. JAMA. 2007;298(17):2038–2047. doi: 10.1001/jama.298.17.2038. [DOI] [PubMed] [Google Scholar]
- An Overview of Regular Dialysis Treatment in Japan. http://docs.jsdt.or.jp/overview/index.html.
- Go AS, Chertow GM, Fan D, McCulloch CE, Hsu CY. Chronic kidney disease and the risks of death, cardiovascular events, and hospitalization. N Engl J Med. 2004;351(13):1296–1305. doi: 10.1056/NEJMoa041031. [DOI] [PubMed] [Google Scholar]
- Weiner DE, Tighiouart H, Amin MG, Stark PC, MacLeod B, Griffith JL, Salem DN, Levey AS, Sarnak MJ. Chronic kidney disease as a risk factor for cardiovascular disease and all-cause mortality: a pooled analysis of community-based studies. J Am Soc Nephrol. 2004;15(5):1307–1315. doi: 10.1097/01.ASN.0000123691.46138.E2. [DOI] [PubMed] [Google Scholar]
- McCullough PA, Jurkovitz CT, Pergola PE, McGill JB, Brown WW, Collins AJ, Chen SC, Li S, Singh A, Norris KC. et al. Independent components of chronic kidney disease as a cardiovascular risk state: results from the Kidney Early Evaluation Program (KEEP) Arch Intern Med. 2007;167(11):1122–1129. doi: 10.1001/archinte.167.11.1122. [DOI] [PubMed] [Google Scholar]
- Keith DS, Nichols GA, Gullion CM, Brown JB, Smith DH. Longitudinal follow-up and outcomes among a population with chronic kidney disease in a large managed care organization. Arch Intern Med. 2004;164(6):659–663. doi: 10.1001/archinte.164.6.659. [DOI] [PubMed] [Google Scholar]
- Collins AJ, Foley RN, Herzog C, Chavers BM, Gilbertson D, Ishani A, Kasiske BL, Liu J, Mau LW, McBean M. et al. Excerpts from the US Renal Data System 2009 Annual Data Report. Am J Kidney Dis. 2010;55(1 Suppl 1):S1–S420. doi: 10.1053/j.ajkd.2009.10.009. A426-427. [DOI] [PMC free article] [PubMed] [Google Scholar]
- Hillege HL, Janssen WM, Bak AA, Diercks GF, Grobbee DE, Crijns HJ, Van Gilst WH, De Zeeuw D, De Jong PE. Microalbuminuria is common, also in a nondiabetic, nonhypertensive population, and an independent indicator of cardiovascular risk factors and cardiovascular morbidity. J Intern Med. 2001;249(6):519–526. doi: 10.1046/j.1365-2796.2001.00833.x. [DOI] [PubMed] [Google Scholar]
- Ninomiya T, Perkovic V, de Galan BE, Zoungas S, Pillai A, Jardine M, Patel A, Cass A, Neal B, Poulter N. et al. Albuminuria and kidney function independently predict cardiovascular and renal outcomes in diabetes. J Am Soc Nephrol. 2009;20(8):1813–1821. doi: 10.1681/ASN.2008121270. [DOI] [PMC free article] [PubMed] [Google Scholar]
- Drury PL, Ting R, Zannino D, Ehnholm C, Flack J, Whiting M, Fassett R, Ansquer JC, Dixon P, Davis TM. et al. Estimated glomerular filtration rate and albuminuria are independent predictors of cardiovascular events and death in type 2 diabetes mellitus: the Fenofibrate Intervention and Event Lowering in Diabetes (FIELD) study. Diabetologia. 2011;54(1):32–43. doi: 10.1007/s00125-010-1854-1. [DOI] [PubMed] [Google Scholar]
- Levey AS, Eckardt KU, Tsukamoto Y, Levin A, Coresh J, Rossert J, De Zeeuw D, Hostetter TH, Lameire N, Eknoyan G. Definition and classification of chronic kidney disease: a position statement from Kidney Disease: Improving Global Outcomes (KDIGO) Kidney Int. 2005;67(6):2089–2100. doi: 10.1111/j.1523-1755.2005.00365.x. [DOI] [PubMed] [Google Scholar]
- Chiu YL, Chien KL, Lin SL, Chen YM, Tsai TJ, Wu KD. Outcomes of stage 3–5 chronic kidney disease before end-stage renal disease at a single center in Taiwan. Nephron Clin Pract. 2008;109(3):c109–c118. doi: 10.1159/000145453. [DOI] [PubMed] [Google Scholar]
- Obi Y, Kimura T, Nagasawa Y, Yamamoto R, Yasuda K, Sasaki K, Kitamura H, Imai E, Rakugi H, Isaka Y. et al. Impact of age and overt proteinuria on outcomes of stage 3 to 5 chronic kidney disease in a referred cohort. Clin J Am Soc Nephrol. 2010;5(9):1558–1565. doi: 10.2215/CJN.08061109. [DOI] [PMC free article] [PubMed] [Google Scholar]
- Matsuo S, Imai E, Horio M, Yasuda Y, Tomita K, Nitta K, Yamagata K, Tomino Y, Yokoyama H, Hishida A. Revised equations for estimated GFR from serum creatinine in Japan. Am J Kidney Dis. 2009;53(6):982–992. doi: 10.1053/j.ajkd.2008.12.034. [DOI] [PubMed] [Google Scholar]
- Evidence-based practice guideline for the treatment of CKD. Clin Exp Nephrol. 2009;13(6):537–566. doi: 10.1007/s10157-009-0237-8. [DOI] [PubMed] [Google Scholar]
- Clinical practice guidebook for diagnosis and treatment of chronic kidney disease 2012. Nihon Jinzo Gakkai Shi. 2012;54(8):1034–1191. [PubMed] [Google Scholar]
- Global Database on Body Mass Index. http://apps.who.int/bmi/index.jsp]
- FAO Statistical Yearbook. 2012. http://www.fao.org/docrep/015/i2490e/i2490e00.htm]
- Lash JP, Go AS, Appel LJ, He J, Ojo A, Rahman M, Townsend RR, Xie D, Cifelli D, Cohan J. et al. Chronic Renal Insufficiency Cohort (CRIC) Study: baseline characteristics and associations with kidney function. Clin J Am Soc Nephrol. 2009;4(8):1302–1311. doi: 10.2215/CJN.00070109. [DOI] [PMC free article] [PubMed] [Google Scholar]
- Townsend RR, Anderson AH, Chen J, Gadebegku CA, Feldman HI, Fink JC, Go AS, Joffe M, Nessel LA, Ojo A. et al. Metabolic syndrome, components, and cardiovascular disease prevalence in chronic kidney disease: findings from the Chronic Renal Insufficiency Cohort (CRIC) Study. Am J Nephrol. 2011;33(6):477–484. doi: 10.1159/000327618. [DOI] [PMC free article] [PubMed] [Google Scholar]
- Hoefield RA, Kalra PA, Baker P, Lane B, New JP, O'Donoghue DJ, Foley RN, Middleton RJ. Factors associated with kidney disease progression and mortality in a referred CKD population. Am J Kidney Dis. 2010;56(6):1072–1081. doi: 10.1053/j.ajkd.2010.06.010. [DOI] [PubMed] [Google Scholar]
- Martinez-Castelao A, Gorriz JL, Portoles JM, De Alvaro F, Cases A, Luno J, Navarro-Gonzalez JF, Montes R, De la Cruz-Troca JJ, Natarajan A. et al. Baseline characteristics of patients with chronic kidney disease stage 3 and stage 4 in Spain: the MERENA observational cohort study. BMC Nephrol. 2011;12:53. doi: 10.1186/1471-2369-12-53. [DOI] [PMC free article] [PubMed] [Google Scholar]
- Miura K, Nakagawa H, Ohashi Y, Harada A, Taguri M, Kushiro T, Takahashi A, Nishinaga M, Soejima H, Ueshima H. Four blood pressure indexes and the risk of stroke and myocardial infarction in Japanese men and women: a meta-analysis of 16 cohort studies. Circulation. 2009;119(14):1892–1898. doi: 10.1161/CIRCULATIONAHA.108.823112. [DOI] [PubMed] [Google Scholar]
- K/DOQI clinical practice guidelines for management of dyslipidemias in patients with kidney disease. Am J Kidney Dis. 2003;41(4 Suppl 3):I-IV–S1-91. [PubMed] [Google Scholar]
- Astor BC, Muntner P, Levin A, Eustace JA, Coresh J. Association of kidney function with anemia: the Third National Health and Nutrition Examination Survey (1988–1994) Arch Intern Med. 2002;162(12):1401–1408. doi: 10.1001/archinte.162.12.1401. [DOI] [PubMed] [Google Scholar]
Associated Data
This section collects any data citations, data availability statements, or supplementary materials included in this article.
Supplementary Materials
Risk factors for the presence of cardiovascular disease excluding congestive heart failure, CKD-ROUTE study (Oct 2010 - Dec 2011).