Abstract
Transcranial Doppler (TCD) can be aptly called as the doctor’s stethoscope of the brain. Since its introduction in 1982, by Rune Aaslid, TCD has evolved as a diagnostic, monitoring, and therapeutic tool. During evaluation of patients with acute ischemic stroke, TCD combined with cervical duplex ultrasonography provides physiological information on the cerebral hemodynamics, which is often complementary to structural imaging. Currently, TCD is the only diagnostic tool that can provide real time information about cerebral hemodynamics and can detect embolization to the cerebral vessels. TCD is a noninvasive, cost-effective, and bedside tool for obtaining information regarding the collateral flow across various branches of the circle of Willis in patients with cerebrovascular disorders. Advanced applications of TCD help in the detection of right-to-left shunts, vasomotor reactivity, diagnosis, and monitoring of vasospasm in subarachnoid hemorrhage and as a supplementary test for confirmation of brain death. This article describes the basic ultrasound physics pertaining to TCD insonation methods, for detecting the flow in intracranial vessels in addition to the normal and abnormal spectral flow patterns.
Keywords: Ischemic stroke, intracranial stenosis, transcranial doppler
Introduction
Rune Aaslid, in 1982, introduced the transcranial Doppler (TCD) for detecting blood flow in the basal intracerebral arteries.[1] It was a single gate spectral TCD system that required considerable expertise to obtain flow signals from intracranial vessels. Mark Moehring, in 2002, invented the transcranial power-motion mode Doppler (PMD) with 33 sampling gates.[2] The PMD or M-mode Doppler had the advantage of simultaneously displaying the intensity and direction of intracranial blood flow with over 6 cm or more of intracranial space, which simplified the examination technique. TCD was initially introduced for detecting the vasospasm following subarachnoid hemorrhage. However, its use has expanded immensely over the past three decades and TCD has emerged as a noninvasive and cost-effective tool for evaluating cerebral arterial patency, detecting stenosis, collateral flow patterns, and embolization. Furthermore, in addition to being a reliable bedside tool for monitoring arterial recanalization during systemic thrombolysis, TCD is known to enhance the rates of arterial recanalization. Currently, TCD is the only available diagnostic tool that provides real-time information about the cerebral hemodynamics over extended periods of monitoring, as well as detects embolization to cerebral vessels.[3,4]
In the setting of acute ischemic stroke, combined TCD and cervical duplex ultrasonography can evaluate the cerebral hemodynamic consequences of an extracranial carotid stenosis and help in identifying the lesions amenable for interventional therapy.[5] Compared with computed tomography angiography (CTA), TCD has been shown to demonstrate 79% sensitivity and 94% specificity in detecting intracranial stenosis. Importantly, TCD findings are complementary to CTA in detecting real time embolization and various collateral flow patterns, due to proximal arterial stenosis, and also in detecting alternating flow signals in the posterior circulation, suggestive of the steal phenomenon.[6]
Some of the important and established applications of TCD include detection of the right-to-left shunt,[7,8] cerebral vasomotor reactivity,[9] monitoring flow velocities for stoke prevention in sickle cell disease,[10] and as a supplementary diagnostic test for the confirmation of brain death. Furthermore, continuous TCD monitoring during systemic thrombolysis is known to enhance the rates of clot dissolution in acute ischemic stroke.[11–13]
In this article we describe the basic ultrasound physics, techniques of performing TCD, and description of normal and abnormal spectral wave forms.
Basic ultrasound physics
The current diagnostic ultrasound systems are based on the pulse-echo technique. Pulses of sound waves are sent into the tissues and the echoes reflected at different structural boundaries are received and processed to provide meaningful information.[14,15] When a small amount of electric current is passed through the piezoelectric crystal in the transducer, it vibrates to generate pulses of ultrasound waves of a specific frequency. The frequencies of echoes emitted after striking a moving object are different from those emitted by the source. This difference between the transmitted and the reflected sound frequencies is called a ‘Doppler shift,’ and this enables the detection of tissue motion and blood flow. The complex signals resulting from the reflections of moving red blood cells are broken into individual velocities by a method called Fast Fourier Transform (FFT).[14,15] In TCD, the angle of insonation (the angle between the ultrasound beam and the blood flow) is presumed to be zero degrees.
The biggest hurdle to obtain acoustic information from the intracranial space is the skull bone that attenuates about 90% of the ultrasound waves. As attenuation is lower for the low frequency ultrasound, TCD employs a 2-MHz ultrasound to enable the test performance.
Doppler versus duplex sonography
Doppler sonography is obtaining information regarding tissue motion and blood flow velocities only, without structural imaging. When tissue imaging is combined with flow velocities, the process is called duplex sonography.
Transcranial Doppler versus transcranial color-coded duplex
The commercially available PMD-TCD systems are the Doppler equipment. A 2-MHz transducer may be used in the ultrasound systems, to perform transcranial color-coded duplex (TCCD) sonography of the skull (visualization of the intracranial structures as well as obtaining blood flow profiles). For TCCD, a phased array transducer is used. Although TCCD has an advantage of providing parenchymal imaging with a structural flow map of cerebral vessels, fewer successful examinations can be performed, especially in the elderly, with insufficient temporal acoustic bone windows. In this article we describe the technique of TCD. The ultrasound probes used for TCD and TCCD are shown in Figure 1a.
Figure 1.
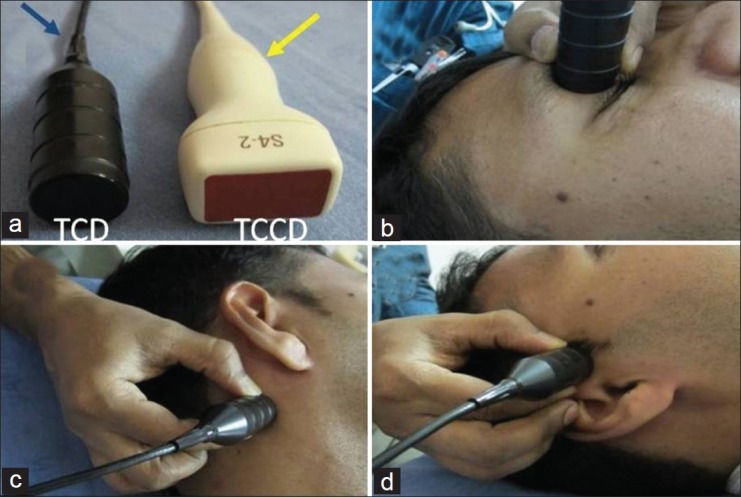
(a) Ultrasound probes. Blue arrow - Transcranial Doppler, Yellow arrow - Transcranial color-coded sonography. (b) (ophthalmic), (c) (suboccipital), (d) (temporal) depict various transcranial acoustic windows and probe directions during TCD
Power-motion mode Doppler
The single gate TCD developed by Rune Aaslid could obtain information only from a small volume of the intracranial space. This limitation led to difficulties in evaluating the information gathered from multiple points, rendering TCD with a lot of ‘operator-dependency’. The advent of transcranial PMD by Mark Moehring revolutionized the application of TCD2, as the system simultaneously displayed flow intensity and direction, over 6 cm or more of intracranial space. This became possible by using 33 overlapping sample gates that provided information about the entire length of an artery, various bifurcations, and so on, on a single screen. Thus, PMD made the performance of TCD examination relatively easier, even for an inexperienced operator. As PMD is combined with a single-channel spectral analysis, it is possible to select a particular depth on the PMD screen to obtain the Doppler spectrum.
Anatomy of the circle of willis
Sir Thomas Willis, in 1664, described the anatomy of basal intracranial vessels. The circle of Willis provides an important communication between the anterior (internal carotid artery and its branches) and posterior (vertebral and basilar arteries) circulatory systems.
The internal carotid arteries (ICA) enter the cranial cavity through the foramen lacerum and divide into the anterior cerebral arteries (ACA) and the middle cerebral arteries (MCA). The ACA are connected to each other by an anterior communicating (ACOM) artery. Posteriorly, the right and left vertebral arteries join to form the basilar artery, which runs along the ventral surface of the pons and terminate by dividing into right and left posterior cerebral arteries (PCA). The ICA on either side is connected with the PCAs by posterior communicating arteries, to complete the posterior part of the circle of Willis.
The circle of Willis is a natural collateral conduit, through which blood gets diverted in case of proximal vessel occlusion. However, a complete circle of Willis, with balanced arterial pairs, is present in only 18 - 20% of the individuals, due to various anomalies.[16]
Transcranial Doppler windows
In some areas on the skull, the bones are relatively thinner and permit sufficient penetration of the ultrasound. These areas are called acoustic windows. The four commonly employed acoustic windows in adults are - temporal, orbital, suboccipital, and submandibular.[17] Through the transtemporal window, the flow velocities in MCA, ACA, PCA, and PCOM can be obtained. The ophthalmic artery (OA) and internal carotid artery (ICA) siphons are insonated through the transorbital window. The natural defect between the occipital bone and atlas vertebrae forms the suboccipital window that allows insonation of the vertebral (VA) and basilar (BA) arteries. The BA can also be evaluated through the transforaminal approach (direct insonation through the foramen magnum). The submandibular approach is employed to evaluate the distal cervical ICA, for evaluating vasospasm in patients with subarachnoid hemorrhage. Various acoustic windows are shown in Figure 1a–d.
Methods of insonation power-motion mode Doppler / Transcranial Doppler examination technique
It is preferable to sit at the head end of the patient, as it does not interfere with the activities of other personnel engaged in the medical management of the patient, specifically relevant in the setting of acute ischemic stroke. The anatomical segments of various intracranial arteries are identified by their depth, direction of blood flow, and the Doppler spectra.[18,19]
Trans-temporal insonation
Place the 2MHz TCD ultrasound transducer over the temporal area just above the zygomatic arch and in front of the tragus of the ear and orient the transducer slightly upward, anteriorly. Adjust the probe so that the PMD screen is filled with color signals between 30 and 80 mm depth. A red color signal (toward the probe) between 40 and 65mm represents the flow in the ipsilateral MCA, while the blue signal between 65 and 80 mm represents the flow from the ipsilateral ACA. In patients with good windows and favorable anatomy, a red signal may be noted beyond 80 mm, representing flow in the contralateral A1 ACA [Figure 2a]. By placing the sample volume at various depths on the PMD screen, the flow spectra from various intracranial arterial segments can be obtained [Figure 2b].
Figure 2.
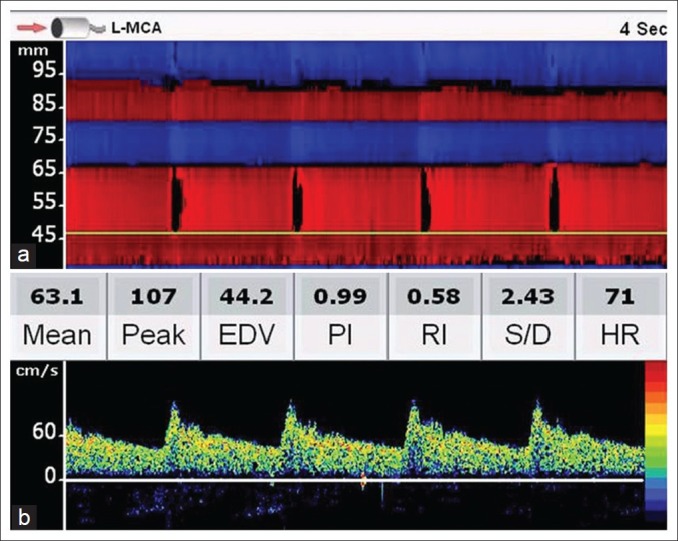
PMD screen following a trans-temporal insonation. Upper panel (a) shows the M-mode appearance of various arteries. The red signal up to 65 mm means that the flow is toward the probe (MCA flow) and from 65 mm to 80 mm, away from the probe (ACA flow). Red color beyond 80 mm suggests flow in the contralateral A1 ACA and the blue signal beyond 92 mm represents contralateral MCA. Lower panel (b) shows a normal TCD spectrum at a depth of 47 mm. Note the rapid systolic acceleration and stepwise deceleration during the diastole and significant end-diastolic velocity
The Ml MCA stem usually lies at depths of 40-65 mm, and is dependent on the size of the patient’s head. It bifurcates into two divisions at a depth of 40-45 mm. Flow signals from the two M2 MCA branches are usually obtained by orientating the probe as if ‘going with the flow’.
The ICA bifurcation is commonly observed at about 65 mm (range 58-70 mm in adults). A bidirectional signal obtained at 60-70 mm represents ICA bifurcation. The ACA flow is usually away from the probe (blue color signal with Doppler spectra below the baseline).
After obtaining signals from the MCA and ACA, the ultrasound probe is slowly orientated posteriorly by 10 to 30 degrees. Usually there is a flow gap followed by flow signals from the PCA. Flow signals directed toward the probe represent P1 PCA, while those away from the flow arise from the P2 segment of the PCA; both segments are visualized at depths of 55-70 mm, and are dependent upon the probe orientation. An absence of the flow gap while moving the transducer posteriorly after MCA/ACA evaluation usually represents flow signals from the PCOM.
Transorbital insonation
Although, no harmful effects have been reported with diagnostic TCD, the power output is reduced to 10% (or less than 17 mW/cm2) when the transorbital acoustic window is employed to evaluate the ophthalmic artery and the ICA siphon. The transducer is placed gently over the eyelid and it is angled slightly medial and upward. Flow signals at a depth of less than 60 mm, with a higher resistance pattern and toward the probe, represent the ophthalmic artery.
The sample volume has to be moved beyond a 60 mm depth to obtain signals from the ICA siphon. As the ICA siphon is a curved artery, the flow signals may be directed toward or away from the probe. Bidirectional signals may be obtained in some cases if the genu of the ICA siphon is insonated.
Suboccipital insonation
It is convenient to turn the patient to one side and place the transducer just below and medial to the mastoid process. The probe is directed slightly medially and more horizontally toward the bridge of the nose or contralateral eye. This orientation will permit obtaining the flow signals from the ipsilateral VA between the depths of 50 to 75 mm. The signals are always away from the probe.
The BA may be insonated through the sub-occipital window by ‘going with the flow’ in the ipsilateral VA, by turning the probe slightly upward and medially from the depths of 75 to 110 mm. The BA flow signals may also be obtained through the transforaminal window by placing the transducer just below the occipital protuberance and orientating it toward the nasal bridge. Similar to vertebral arteries, the flow from the BA is also away from the probe (blue on PMD screen and flow spectra below the baseline).
Flow directions and various depths of insonation of different intracranial arterial segments, in an average human skull, are shown in Figure 3.
Figure 3.
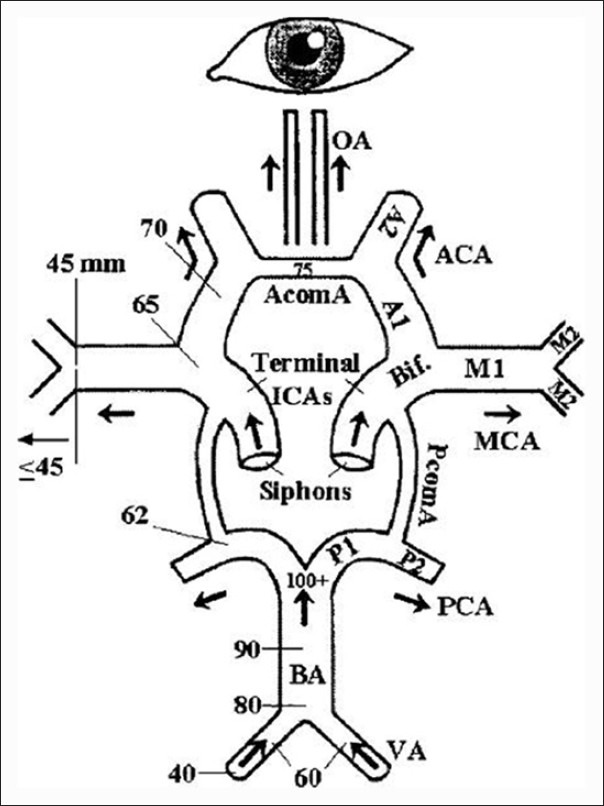
Line diagram showing the major intracranial arteries. Flow directions from various arterial segments and depths of insonation in an average human skull are shown. (Adopted with permission from 18,reference 17)
Doppler spectra
The Doppler spectral pattern provides important information about the flow characteristics in an arterial segment. Based on the spectral patterns in various adjacent intracranial arteries, cerebral hemodynamics in normal individuals as well as various disease states can be assessed.
The sample volume (SV) in TCD is usually large in reference to the diameter of the intracranial arteries (SV is 6-10 mm, diameter of MCA 3-5 mm). Hence, the Doppler spectra represent the flow velocities from the center as well as from all layers of the arterial lumen, often called as spectral broadening.
Normal spectral waveform
The normal spectral waveform shows a sharp systolic upstroke and stepwise deceleration with positive end-diastolic flow. The variables noted on typical TCD spectra [Figure 2b] are:
Peak systolic velocity (PSV in cm/s)
This is the first peak on a TCD waveform from each cardiac cycle. A rapid upstroke represents the absence of a severe stenotic lesion between the insonated intracranial arterial segment and heart.
End-diastolic velocity (EDV in cm/s)
The end-diastolic flow velocity (EDV) lies between 20 and 50% of the peak systolic velocity (PSV) values, indicating a low resistance intracranial arterial flow pattern, seen in all major intracranial arteries.
Mean flow velocity (MFV in cm/s)
The mean flow velocity is calculated as EDV plus one-third of the difference between PSV and EDV. MCA should have the highest MFV among all major intracranial arteries.
Pulsatility index (PI)
Flow resistance is usually assessed by PI, calculated by subtracting EDV from PSV and dividing the value by MFV. This is the most frequently used TCD parameter to determine the flow resistance. PI is independent of the angle of insonation, has no unit, and a value more than 1.2 represents high resistance blood flow.
Resistance index (RI)
The RI is another TCD parameter sometimes used to assess the flow resistance. It represents flow resistance distal to the site of insonation. RI is calculated by subtracting EDV from PSV and dividing the value by PSV. Any value below 0.75 is normal.
Systolic diastolic ratio (S/D)
Represents the ratio between PSV and EDV. This is not used for clinical purposes.
Heart rate (HR)
As HR might influence various flow parameters, it is an important variable noted on typical TCD spectra.
Spectrum with abnormal systolic flow acceleration
This spectrum is commonly seen distal to a proximal steno-occlusive lesion. The waveform shows delayed systolic flow acceleration, flattened systolic upstroke, and slow diastolic deceleration [Figure 4a]. EDV is usually more than 50% of PSV, due to compensatory distal vasodilatation. This Doppler spectrum is also called a blunted flow signal.
Figure 4.
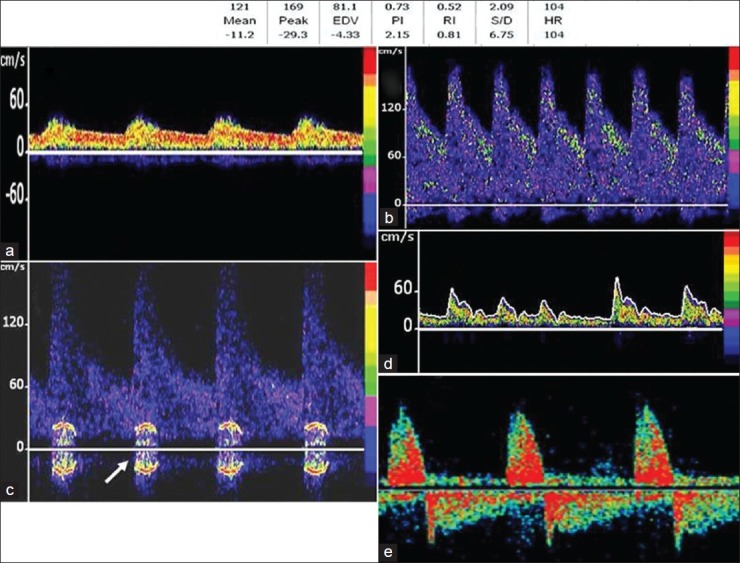
(a) bnormal spectral waveforms. Panel A-Note delayed systolic acceleration (blunted flow). Doppler spectra obtained in a patient with moderate (50%) stenosis of right MCA (b) shows elevated flow velocities-MFV >100. Panel (c) shows the flow spectra obtained in a patient with severe (>70%) stenosis of middle cerebral artery. The white arrow shows the flow turbulence (bruit). Spectra with irregular rhythm and flow velocities (d) are diagnostic of atrial fibrillation. Panel e - shows the characteristic alternating flow signals, suggestive of cerebral circulatory arrest
Stenotic spectrum
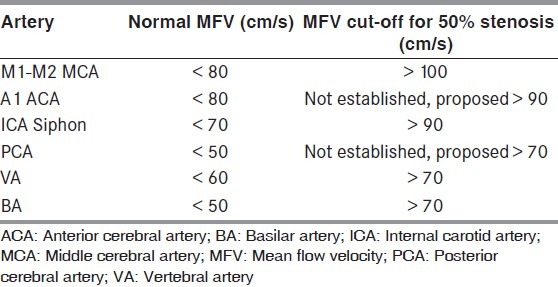
Diagnosis of intracranial stenosis is one of the most common indications for performing TCD in patients with cerebrovascular disease. A moderate (more than 50%) stenosis is diagnosed by focal flow acceleration [Figure 4b], with various diagnostic criteria, based on flow velocity cut-offs, for different arteries.[17] Focal stenosis increases the flow velocities in addition to creating flow turbulence, represented by the ‘bruit’, seen as a symmetrical artifact on either side of the baseline [Figure 4c]. The SONIA trial evaluated the performance of TCD against invasive angiography for identification of ≥50% intracranial stenosis[20] and demonstrated that TCD could reliably exclude the presence of intracranial stenosis (negative predictive value >80%). The following MFV cut-offs on TCD were used for identification of ≥50% stenosis (SONIA criteria) for MCA MFV >100 cm/s and VA / BA MFV >80cm/s. In recent times, Zhao et al. proposed novel criteria for intracranial stenosis ≥70% by defining stenotic / pre-stenotic ratio ≥3 on TCD that improved sensitivity and showed good agreement with invasive angiography.[21]
The commonly used cut-off values for the diagnosis of moderate (>50%) stenosis in various intracranial arteries are shown in Table 1.
Table 1.
Cut-off values for the diagnosis of moderate (>50%) stenosis in various intracranial arteries.
Spectrum with irregular rhythm
It is possible to identify cardiac rhythm abnormalities like atrial fibrillation by TCD as variable Doppler spectra and velocities [Figure 4d]. The cardiac cycle with the highest flow velocities is used for measurement of various parameters.
Cerebral-circulatory arrest (brain death)
Cerebral circulatory arrest is the hallmark of brain death, seen on TCD as varying from high-resistance to diastolic flow reversal (reverberating) to absent flow [Figure 4e]. TCD is often used as a supplementary test for the confirmation of brain death.
Conclusion
In this article we have described the basic ultrasound physics, insonation techniques, and normal and abnormal spectral wave forms. Advanced applications of TCD, like detection of right-to-left shunt, performing cerebral vasomotor reactivity, and detection of emboli during monitoring will be dealt with in the subsequent article (Part 2).
Footnotes
Source of Support: Nil
Conflict of Interest: Nil.
References
- 1.Aaslid R, Markwalder TM, Nornes H. Noninvasive transcranial Doppler ultrasound recording of flow velocity in basal cerebral arteries. J Neurosurg. 1982;57:769–74. doi: 10.3171/jns.1982.57.6.0769. [DOI] [PubMed] [Google Scholar]
- 2.Moehring MA, Spencer MP. Power M-mode transcranial Doppler ultrasound and simultaneous single gate spectrogram. Ultrasound Med Biol. 2002;28:49–57. doi: 10.1016/s0301-5629(01)00486-0. [DOI] [PubMed] [Google Scholar]
- 3.Martínez-Sánchez P, Serena J, Alexandrov AV, Fuentes B, Fernández-Domínguez J, Díez-Tejedor E. Update on ultrasound techniques for the diagnosis of cerebral ischemia. Cerebrovasc Dis. 2009;27:9–18. doi: 10.1159/000200437. [DOI] [PubMed] [Google Scholar]
- 4.Yeo LL, Sharma VK. Role of transcranial Doppler ultrasonography in cerebrovascular disease. Recent Pat CNS Drug Discov. 2010;5:1–13. doi: 10.2174/157488910789753576. [DOI] [PubMed] [Google Scholar]
- 5.Chernyshev OY, Garami Z, Calleja S, Song J, Campbell MS, Noser EA, et al. Yield and accuracy of urgent combined carotid/transcranial ultrasound testing in acute cerebral ischemia. Stroke. 2005;36:32–7. doi: 10.1161/01.STR.0000150496.27584.e3. [DOI] [PubMed] [Google Scholar]
- 6.Tsivgoulis G, Sharma VK, Lao AY, Malkoff MD, Alexandrov AV. Validation of transcranial Doppler with computed tomography angiography in acute cerebral ischemia. Stroke. 2007;38:1245–9. doi: 10.1161/01.STR.0000259712.64772.85. [DOI] [PubMed] [Google Scholar]
- 7.Belvís R, Leta RG, Martí-Fàbregas J, Cocho D, Carreras F, Pons-Lladó G, et al. Almost perfect concordance between simultaneous transcranial doppler and transesophageal echocardiography in the quantification of right-to left shunts. J Neuroimaging. 2006;16:133–8. doi: 10.1111/j.1552-6569.2006.00021.x. [DOI] [PubMed] [Google Scholar]
- 8.Lao AY, Sharma VK, Tsivgoulis G, Malkoff MD, Alexandrov AV, Frey JL. Effect of body positioning during transcranial doppler detection of right-to-left shunts. Eur J Neurol. 2007;14:1035–9. doi: 10.1111/j.1468-1331.2007.01879.x. [DOI] [PubMed] [Google Scholar]
- 9.Sharma VK, Tsivgoulis G, Ning C, Teoh HL, Bairaktaris C, Chong VF, et al. Role of multimodal evaluation of cerebral hemodynamics in selecting patients with symptomatic carotid or middle cerebral artery steno-occlusive disease for revascularization. J Vasc Interven Neurol. 2008;1:96–101. [PMC free article] [PubMed] [Google Scholar]
- 10.Adams R, McKie V, Nichols F, Carl E, Zhang DL, McKie K, et al. The use of transcranial ultrasonography to predict stroke in sickle cell disease. N Engl J Med. 1992;326:605–10. doi: 10.1056/NEJM199202273260905. [DOI] [PubMed] [Google Scholar]
- 11.Alexandrov AV, Molina CA, Grotta JC, Garami Z, Ford SR, Alvarez-Sabin J, et al. For the CLOTBUST Investigators. Ultrasound-enhanced systemic thrombolysis for acute ischemic stroke. N Engl J Med. 2004;351:2170–8. doi: 10.1056/NEJMoa041175. [DOI] [PubMed] [Google Scholar]
- 12.Sharma VK, Rathakrishnan R, Ong BK, Chan BP. Ultrasound assisted thrombolysis in acute ischemic stroke: A preliminary experience in Singapore. Ann Acad Med. 2008;37:778–82. [PubMed] [Google Scholar]
- 13.Alexandrov AV, Mikulik R, Ribo M, Sharma VK, Lao AY, Tsivgoulis G, et al. A pilot randomized clinical safety study osonothrombolysis augmentation with ultrasound-activated perflutren-lipid microspheres for acute ischemic stroke. Stroke. 2008;39:1464–9. doi: 10.1161/STROKEAHA.107.505727. [DOI] [PMC free article] [PubMed] [Google Scholar]
- 14.Edelman SK. Doppler in Understanding Ultrasound Physics. 3rd ed. Woodlands, Texas: ESP, Inc; 2007. pp. 293–328. [Google Scholar]
- 15.Kremkau FW. Part 1 Sonographic principles in Diagnostic Ultrasound: Principles and Instruments. 7th ed. Philadelphia: Saunders, Elsevier Publications; 2006. pp. 3–155. [Google Scholar]
- 16.Santalucia P, Feldman E. The basic transcranial Doppler examination: Technique and anatomy. In: Babikian VL, Wechsler LR, editors. Transcranial Doppler ultrasonography. 2nd ed. Boston, US: Butterworth Heinemann; 1999. pp. 3–12. [Google Scholar]
- 17.Alexandrov AA. Intracranial cerebrovascular ultrasound examination techniques in Cerebrovascular Ultrasound in Stroke Prevention and Treatment. 2nd ed. USA: Blackwell Publishing; 2011. pp. 13–25.pp. 81–129. [Google Scholar]
- 18.Alexandrov AV, Demchuk AM, Burgin WS. Insonation method and diagnostic flow signatures for transcranial power motion (M-mode) Doppler. J Neuroimaging. 2002;12:236–44. [PubMed] [Google Scholar]
- 19.Alexandrov AV, Sloan MA, Wong LK, Douville C, Razumovsky AY, Koroshetz WJ, et al. Practice standards for transcranial Doppler ultrasound: Part I-test performance. American Society of Neuroimaging Practice Guidelines Committee. J Neuroimaging. 2007;17:11–8. doi: 10.1111/j.1552-6569.2006.00088.x. [DOI] [PubMed] [Google Scholar]
- 20.Feldmann E, Wilterdink JL, Kosinski A, Lynn M, Chimowitz MI, Sarafin J, et al. The stroke outcomes and neuroimaging of intracranial atherosclerosis (SONIA) trial. Neurology. 2007;68:2099–106. doi: 10.1212/01.wnl.0000261488.05906.c1. [DOI] [PubMed] [Google Scholar]
- 21.Zhao L, Barlinn K, Sharma VK, Tsivgoulis G, Cava LF, Vasdekis SN, et al. Velocity criteria for intracranial stenosis revisited: An international multicenter study of transcranial Doppler and digital subtraction angiography. Stroke. 2011;42:3429–34. doi: 10.1161/STROKEAHA.111.621235. [DOI] [PubMed] [Google Scholar]


