

Abstract
Background
The direct thrombin inhibitor dabigatran etexilate (DE) may constitute a future replacement of vitamin K antagonists for long-term anticoagulation. Whereas warfarin pre-treatment is associated with greater hematoma expansion following intracerebral hemorrhage (ICH), it remains unclear what effect direct thrombin inhibitors would have. Using different experimental models of ICH, this study compared hematoma volume between DE treated mice, warfarin treated mice and controls.
Methods and Results
CD-1 mice were fed with DE or warfarin. Sham-treated mice served as controls. At the time point of ICH induction, DE mice revealed an increased activated partial thromboplastin time as compared to controls (46.1±5.0 vs. 18.0±1.5sec; p=0.022), whereas warfarin pre-treatment resulted in a prothrombin time prolongation (51.4±17.9 vs. 10.4±0.3sec; p<0.001). Twenty-four hours after collagenase-induced ICH formation, hematoma volume was 3.8±2.9μL in controls, 4.8±2.7μL in DE mice, and 14.5±11.8μL in warfarin mice (n=16; Welch's ANOVA between group differences p=0.007, post-hoc analysis with Dunnett's method: DE vs. controls, p=0.899; warfarin vs. controls, p<0.001; DE vs. warfarin, p=0.001). In addition, a model of laser-induced cerebral microhemorrhage was applied, and the distances which red blood cells and blood plasma were pushed into the brain were quantified. Warfarin mice showed enlarged red blood cell- and blood plasma diameters as compared to controls, but no difference was found between DE mice and controls.
Conclusions
In contrast to warfarin, pretreatment with DE did not increase hematoma volume in two different experimental models of ICH. In terms of safety, this observation may represent a potential advantage of anticoagulation with DE over warfarin.
Keywords: anticoagulants, cerebral microbleeds, intracerebral hemorrhage, warfarin, dabigatran, stroke
For decades, oral anticoagulation with vitamin K antagonists (e.g., warfarin) has been the gold standard for treatment and prophylaxis of thrombotic and thrombembolic disorders. Although highly effective in, for example, reducing the risk of cardioembolic brain infarction in patients with atrial fibrillation, the use of warfarin is associated with several shortcomings such as a narrow therapeutic window, the need for regular coagulation monitoring and critical food and drug interactions.1, 2 Furthermore, intracerebral hemorrhage (ICH) is the most feared complication of long-term anticoagulation with vitamin K antagonists. Both clinical and experimental studies revealed that anticoagulation associated ICH is a particularly severe type of stroke with short-term mortality rates exceeding 50%, due to increased hematoma volumes and prolonged bleeding.3-6
More recently, the search for alternative strategies for long-term anticoagulation was intensified, in order to overcome the problems associated with vitamin K antagonists.7, 8 Parenteral direct thrombin inhibitors such as lepirudin were shown to be at least as effective as heparin for treatment of patients with arterial and venous thrombosis.9 They bind to both the active site and the exosite 1 (bivalent binding) of the thrombin molecule, resulting in an irreversible thrombin inhibition. This irreversible inhibition is likely responsible for the increased bleeding risk associated with lepirudin as compared to heparin seen in several clinical trials.10 In contrast, the oral direct thrombin inhibitor Dabigatran etexilate (DE) binds reversibly only to the active site of the thrombin molecule. In the RE-LY trial, DE showed significantly reduced rates of stroke along with a favourable risk-benefit-profile as compared to warfarin in patients with non-valvular atrial fibrillation.11 DE has also been evaluated for the prophylaxis of thrombotic complications in patients undergoing total hip replacement.12 It is under investigation for the treatment of acute symptomatic venous thromboembolism2 and long-term secondary prevention of venous thromboembolism.13
Very limited information is available on the characteristics of ICH occurring during treatment with direct thrombin inhibitors.14 For both doses of DE used in the RE-LY trial, the incidence of intracranial bleeding was significantly lower than in the warfarin group.11 Still, bleeding risk increased dose-dependently. The influence of DE pretreatment on hematoma expansion and prognosis of ICH in comparison to warfarin remains undetermined. This study uses well-characterized animal models of ICH to investigate the influence of direct thrombin inhibition on hematoma volume and functional outcome.4, 5, 15
Methods
Animals
All experiments were conducted in accordance with the National Institute of Health's guide for the care and use of laboratory animals. For the entire study male CD-1 mice aged 12 to 16 weeks (mean body weight±SD: 39.6±2.5g) were used. Mice were subjected to antithrombotic pretreatment with DE, warfarin, lepirudin, heparin or fondaparinux, or received saline (as control). 89 mice were used for coagulation parameter determination, 146 mice underwent ICH induction by collagenase injection, and nine animals were subjected to the procedure of laser-mediated rupture of blood vessels to produce cortical microhemorrhages.
Pretreatment with antithrombotic medication
A DE tablet (110mg, Pradaxa, Boehringer Ingelheim, Ingelheim, Germany) was dissolved with 1% dimethylsulfoxide (DMSO) in saline solution. Solutions with three different DE concentrations were prepared: 10mg/ml, 20mg/ml, and 30mg/ml. DE mice were fed three times orally using a gastric tube with intervals of eight hours. Each feeding consisted of 0.15mL of the respective solution resulting in a dose of 37.5mg/kg, 75mg/kg or 112.5mg/kg body weight per feeding for a 40g mouse. Oral gavages of comparable dosages of DE were previously shown to cause significant activated partial thromboplastin time (aPTT) prolongation in rats.16 Control mice were fed three times with 0.15mL saline following the same modus of application. Determination of coagulation parameters or ICH induction by collagenase injection and laser-induced vessel rupture, respectively, was performed 0.5 hours after the last oral gavage of either DE or saline. In a subset of mice, multiple coagulation parameter analyses over time were performed, in order to determine the kinetics of DE anticoagulation. Furthermore, the effect of the solvent DMSO alone on coagulation parameters and ICH volume was determined.
Warfarin was applied via drinking water following a previously established protocol.4, 15 For mice with a body weight of 40g, a daily water consumption of 15mL/100g provided an estimated warfarin intake of 0.1mg (2.5mg/kg) within a 30 hour feeding period. Determination of coagulation parameters or ICH induction, respectively, was done at the end of the warfarin feeding period.
In addition, we treated mice with lepirudin (1.5mg/kg), heparin (80IU/kg), or fondaparinux (0.1mg/kg). Heparin inhibits thrombin indirectly by catalyzing its inactivation by antithrombin III. In addition, it inhibits factor Xa in complex with antithrombin III. As a selective factor Xa inhibitor, fondaparinux does not have direct effects on thrombin.17 Each agent was dissolved in saline (total volume 0.1mL) and administered by a single retro-orbital i.v. injection, immediately followed by a single subcutaneous injection of the same dose and volume. These doses were chosen according to the literature.18-20 Determination of coagulation parameters or ICH induction by collagenase injection, respectively, was done 0.5 hours after the subcutaneous application.
Ex vivo clotting times and quantitative factor assays
Whole blood (0.45mL) was collected from deeply anesthetized mice by cardiac puncture with a 19-gauge needle. Blood was transferred to plastic tubes containing 0.05mL of 3.2% citrate and was gently mixed. Specimens were centrifuged to obtain platelet-poor plasma. Measurements of prothrombin time (PT) and aPTT were performed on a MDA coagulation analyzer (Trinity Biotech, Berkeley Heights, NJ, USA) using MDA Simplastin HTF (Trinity Biotech) for the PT determination and MDA Platelin L (Trinity Biotech) for the aPTT measurements. For the diluted thrombin time (dTT), 100μL of MDA thrombin (Trinity Biotech) was added to 100μL of mouse plasma diluted 1:4 in normal human plasma. Activities of coagulation factors II, VII, IX, and X were determined using human factor-deficient plasmas (Precision Biologic, Dartmouth, Nova Scotia, Canada) with an aPTT reagent (Platelin L, Trinity Biotech) for factor IX and Simplastin HTF for the other factors on an MDA coagulation analyzer. Anti-Xa activity was determined with a Stachrom® Heparin-Assays (Diagnostic Stago) using a calibration curve for fondaparinux. All coagulation parameter measurements were performed in the coagulation laboratory at the Massachusetts General Hospital.
ICH induction by collagenase-injection
All procedures were performed in a blinded fashion. Animals were anesthetized with isoflurane (1.5% to 2.0%). To maintain similar circulation conditions, the deepness of anesthesia was adjusted by achieving a reduction of 50% in respiratory rate (ie. to 80-100 breaths per minute). After drilling a small burr hole, a 32-gauge 0.5μL injection needle (Hamilton 7000 series, Hamilton, Reno, NV, USA) was slowly lowered into the right striatum (stereotactic coordinates in relation to bregma: 0.0mm anterior, 2mm lateral, 3.5mm deep). Thereafter, 0.5μL of saline containing 0.2 or 0.25 units of collagenase VII-S (Sigma-Aldrich, St Louis, MO, USA) was administered over a period of 5 minutes. The needle was left in place for 10 minutes before it was slowly removed over a period of 5 minutes. The burr hole was sealed with bone wax and the scalp closed. The whole surgical procedure lasted around 35 minutes.4, 15 Body temperature was maintained using a heat lamp. Thereafter, animals were allowed to recover in their cages.
We calculated the required sample size for a two-tailed t-test based upon the experience of previous studies using the same model.4 For DE, an effect size (i.e. increase in ICH volume) of 25% vs. controls was assumed (8.8±1.9 vs. 7.0±1.5μL). For heparin, lepirudin and fondaparinux, an effect size of 35% vs. controls was assumed (9.5±2.0 vs. 7.0±1.5μL). 16 and 10 animals per group are required to detect this difference with a power (1 – β) of 0.8 and a level of acceptability of a false positive result (α) of 0.05, respectively.21
Outcome assessment
Twenty-four hours after ICH induction, neurological deficits were blindly rated on a 5-point scale (0-no apparent deficit, 1-slight instability while walking without circling, 2–circling towards the right with some straight movement, 3-heavy circling towards the right without straight movement or no movement at all, 4-deceased). In addition, a standard hanging wire test was performed. Mice were gently placed on the wire until they had achieved a firm grip with their paws. The period of time to falloff was recorded. A maximum of 60 seconds of hanging was allowed, and the test was repeated 3 times for every mouse. No presurgical training was performed.4, 15
Quantification of ICH volume
Following outcome assessment, mice underwent transcardial perfusion with 30mL of phosphate buffered saline (PBS) under deep (5%) isoflurane anesthesia. After removal and separation into left and right hemispheres, brains were placed into glass tubes containing 3mL PBS. Hematoma volume was quantified using a photometric assay.4, 15 Mice that died within 24 hours of ICH induction could not undergo transcardial perfusion before measurements. We determined 1.95±0.26μL to be the mean difference in intracerebral blood volume between three unperfused and three perfused brains (data not shown). Therefore, we subtracted 1.95μL from the total hematoma volume that was calculated for the unperfused brains of the dead mice.
Laser-mediated rupture of cerebral blood vessels under in vivo imaging
Bilateral chronic cranial windows (∼3 mm radius with center at stereotactic coordinates in relation to bregma: 3 mm posterior, 0 mm lateral) were implanted in mice (n=9). Ten days later, animals were blindly and randomly assigned to receive pretreatment with DE (dosage 75mg/kg, n=3), warfarin (n=3) or saline (control, n=3) as described above.
In preparation to induce a cortical microhemorrhage, mice were put under isofluorene anesthesia (∼2.0%). Body temperature was maintained at 37.5 °C with a heat blanket and a thermometer. A retro-orbital i.v. injection of 0.1mL of 5% (wt/vol) Texas-Red dextran (70kDa) fluorescent dye in physiological saline was given to label the vasculature. We imaged into the brain using in vivo two-photon excited fluorescence microscopy (excitation source: 1045nm, 1-MHz, 350-fs pulse train from a Yb-fiber oscillator/amplifier system; μJewel FCPA, IMRA America, Inc.; detection filter: 645/65nm Chroma filter). Bleeding was induced in two to five targeted penetrating arterioles per mouse by injuring the endothelium with tightly-focused femtosecond laser pulses as described elsewhere.22 The laser only causes damage at the focus (∼1μm2) leaving the surrounding regions intact. Microhemorrhage depth varied between 50 and 120μm beneath the cortical surface. The bleedings were separated from each other by at least 1mm. Before and immediately after (∼5 minutes) ICH induction, a stack of images was taken at the hemorrhage site with 2μm step size from brain surface to a depth of 150μm. The laser-induced hemorrhages are characterized by a core region filled with red blood cells (RBC) and a surrounding region where blood plasma penetrates into the parenchymal tissue. The RBC core appeared black, while blood plasma is bright, labelled by the Texas Red dye. To determine hemorrhage size, we measured the diameters of the RBC-filled microhemorrhage core and of the surrounding blood plasma-filled region from a 20μm z-projection of the stack images centered on the hemorrhage.
Statistical analysis
We used SPSS version 15.0 (SPSS Inc, Chicago, Ill), Matlab (The Mathworks Inc.) and JMP version 8.0 (SAS Institute Inc.) for statistical analysis. Lilliefors and Levene's tests were used to analyze data distribution and equality of variances. Comparison of coagulation parameters, hematoma volumes and diameters of the microhemorrhage regions between groups were performed using Welch's ANOVA and Dunnett's method. Statistical analysis of ordinal data (functional outcome) was performed using the Kruskal-Wallis-Test with Dunn's correction.
Results
Ex-vivo clotting times and quantitative factor assays
Control animals (n=4) revealed a mean (±SD) aPTT of 18.0±1.5 sec. DE pretreatment led to significant aPTT prolongation (46.1±5.0 sec in the 37.5mg/kg DE group; 55.7±19.6 sec in the 75mg/kg DE group; 85.8±20.0 sec in the 112.5mg/kg DE group; Welch's ANOVA between group differences p<0.001; post-hoc controls vs. DE 37.5mg/kg, p=0.022; controls vs. DE 75mg/kg, p=0.002; controls vs. DE 112.5mg/kg, p<0.001; n=4 per group; Fig. 1A). Figure 2 shows the kinetics of aPTT elevation over time for mice treated with different DE concentrations and controls (n=3 per group and time point). PT was only marginally influenced by DE pretreatment (10.4±0.3 sec in controls; 14.6±1.2 sec in the 37.5mg/kg DE group; 16.1±0.8 sec in the 75mg/kg DE group; 17.0±0.9 sec in the 112.5mg/kg DE group; n=3 per group; Fig. 1A). Also, DE pretreatment resulted in a pronounced dTT increase (22.9±3.9 sec in controls; 150.6±19.0 sec in the 37.5mg/kg DE group; 168.1±20.2 sec in the 75mg/kg DE group; 210.0±46.9 sec in the 112.5mg/kg DE group; n=3 per group; Welch's ANOVA between group differences p=0.002; post-hoc controls vs. DE 37.5mg/kg, p=0.001; controls vs. DE 75mg/kg, p<0.001; controls vs. DE 112.5mg/kg, p<0.001; Fig. 1A). Administering the solvent (1% DMSO in saline) alone did not significantly alter aPTT (18.7±1.9 sec, n=4) or PT (10.3±0.7 sec, n=4) in comparison to saline controls.
Figure 1.

A: Mean PT, aPTT and dTT values at the time point of ICH induction in controls as well as in warfarin-pretreated and in dabigatran etexilate (DE)-pretreated mice (3 different dosages). *p<0.05 as compared to controls, error bars indicate SD.
B: Mean coagulation factor activity (FII, FVII, FIX, FX; measured with human factor deficient plasma) for control mice as well as for mice pretreated with warfarin, DE (3 different dosages), or lepirudin. Factor IX activity was not determined in animals treated with DE or lepirudin.
Figure 2.
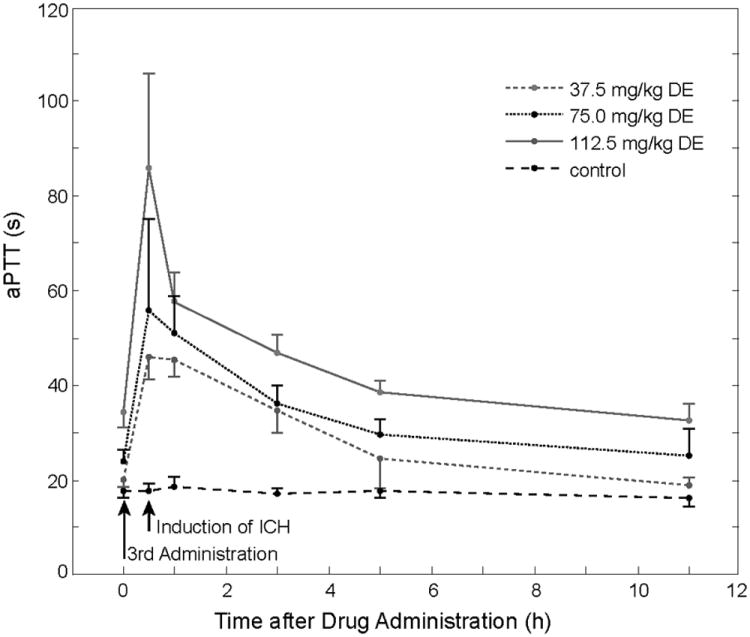
Mean aPTT prolongation over time in DE treated animals (3 different dosages) and in controls. Error bars indicate SD.
Warfarin pretreatment led to significant PT prolongation (51.4±17.9 sec, Welch's ANOVA between group differences p<0.001; post-hoc controls vs. warfarin, p<0.001; n=4 per group), whereas aPTT was only modestly increased (26.8±4.6 sec; Fig. 1A). After parenteral pretreatment with lepirudin, aPTT was prolonged to 40.4±4.7 sec, while heparin application led to an aPTT prolongation of 80.1±18.9 sec (n=3 per group; Welch's ANOVA between group differences p<0.001; post-hoc controls vs. lepirudin, p=0.019; controls vs. heparin, p<0.001). Anti-Xa activity after administering fondaparinux was increased as compared to controls (1.20±0.10mg/mL vs. 0.11±0.01mg/mL; controls vs. fondaparinux, p=0.001; n=3 per group).
Fig. 1B shows the results of quantitative coagulation factor assays (n=3 per group). Pretreatment with direct thrombin inhibitors (i.e. lepirudin, DE) reduced the activity of factor II, whereas factor VII and X remained largely unaffected. In warfarin-pretreated animals, all four vitamin K-dependent factors were significantly reduced.
Hematoma volume 24 hours after ICH induction
Twenty-four hours after ICH induction using 0.2U collagenase, mean hematoma volume was 3.8±2.9μL in controls, 4.8±2.7μL in the 37.5mg/kg DE group and 14.5±11.8μL in the group of animals that received warfarin treatment (n=16 per group; Welch's ANOVA between group differences p=0.007). Post-hoc analysis revealed no differences in ICH volume between DE treated mice and controls (p=0.899), but warfarin animals had significantly larger bleeds than both DE mice (p=0.001) and controls (p<0.001, Fig. 3A). We repeated the study using a higher concentration of DE (112.5 mg/kg) and an increased dosage of collagenase (0.25U). Now, mean hematoma volume was found to be 5.9±1.2μL in controls, 8.8±4.9μL in DE mice, and 14.2±8.0μL in warfarin mice (n=16 per group; Welch's ANOVA between group differences p<0.001). Again, post-hoc analysis did not show significant differences between DE mice and controls (p=0.237), but warfarin mice had significantly larger ICH volumes than both controls (p<0.001) and DE-treated mice (p=0.024, Fig. 3B). Pretreatment with the solvent (1% DMSO in saline) alone did not significantly affect ICH volume as compared to saline-treated controls (4.9±2.2μL vs. 5.1±2.8μL; n=5 per group)
Figure 3.
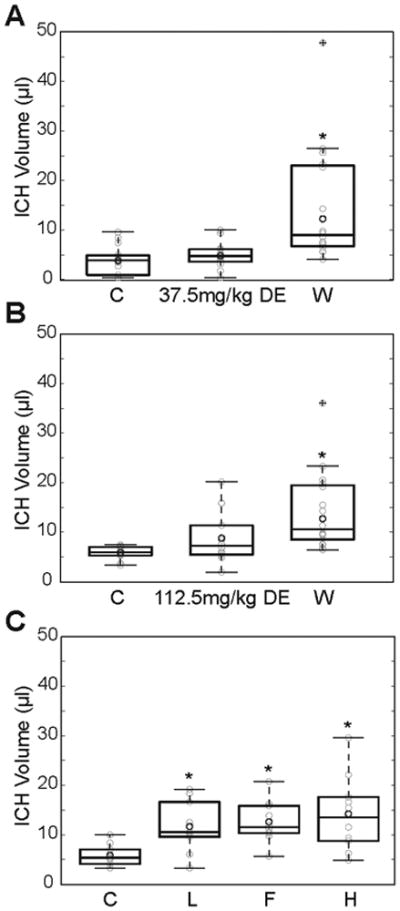
A: Hematoma volume 24 hours after ICH induction by collagenase injection in controls (C) and in mice pretreated with DE (37.5mg/kg) or warfarin (W, n=16 per group). The collagenase dosage in this experimental series was 0.2U. Data are displayed using box plots with the box indicating the median and the 25th and 75th percentile, respectively. Whiskers extend to the maximum and minimum values that are not outliers. Circles in light grey represent individual data points. Outliers have a cross imbedded in the circle. The dark grey circle represents mean without outliers. *p<0.05 as compared to controls.
B: Same as in panel A, but the DE dosage was increased to 112.5mg/kg and the collagenase dosage was increased to 0.25U.
C: Hematoma volume 24 hours after ICH induction by collagenase injection in controls (C) and in mice pretreated with lepirudin (L), fondaparinux (F) or heparin (H, n=10 per group).
Mice that were pretreated with lepirudin, heparin or fondaparinux showed significantly enlarged ICH volumes as compared to controls (lepirudin: 11.7±5.1μL, fondaparinux: 12.6±4.2μL, heparin: 14.2±7.7μL, controls: 5.9±2.1μL; Welch's ANOVA between group differences p<0.001, post-hoc controls vs. lepirudin, p=0.043; controls vs. fondaparinux, p=0.017; controls vs. heparin, p=0.003; n=10 per group; Fig. 3C).
Functional outcome 24h after ICH induction
Twenty-four hours after ICH induction using 0.2U collagenase, 2 out of 16 animals in the control group showed a worse functional outcome (score 3 or 4; i.e. heavy circling or death). This compares to 6 out of 16 mice in the DE group and to 11 out of 16 mice in the warfarin group (Fig. 4A). Repeating this experiment using the increased collagenase dosage and the higher DE concentration resulted in 3 out of 16 control mice, 6 out of 16 DE mice, and 11 out of 16 warfarin mice having a worse functional outcome (for both collagenase dosages: Kruskal Wallis between group differences p<0.01, post-hoc controls vs. warfarin p<0.05, controls vs. DE not significant; Fig. 4B). A higher rate of a worse functional outcome was observed in mice pretreated with lepirudin (6/10), fondaparinux (6/10) or heparin (8/10), respectively, as compared to controls (1/10; Fig. 4C). Fig. 4D-F show the results of the hanging wire tests. The proportion of warfarin-treated mice that fell off the wire within 29 sec was significantly higher compared with control animals (for both collagenase dosages: Kruskal Wallis between group differences p<0.05, post-hoc controls vs. warfarin p<0.05). For the DE groups, there were no significant differences as compared to controls.
Figure 4.

A: Functional outcome 24 hours after ICH induction using collagenase (0.2U) injection assessed using an ordinal neurological scale for controls (C) and for mice treated with DE (37.5mg/kg) or warfarin (W, n=16 per group).
B: Same setting as in A, but the DE dosage was increased to 112.5mg/kg and the collagenase dosage was increased to 0.25U.
C: Functional outcome in controls and in lepirudin-, fondaparinux- or heparin-pretreated mice.
D, E, F: Same treatments as in A, B, and C, respectively. Results of the hanging wire test are presented. The time period to falloff was recorded (3 attempts per mouse), and a maximum of 60 sec of hanging was allowed.
Laser-mediated rupture of cerebral blood vessels under in vivo imaging
A total number of 12 (control), 13 (DE treatment), and 13 (warfarin treatment) microhemorrhages were induced by rupturing targeted penetrating arterioles with tightly-focused femtosecond laser pulses (Fig. 5, n=3 mice per group, 2-5 microhemorrhages per mouse). None of the animals died during this procedure. Both the diameter of the RBC core and the diameter of the blood plasma filled region were larger for warfarin-pretreated mice than for controls and DE-treated animals (controls: 116.2±38.0μm and 327.8±80.4μm; DE mice: 108.1±35.2μm and 331.6±51.2μm; warfarin mice: 192.8±101.4μm and 467.5±113.6μm, respectively; Fig. 6A and 6B). The Welch's ANOVA between group differences for RBC- and blood plasma diameters were found significant (p=0.035 and p=0.003, respectively). Post-hoc analysis revealed no differences in RBC- and blood plasma diameters between DE-treated mice and controls (p=0.935 and p=0.991, respectively), but warfarin animals had significantly larger RBC and plasma diameters than both DE mice and controls (warfarin vs. DE p=0.008 and p<0.001, respectively; control vs. warfarin p=0.013 and p<0.001, respectively).
Figure 5.
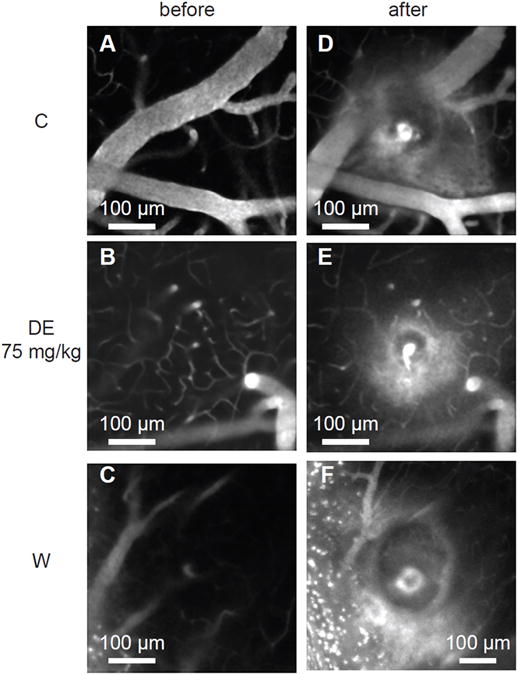
Projections of in-vivo two-photon excited fluorescence image stacks of fluorescently-labelled blood plasma spanning a 20-μm depth centered at the microhemorrhage origin. Image stacks are shown before and after rupturing the wall of a single penetrating arteriole using tightly focused femtosecond laser pulses. Representative examples from the three differently treated groups (saline-treated controls, DE 75mg/kg, warfarin) are shown. Extravasated plasma is visualized by diffuse fluorescence and can be seen in the post hemorrhage images in a halo surrounding the target vessel. The dark core immediately adjacent to the target vessel is filled with red blood cells.
Figure 6.
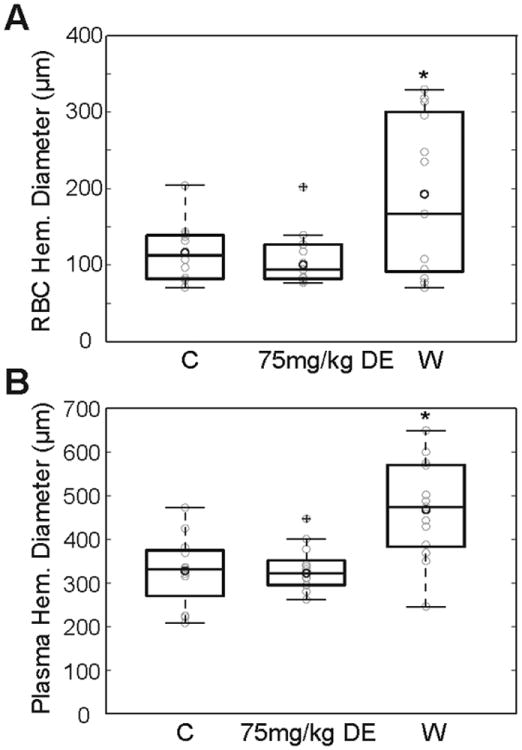
A: Diameter of red blood cell filled core after laser-induced microhemorrhage in controls (C) and in mice pretreated with DE (75mg/kg) or warfarin (W, n=12−13 microhemorrhages per group).
B: Diameter of plasma extravasation volume after laser-induced microhemorrhage for the same lesions shown in A.
Discussion
We investigated the effects of pretreatment with the direct thrombin inhibitor DE on hematoma volume and functional outcome using three different dosages in two different experimental models of ICH. As a positive control, the vitamin-K antagonist warfarin was also tested. Whereas warfarin anticoagulation led to increased hematoma volumes, DE mice did not differ from sham treated animals. Our study suggests that DE anticoagulation has much less devastating effects in the case of intracerebral bleeding as compared to warfarin anticoagulation.
Part of our investigation used the well-established mouse model of collagenase-induced ICH. Using this model, we have previously demonstrated that warfarin anticoagulation targeting international normalized ratio values between 2 and 4 leads to significantly larger hematoma volumes, prolonged bleeding and a worse functional outcome.4 Moreover, the rapid reversal of anticoagulation using prothrombin complex concentrates containing high amounts of coagulation factor II, VII, IX and X was shown to prevent excessive hematoma formation.15 The collagenase model of ICH is often criticized for not properly reflecting the arteriolar rupture that typically underlies human ICH, although the pathologic changes surrounding the collagenase-induced bleeding are comparable with those described in human ICH.23 In order to verify that our results were not an artefact related to the collagenase model itself, we repeated our study in a pathophysiologically different ICH model based on the laser-mediated (i.e. collagenase-independent) rupture of cerebral blood vessels under in vivo imaging.22 In contrast to the basal ganglia (“deep”) hematoma induced by collagenase application, the laser model provokes cerebral microhemorrhages around arterioles penetrating the cortex (“lobar”).
We tried to carefully monitor the status of anticoagulation after application of different doses of DE to mice via a gastric tube. Peak aPTT prolongation was determined to occur 0.5 hours after the 3rd DE feeding, and the aPTT was prolonged over a period of several hours. As hematoma formation in the collagenase model occurs within the first three hours after ICH-induction,5 the aPTT prolongation extends over this period of time. The same is true for the laser model, where microhemorrhage formation occurs within a minute after vessel rupture and the 2-5 microhemorrhages induced in each mouse can be completed within two hours. Despite a considerable effect on aPTT ranging from 2.6fold prolongation in the 37.5mg/kg DE group to a 4.8fold prolongation in the 112.5mg/kg DE group, only a minor effect of DE on the PT was detectable. This has been observed both in humans and in animals and confirms that PT is not appropriate for monitoring anticoagulant effects of DE.8, 16 While exhibiting a rather flattened dose-response curve at higher DE concentrations,8 the aPTT shows a linear relationship with the square root of the DE plasma concentration in studies investigating pharmacokinetics and pharmacodynamics of DE.24 Furthermore, the aPTT was reported to correlate well with DE-mediated antithrombotic activity in a rabbit model.16 The observed prolongation in our study up to a mean of 85.8 sec is greater than the mean aPTT determined in patients receiving 150mg DE twice daily.24 This was the highest dose examined in the RE-LY trial.11 Thus, we consider our study to mimic both the therapeutic range used in humans and supra-therapeutic dosages. Since the thrombin clotting time test directly assesses the activity of thrombin in the plasma sample, it is frequently considered to be superior over aPTT measurements for assessing the level of anticoagulation after DE therapy, due to a linear dose-response curve.8, 24 With dTT values up to 9.2 fold baseline, it was confirmed that our mouse model well reflects both moderate and strong DE anticoagulation.25 Regarding warfarin anticoagulation, oral feeding with warfarin via bottled drinking water led to a 4.9 fold PT prolongation. All four vitamin K dependent coagulation factors were found decreased at the time point of hematoma induction, mimicking full warfarin anticoagulation.15 The PT prolongation lies above the therapeutic range in humans. However, previous studies demonstrated that both therapeutic and supra-therapeutic dosages of warfarin led to significantly enlarged hematoma volumes as compared to control animals, while we could not demonstrate hematoma enlargement after DE pretreatment in both therapeutic and supratherapeutic ranges. 4, 5, 15
What might be the reasons why warfarin but not dabigatran anticoagulation leads to enlarged hematoma volumes in case of ICH? In vitro investigations revealed that deficiencies of the coagulation factors II, VII and X cause delayed clot initiation and affect clot propagation and clot strength. However, the presence of a small amount of factor II activity already resulted in clot initiation values similar to those in control plasma, whereas nearly every decrease of the factors VII and X further increased time to clot.26 In our in-vivo experiments, both the inactivation of factor II in combination with factor X after heparin treatment and the isolated inhibition of factor Xa with fondaparinux increased hematoma volumes after ICH induction as compared to control animals. Following the propagation phase of coagulation, the secondary thrombin burst leads to the activation of thrombin-activatable fibrinolysis inhibitor (TAFI), leading to down-regulation of fibrinolysis. Direct thrombin inhibitors fail to inhibit TAFI generation, while drugs that target factor Xa (fondaparinux, heparin and warfarin) enhance plasma fibrinolytic potential.27 This may contribute to their increased bleeding potential.
On the other hand, when comparing the isolated inhibition of factor II by the direct thrombin inhibitors DE and lepirudin, respectively, enlarged hematoma volumes were found only in the lepirudin-treated group. This implies that the modus of thrombin inhibition may be of crucial importance in this context. The thrombin molecule has three binding sites for the interaction with thrombin inhibitors, the active site and two exosites.7 Lepirudin as a bivalent direct thrombin inhibitor forms an irreversible complex with thrombin by binding to the active site and exosite 1. Both exosites are involved in promoting thrombin-mediated platelet activation.28 Asigned to the group of univalent direct thrombin inhibitors, DE blocks only the active site (but not the exosites) in a reversible manner. Thus, DE-inhibited thrombin is still able to contribute to platelet activation and aggregation.29 Furthermore, even with an inhibited active site, the exosite 1 still allows thrombin to enhance fibrin polymerization by bridging between fibrinogen molecules.30 This effect is diminished by the bivalent binding of hirudines.31
In contrast, bivalent binding to both the active site and the exosite 1 of the thrombin molecule results in an irreversible bond. In ex vivo experimental investigations, Lepirudin treatment strongly delayed the lag phase of thrombin generation and thereby the initiation of coagulation. This was not observed with argatroban, another reversible thrombin inhibitor, which mainly affected the propagation phase by reducing the endogenous thrombin potential.32 Determination of thrombin activity after induction of thrombin generation by tissue factor revealed a similar delaying effect of lepirudin therapy, while argatroban increased the peak levels of thrombin. Thrombin, reversibly released from its complex with argatroban in the subsampling procedure, has been assumed to contribute to this finding.33
Our results indicate that an isolated decrease in factor II activity by DE-mediated univalent, reversible thrombin inhibition may still result in sufficient hemostasis in the scenario of ICH. Our pathophysiological hypothesis is supported by other animal studies that observed a bleeding time prolongation after DE therapy only at supra-therapeutic doses.16 In addition, a dissociation between antithrombotic efficacy and absence of bleeding time prolongation was reported in studies using different oral thrombin inhibitors.34-36
In the RE-LY trial, incidence rates of ICH in DE treated patients were found to be reduced as compared to warfarin treated patients, despite a similar rate of antithrombotic efficiency. It was speculated that this finding is linked to the decrease of other vitamin K dependent coagulation factors (other than factor II) in case of warfarin anticoagulation and their contribution to hemostasis, while DE does not directly affect parameters other than factor II.11 Our experimental study investigating the behaviour of laser-induced cerebral microbleeds after DE and warfarin pretreatment provides a more detailed insight: Microhemorrhages induced in warfarin-treated mice more often expand towards having increased RBC- and blood plasma diameters, whereas microbleeds in DE mice do not differ from controls. Thus, we may speculate that in the RE-LY trial, the absolute number of cerebral micobleeds occurring under oral anticoagulants was similar in the warfarin and the dabigatran group, but that microhemorrhages under warfarin more often expanded towards symptomatic ICH.37, 38
The clinical implication of our findings is manifold: Intracerebral bleeding occurring during warfarin treatment is particularly severe, with short-term mortality rates of 50%.3 Clinical and experimental data have shown that hematoma expansion is prolonged in the case of warfarin anticoagulation, thus leading to larger hematoma volumes and a worse functional outcome.3-6 In warfarin-associated ICH, measures to rapidly reverse anticoagulation may prevent such prolonged bleeding and may improve functional outcome.3, 6, 15 Our data suggest that DE anticoagulation does not facilitate ongoing bleeding and extensive hematoma growth. It is likely that this is mirrored by better prognosis as well. As a caveat, one may assume that factor II activity decreases with increasing DE dosages. Thus, there may be insufficient hemostasis above a critical dose. As DE is mainly cleared renally, an impaired renal function may lead to drug accumulation and to supra-therapeutic concentrations.7 Indeed, increased numbers of bleeding events have been observed in patients with impaired renal function in a dose escalation study of DE.39
Some important shortcomings of the present study should be mentioned. First, the murine coagulation system has been reported to be similar to the human coagulation system, both physiologically and with regard to the used coagulation tests.40 However, there are differences in the molecular structure between mouse and human coagulation factors, and the impact of these differences in the setting of the present study is not yet defined.41 Thus, one must be cautious in translating our findings into the human setting, and clinical data may be warranted. However, in this context it is important to mention that an animal model is most likely the only way to reasonably test in a randomized design whether DE pretreatment increases ICH volume as compared to controls. Among more than 12 000 patients receiving DE in the RE-LY trial, only 0.1% per year developed ICH. Considering the large number of patients needed to sufficiently adjust for confounding variables, it appears practically impossible to address this question in a clinical trial.11, 42 Second, all antithrombotic drug applications led to well reproducible effects on coagulation measures. Nevertheless, since coagulation tests were not performed in the same animals that undergo ICH induction, we were not able to directly correlate the results of the coagulation measurements with ICH volume and functional outcome. In addition, it is not possible to directly compare the level of anticoagulation after DE- and warfarin pretreatment by means of coagulation parameters, since coagulation tests respond differently to these drugs. Third, we used 1% DMSO for dissolving the DE tablet. Although the resulting DE solution produced prolonged aPTT and dTT, we cannot completely rule out an interaction between DMSO and DE that may have influenced our results. However, we found no effects of a 1% DMSO gavage alone on both coagulation parameters and ICH volumes.
In summary, our experimental study suggests that cerebral hemorrhages occurring during DE treatment are smaller and less harmful than those under warfarin anticoagulation. In terms of safety, this may represent a potential advantage of the direct thrombin inhibitor DE over warfarin.
Commentary.
The direct thrombin inhibitor dabigatran was recently approved for long-term prophylaxis of thrombembolic events in patients with atrial fibrillation. For this indication, the RE-LY trial revealed a favorable benefit-risk profile for dabigatran as compared to the “gold standard” warfarin. Intracerebral hemorrhage (ICH) is the most feared complication of long-term anticoagulation. Whereas warfarin pre-treatment leads to largely increased hematoma volumes and higher mortality rates as compared to ICH occurring in non-anticoagulated patients, no such data are available for dabigatran anticoagulation. In two animal models of ICH, we found no differences in terms of hematoma volume between dabigatran-treated mice and controls, whereas warfarin anticoagulation dramatically worsened ICH volume. On a molecular level, warfarin vastly reduced activity levels of coagulation factors II, VII, IX and X, but dabigatran reversibly inhibited the active site of factor II only, still allowing sufficient coagulation induction to prevent extensive hematoma enlargement. If confirmed in humans, our findings may represent a significant safety advantage of dabigatran anticoagulation over warfarin. Further study is warranted to determine if rapid anticoagulation reversal, e.g. by means of prothrombin complex concentrates, is not necessary for ICH occurring during dabigatran treatment.
Acknowledgments
none
Funding Sources: This work was partially supported by grants from the National Institutes of Health (EB002019 to CBS, R37-NS37074, R01-NS56458, P01-NS55104 to EHL)
We did not receive industrial funding for performing this study.
Footnotes
Conflicts of Interest/Disclosures: None
References
- 1.Barnes GD, Froehlich JB. Anticoagulation: where we are and where we need to go. Journal of Thrombosis and Thrombolysis. 2009;28:220–223. doi: 10.1007/s11239-008-0256-4. [DOI] [PubMed] [Google Scholar]
- 2.Schulman S, Kearon C, Kakkar AK, Mismetti P, Schellong S, Eriksson H, Baanstra D, Schnee J, Goldhaber SZ. Dabigatran versus warfarin in the treatment of acute venous thromboembolism. The New England Journal of Medicine. 2009;361:2342–2352. doi: 10.1056/NEJMoa0906598. [DOI] [PubMed] [Google Scholar]
- 3.Aguilar MI, Hart RG, Kase CS, Freeman WD, Hoeben BJ, Garcia RC, Ansell JE, Mayer SA, Norrving B, Rosand J, Steiner T, Wijdicks EF, Yamaguchi T, Yasaka M. Treatment of warfarin-associated intracerebral hemorrhage: literature review and expert opinion. Mayo Clinic Proceedings. 2007;82:82–92. doi: 10.4065/82.1.82. [DOI] [PubMed] [Google Scholar]
- 4.Foerch C, Arai K, Jin G, Park KP, Pallast S, van Leyen K, Lo EH. Experimental model of warfarin-associated intracerebral hemorrhage. Stroke. 2008;39:3397–3404. doi: 10.1161/STROKEAHA.108.517482. [DOI] [PMC free article] [PubMed] [Google Scholar]
- 5.Illanes S, Zhou W, Heiland S, Markus Z, Veltkamp R. Kinetics of hematoma expansion in murine warfarin-associated intracerebral hemorrhage. Brain Research. 2010;1320:135–142. doi: 10.1016/j.brainres.2010.01.015. [DOI] [PubMed] [Google Scholar]
- 6.Steiner T, Rosand J, Diringer M. Intracerebral hemorrhage associated with oral anticoagulant therapy: current practices and unresolved questions. Stroke. 2006;37:256–262. doi: 10.1161/01.STR.0000196989.09900.f8. [DOI] [PubMed] [Google Scholar]
- 7.Di Nisio M, Middeldorp S, Buller HR. Direct thrombin inhibitors. The New England Journal of Medicine. 2005;353:1028–1040. doi: 10.1056/NEJMra044440. [DOI] [PubMed] [Google Scholar]
- 8.van Ryn J, Stangier J, Haertter S, Liesenfeld KH, Wienen W, Feuring M, Clemens A. Dabigatran etexilate--a novel, reversible, oral direct thrombin inhibitor: interpretation of coagulation assays and reversal of anticoagulant activity. Thrombosis and Haemostasis. 2010;103:1116–1127. doi: 10.1160/TH09-11-0758. [DOI] [PubMed] [Google Scholar]
- 9.Adkins JC, Wilde MI. Lepirudin: a review of its potential place in the management of thrombotic disorders. BioDrugs. 1998;10:227–255. doi: 10.2165/00063030-199810030-00006. [DOI] [PubMed] [Google Scholar]
- 10.Nutescu EA, Shapiro NL, Chevalier A. New anticoagulant agents: direct thrombin inhibitors. Cardiology Clinics. 2008;26:169–187. V–VI. doi: 10.1016/j.ccl.2007.12.005. [DOI] [PubMed] [Google Scholar]
- 11.Connolly SJ, Ezekowitz MD, Yusuf S, Eikelboom J, Oldgren J, Parekh A, Pogue J, Reilly PA, Themeles E, Varrone J, Wang S, Alings M, Xavier D, Zhu J, Diaz R, Lewis BS, Darius H, Diener HC, Joyner CD, Wallentin L. Dabigatran versus warfarin in patients with atrial fibrillation. The New England Journal of Medicine. 2009;361:1139–1151. doi: 10.1056/NEJMoa0905561. [DOI] [PubMed] [Google Scholar]
- 12.Eriksson BI, Dahl OE, Rosencher N, Kurth AA, van Dijk CN, Frostick SP, Prins MH, Hettiarachchi R, Hantel S, Schnee J, Buller HR. Dabigatran etexilate versus enoxaparin for prevention of venous thromboembolism after total hip replacement: a randomised, double-blind, non-inferiority trial. Lancet. 2007;370:949–956. doi: 10.1016/S0140-6736(07)61445-7. [DOI] [PubMed] [Google Scholar]
- 13.Lee CJ, Badhwar G, Ansell JE. Oral IIa inhibitors. Hematology/Oncology Clinics of North America. 2010;24:739–753. IX. doi: 10.1016/j.hoc.2010.05.001. [DOI] [PubMed] [Google Scholar]
- 14.Crowther MA, Warkentin TE. Managing bleeding in anticoagulated patients with a focus on novel therapeutic agents. J Thromb Haemost. 2009;7(1):107–110. doi: 10.1111/j.1538-7836.2009.03429.x. [DOI] [PubMed] [Google Scholar]
- 15.Foerch C, Arai K, Van Cott EM, van Leyen K, Lo EH. Rapid reversal of anticoagulation reduces hemorrhage volume in a mouse model of warfarin-associated intracerebral hemorrhage. J Cereb Blood Flow Metab. 2009;29:1015–1021. doi: 10.1038/jcbfm.2009.27. [DOI] [PMC free article] [PubMed] [Google Scholar]
- 16.Wienen W, Stassen JM, Priepke H, Ries UJ, Hauel N. Effects of the direct thrombin inhibitor dabigatran and its orally active prodrug, dabigatran etexilate, on thrombus formation and bleeding time in rats. Thrombosis and Haemostasis. 2007;98:333–338. [PubMed] [Google Scholar]
- 17.Alban S. From heparins to factor Xa inhibitors and beyond. European Journal of Clinical Investigation. 2005;35(1):12–20. doi: 10.1111/j.0960-135X.2005.01452.x. [DOI] [PubMed] [Google Scholar]
- 18.Hull RD, Raskob GE, Brant RF, Pineo GF, Valentine KA. Relation between the time to achieve the lower limit of the aPTT therapeutic range and recurrent venous thromboembolism during heparin treatment for deep vein thrombosis. Archives of Internal Medicine. 1997;157:2562–2568. [PubMed] [Google Scholar]
- 19.Schiele F, Lindgaerde F, Eriksson H, Bassand JP, Wallmark A, Hansson PO, Grollier G, Sjo M, Moia M, Camez A, Smyth V, Walker M. Subcutaneous recombinant hirudin (HBW 023) versus intravenous sodium heparin in treatment of established acute deep vein thrombosis of the legs: a multicentre prospective dose-ranging randomized trial. International Multicentre Hirudin Study Group. Thrombosis and Haemostasis. 1997;77:834–838. [PubMed] [Google Scholar]
- 20.Shorr AF. The pharmacoeconomics of deep vein thrombosis treatment. The American Journal of Medicine. 2007;120(10 Suppl 2):S35–41. doi: 10.1016/j.amjmed.2007.08.012. [DOI] [PubMed] [Google Scholar]
- 21. [last accessed July 1st, 2011];A-priori sample size calculation. http://www.danielsoper.com/statcalc/calc47.aspx.
- 22.Nishimura N, Schaffer CB, Friedman B, Tsai PS, Lyden PD, Kleinfeld D. Targeted insult to subsurface cortical blood vessels using ultrashort laser pulses: three models of stroke. Nature Methods. 2006;3:99–108. doi: 10.1038/nmeth844. [DOI] [PubMed] [Google Scholar]
- 23.Rosenberg GA, Mun-Bryce S, Wesley M, Kornfeld M. Collagenase-induced intracerebral hemorrhage in rats. Stroke. 1990;21:801–807. doi: 10.1161/01.str.21.5.801. [DOI] [PubMed] [Google Scholar]
- 24.Stangier J, Stahle H, Rathgen K, Fuhr R. Pharmacokinetics and pharmacodynamics of the direct oral thrombin inhibitor dabigatran in healthy elderly subjects. Clinical Pharmacokinetics. 2008;47:47–59. doi: 10.2165/00003088-200847010-00005. [DOI] [PubMed] [Google Scholar]
- 25.Love JE, Ferrell C, Chandler WL. Monitoring direct thrombin inhibitors with a plasma diluted thrombin time. Thrombosis and Haemostasis. 2007;98:234–242. [PubMed] [Google Scholar]
- 26.Nielsen VG, Cohen BM, Cohen E. Effects of coagulation factor deficiency on plasma coagulation kinetics determined via thrombelastography: critical roles of fibrinogen and factors II, VII, X and XII. Acta Anaesthesiologica Scandinavica. 2005;49:222–231. doi: 10.1111/j.1399-6576.2005.00602.x. [DOI] [PubMed] [Google Scholar]
- 27.Lisman T, Adelmeijer J, Nieuwenhuis HK, de Groot PG. Enhancement of fibrinolytic potential in vitro by anticoagulant drugs targeting activated factor X, but not by those inhibiting thrombin or tissue factor. Blood Coagul Fibrinolysis. 2003;14:557–562. doi: 10.1097/00001721-200309000-00007. [DOI] [PubMed] [Google Scholar]
- 28.De Candia E, Hall SW, Rutella S, Landolfi R, Andrews RK, De Cristofaro R. Binding of thrombin to glycoprotein Ib accelerates the hydrolysis of Par-1 on intact platelets. The Journal of Biological Chemistry. 2001;276:4692–4698. doi: 10.1074/jbc.M008160200. [DOI] [PubMed] [Google Scholar]
- 29.Celikel R, McClintock RA, Roberts JR, Mendolicchio GL, Ware J, Varughese KI, Ruggeri ZM. Modulation of alpha-thrombin function by distinct interactions with platelet glycoprotein Ibalpha. Science. 2003;301:218–221. doi: 10.1126/science.1084183. [DOI] [PubMed] [Google Scholar]
- 30.Mosesson MW, Hernandez I, Siebenlist KR. Evidence that catalytically-inactivated thrombin forms non-covalently linked dimers that bridge between fibrin/fibrinogen fibers and enhance fibrin polymerization. Biophysical Chemistry. 2004;110:93–100. doi: 10.1016/j.bpc.2004.01.007. [DOI] [PubMed] [Google Scholar]
- 31.Kaminski M, Siebenlist KR, Mosesson MW. Evidence for thrombin enhancement of fibrin polymerization that is independent of its catalytic activity. The Journal of Laboratory and Clinical medicine. 1991;117:218–225. [PubMed] [Google Scholar]
- 32.Robert S, Ghiotto J, Pirotte B, David JL, Masereel B, Pochet L, Dogne JM. Is thrombin generation the new rapid, reliable and relevant pharmacological tool for the development of anticoagulant drugs? Pharmacol Res. 2009;59:160–166. doi: 10.1016/j.phrs.2008.12.003. [DOI] [PubMed] [Google Scholar]
- 33.Mohri M, Sugimoto E, Sata M, Asano T. The inhibitory effect of recombinant human soluble thrombomodulin on initiation and extension of coagulation--a comparison with other anticoagulants. Thrombosis and Haemostasis. 1999;82:1687–1693. [PubMed] [Google Scholar]
- 34.Lorrain J, Millet L, Lechaire I, Lochot S, Ferrari P, Visconte C, Sainte-Marie M, Lunven C, Berry CN, Schaeffer P, Herbert JM, O'Connor SE. Antithrombotic properties of SSR182289A, a new, orally active thrombin inhibitor. The Journal of Pharmacology and Experimental Therapeutics. 2003;304:567–574. doi: 10.1124/jpet.102.044610. [DOI] [PubMed] [Google Scholar]
- 35.Perzborn E, Strassburger J, Wilmen A, Pohlmann J, Roehrig S, Schlemmer KH, Straub A. In vitro and in vivo studies of the novel antithrombotic agent BAY 59-7939--an oral, direct Factor Xa inhibitor. J Thromb Haemost. 2005;3:514–521. doi: 10.1111/j.1538-7836.2005.01166.x. [DOI] [PubMed] [Google Scholar]
- 36.Rodgers RP, Levin J. A critical reappraisal of the bleeding time. Seminars in Thrombosis and Hemostasis. 1990;16:1–20. doi: 10.1055/s-2007-1002658. [DOI] [PubMed] [Google Scholar]
- 37.Flaherty ML. Anticoagulant-associated intracerebral hemorrhage. Seminars in Neurology. 2010;30:565–572. doi: 10.1055/s-0030-1268866. [DOI] [PubMed] [Google Scholar]
- 38.Lee GH, Kwon SU, Kang DW. Warfarin-induced intracerebral hemorrhage associated with microbleeds. Journal of Clinical Neurology. 2008;4:131–133. doi: 10.3988/jcn.2008.4.3.131. [DOI] [PMC free article] [PubMed] [Google Scholar]
- 39.Eriksson BI, Dahl OE, Ahnfelt L, Kalebo P, Stangier J, Nehmiz G, Hermansson K, Kohlbrenner V. Dose escalating safety study of a new oral direct thrombin inhibitor, dabigatran etexilate, in patients undergoing total hip replacement: BISTRO I. J Thromb Haemost. 2004;2:1573–1580. doi: 10.1111/j.1538-7836.2004.00890.x. [DOI] [PubMed] [Google Scholar]
- 40.Tsang VC, Wyatt CR, Damian RT. Comparative thermometric coagulation studies of plasmas from normal outbred Swiss Webster mice and persons. American Journal of Veterinary Research. 1979;40:857–862. [PubMed] [Google Scholar]
- 41.Tsakiris DA, Scudder L, Hodivala-Dilke K, Hynes RO, Coller BS. Hemostasis in the mouse (Mus musculus): a review. Thrombosis and Haemostasis. 1999;81:177–188. [PubMed] [Google Scholar]
- 42.Flaherty ML, Adeoye O, Sekar P, Haverbusch M, Moomaw CJ, Tao H, Broderick JP, Woo D. The challenge of designing a treatment trial for warfarin-associated intracerebral hemorrhage. Stroke. 2009;40:1738–1742. doi: 10.1161/STROKEAHA.108.538462. [DOI] [PMC free article] [PubMed] [Google Scholar]