

Abstract
Heparan sulfate proteoglycans are hypothesized to contribute to the filtration barrier in kidney glomeruli and the glycocalyx of endothelial cells. To investigate potential changes in proteoglycans in diabetic kidney, we isolated glycosaminoglycans from kidney cortex from healthy db/+ and diabetic db/db mice. Disaccharide analysis of chondroitin sulfate revealed a significant decrease in the 4-O-sulfated disaccharides (D0a4) from 65% to 40%, whereas 6-O-sulfated disaccharides (D0a6) were reduced from 11% to 6%, with a corresponding increase in unsulfated disaccharides. In contrast, no structural differences were observed in heparan sulfate. Furthermore, no difference was found in the molar amount of glycosaminoglycans, or in the ratio of hyaluronan/heparan sulfate/chondroitin sulfate. Immunohistochemical staining for the heparan sulfate proteoglycan perlecan was similar in both types of material but reduced staining of 4-O-sulfated chondroitin and dermatan was observed in kidney sections from diabetic mice. In support of this, using qRT-PCR, a 53.5% decrease in the expression level of Chst-11 (chondroitin 4-O sulfotransferase) was demonstrated in diabetic kidney. These results suggest that changes in the sulfation of chondroitin need to be addressed in future studies on proteoglycans and kidney function in diabetes.
Keywords: chondroitin sulfate, diabetes, disaccharides, heparan sulfate, HPLC, immunohistochemistry, nephropathy, proteoglycan
In the kidney, the filtration of blood and the formation of urine is a complex process. Cell surface components on both endothelial cells and podocytes, as well as the extracellular matrix (ECM) components in basement membranes (BMs), play important roles in the function of glomeruli, tubules, and the tubulointerstitial space (Kolset et al. 2012). Early animal experiments demonstrated that the glomerular BM is an important filtration barrier (Farquhar et al. 1961), and later it was shown that heparan sulfate (HS) proteoglycans (PGs) are part of this BM (Kanwar and Farquhar 1979). Studies showed that native ferritin reached the urinary space in perfused kidney after removal of HSPGs with heparinase treatment (Kanwar et al. 1980), suggesting that HSPGs have functions related to kidney filtration.
PGs are proteins with covalently attached glycosaminoglycan (GAG) chains of alternating disaccharides containing glucuronic or iduronic acid and the hexosamine units N-acetylglucosamine (GlcNAc) in HS or N-acetylgalactosamine (GalNAc) in chondroitin sulfate (CS). These units are modified during biosynthesis by epimerases and N-and O-sulfotransferases at distinct positions, resulting in polyanionic GAG chains with a high degree of structural diversity (Kjellén and Lindahl 1991; Esko and Selleck 2002). It is believed that HSPGs contribute to the dense distribution of negative charges in kidney BMs, thus preventing serum proteins such as albumin from passing from the circulation into the urinary space. Several studies have addressed this hypothesis. Injecting a monoclonal antibody against HS epitopes resulted in proteinuria in rats (Van den Born et al. 1992). Furthermore, collagen XVIII-deficient mice had expanded glomerular BMs and increased serum creatinine, suggesting that kidney filtration was affected (Utriainen et al. 2004). Also, when the attachment region for HS chains in domain 1 in perlecan was deleted, mice with this altered perlecan gene developed proteinuria (Morita et al. 2005). In human studies, biopsies from patients with diabetic nephropathy showed decreased staining for agrin and HS epitopes (Yard et al. 2001).
The importance of HSPGs for kidney filtration has, however, been questioned in several studies. Knock-out of agrin in podocytes did not result in proteinuria (Harvey et al. 2007). Also, knocking out the HS polymerase system (exostosin-1, EXT1) in podocytes affected cellular morphology, but was not accompanied by albuminuria (Chen et al. 2008). The complexity of this issue has been reviewed (Raats et al. 2000; Kanwar et al. 2007) and debated (Morita et al. 2008) and concerns several factors that contribute to kidney filtration, such as nephrin slits and the glycocalyx on endothelial cells. Changes in HSPGs in the tubulointerstitial space also contribute to proteinuria (Celie et al. 2008). It is of interest to note that mutating an enzyme important for sialylation of podocalyxin resulted in hyposialylation and proteinuria (Galeano et al. 2007), highlighting the importance of other negatively charged components rather than PGs in kidney filtration.
The major part of GAGs in adult kidney is HS, but in the embryonic kidney, the amount of CS can be as high as 75% (Steer et al. 2004), demonstrating the potential for GAG changes in the kidney, depending on external signals. It has also been demonstrated that the BM contains CSPGs (McCarthy et al. 1993), which can be important for the filtering process (Jeansson and Haraldsson 2003).
Some studies suggest that changes in the sulfation patterns of kidney HSPGs in diabetes can be due to increased local levels of heparanase (Wijnhoven et al. 2008) or changes in the regulation of sulfatases (Schumacher et al. 2011); increased levels of heparanase have been demonstrated in the blood of patients with diabetes, which might contribute to the development of kidney complications (Shafat et al. 2011).
Comparisons of HS structures in kidney or other tissues from diabetic and control animals have been made in some studies. Early studies showed that HSPGs from livers and cartilage explants from diabetic rats were less sulfated than control material (Kjellén et al. 1983; Unger et al. 1991). In contrast, no changes in HS structure were observed in a recent study using livers from diabetic mice (Bishop et al. 2010). Also, glomerular HS structure in diabetic rats was not affected (Van den Born et al. 2006). However, another study focusing on kidney HS showed that the larger glomeruli in kidneys from diabetic rats had a lower degree of N-sulfation when compared to controls (Lauer et al. 2007).
Few studies have focused on CS/DS (dermatan sulfate) changes in the diabetic kidney. In diabetic rats, a decrease in CS/DS content of kidneys was observed, accompanied by a decrease in the content of the highly sulfated 4,6-O-disulfated (D0a10) disaccharide (Joladarashi et al. 2011).
To investigate further the possible relationship between diabetes and structural changes in HS and CS/DS in the kidney, we isolated these GAGs from the cortex of kidneys taken from the diabetic mouse strain db/db and their nondiabetic controls, db/+ mice. Results presented show that HS structures were not different in kidneys from the two mouse strains, whereas a relative decrease in the sulfation of CS could be demonstrated in kidneys from db/db mice when compared to db/+ controls. These findings suggest that kidney CS undergoes significant changes that should be taken into consideration when appraising the possible importance of PG changes in the diabetic kidney.
Materials and Methods
Animals
Kidneys obtained from db/db diabetic mice and their db/+ nondiabetic heterozygote littermates were snap-frozen or fixed in a Zn-based fixative (ZBF). These mixed gender animals were 10–12 weeks old when sacrificed, with a mean body weight of 49.2 g and 27.9 g, respectively, and were housed as described in Hadler-Olsen et al. (2011). Plasma glucose revealed marked hyperglycemia in db/db compared to db/+ mice (Hafstad et al. 2007)
Immunohistochemistry
Immunohistochemistry was performed on 4-µm-thick sections of ZBF-fixed, paraffin-embedded kidney tissue from six or nine db/+ mice and six or nine db/db mice. Sections were deparaffinized in xylene and rehydrated in a graded alcohol series. Sections for staining with the CS-4S (D0a4) antibody were incubated with 0.5 U/ml of either chondroitinase ABC (cABC, Sigma; St. Louis, IL) or chondroitinase AC (cAC, Sigma) in 0.05 M Tris-HCl pH 8 at 37C for 1 hr. Control sections were incubated with PBS. To block endogenous peroxidase activity, all sections were incubated with 3% hydrogen peroxide for 10 min. To reduce nonspecific staining, sections were incubated with 1.5% normal goat serum (Dako; Glostrup, Denmark) in PBS for 20 min, and antibodies were diluted in the same solution. Sections for staining with the 6C3 and CS-4S primary antibodies were treated with Klear Mouse Blocking Buffer (Golden Bridge International, Inc.; Mukileto, WA) according to the product manual. Sections were then incubated with primary monoclonal antibodies against perlecan (MAB1948P, clone A7L6, Millipore; Billerica, MA, diluted 1:50) for 60 min at room temperature, primary polyclonal antibodies against collagen IV (AB756P, Millipore, diluted 1:200) or primary monoclonal antibodies against CS-4S (MAB2030, clone BE-123, Millipore, diluted 1:2000) for 30 min at room temperature or with primary monoclonal antibody 6C3 against CS GAG-chains (diluted 1:20) overnight at 4C. The 6C3 antibody, kindly provided by Professor Bruce Caterson (Cardiff University, Cardiff, UK), recognized an native, unspecified CS/DS sulfation motif at the nonreducing terminus of the GAG-chains, without the need of chondroitinase pretreatment (Caterson 2012). Sections stained for perlecan were then incubated with a rabbit anti-rat linking antibody (Dako, E0468, diluted 1:400) for 30 min at room temperature, whereas those stained for CS GAGs were incubated with a rabbit anti-mouse IgM antibody (Bethyl Laboratories, Inc.; Montgomery, TX; diluted 1:900) for 30 min. Horseradish peroxidase (HRP)–labeled goat anti-mouse/rabbit secondary antibodies and diaminobenzidine substrate (Dako, EnVision+ Dual Link System-HRP) was used according to the protocol for visualization of the CS-4S antibody. For all other antibodies HRP-labeled goat anti-rabbit secondary antibodies and diaminobenzidine substrate (Dako, EnVision+ system-HRP for rabbit primary antibodies) were used for visualization according to product manuals, before counter-staining in Harris Heamatoxylin (Chemi–Teknik; Oslo, Norway). All antibody incubation steps were followed by rinsing in PBS 3 × 5 min. Sections in which the primary antibody was replaced by 1.5% normal goat serum were used as negative controls.
Tissue Extraction of GAGs and Preparation of Disaccharides
Kidneys were obtained from four db/db and four db/+ mice, and GAG chains were isolated as described by Ledin et al. (2006). Mouse kidney cortexes were dissected from mouse kidneys and external fat was removed. The cortexes were freeze-homogenized in a Bio-Pulverizer from Research Products International Corp. (Prospect, IL) and then freeze-dried. The freeze-dried kidney cortexes differed in mass from 20 to 36 mg dry weight and all results were normalized to 30 mg dry weight.
Four parallels (cortex from ½ kidney) from each group of mice (db/db and db/+) were degraded with Pronase (0.8 mg/ml; Pronase 165921, Roche Diagnostics, Indianapolis, IN) in 0.5 ml of Pronase buffer (50 mM Tris-HCl, pH 8.0, 1 mM CaCl2 and 1% [w/w] Triton X-100) at 55C overnight with shaking. Subsequently, 0.4 mg of Pronase E from Sigma (P5147) was added and the samples were incubated for an additional 3 hr. After heat inactivation and adjustment with 2 mM MgCl2, 12 mU endonuclease (Benzonase E8263; Sigma) was added, followed by additional 2 hr incubation at 37C, heat inactivation, and adjustment with0.1 M NaCl.
GAG chains were isolated by ion-exchange chromatography on 0.3 ml DEAE-Sephacel (GE Healthcare; Uppsala, Sweden) columns as described in Grøndahl et al. (2009). Columns were primed by washing with 2 M NH4HCO3, followed by loading buffer (50 mM Tris-HCl, pH 8.0, 0.1 M NaCl, 0.1% [w/w] Triton X-100). Samples were applied, and the columns were washed successively with loading buffer, pH 8.0, washing buffer, pH 4.0 (50 mM sodium acetate, pH 4.0, 0.1 M NaCl, 0.1% [w/w] Triton X-100) and 0.2 M NH4HCO3. GAG chains were eluted with 3 × 0.3 ml 2 M NH4HCO3, collected in micro-centrifuge tubes and repeatedly freeze-dried until the pH of the samples was close to 7. The samples were dissolved in 50 µl (final volume) hyaluronidase (HAdase) buffer (0.05 M Na-phosphate buffer, pH 6.2), with 2.5 mU HAdase (100741, Seikagaku; Tokyo, Japan) added to a final concentration of 0.1 mU/µl HAdase buffer. The samples were incubated at 37C for 2.5 hr and inactivated. Of the sample volume, 10% was subjected to disaccharide analysis. After freeze-drying, the samples were dissolved in 50 µl (final volume) cABC buffer, pH 8.0, and the whole volume was incubated with 0.2 mU cABC (100330, Seikagaku)/µl cABC buffer (33 mM Tris–HCl and 33 mM sodium acetate, pH 8.0) for 2.5 hr at 37C and inactivated. Yet another 10% of the original sample volume was subjected to disaccharide analysis. The remainder of the samples were centrifuged with Microcon UM-3 centrifuge filters from Millipore to remove hyaluronan (HA) and CS disaccharides before they were divided in two equal parts: one half was subjected to disaccharide analysis, while the other half was dissolved in 20 µl (final volume) of HS-degrading buffer (5 mM HEPES, 2 mM CaCl2, 50 mM NaCl, 0.01% BSA, pH 7.5), combined with 0.6 mU of each of heparinase I, II, and III (GE0001, GE0002, GE0003, Grampian Enzymes; Orkney, UK) to a final concentration of 0.03 mU/µl for each heparinase, incubated at 28C for 16 hr, inactivated and subjected to disaccharide analysis.
HPLC Disaccharide Analysis
Quantitative analysis of disaccharides was performed by reverse phase ion-pair (RPIP)-HPLC (Staatz et al. 2001) on a Luna 5 μ C18 reversed phase column (4.6 × 150 mm, Phenomenex; Værløse, Denmark) in acetonitrile (8.5%) and tetra-n-butylammonium hydrogen sulfate (1.2 mM; 86853, Fluka; Sigma; St. Louis, IL) by applying a stepwise gradient of 0.2 M NaCl from 1 to 62%. The HPLC system (altogether purchased from Dionex; Sunnyvale, CA) was run at a flow rate of 1.1 ml/min, and the fluorescent labeling reaction was performed by postcolumn addition of 2–cyanoacetamide (0.25%; 10.844–8, Sigma) and NaOH (0.25%) at a flow rate of 0.35 ml/min by a PC10 postcolumn pneumatic delivery package (Dionex). Signals were quantified by comparison with known amounts of standard disaccharides (Sigma and Grampian Enzymes) analyzed in parallel runs. The chromatography software used was Chromeleon from Dionex.
Gene Expression Analysis
Kidney cortexes were dissected and external fat was removed from four db/db and four db/+ mice. Lysis buffer containing β-mercaptoethanol was added to the tissue and homogenization performed using the ultra-turrax T8, before total RNA was isolated using the EZNA Total RNA kit 1 (R6834–02, Omega Bio-Tek; Norcross, GA), according to the manufacturers instructions. RNA quantity measurements were performed using the ND1000 Spectrophotometer (Saveen & Werner; Limhamn, Sweden) and RNA was stored at −80C until further analysis. A quantity of 250 ng RNA was reversely transcribed in a total volume of 20 µl using the “High capacity RNA-to-cDNA kit” (4387406, Applied Biosystems). Quantitative Real-time PCR (qRT-PCR) was performed on an ABI Prism 7900HT (Applied Biosystems Life Technologies; Paisley, UK) using Taq Man Gene Expression Master Mix (4369016, Applied Biosystems) in a total volume of 20 µl. For gene expression analysis of Chst-11 we used inventoried TaqMan gene expression assays (ID: Mm00517563_m1) and the endogenous control TATA-binding protein Tbp (ID: Mm00446971_m1). The cycle threshold (Ct) values for the Chst-11 gene were normalized against the Ct values for the housekeeping gene Tbp (=ΔCt) in each individual. For comparison of gene expression in kidney extracts from the two mouse strains, the ΔCt values were compared between the two groups.
Statistical Analysis
The mean number of moles of different disaccharides in diabetic and control mice, as well as the differences in ΔCt values, was analyzed for possible statistical differences using an unpaired t-test. P values less than 0.05 were considered to be statistical significant.
Results
In a previous study on parallel kidney tissue sections from the same db/db mice used in this study, electron microscopy and morphometric analyses showed that BMs were thicker and glomeruli surface areas were expanded compared with corresponding tissue in db/+ mice (Hadler-Olsen et al. 2011). Here, new sections were analyzed for possible differences in HS distribution by using an antibody against perlecan, a classical PG in BM. From the upper panel of Fig. 1 it is evident that there is no difference in perlecan staining between kidney sections from db/db and db/+ mice. Furthermore, staining with an antibody against the important collagen in BM, collagen IV, did not reveal any difference in staining patterns or intensity between the two tissues examined, neither in glomeruli nor in the tubules (Fig. 1, lower panel). In essence, although the kidneys in the db/db mice were shown to be affected using morphometry (Hadler-Olsen et al. 2011), no differences could be demonstrated using immunohistochemistry against two prominent BM components.
Figure 1.

Immunohistochemistry of diabetic and control mouse kidney. Kidney sections from diabetic (db/db) mice and control (db/+) mice were subjected to immunohistochemistry using antibodies against perlecan (upper panels) and collagen IV (lower panels). Results are representative of analysis on nine mice from each group. Bars = 150 µm.
For more detailed analysis of possible differences between kidneys from db/db and db/+ mice involving PGs in the kidneys, GAGs were isolated from the glomeruli-rich cortex from both animal groups. Based on susceptibility to enzymes degrading either HA, CS/DS, or HS, the ratio between the different GAGs did not differ for db/db and db/+ mice, as can be seen in Fig. 2. The dominating GAG is HS, representing 74–75% of total GAGs in both preparations, whereas the CS/DS content was 18–20% and HA approximately 6%. Notably, the recovery of total GAGs was similar from both types of kidneys.
Figure 2.
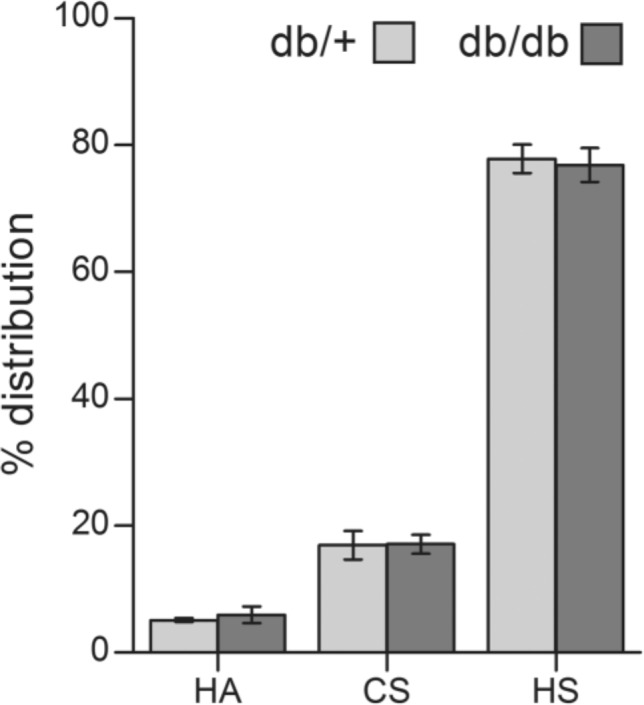
Relative distribution of hyaluronan (HA), chondroitin sulfate/dermatan sulfate (CS/DS) and heparan sulfate (HS) in kidney from diabetic and control mice. The disaccharide composition of glycosaminoglycans (GAGs) from four diabetic (db/db) and four control (db/+) mice was analyzed by RPIP-HPLC after enzymatic degradation of HA, CS/DS, or HS, respectively. The results are presented as mean percentage contribution of each class of GAGs to the total moles of GAG disaccharides, with standard errors indicated by vertical bars.
The disaccharide composition of HS was further analyzed by RPIP-HPLC after heparinase digestions. The elution of the disaccharides obtained was compared with those of defined disaccharide standards. No differences between HS disaccharides from kidneys of db/db and db/+ could be detected, which is evident in Fig. 3, showing mean number of moles adjusted to 30 mg tissue. From these data it can be calculated that the N-acetylated regions in both HS species represent approximately 40% and the N-sulfated regions approximately 60% of the total HS structure, which is typical for several HSPGs, including those in kidney (Maccarana et al. 1996). The amount of the di- and trisulfated disaccharide was similar in both types of material. A peak with similar retention time to the elution position of the disaccharide standard with free glucosamine (GlcN) units could also be detected, but the variation for this peak between different samples was so high that no conclusion could be made as to the possible differences in amount of this particular structure. The amount (mean ± SEM) of sulfate per disaccharide unit was 0.90 ± 0.03 for HS from db/db mice and 0.79 ± 0.10 for HS from db/+ mice, demonstrating that there is no significant difference in sulfation of HS in material from diabetic db/db mice and db/+ control mice.
Figure 3.
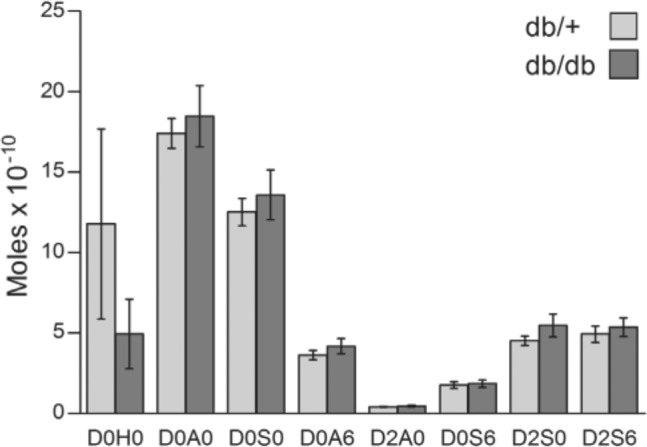
Heparan sulfate (HS) disaccharide structure in diabetic (db/db) and control (db/+) mouse kidney. HS disaccharide structures were analyzed by RPIP-HPLC following heparinase digestion. The elution time of individual disaccharides generated was compared with those of defined disaccharide standards. The notation is as follows (Lawrence et al. 2008): D0H0 = ΔUA-GlcNH2, D0A0 = ΔUA-GlcNAc, D0S0 = ΔUA-GlcNS, D0A6 = ΔUA-GlcNAc6S, D2A0 = ΔUA2S-GlcNAc, D0S6 = ΔUA-GlcNS6S, D2S0 = ΔUA2S-GlcNS, D2A6 = ΔUA2S-GlcNAc6S and D2S6 = ΔUA2S-GlcNS6S. The results are presented as mean moles per 30 mg tissue in each sample, with standard errors indicated by vertical bars. Statistical significance of differences between four db/+ and four db/db mice were tested using Student’s t-test, and no significant differences were found.
To further investigate other possible PG changes in the diabetic kidney the distribution and structure of CS/DS in kidney material from the two mouse strains were analyzed. Immunohistochemical staining using an antibody against CS showed positive staining in the tubulointerstitial ECM, and possibly also in the BM of the tubuli, as shown in Fig. 4. Weak granular intracellular staining could also be detected. There was neither any consistent difference in CS staining patterns, nor in the intensity between kidneys from db/+ and db/db mice.
Figure 4.
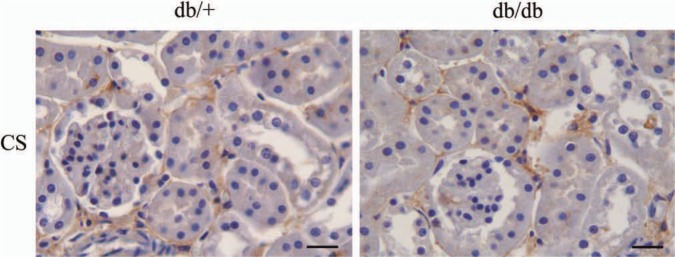
Immunohistochemistry of diabetic and control mouse kidney. Kidney sections from nine diabetic (db/db) and nine control (db/+) mice were subjected to immunohistochemistry using the 6C3 antibody against chondoitin sulfate/dermatan sulfate (CS/DS) glycosaminoglycan (GAG) chains. Results are representative of analysis on nine mice from each group. Bars = 200 µm.
The disaccharides obtained after cABC treatment were also subjected to HPLC analysis. From Fig. 5, it is evident that the major monosulfated disaccharide was the 4-O-sulfated species in material from both db/+ and db/db mice. The ratio between the 4-O-sulfated and 6-O-sulfated disaccharides was similar in the two groups; 6.1 in db/+ material and 6.8 in corresponding db/db material. However, the total amount of the two monosulfated disaccharide types was significantly lower in kidney material from diabetic db/db mice, with p=0.0118 for the 4-O-sulfated D0a4 disaccharide and p=0.0022 for the 6-O-sulfated D0a6 disaccharide. On a molar basis, the amount of 4-O-sulfated and 6-O-sulfated disaccharides in db/db mice was reduced by 41% when compared with db/+ control mice. Correspondingly, the amount of unsulfated D0a0 disaccharides was 2.4 times higher in kidney cortex from db/db mice compared with db/+ mice. The amount of more highly sulfated disaccharides was low in both preparations. The level of disaccharides with 4- and 6-O-sulfated GalNAc (N-acetyl galactosamine), (D0a10), was somewhat higher than disaccharides with sulfate groups in position 4 on the GalNAc and position 2 on the uronic acid part (D2a4). However, there was no difference in the amounts of these disaccharides in kidney extracts from the two different mouse strains. The percentage distribution of the different disaccharides is shown in Table 1. From this analysis of CS in kidney extracts it can be concluded that kidneys from diabetic db/db mice contain CS with a lower degree of sulfation than db/+ control mice. The difference in sulfation is summarized in Fig. 6 and clearly demonstrates that the sulfation of CS, but not HS, is significantly reduced in kidney PGs from db/db mice compared with db/+ mice (p=0.0036).
Figure 5.
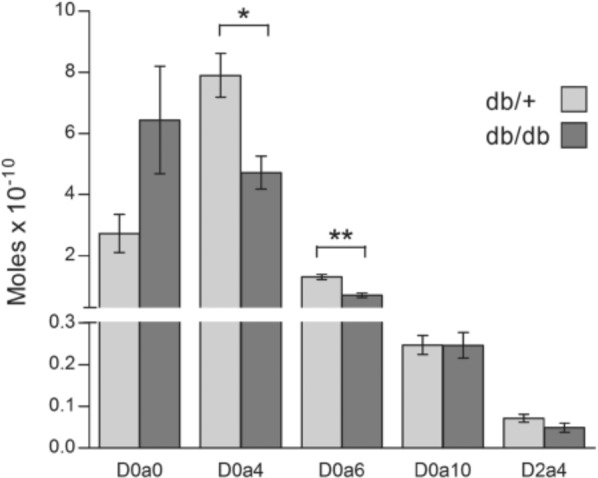
Chondroitin sulfate/dermatan sulfate (CS/DS) disaccharide structure in diabetic (db/db) and control (db/+) mouse kidney. CS/DS disaccharide structures were analyzed by RPIP-HPLC following cABC digestion. The elution time of individual disaccharides generated was compared to those of defined disaccharide standards. The notation is as follows (Lawrence et al. 2008): D0a0 = ΔUA-GalNAc, D0a4 = ΔUA-GalNAc4S, D0a6 = ΔUA-GalNAc6S, D0a10 = ΔUA-GalNAc4S6S, D2a4 = ΔUA2S-GalNAc4S. The results are presented as mean moles per 30 mg tissue in each sample, with standard errors indicated by vertical bars. Statistical significance of differences between the four db/+ and four db/db mice were tested using Student’s t-test. *p<0.05. **p<0.01.
Table 1.
Mean Percentage Distribution of the Different CS/DS Disaccharides With SEM.
| D0a0 | D0a4 | D0a6 | D0a10 | D2a4 | |
|---|---|---|---|---|---|
| db/+ | 21.52 ± 2.47 | 65.06 ± 1.72 | 10.77 ± 0.67 | 2.06 ± 0.21 | 0.60 ± 0.08 |
| db/db | 51.10 ± 5.90 | 40.23 ± 4.88 | 6.21 ± 1.08 | 2.06 ± 0.09 | 0.39 ± 0.05 |
db/+ is control mice and db/db is diabetic mice. The disaccharide notation is as follows: D0a0 = ΔUA-GalNAc, D0a4 = ΔUA-GalNAc4S, D0a6 = ΔUA-GalNAc6S, D0a10 = ΔUA-GalNAc4S6S, D2a4 = ΔUA2S-GalNAc4S.
Figure 6.
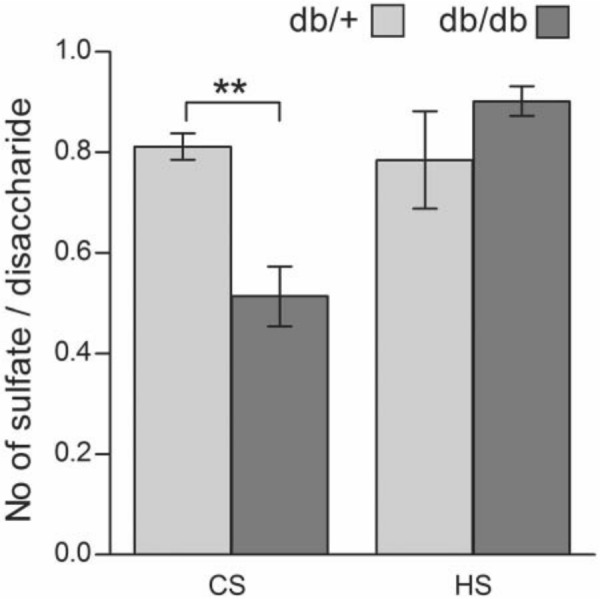
Degree of sulfation of chondroitin sulfate/dermatan sulfate (CS/DS) and heparan sulfate (HS) in diabetic (db/db) and control (db/+) mouse kidney. The number of sulfates per disaccharide was determined from the RPIP-HPLC data for both HS and CS/DS and is presented as mean with SEM. The statistical significance of the observed difference between four db/db mice and four db/+ mice was tested using Student’s t-test. **p<0.01.
To further study the difference in 4-O-sulfation, kidney sections from both groups of mice were subjected to immunohistochemistry using an antibody against 4-O-sulfated CS and DS. The epitopes recognized by this antibody are apparent only after cABC or cAC treatment. In CS and CS/DS hybrid chains, 4-O-sulfated epitopes are detected after both cAC and cABC treatment, whereas in homogenous DS chains, DS-4S is only apparent after cABC treatment. From Fig. 7, staining is visible after both cABC and, to a lesser degree, cAC treatments. There is a lower degree of staining in tissue sections from the diabetic db/db mice (right panels) compared with corresponding sections from control db/+ mice (left panels). This difference is most evident in the cAC-treated section, indicating that 4-O sulfation of CS or CS/DS hybrid chains are more affected than 4-O-sulfation of homogenous DS chains. Staining is obvious in both glomeruli and tubular BMs and in the tubular cells. Groups of tubuli either positive or negative for staining are found, which is evident for both proximal and distal tubules. For the positive tubuli, the staining is most evident in the cells and mostly found in perinuclear regions. In both groups there is generally more 4-O-sulfation of CS and CS/DS hybrids than of homogenous DS chains. The staining pattern suggests higher levels of DS in tubular BM compared to other structures.
Figure 7.

Immunohistochemistry of diabetic and control mouse kidney. Kidney sections from diabetic (db/db, right panels) and control (db/+, left panels) mice were subjected to immunohistochemistry using the CS-4S antibody after chondroitinase treatment. cABC generated epitopes will give staining for both 4-O-sulfated chondroitin sulfate (CS) and dermatan sulfate (DS), whereas cAC generated epitopes will give staining for 4-O-sulfated CS and CS/DS hybrids only. The PBS treated control is included for comparison. Results are representative of analysis on kidneys from six mice in each group. Bars = 50 µm.
To investigate if the decrease in 4-O-sulfation could be due to reduced expression of the chondroitin 4-O sulfotransferase, qRT-PCR was performed targeting Chst-11. In Fig. 8 it is demonstrated that the expression level of Chst-11 is decreased 53.5% in kidney extracts from db/db mice compared with control db/+ mice
Figure 8.
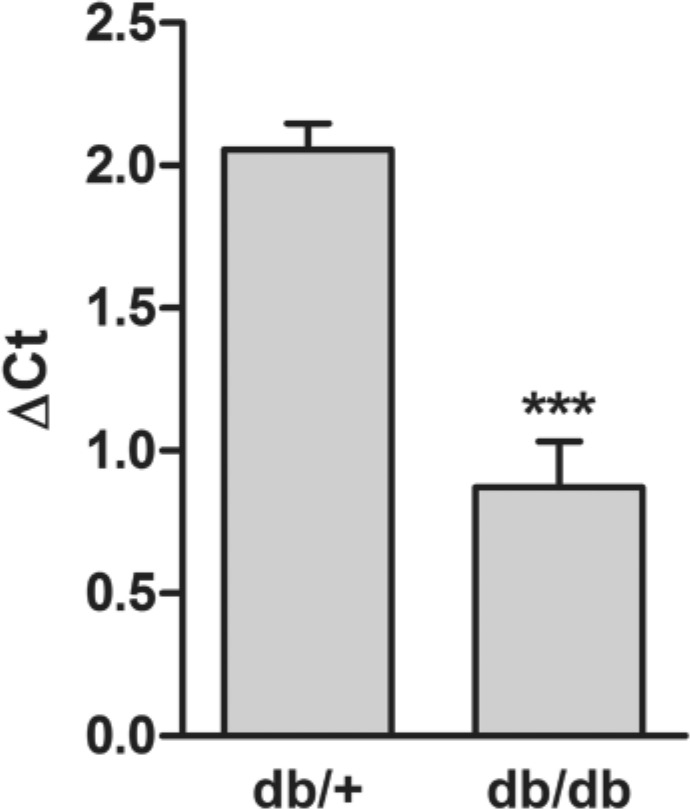
CS-4-O sulfotransferase gene expression in diabetic and control mouse kidney. mRNA levels of the CS-4-O sulfotransferase in four control (db/+) mice and four diabetic (db/db) mice was determined by qRT-PCR and normalized against the expression of the housekeeping gene Tbp. Values are expressed as mean ΔCt values with SEM for both groups. The statistical significance of the observed difference between four db/db mice and four db/+ mice was tested using the Student’s t-test. ***p<0.001.
Discussion
The db/db mouse is a well-suited animal model for type 2 diabetes with renal complications, and can be used to study diabetic nephropathy (Allen et al. 2004). In the present study, we have used kidneys from these animals and corresponding db/+ controls for immunohistochemical and GAG structure analyses. The immunohistochemical analysis did not reveal any differences in perlecan, collagen IV, or 6C3 CS staining between tissues from the two animal groups. In a previous study on parallel tissues to those used here, increased BM thickness and expanded glomerular surface areas in kidneys of db/db mice compared with db/+ mice were demonstrated (Hadler-Olsen et al. 2011), clearly showing kidney changes in the db/db mice used here. The two latter analyses were done using electron microscopy giving more detailed data than immunohistochemistry used in this study.
In the present study, we found no difference in the total GAG amount between normal and diabetic kidneys. Also, the data we present on the HS structures of kidney did not reveal any differences in disaccharide compositions between preparations from db/db and db/+ mice. The major fraction of the disaccharides contained GlcN units that were either N-sulfated or N-acetylated. Our HS disaccharide analyses are in line with those presented recently for liver HS in mice made diabetic by streptozotocin injection (Bishop et al. 2010). Although our analyses concerned a different tissue, it is interesting to note that HS changes were detected neither in liver nor kidney, two organs affected in insulin-dependent diabetic mice (type 1 diabetes) and mice used as a model for type 2 diabetes. Also, in rats made diabetic with streptozotocin, glomerular HS structure was not altered (Van den Born et al. 2006), whereas in a similar study, kidney HS from large glomeruli was less N-sulfated than HS from controls (Lauer et al. 2007). Also, an early study on livers from diabetic rats showed decreased sulfation of HS (Kjellén et al. 1983). Whether there is a difference in the changes observed for HS in diabetic rats compared to diabetic mice has, however, not been reported. Such comparative analysis would be interesting, as it is not a trivial issue as to which animal model is best suited for studies on diabetes, both development and pathology, as well as for studies focusing on treatment and the search for markers of early disease and tissue complications.
The major results in the present study are the changes we observe in kidney CS structures. The major disaccharide components of CS GAGs in control kidney preparations were CS-4S (D0a4), constituting 65%, and CS-0S (D0a0), which amounted to 21.5%, of the total CS disaccharides. In kidneys of db/db mice, the content of D0a4 disaccharides was reduced to 40% and the nonsulfated species increased to 51% of the total disaccharides. The demonstrated reduced gene expression of chondroitin 4-O sulfotransferase further support this finding. To the best of our knowledge, such changes in CS structures in kidneys of diabetic mice have not been reported before. One recent report did demonstrate structural changes in CS/DS in diabetic rat kidney, but these were due to a decrease in the percentage of disaccharides of the oversulfated D0a10 type, and the degree of CS/DS sulfation was only slightly reduced (Joladarashi et al. 2011). Furthermore, a decrease in CS/DS content, but not HS content, was observed.
The functional implications of the CS structural changes in mouse diabetic kidney reported here remains to be established. It is interesting to note that the biological functions of kidney HS linked to filtration are still a matter of debate (Raats et al. 2000; Kanwar et al. 2007; Morita et al. 2008). There has so far been little focus on the possible importance of kidney CS/DS for filtration or other kidney functions. One probable reason for this is that CS/DS represent a much smaller fraction of the total kidney GAGs than HS and have therefore been regarded as less important. In the kidneys studied here, HS and CS represented approximately 75% and 17%, respectively, of total kidney GAG. Still, the large decrease we have observed in CS sulfation could affect the functions of kidney CSPGs. Whether a decrease in CS sulfation will have an impact on interactions with other molecules, such as growth factors and matrix components, is at present not known. Binding of the structurally altered CS/DS from kidneys of diabetic rats to ECM components was decreased compared to controls (Joladarashi et al. 2011), illustrating possible functional implications of such structural changes.
In the diabetic kidney, changes in CS/DS PGs such as decorin and biglycan have been reported (Schaefer 2001). Furthermore, both mRNA and protein expression of the transmembrane CSPG NG2 increased in kidneys of diabetic rats (Xiong et al. 2007). Decorin, biglycan, and NG2 functions could potentially be altered if the sulfation of their CS/DS chains is decreased, as demonstrated here for the total kidney CS. Furthermore, immunoelectron microscopy with an antibody against a CSPG core protein showed increased staining of BM of diabetic rat kidneys, particularly in areas where BM thickening was evident (McCarthy et al. 1994). If such a BM CSPG is important for filtration in the kidneys, our findings may have relevance to changes in this function in diabetes.
CS/DS in the endothelial glycocalyx may also be relevant to the structural changes we report, as the removal of these GAGs affects glomerular filtration (Jeansson and Haraldsson 2006). A lowered charge in the glycocalyx could affect filtration functions. Accordingly, there are several CSPGs that have important kidney functions, and changes in the sulfation of their respective GAG chains could affect such functions.
CS/DS PGs in the kidneys are located in the BM, the mesangium, the tubulointerstitial space, and the glycocalyx (Kolset et al. 2012). This was confirmed in this study, using two antibodies against different CS epitopes. The results presented show that the sulfation of CS in kidneys is reduced in db/db diabetic mice. It has been documented that this is a good animal model for type 2 diabetes in humans. Our study raises new questions concerning the functions of PGs in the kidney and for CS/DSPGs in diabetes in particular. Furthermore, the mechanisms underlying changes in CS/DS structures in diabetic kidneys merit further investigations. In future studies it will be of interest to investigate whether the reported CS/DS structural changes in mice can also be observed in kidney biopsies from humans with type 1 and type 2 diabetes.
Acknowledgments
We thank Dr. Gunnar Dick, Department of Biosciences, University of Oslo, for providing the CS-4S antibody.
Footnotes
Declaration of Conflicting Interests: The author(s) declared no potential conflicts of interest with respect to the research, authorship, and/or publication of this article.
Funding: The author(s) disclosed receipt of the following financial support for the research, authorship, and/or publication of this article: This work was supported by grants from the South Eastern Norway Regional Authority, the Throne Holst Foundation, the Nansen Foundation, and the Norwegian Diabetes Association. We confirm that the authors has no conflicts of interest to declare with respect to the research, authorship and / or publication of this article. We also confirm the accuracy of the funding statements.
References
- Allen TJ, Cooper ME, Lan HY. 2004. Use of genetic mouse models in the study of diabetic nephropathy. Curr Atheroscler Rep. 6:197–202 [DOI] [PubMed] [Google Scholar]
- Bishop JR, Foley E, Lawrence R, Esko JD. 2010. Insulin-dependent diabetes mellitus in mice does not alter liver heparan sulfate. J Biol Chem. 285:14658–14662 [DOI] [PMC free article] [PubMed] [Google Scholar]
- Caterson B. 2012. Fell-Muir lecture: chondroitin sulphate glycosaminoglycans: fun for some and confusion for others. Int J Exp Pathol. 93:1–10 [DOI] [PMC free article] [PubMed] [Google Scholar]
- Celie JW, Reijmers RM, Slot EM, Beelen RH, Spaargaren M, Ter Wee PM, Florquin S, Van Den Born J. 2008. Tubulointerstitial heparan sulfate proteoglycan changes in human renal diseases correlate with leukocyte influx and proteinuria. Am J Physiol. Renal Physiol. 294:F253–F263 [DOI] [PubMed] [Google Scholar]
- Chen S, Wassenhove-McCarthy DJ, Yamaguchi Y, Holzman LB, Van Kuppevelt TH, Jenniskens GJ, Wijnhoven TJ, Woods AC, McCarthy KJ. 2008. Loss of heparan sulfate glycosaminoglycan assembly in podocytes does not lead to proteinuria. Kidney Int. 74:289–299 [DOI] [PMC free article] [PubMed] [Google Scholar]
- Esko JD, Selleck SB. 2002. Order out of chaos: assembly of ligand binding sites in heparan sulfate. Annu Rev Biochem. 71:435–471 [DOI] [PubMed] [Google Scholar]
- Farquhar MG, Wissig SL, Palade GE. 1961. Glomerular permeability. I. Ferritin transfer across the normal glomerular capillary wall. J Exp Med. 113:47–66 [DOI] [PMC free article] [PubMed] [Google Scholar]
- Galeano B, Klootwijk R, Manoli I, Sun M, Ciccone C, Darvish D, Starost MF, Zerfas PM, Hoffmann VJ, Hoogstraten-Miller S, Krasnewich DM, Gahl WA, Huizing M. 2007. Mutation in the key enzyme of sialic acid biosynthesis causes severe glomerular proteinuria and is rescued by N-acetylmannosamine. J Clin Invest. 117:1585–1594 [DOI] [PMC free article] [PubMed] [Google Scholar]
- Grøndahl F, Tveit H, Prydz K. 2009. Neutralization of endomembrane compartments in epithelial MDCK cells affects proteoglycan synthesis in the apical secretory pathway. Biochem J. 418:517–528 [DOI] [PubMed] [Google Scholar]
- Hadler-Olsen E, Winberg JO, Reinholt FP, Larsen T, Uhlin-Hansen L, Jenssen T, Berg E, Kolset SO. 2011. Proteases in plasma and kidney of db/db mice as markers of diabetes-induced nephropathy. ISRN Endocrinol. 2011:832642. [DOI] [PMC free article] [PubMed] [Google Scholar]
- Hafstad AD, Khalid AM, How OJ, Larsen TS, Aasum E. 2007. Glucose and insulin improve cardiac efficiency and postischemic functional recovery in perfused hearts from type 2 diabetic (db/db) mice. Am J Physiol Endocrinol Metab. 292:E1288–E1294 [DOI] [PubMed] [Google Scholar]
- Harvey SJ, Jarad G, Cunningham J, Rops AL, Van Der Vlag J, Berden JH, Moeller MJ, Holzman LB, Burgess RW, Miner JH. 2007. Disruption of glomerular basement membrane charge through podocyte-specific mutation of agrin does not alter glomerular permselectivity. Am J Pathol. 171:139–152 [DOI] [PMC free article] [PubMed] [Google Scholar]
- Jeansson M, Haraldsson B. 2003. Glomerular size and charge selectivity in the mouse after exposure to glucosaminoglycan-degrading enzymes. J Am Soc Nephrol. 14:1756–1765 [DOI] [PubMed] [Google Scholar]
- Jeansson M, Haraldsson B. 2006. Morphological and functional evidence for an important role of the endothelial cell glycocalyx in the glomerular barrier. Am J Physiol Renal Physiol. 290:F111–F116 [DOI] [PubMed] [Google Scholar]
- Joladarashi D, Salimath PV, Chilkunda ND. 2011. Diabetes results in structural alteration of chondroitin sulfate/dermatan sulfate in the rat kidney: effects on the binding to extracellular matrix components. Glycobiology. 21:960–972 [DOI] [PubMed] [Google Scholar]
- Kanwar YS, Danesh FR, Chugh SS. 2007. Contribution of proteoglycans towards the integrated functions of renal glomerular capillaries: a historical perspective. Am J Pathol. 171:9–13 [DOI] [PMC free article] [PubMed] [Google Scholar]
- Kanwar YS, Farquhar MG. 1979. Presence of heparan sulfate in the glomerular basement membrane. Proc Natl Acad Sci USA. 76:1303–1307 [DOI] [PMC free article] [PubMed] [Google Scholar]
- Kanwar YS, Linker A, Farquhar MG. 1980. Increased permeability of the glomerular basement membrane to ferritin after removal of glycosaminoglycans (heparan sulfate) by enzyme digestion. J Cell Biol. 86:688–693 [DOI] [PMC free article] [PubMed] [Google Scholar]
- Kjellén L, Bielefeld D, Hook M. 1983. Reduced sulfation of liver heparan sulfate in experimentally diabetic rats. Diabetes. 32:337–342 [DOI] [PubMed] [Google Scholar]
- Kjellén L, Lindahl U. 1991. Proteoglycans: structures and interactions. Annu Rev Biochem. 60:443–475 [DOI] [PubMed] [Google Scholar]
- Kolset SO, Reinholt FP, Jenssen T. 2012. Diabetic nephropathy and extracellular matrix. J Histochem Cytochem. 60:976–986 [DOI] [PMC free article] [PubMed] [Google Scholar]
- Lauer ME, Hascall VC, Wang A. 2007. Heparan sulfate analysis from diabetic rat glomeruli. J Biol Chem. 282:843–852 [DOI] [PubMed] [Google Scholar]
- Lawrence R, Lu H, Rosenberg RD, Esko JD, Zhang L. 2008. Disaccharide structure code for easy representation of constituent oligosaccharides from glycosaminoglycans. Nature Methods. 5:291–292 [DOI] [PubMed] [Google Scholar]
- Ledin J, Ringvall M, Thuveson M, Eriksson I, Wilen M, Kusche-Gullberg M, Forsberg E, Kjellén L. 2006. Enzymatically active N-deacetylase/N-sulfotransferase-2 is present in liver but does not contribute to heparan sulfate N-sulfation. J Biol Chem. 281:35727–35734 [DOI] [PubMed] [Google Scholar]
- Maccarana M, Sakura Y, Tawada A, Yoshida K, Lindahl U. 1996. Domain structure of heparan sulfates from bovine organs. J Biol Chem. 271:17804–17810 [DOI] [PubMed] [Google Scholar]
- McCarthy KJ, Abrahamson DR, Bynum KR, St John PL, Couchman JR. 1994. Basement membrane-specific chondroitin sulfate proteoglycan is abnormally associated with the glomerular capillary basement membrane of diabetic rats. J Histochem Cytochem. 42:473–484 [DOI] [PubMed] [Google Scholar]
- McCarthy KJ, Bynum K, St John PL, Abrahamson DR, Couchman JR. 1993. Basement membrane proteoglycans in glomerular morphogenesis: chondroitin sulfate proteoglycan is temporally and spatially restricted during development. J Histochem Cytochem. 41:401–414 [DOI] [PubMed] [Google Scholar]
- Morita H, Yoshimura A, Inui K, Ideura T, Watanabe H, Wang L, Soininen R, Tryggvason K. 2005. Heparan sulfate of perlecan is involved in glomerular filtration. J Am Soc Nephrol. 16:1703–1710 [DOI] [PubMed] [Google Scholar]
- Morita H, Yoshimura A, Kimata K. 2008. The role of heparan sulfate in the glomerular basement membrane. Kidney Int. 73:247–248 [DOI] [PubMed] [Google Scholar]
- Raats CJ, Van Den Born J, Berden JH. 2000. Glomerular heparan sulfate alterations: mechanisms and relevance for proteinuria. Kidney Int. 57:385–400 [DOI] [PubMed] [Google Scholar]
- Schaefer L. 2001. Small proteoglycans in human diabetic nephropathy: discrepancy between glomerular expression and protein accumulation of decorin, biglycan, lumican, and fibromodulin. FASEB J. 15:559–561 [DOI] [PubMed] [Google Scholar]
- Schumacher VA, Schlötzer-Schrehardt U, Karumanchi SA, Shi X, Zaia J, Jeruschke S, Zhang D, Pavenstaedt H, Drenckhan A, Amann K, Ng C, Hartwig S, Ng KH, Ho J, Kreidberg JA, Taglienti M, Royer-Pokora B, Ai X. 2011. WT1–dependent sulfatase expression maintains the normal glomerular filtration barrier. J Am Soc Nephrol. 22:1286–1296 [DOI] [PMC free article] [PubMed] [Google Scholar]
- Shafat I, Ilan N, Zoabi S, Vlodavsky I, Nakhoul F. 2011. Heparanase levels are elevated in the urine and plasma of type 2 diabetes patients and associate with blood glucose levels. PLoS ONE. 6:e17312. [DOI] [PMC free article] [PubMed] [Google Scholar]
- Staatz WD, Toyoda H, Kinoshita-Toyoda A, Chhor K, Selleck SB. 2001. Analysis of proteoglycans and glycosaminoglycans from drosophila. Methods Mol Biol. 171:41–52 [DOI] [PubMed] [Google Scholar]
- Steer DL, Shah MM, Bush KT, Stuart RO, Sampogna RV, Meyer TN, Schwesinger C, Bai X, Esko JD, Nigam SK. 2004. Regulation of ureteric bud branching morphogenesis by sulfated proteoglycans in the developing kidney. Dev Biol. 272:310–327 [DOI] [PubMed] [Google Scholar]
- Unger E, Pettersson I, Eriksson UJ, Lindahl U, Kjellen L. 1991. Decreased activity of the heparan sulfate-modifying enzyme glucosaminyl N-deacetylase in hepatocytes from streptozotocin-diabetic rats. J Biol Chem. 266:8671–8674 [PubMed] [Google Scholar]
- Utriainen A, Sormunen R, Kettunen M, Carvalhaes LS, Sajanti E, Eklund L, Kauppinen R, Kitten GT, Pihlajaniemi T. 2004. Structurally altered basement membranes and hydrocephalus in a type XVIII collagen deficient mouse line. Hum Mol Genet. 13:2089–2099 [DOI] [PubMed] [Google Scholar]
- Van Den Born J, Pisa B, Bakker MA, Celie JW, Straatman C, Thomas S, Viberti GC, Kjellen L, Berden JH. 2006. No change in glomerular heparan sulfate structure in early human and experimental diabetic nephropathy. J Biol Chem. 281:29606–29613 [DOI] [PubMed] [Google Scholar]
- Van Den Born J, Van Den Heuvel LP, Bakker MA, Veerkamp JH, Assmann KJ, Berden JH. 1992. A monoclonal antibody against GBM heparan sulfate induces an acute selective proteinuria in rats. Kidney Int. 41:115–123 [DOI] [PubMed] [Google Scholar]
- Wijnhoven TJ, Van Den Hoven MJ, Ding H, Van Kuppevelt TH, Van Der Vlag J, Berden JH, Prinz RA, Lewis EJ, Schwartz M, Xu X. 2008. Heparanase induces a differential loss of heparan sulphate domains in overt diabetic nephropathy. Diabetologia. 51:372–382 [DOI] [PubMed] [Google Scholar]
- Xiong J, Wang Y, Zhu Z, Liu J, Zhang C, Hammes HP, Lang F, Feng Y. 2007. NG2 proteoglycan increases mesangial cell proliferation and extracellular matrix production. Biochem Biophys Res Commun. 361:960–967 [DOI] [PubMed] [Google Scholar]
- Yard BA, Kahlert S, Engelleiter R, Resch S, Waldherr R, Groffen AJ, Van Den Heuvel LP, Van Der Born J, Berden JH, Kroger S, Hafner M, Van Der Woude FJ. 2001. Decreased glomerular expression of agrin in diabetic nephropathy and podocytes cultured in high glucose medium. Exp Nephrol. 9:214–222 [DOI] [PubMed] [Google Scholar]