

Abstract
Elevated glutamate levels have been reported in humans with diabetic retinopathy. Retinal Müller glial cells regulate glutamate levels via the GLAST transporter and system xc− (cystine-glutamate exchanger). This study investigated whether transporter function, gene and/or protein expression is altered in mouse Müller cells cultured under conditions of hyperglycemia or oxidative stress, two factors implicated in diabetic retinopathy. Cells were subjected to hyperglycemic conditions (35 mM glucose) over an 8 day period or to oxidative stress conditions (induced by exposure to varying concentrations of xanthine:xanthine oxidase (X:XO)) for 6 hours. The Na+-dependent and –independent uptake of [3H] glutamate was assessed as a measure of GLAST and system xc− function, respectively. Hyperglycemia did not alter the uptake of [3H] glutamate by GLAST or system xc−; neither gene nor protein expression decreased. Oxidative stress (70:14 or 100:20 μM X:mU/ml XO) decreased GLAST activity by ~10%, however it increased system xc− activity by 43% and 89%, respectively. Kinetic analysis showed an oxidative stress-induced change in Vmax, not Km. Oxidative stress caused a 2.4 fold increase in mRNA encoding xCT, the unique component of system xc−. There are two isoforms of xCT (40 and 50 kDa); oxidative stress induced a 3.6 fold increase in the 40 kDa form localized to the plasma membrane. This is the first report of differential expression and localization of xCT isoforms due to cellular stress. Increased system xc− activity in Müller cells, subjected to conditions associated with diabetic retinopathy, may be beneficial as this exchanger is important for synthesis of the antioxidant glutathione.
Keywords: cystine-glutamate exchanger, cell culture, mouse, transporter kinetics
Introduction
Müller cells, the predominant retinal glial cell type, are essential for maintaining homeostasis in the extracellular milieu. They provide physical and metabolic support for retinal neurons by regulating transport and metabolism of neurotransmitters. Glutamate is the major retinal excitatory neurotransmitter for the photoreceptor-bipolar-ganglion cell circuitry. It is normally found at high levels within neurons, but is maintained at low concentrations extracellularly minimizing excitotoxicity. In diabetic retinopathy disruption of glutamate homeostasis has been reported (Pulido et al. 2007). Human diabetic patients have an elevated vitreal glutamate concentration of ~25 μM compared to ~9 μM in non-diabetic persons (Ambati et al., 1997). Increased glutamate levels were reported in retinas of diabetic rats (Lieth et al. 1998; Kowluru et al. 2001). Given that extracellular glutamate is toxic to neurons (Goto et al. 2002; Otori et al. 1998; Vorwerk et al. 1996) and that neuronal death is a feature of diabetic retinopathy (Abu El-Asrar et al. 2004; Barber et al. 1998; Martin et al. 2004; Barber 2003, Barber et al. 2005, Smith et al. 2008), the analysis of the mechanism responsible for accumulation of glutamate may be relevant to the pathogenesis of diabetic retinopathy.
In the retina, the main glutamate transporter expressed by Müller cells is GLAST (Kanai et al. 2004; Rauen et al. 1996). GLAST, also known as EAAT1, is one of five sodium-dependent, electrogenic, high affinity excitatory amino acid transporters (EAAT1–5) present in retina. The powerful GLAST transporter can concentrate glutamate 10,000 fold inside the cell relative to the low extracellular concentration of glutamate (~1 μM) (Rauen et al. 1998). Retinal glutamate levels can be regulated also by system xc−, a Na+-independent, electroneutral, cystine-glutamate exchanger, which is expressed in Müller cells, ganglion and retinal pigment epithelial (RPE) cells (Bridges et al. 2001; 2004; Dun et al. 2006; Kato et al. 1993). System xc− is composed of two subunits: the transport specific xCT subunit and the ubiquitous 4F2hc subunit (Sato et al, 1999). The stoichiometry of this obligatory exchanger is 1:1; the direction of transport is driven by the concentration gradient of the substrate (Bannai and Kitamura 1980). Under physiological conditions, system xc− transports cystine into the cell coupled to the efflux of glutamate out of the cell (McBean 2002). Once inside the cell, cystine is converted to cysteine, the rate limiting factor in production of the antioxidant tri-peptide glutathione.
Hyperglycemia and oxidative stress are major factors implicated in the pathogenesis of diabetic retinopathy. Hyperglycemia is considered the single most important factor in the onset and progression of this disease (Genuth 2006). Oxidative stress is associated with the severity and duration of diabetic retinopathy in human and animals models (Gürler 2000; Kowluru and Chan 2007; Van Reyk et al. 2003). Although the function of system xc− has not been analyzed in diabetic retinopathy, the function of GLAST has been studied in models of this disease. Li and Puro (2002) used freshly dissociated Muller cells from streptozotocin-induced diabetic rats and assessed transporter function electrophysiologically by measuring inward current induced by 1-trans-pyrrolidine-2, 4-dicarboxylate (PDC). They reported a 67% decrease in transporter activity, which they attributed largely to oxidative stress. Ward and co-workers analyzed GLAST expression levels in intact streptozotocin-induced diabetic rat retinas and found no significant change in GLAST expression as compared to control retinas (Ward et al. 2005). They also injected D-aspartate, a non-metabolizable substrate for GLAST, intravitreally and examined the level of D-aspartate uptake in fixed retinal tissue by subjecting the specimen to immunodetection using an antibody against D-aspartate. They reported that in the diabetic retina, D-aspartate uptake was actually enhanced not reduced. They concluded that Müller cells maintain GLAST function in diabetes (at least during early stages).
These conflicting findings were intriguing and prompted us to exploit a methodology well-established in our laboratory whereby the activity of various transporter proteins can be determined directly by measuring the uptake of radiolabeled substrates in cultured cells (Bridges et al. 2001, Dun et al. 2006). The method is especially enlightening when the influence of a single parameter on transporter activity is to be analyzed. In the present study, we used Müller cells isolated from the mouse retina to evaluate the effects specifically of hyperglycemia on radiolabeled glutamate uptake as a reflection of GLAST and system xc− transporter activity. In subsequent independent experiments, we analyzed the effects of oxidative stress on the function of these two glutamate transporter systems. Our findings suggest that short term hyperglycemia does not alter the activity of GLAST or system xc−, although it did lead to increased protein levels after longer hyperglycemic exposure. Much more striking were the effects of oxidative stress, with the most pronounced effect being a marked increase in the activity of system xc− and expression of xCT.
Materials and methods
Isolation of mouse Müller cells
C57BL/6 mouse breeding pairs were obtained from Harlan Sprague Dawley, Indianapolis, IN. They were maintained in the animal facilities of the Medical College of Georgia according to institutional policy for appropriate care and use of animals in research. Müller cells were isolated from 6 to 7-day-old mice following our published method (Jiang et al., 2006, Umapathy et al, 2005). Growth media (10% FBS, 1% penicillin-streptomycin in low glucose (5.5 mM) DMEM with pyruvate) was changed every 1 to 2 days and Müller cells were passaged every 4 to 7 days. After 3 to 5 passages, cells were frozen at −80°C until used.
Immunocytochemistry
Culture purity was verified periodically with each passage as well as after freezing and thawing as previously described (Jiang et al. 2006). Briefly, a panel of antibodies that included vimentin, glutamine synthetase (GS), cellular retinaldehyde binding protein (CRALBP), glial acid fibrillary protein (GFAP), cytokeratin 8, and NF-L were used. The cells were positive for vimentin and GS, known markers of Müller cells in vivo and for CRALBP a marker for Müller and RPE cells. There was minimal staining for GFAP, a marker for astrocytes (and Müller cells that are in distress). The cells were negative for cytokeratin 8, which is expressed by RPE cells and for the neuronal marker NF-L. To verify the presence of GLAST, xCT, and 4F2hc, Müller cells were seeded onto coverslips. The next day, they were fixed in 4% paraformaldehyde for 10 min, permeabilized for 5 min in 0.25% Triton X-100, incubated with Power Block for 1 h, then exposed to primary antibody for 3 h at room temperature. Antibodies were purchased from these sources: guinea pig anti-GLAST, goat anti-vimentin (Chemicon, Billerica, MA); Alexa Fluor 488 donkey anti-goat (Invitrogen, Carlsbad, CA); CY3 conjugated donkey anti-goat, CY3 conjugated donkey anti-guinea pig, CY3 conjugated donkey anti-rabbit (Jackson Immunologicals, West Grove, PA); rabbit anti-EAAT1, goat anti-CD98 (4F2hc), horseradish peroxidase (HRP) conjugated goat anti-mouse, goat anti-rabbit, mouse anti-goat (Santa Cruz Biotechnology, Inc, Santa Cruz, CA). The preparation of the anti-xCT antibody has been described (Dun et al. 2006). Cells were washed and reblocked with FX signal enhancer for 30 minutes followed by either CY3 (1:500) or Alexa Fluor 488 (1:1000) for 1 h at room temperature. After washing, nuclei were counterstained with Hoechst dye 33342 (1:10,000). Coverslips were mounted on slides with aqueous gel mount and visualized using a Zeiss Axioplan-2 microscope equipped with the axiovision program and an HRM camera.
Müller cell treatment
Cells were thawed, grown in culture flasks, changing media every 1 to 2 days. After 4 days, cells were passaged and seeded for experiments. For transporter assays, 1 ml of growth media containing 100,000 cells/ml was added to each well of a 24-well plate. For gene and protein expression studies, cells were plated such that the ratio of cell number and media volume per cm2 of growth area was the same as for transport assays. Media was refreshed every 1 to 2 days. After 4 days media was changed to low serum media (0.5% FBS in low glucose DMEM). The next day treatment began. For hyperglycemia experiments, the concentration of D-glucose in the medium (DMEM 11966 (Invitrogen)) was adjusted to either 5 mM or 35 mM. Osmolar controls for these experiments included incubating cells under hyperosmolar conditions (5 mM glucose plus 30 mM mannitol, L-glucose and sorbitol). For oxidative stress experiments, treatment solutions were prepared in base medium containing 5 mM glucose and 0.5% FBS in ‘no-glucose’ DMEM 11966. Solutions containing 20 μM, 80 μM, 140 μM, and 200 μM xanthine were prepared from 0.2 M xanthine stock solution prepared in 1N NaOH. Corresponding xanthine control solutions were prepared with vehicle (1N NaOH) alone. Xanthine oxidase solutions were prepared in base media and contained 4 mU/ml, 16 mU/ml, 28 mU/ml and 40 mU/ml xanthine oxidase. At time of treatment, medium was discarded and equal volumes of xanthine and xanthine oxidase solutions were applied directly to the cells to form the final 1x treatment solutions of 10:2, 40:8, 70:14 and 100:20 (expressed as μM X:mU/ml XO). All treatment solutions were prepared fresh before treatment.
Functional assay to determine transport activity of GLAST and system xc−
Uptake of glutamate by the Na+-dependent GLAST transporter and Na+-independent system xc− was performed in parallel experiments in which the uptake buffer either contained Na+ (25 mM 4-(2-hydroxyethyl)-1-piperazineethansulfonic acid (HEPES)/Tris, 140 mM NaCl, 5.4 mM KCl, 1.8 mM CaCl2, 0.8 mM MgSO4, and 5 mM glucose, pH 7.5) or did not, in which case NaCl was replaced by 140 mM N-methyl-D-glucamine chloride. System xc− is a freely reversible exchanger for cystine/glutamate; one can study the transport function either by monitoring the influx of radiolabeled cystine in exchange for the efflux of cellular glutamate or by monitoring the influx of radiolabeled glutamate in exchange for efflux of cellular glutamate (since system xc− can also function as a Na+-independent glutamate/glutamate exchanger). (Note that once inside the cell, the cystine is converted to cysteine, which is not transported by system xc−.) The intracellular level of cystine is necessarily low and hence would not be an easily measured substrate for the transporter. The most accurate method to study the transporter function is to measure influx of [3H]-labeled substrate, rather than the highly unstable [35S]-labeled cystine. Even though Na+-independent glutamate uptake can occur via AGT1, there is no evidence for expression of this transporter in the retina (Sarthy et al, 2005), thus Na+-independent uptake of glutamate in Müller cells represents the function of system xc− exclusively (Bridges et al. 2001). L-[G-3H]-glutamic acid (specific radioactivity 43.0 Ci/mmol, concentration 1.0 mCi/ml, Amersham Bioscience, Arlington Heights, IL) was used as the substrate for uptake experiments. Uptake was initiated by adding 250 μl of uptake buffer containing 2.5 μM glutamate spiked with 2.0 μCi/ml of radiolabeled [3H]-glutamate. Cells were incubated for 15 min at 37°C, after which, buffer was removed and cells were washed twice with ice-cold uptake buffer. The cells were solubilized with 0.5 ml of 1% sodium dodecyl sulfate-0.2N NaOH (SDS/NaOH) and radioactivity was determined by liquid scintillation spectrometry. Protein was measured using the Bio-Rad protein assay reagent.
Glutamate uptake in the presence of Na+ reflects the activity of both Na+-dependent GLAST and Na+-independent system xc−. Glutamate uptake by GLAST was determined by calculating the glutamate uptake in presence of Na+ and subtracting uptake in the absence of Na+. The uptake by system xc− was calculated directly from the radioactivity data for glutamate uptake in the absence of Na+.
GLAST and system xc− kinetics
Kinetic analyses of GLAST and system xc− activities were performed in Müller cells treated for 6 h in the presence or absence of 70 μM of xanthine:14 mU/ml of xanthine oxidase. GLAST and system xc− activities were assessed using increasing amounts of cold glutamate ranging from 2.5 μM to 500 μM. SigmaPlot 2001 for Windows Version 7.0 (SPSS Inc., Chicago, IL) was used to calculate Km and Vmax from an Eadie-Hofstee plot of V, uptake velocity (pmole/mg/15 min) versus V/S where S is cold glutamate concentration (μM). The formula underlying the Eadie-Hofstee plot is v = −Kmv/[S] + Vmax where v represents reaction velocity, Km is the Michaelis-Menten constant, [S] is the substrate concentration, and Vmax is the maximum reaction velocity.
Western blot analysis
Cells were washed in buffer containing 0.32 M mannitol, 1.0 mM EDTA disodium salt, pH 7.4 with Complete Mini Protease Inhibitor Cocktail tablets (Roche Diagnostics, Indianapolis, IN) and 50 mM DTT. To detect GLAST, samples containing 30 μg of protein were suspended in sucrose loading buffer for a final buffer concentration of 70 mM SDS, 62.5 mM Tris-HCl, 0.3 M sucrose, 50 mM DTT, pH 6.8, plus 10 μg/ml bromophenol blue. To detect xCT and 4F2hc, samples containing 30 μg were prepared in Bio-Rad Laemmli buffer (62.5 mM Tris-HCl, pH 6.8, 2% SDS, 25% glycerol, 0.01% bromophenol blue) with β-mercaptoethanol. Samples were loaded on 8% polyacrylamide gels and electrophoresed in Tris-glycine running buffer (25 mM Tris, 250 mM glycine, 10% SDS, pH 8.3). The separated proteins were transferred to nitrocellulose membranes in cold transfer buffer (48 mM Tris, 39 mM glycine, 0.4% SDS, 20% methanol, pH 8.3). Membranes were rinsed in dH2O and stained with 0.1% Ponceau solution (5% glacial acetic acid, 95% dH2O, 0.1% Ponceau). All washes and blocking solutions were made in TBST (0.05 M Tris HCl, 0.15 M NaCl, 0.5% Tween-20, pH 7.4). Membranes were blocked for 15 min in 5% non-fat milk solution and incubated with the appropriate antibody diluted in milk solution overnight at 4°C, except for β-actin which was incubated for 3 h at room temperature. The antibody dilutions used were as follows; rabbit anti-GLAST 1:200 in 5% milk, rabbit anti-xCT 1:500 in 1% milk, and goat anti-CD98 (4F2hc) 1:1000 in 1% milk, mouse monoclonal β-actin, 1:5000 in 5% milk. After probing with primary antibody, membranes were rinsed with TBST and re-probed with the appropriate HRP-conjugated secondary. Membranes were incubated in SuperSignal West Pico Chemiluminescent substrate (Pierce Biotechnology, Inc., Rockford, IL). Films, to which membranes were exposed, were scanned into Adobe Photoshop Adobe Photoshop Version 9.0 (Adobe Systems Inc., San Jose, CA). A drag-and-drop rectangular grid was placed over the band of interest and the histogram feature was used to determine band density corrected for background.
Biotinylation of plasma membrane proteins
Biotinylation of plasma membrane proteins was performed using the Pinpoint™ Cell Surface Protein Isolation Kit (Pierce Biotechnology) according to the manufacturer’s instructions. Briefly, the surface of intact cells was labeled with a thiol-cleavable, amine-reactive, biotinylation reagent. Cells were lysed in mild detergent, the labeled membrane proteins were collected using a column containing Immobilized NeutrAvidin™ Gel (Pierce Biotechnology). The column eluate contained the intracellular protein fraction. Membrane proteins were released by incubating the column with SDS-PAGE sample buffer containing 50 mM DTT. After separation of the plasma membrane and intracellular fraction, protein content was determined using the Bio-Rad RC DC protein assay. Samples were stored at −80° until for Western blot analysis.
Semi-quantitative PCR
The RNeasy mini kit (Qiagen, Germantown, MD) was used to collect RNA from Müller cells. Cell lysates were homogenized using a QIAshredder spin column (Qiagen) and RNA was collected according to the manufacturer’s instructions. Total RNA was converted to cDNA using the GeneAmp RNA PCR Kit (Applied Biosystems, Foster City, CA). PCR was performed using the Takara Taq DNA polymerase kit (Takara Bio USA, Madison, WI) with primer pairs for GLAST, xCT, or 4F2hc in combination with a primer competimer pair for 18S as an internal control. The cycle numbers for quantification of each product were chosen in the linear range of the PCR. The 18S primer competimer ratios were optimized so that intensity of the 18S band (315 base pairs) was similar in intensity to the product of interest. The PCR products were electrophoresed on a 2% agarose gel containing 1:8000 SYBRsafe DNA gel stain and visualized under UV light. A photograph of the gel was imported into Adobe Photoshop. A drag-and-drop rectangular grid was placed over the band of interest. The histogram feature was used to determine band density corrected for background.
For GLAST, the upstream primer 5′-TCAATGCCCTGGGCCTAGTTGT-3′ (sense) and the downstream primer 5′-GGGTGGCAGAACTTGAGGAGG-3′ (antisense) form a 384 base pair product and correspond to nucleotide positions 1211–1232 and 1594–1574, respectively, in mouse GLAST (NM 148938.2). The 18S primer competimer ratio was 5 to 5. PCR was performed for 26 cycles with a denaturing phase of 30 sec at 95°C, annealing phase of 30 sec at 65°C, and an extension phase of 30 sec at 72°C. The xCT upstream primer 5′-CCTGGCATTTGGACGCTACAT-3′ (sense) and the downstream primer 5′-TGAGAATTGCTGTGAGCTTGCA-3′ (antisense) form a 182 base pair product and correspond to nucleotide positions 781–801 and 962–941, respectively, in mouse (NM 011990.2). The 18S primer competimer ratio was 1.5 to 8.5. PCR was performed for 30 cycles with a denaturing phase of 30 sec at 95°C, annealing phase of 30 sec at 60°C, and an extension phase of 30 sec at 72°C. The 4F2hc upstream primer 5′-CTCCCAGGAAGATTTTAAAGACCTTCT-3′ (sense) and the downstream primer 5′-TTCATTTTGGTGGCTACAATGTCAG-3′ (antisense) form a 141 base pair product and correspond to nucleotide positions 661–687 and 801–777, respectively, in mouse (NM 008577.3). The 18S primer competimer ratio was 3.5 to 6.5. PCR was performed for 30 cycles with a denaturing phase of 30 sec at 95°C, annealing phase of 30 sec at 60°C, and an extension phase of 30 sec at 72°C.
Statistical analysis
The Excel data analysis tool (Microsoft Excel 2002, Microsoft Corp., Redmond, WA); was used to make pairwise comparisons between treatments and controls. For multiple comparisons the Mini Tab Minitab 15.0 program (Minitab Inc., State College, PA) was used to perform the Bonferroni pairwise comparison with a control. A p-value < 0.05 was considered significant.
Results
Immunocytological experiments performed in mouse Müller cells detected GLAST and both components of system xc− (xCT and 4F2hc). Data are shown in Figure 1 (GLAST, Fig. 1A), xCT (Fig. 1B) and 4F2hc subunit (Fig. 1C). The merged images of xCT and 4F2hc showed the many areas of colocalization of xCT and 4F2hc (Fig. 1D). (4F2hc is a protein that can work in conjunction with many transporter proteins in addition to xCT, some of these proteins are located within the cell cytoplasm and adjacent to the nucleus.) As anticipated, the cells were positive for vimentin, a marker for Müller cells (Fig. 1E) as well as other Müller cell markers, but were negative for proteins found solely in RPE or neurons (data not shown). Incubation of cultures with antibody preadsorbed with the appropriate blocking peptide yielded no positive immunofluorescence (Fig. 1F). These data suggest that mouse Müller cells are appropriate for studies of GLAST and system xc− activity.
Figure 1.

Immunodetection of GLAST, system xc− (xCT and 4F2hc components) and vimentin in mouse Müller cells. (a) Anti-GLAST antibody (1:500) followed by Cy-3 (red) secondary antibody (1:500). (b) Anti-xCT antibody (1:200) followed by Cy-3 (red) secondary antibody (1:500). (c) Anti-4F2hc antibody (1:200) followed by Alexa-488 (green) secondary antibody (1:1000). (d) Merged image of xCT (red) and 4F2hc (green). Co-localization of xCT and 4F2hc appeared orange-yellow. (e) Anti-vimentin antibody (1:500) followed by Cy-3 (red) secondary antibody (1:500). (f) Typical negative control using antibody preadsorbed with blocking peptide, nuclei were stained blue with Hoechst 33342 (1:10,000). (Calibration bar = 20μm).
Uptake of radiolabeled-glutamate by GLAST and system xc− was measured in Müller cells exposed to 35 mM glucose compared to physiological glucose levels (5 mM). 35 mM glucose reflects a severe hyperglycemic state equivalent to 637 mg/dl glucose; such glucose levels have been reported in mouse models of diabetes (Martin et al, 2004, Barber et al 2005, Smith et al. 2008). Cells were exposed to 35 mM glucose for 15 min, 6 hr, 1, 2, 4, or 8 days. Data are presented as the percentage of control uptake (100% for cells in 5 mM glucose) and show that exposure of cells to 35 mM glucose did not alter GLAST activity relative to controls for either shorter incubation times (15 min, 6 h, 1 day) or extended periods (2, 4, or 8 days) (Fig. 2A). Similarly, system xc− transporter activity did not differ in cells exposed to 35 mM glucose compared with controls for any of the treatment times tested (Fig. 2B). Given that elevated glucose levels are associated with hyperosmolarity, the experiments were performed also with medium containing 5 mM glucose and 30 mM of an osmolytes (mannitol, L-glucose or sorbitol) for the same time period (15 min – 8 days). None of the osmolytes tested shown any osmolar effect on GLAST or system xc− transporter activity (data not shown).
Figure 2.
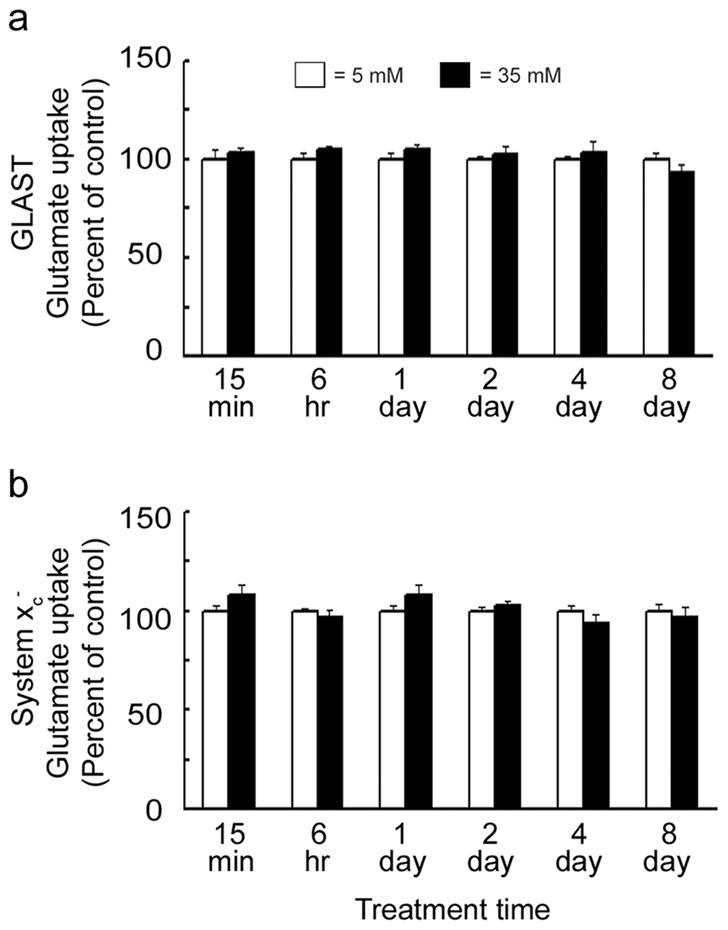
Effect of hyperglycemia on GLAST and system xc− activity. Mouse Müller cells were exposed to 35 mM (hyperglycemic) or 5 mM (normoglycemic) conditions for 15 min, 6 hr, 1, 2, 4, and 8 days. (a) GLAST and (b) system xc− transporter activities were assessed after each treatment time. Transporter activities for 35 mM glucose treated cells were expressed relative to 5 mM controls (100%). No differences in transporter activities were detected for 35 mM compared to 5 mM treated cells at any of the times tested. Values presented are means ± SE from 2–3 independent experiments performed in triplicate.
The finding that hyperglycemia did not alter the function of GLAST or system xc− was unexpected and prompted comprehensive analysis of the effect of hyperglycemia on GLAST and system xc− gene and protein expression. Gene expression levels for GLAST, xCT and 4F2hc were unchanged for the hyperglycemic conditions (data not shown). There was a slight increase in the protein levels for GLAST and xCT when Müller cells were exposed for 8 days to 35 mM glucose (Fig. 3).
Figure 3.

Effect of hyperglycemia on transporter protein levels. Mouse Müller cells were treated with 35 mM glucose or 5 mM glucose for 2, 4, or 8 days, proteins were collected from whole cell lysates and immunoblots performed to detect (a) GLAST, (b) xCT and (c) 4F2hc. β-actin was used as the internal control. Bar graphs adjacent to the gels show the densitometric quantification of each protein (d) GLAST (e) xCT and (f) 4F2hc (normalized to β-actin). After 8 days GLAST (60 kDa) was elevated slightly in cells treated with 35 mM glucose compared to 5 mM glucose (p < 0.05) as was xCT (50 kDa) (p <0.05). Values presented are means ± SE of 2–3 readings from 2 to 3 independent experiments.
These data suggested that factors, other than hyperglycemia, which are associated with diabetes, may contribute to the observed changes in GLAST activity reported by others (Li and Puro 2002; Ward et al. 2005). Oxidative stress is a major factor associated with diabetes; hyperglycemia-induced overproduction of superoxide by the electron transport chain is involved in pathogenesis of diabetes (Nishikawa et al. 2000). Oxidative stress was induced in Müller cell cultures using a combined application of xanthine:xanthine oxidase (X:XO) at increasing concentrations and the effects on the uptake of glutamate by GLAST or system xc− assessed. Exposure of cells for as short a time period as 6 h to increasing levels of oxidative stress (X:X0 ratios of: 70:14 and 100:20) decreased GLAST transporter activity by ~10% (Fig. 4A), suggesting that GLAST function is sensitive to this diabetes-associated factor. Oxidative stress had the opposite effect on system xc− and increased the transporter activity markedly. 6 h treatment with 40:8, 70:14 and 100:20 X:XO increased system xc− activity by 14%, 43% and 89%, respectively (Fig. 4B). Exposure of cells to higher X:XO concentrations (200:40) led to cell death (data not shown).
Figure 4.
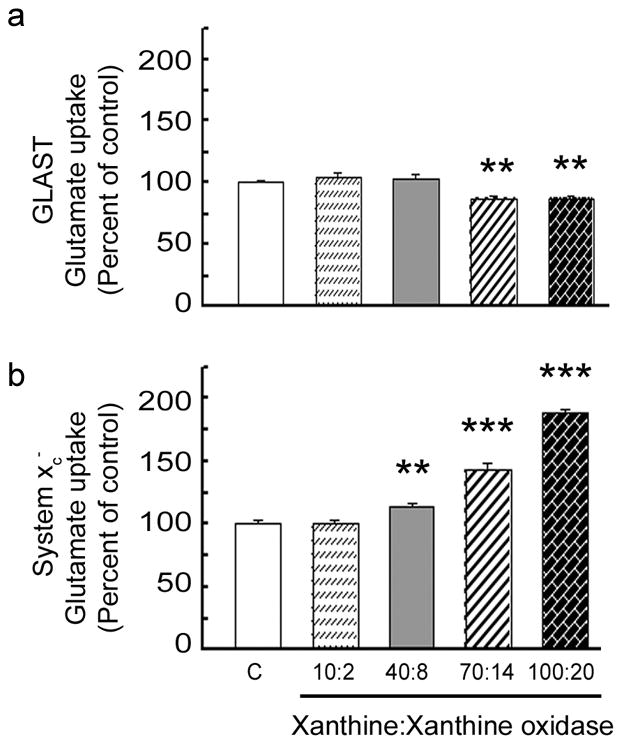
Effect of oxidative stress on GLAST and system xc− activity. Mouse Müller cells were treated for 6 h in the absence or presence of increasing levels of X:XO as a source of superoxide anions following which the uptake of [3H] glutamate was measured in the presence or absence of sodium (Na+). Concentrations of X:X0 were: 10:2, 40:8, 70:14 and 100:20 μM xanthine:mU/ml xanthine oxidase. Glutamate uptake by (a) the Na+-dependent GLAST transporter or (b) the Na+-independent system xc−. Values presented are means ± SE from 2–3 independent experiments performed in triplicate. (Significantly different from control, ** p < 0.005, *** p<0.0005).
Kinetic analyses of GLAST and system xc− transporter activities were performed in Müller cells treated with 70:14 X:XO for 6 h. The uptake of radiolabeled glutamate by GLAST and system xc− by cells was measured using increasing amounts of non-radioactive glutamate. Concentrations used were 2.5, 25, 125, 250, 500 μM and 5, 10 mM glutamate. The non-radioactive 5 and 10 mM glutamate was used to determine non-carrier mediated diffusional component because these concentrations represent 20 – 40 times the reported Kt value for the transporter (Bridges et al. 2001). This diffusional component was subtracted from total uptake values in the kinetic analysis. Uptake of glutamate by GLAST and system xc− was plotted as a function of glutamate concentration (Fig. 5). The inset graph in Fig. 5A and 5B is the Eadie-Hofstee plot of transporter activity (V) versus transporter activity divided by glutamate concentration (V/S). For data that follow Michaelis-Menten kinetics, the Eadie-Hofstee plot produces a line with slope equal to −Km and a y intercept equal to Vmax. The kinetic analysis showed that the X:XO-induced decrease in GLAST activity was due to a change in Vmax, not Km. The Vmax for X:XO treated cells (5877 pmole/mg/15 min) was decreased 10% compared to control cells (6579 pmole/mg/15 min) (p < 0.001). The Km for both X:XO treated and control cells were similar, 19.23 and 18.9 μM, respectively, and were within the range reported for GLAST Km (11–77 μM, Anderson and Swanson, 2000). Kinetic analysis showed that the increase in system xc− activity was due also to a change in Vmax, not Km. For system xc−, the Vmax for X:XO treated cells (1946 pmole/mg/15 min) was 30% higher than the Vmax (1459 pmole/mg/15 min) calculated for control cells (p < 0.0002). The Km for both X:XO treated and control cells were similar, 57.3 and 54.9 μM, respectively, which were values in the range of those published for other retinal cell types (Bridges et al. 2004; Dun et al. 2006).
Figure 5.

Kinetic analysis of GLAST and system xc− in cells exposed to oxidative stress. Mouse Müller cells were treated for 6 hours with 70:14 X:XO following which the uptake of [3H]-glutamate by Na+-dependent GLAST (a) and Na+-independent system xc− (b) were assessed using increasing amounts of non-radioactive glutamate ranging from 2.5 μM to 500 μM. The rate of glutamate uptake (pmole/mg/15 min) is shown as a function of glutamate concentration (μM). The inset is an Eadie-Hofstee plot of V, uptake velocity (pmole/mg/15 min) versus V/S where S is non-radioactive glutamate concentration (μM). Values presented are means ± SE from 2 independent experiments performed in triplicate.
Analysis of gene expression in Müller cells treated with 70:14 X:XO for 6 h showed a marked increase in expression of mRNA encoding xCT. Representative gels of these experiments are shown in Fig. 6A. While the level of the 315 bp 18S (internal standard) was the same for control and X:XO-treated cells, the level of the 181 bp xCT was much greater in cells exposed to oxidative stress compared with controls. Densitometric analysis confirmed that xCT mRNA was elevated significantly (2.4 fold) relative to controls (p<0.0005) (Fig. 6B). This elevation in xCT gene expression was consistent with the increase in system xc− transporter activity observed in uptake studies (Fig. 4 and 5). There was no significant change in GLAST or 4F2hc mRNA under these oxidative stress conditions.
Figure 6.
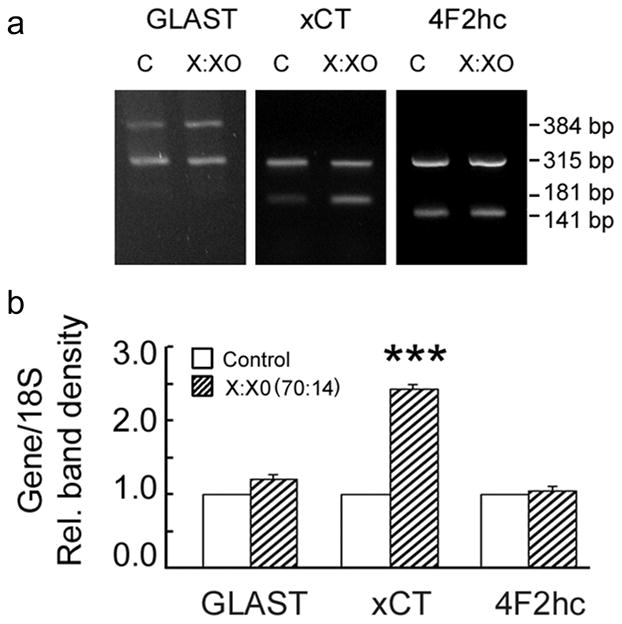
Effect of oxidative stress on GLAST and system xc− gene expression. Mouse Müller cells were treated 6 h with 70 μM xanthine:14 mU/ml xanthine oxidase, RNA was collected and analyzed by semi-quantitative PCR. Representative gels are shown in panel a. Densities of the relevant bands corresponding to GLAST (384 bp), xCT (181 bp), and 4F2hc (141 bp) were determined and expressed as a ratio to 18S (315 bp), an internal control (panel b). Cells that received no oxidative stress exposure were controls and their band densities were taken as 1.0. Values presented are means ± SE of band densities obtained from 4–5 PCR experiments performed on RNA obtained from two independent experiments.(*** Significantly different from control, p<0.0005).
xCT has a predicted molecular mass of 55 kDa, however, there have been reports of two size variants of xCT (35–40 kDa and 50–55 kDa) (Tomi et al. 2003). To determine which form of xCT (50 kDa or 40 kDa) was altered under oxidative stress, Müller cells were treated for 6 hours with 70:14 X:XO and biotinylation techniques were used to separate plasma membrane proteins from intracellular proteins. Western blot analysis of the fractions showed that the predominant form of xCT isolated from Müller cells had a molecular weight ~50 kD; there was no detectable change in the level of this form of xCT (as a consequence of oxidative stress). In controls, the 40 kDa form is located almost exclusively in the intracellular fraction; under oxidative stress conditions, however, the 40 kDa form shifts its location and is elevated. As shown in Fig. 7A and B, the 40 kDa form of xCT located in the plasma membrane of the X:XO treated cells was 3.6 fold greater than controls. These data suggest that the elevation of 40 kDa form of xCT present on the plasma membrane of X:XO treated Müller cells may account for the increased system xc− activity observed in uptake experiments.
Figure 7.
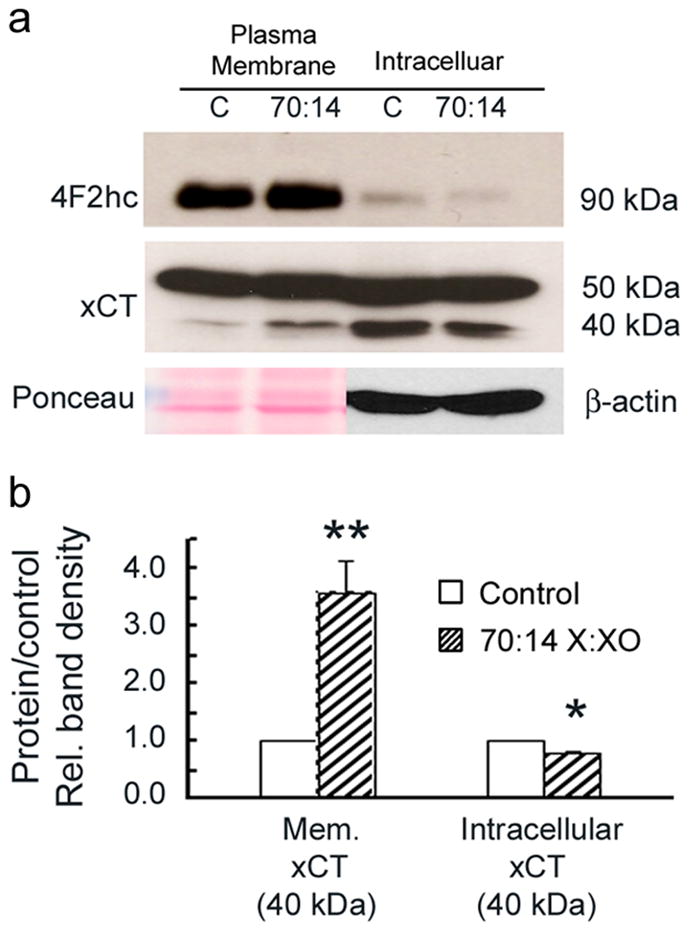
Distribution of xCT in cells following oxidative stress. Mouse Müller cells were treated for 6 h with X:XO (70:14). Following treatment proteins were biotinylated as described in the text and subjected to Western blot analysis. (a) Representative immunoblots show bands for xCT (40 and 50 kDa) and 4F2hc (90 kDa) from both the plasma membrane and intracellular fractions. (b) Bar graph showing the quantification of xCT (50 kDa) in the plasma membrane and intracellular fractions. The band density for xCT (40 kDa) in X:XO treated cells is elevated 3.6 fold relative to controls (1.0) in the plasma membrane. In contrast, the band density for xCT (40 kDa) in X:XO treated cells is decreased 0.8 fold relative to controls in the intracellular fraction. Bands for plasma membrane proteins were normalized to Ponceau staining as the internal control. Bands for intracellular proteins were normalized to β-actin as the internal control. Values presented are representative of to independent biotinylation experiments. (Significantly different from control, **p<0.005, *p<0.05).
Discussion
The experiments undertaken in this study were designed to test the effects of hyperglycemia and oxidative stress, two factors associated with diabetes, on the activity of glutamate transporters present in retinal Müller cells. GLAST is a well-characterized sodium-dependent glutamate transporter responsible for clearing excess glutamate from the extracellular milieu. System xc− is a sodium-independent cysteine-glutamate exchanger that plays a key role in the generation of the antioxidant glutathione. Given reports of elevated glutamate in the retina and vitreous of diabetic subjects, that excessive levels of extracellular glutamate are toxic to retinal neurons and that neuronal alterations are evident in diabetic retinopathy, it was likely that glutamate clearance from the extracellular milieu would be impaired in the retina of diabetic subjects.
Such was the premise of the studies by Li and Puro (2002) when they isolated Müller cells from diabetic rat retinas and demonstrated a profound decrease in the activity of the GLAST transporter using an indirect assessment of function. They applied electrophysiological methods to assess the inward current induced by 1-trans-pyrrolidine-2, 4-dicarboxylate (PDC) and found a 67% decrease in transporter function. Their findings were intriguing and prompted us to investigate whether the effects on GLAST activity could be compromised solely by hyperglycemia. Our laboratory has extensive experience in analyzing the function of transporter proteins in cultured cells by directly assessing the uptake of radiolabeled substrates, such as glutamate. The experimental system is attractive because it permits testing of a single factor (such as hyperglycemia) independent of other factors that would be present in a complex disease such as diabetes; the present experiments used Müller cells isolated from the mouse retina. Our immunohistochemical data showed that GLAST transporter was present in these cells. Interestingly, exposure of the cells to hyperglycemia did not impair GLAST function as anticipated. We examined the GLAST transporter function over a time course (15 min to 8 days) and found that neither very short periods of hyperglycemia nor longer exposure altered the uptake of radiolabeled glutamate. Gene expression was not affected, nor was the protein level until cells had been exposed for 8 days to 35 mM glucose, when there was actually a detectable increase in GLAST protein levels. The results of our studies suggest that hyperglycemia alone is insufficient to impair GLAST function (at least short term) in retinal Müller cells.
Our experimental paradigm allowed analysis of system xc−, a second system that mediates cellular glutamate levels. The protein constituents of system xc− (xCT and 4F2hc) were colocalized in mouse Müller cells. This cystine-glutamate exchanger operates bi-directionally either taking glutamate into or out of cells in exchange for cystine. Typically, it operates to take cystine into the cell for synthesis of glutathione, a key antioxidant in retina, however its function can be assessed by using radiolabeled glutamate as the substrate. Using sodium-containing buffer versus buffer lacking sodium allows the function of GLAST to be distinguished from that of system xc−. Analysis of system xc− activity in Müller cells exposed to hyperglycemia revealed no change in activity over the course of the experimental time period.
It was intriguing that hyperglycemia was not sufficient to disrupt the function of either GLAST or system xc− in cultured mouse Müller cells. Hyperglycemia is often viewed as the single most important factor involved in the onset and progression of diabetic retinopathy (DCCT 1993; DCCT 1996; Genuth 2006). There are many reports of the effects of elevated glucose on several different retinal cell types, including for example increased apoptosis in Müller cells and pericytes cultured in high glucose (Beltramo et al. 2006; Du et al. 2003; Kusner et al. 2004). Elevated glucose compromises the function of other transporter proteins, including the reduced-folate transporter of RPE cells (Naggar et al. 2002). Exposure of RPE cells to 45 mM glucose for as short an incubation time as 6 hours resulted in a 35% decrease in the uptake of folate. The decreased activity was accompanied by decreased gene and protein expression for the folate transporter protein. The data obtained herein suggest that Müller cells can sustain GLAST and system xc− function under hyperglycemic conditions at least when challenged for a short period of time with this stressful condition.
Oxidative stress is well known to be associated with diabetes. In diabetes oxidative stress is induced by overproduction of superoxide by the mitochondrial electron transport chain (Nishikawa et al. 2000). Increased superoxide concentration is considered a major causative factor in the pathogenesis of diabetic complications (Kowluru and Chan 2007). In the study by Li and Puro (2002) referenced above, the mechanism responsible for decreased GLAST function in diabetes was suggested to be oxidative in nature because disulfide dithiothreitol, a disulfide-reducing agent restored GLAST transporter activity.
In the present study, we analyzed whether oxidative stress could alter GLAST activity as well as that of system xc−. Indeed this is this first report of analysis of the effects of oxidative stress on the function of the two transporters (GLAST and system xc−) in parallel. Oxidative stress was induced in the cultures of Müller cells using a combined application of xanthine:xanthine oxidase (X:XO), a well known method for generating superoxide and hydrogen peroxide in a molar ratio of approximately 1:3 (Asai et al. 2007). When the effects of X:XO on GLAST and system xc− function were assessed, the most remarkable effect was on system xc− function, not on GLAST. Exposure of cells to X:XO decreased GLAST activity, albeit slightly (10%), but increased system xc− activity by 40 – 80% depending upon X:XO concentration. The kinetic analysis indicated that the increased activity was due to a change in Vmax, not Km. Subsequent molecular analysis of system xc− showed that oxidative stress increased the expression of the mRNA encoding xCT. Analysis of plasma membrane and intracellular fractions showed that the 40 kDa-sized form of xCT was substantially elevated on the plasma membrane as a function of X:XO treatment, while the 50 kDa-sized form of xCT was unchanged in level or site of expression. While our lab and others have shown increased system xc− activity in various cell types exposed to oxidative stress-inducing agents such as H2O2, NO donors, superoxide anion, elevated O2 and the electrophilic agent diethyl maleate (Bannai et al. 1989; Kim et al. 2001, Bridges et al. 2001; Dun et al. 2006; Tomi et al. 2003), to our knowledge these data are the first to demonstrate the relative expression of xCT inside the cell compared to the plasma membrane and to report a change in isoform distribution as a response to cellular stress. It was interesting that even though the most predominant form of xCT is the 50 kDa form, it was the 40 kDa form, which under oxidative stress, increased and shifted location from intracellular to the plasma membrane. This raises intriguing questions about the function of the 50 kDa form with respect to function in system xc−. While not the focus of this study, future investigations of this transporter might include analysis of the function of the 50 kDa isoform and whether it is involved in transport activity and if so whether the activity is regulated by post-translational modifications such as phosphorylation or glycosylation.
Based on the findings of Li and Puro (2002) suggesting that oxidative damage accounted for decreased activity of GLAST in isolated Müller cells, we were surprised to observe a modest effect of oxidative stress on GLAST activity, especially when compared to the robust effect on the cystine-glutamate exchanger. Their system used an indirect assessment of GLAST transporter activity, but was attractive in that cells were isolated from rats that had been diabetic for many weeks. Our system permits direct assessment of GLAST activity and allows us to assess the effects of the single factor (oxidative stress), but in isolated, cultured glial cells. Our attempts to isolate Müller cells from the retinas of diabetic animals have not been successful because of decreased viability of cells isolated from older animals.
The upregulation of xCT and increase in system xc− activity observed in this study are presumably beneficial because this transporter is integral to production of the antioxidant glutathione, which protects cells from stress. The increase in system xc− activity may be relevant to the findings of Ward et al (2005) who showed a slight but insignificant, increase (not decrease) in GLAST activity and expression in diabetic rat retinas. They interpreted their data as indicating that while Müller cells undergo gliosis in early stages of diabetic retinopathy, they preserve the function of GLAST.
Analysis of transporter protein function is frequently performed in cell lines. To more closely approximate in vivo Müller cell transporter activity, we isolated the cells from young mouse retinas and passaged them ~3 times to allow sufficient numbers of cells to assess transport function. The cells retained Müller cell marker proteins. The advantages of such a system include the ability to pose experimental questions regarding the effects of specific factors on transport function in a single cell type rather than myriad effects on a mixture of cell types (such as an isolated whole retinal preparation). A caveat in interpretation of data derived from this experimental system, however, is that the analysis is devoid of the cellular and biological milieu characteristic of complex physiological systems. Factors that are associated with disease, for example altered blood flow, vascular changes, edema, inflammation implicated in diabetes are not reflected in the experimental paradigm used in the present studies. Even with these limitations the data obtained provide intriguing findings regarding two factors commonly associated with diabetes, hyperglycemia and oxidative stress. The data suggest that glutamate uptake by GLAST and system xc− in isolated Müller cells is not profoundly affected by hyperglycemia alone; and that GLAST activity is not as susceptible to oxidative stress in isolated Müller cells as is system xc−. To our knowledge this work represents the first analysis of both of these proteins in experiments intended to mimic conditions associated with diabetes.
It should be mentioned that while GLAST plays a key role in the Na+-dependent transport of glutamate in Müller cells and is therefore a logical transporter to study with respect to effects of cellular stress, Sarthy et al (2005) reported that there may be new, as yet unidentified Na+-dependent, high-affinity glutamate transporters in Müller cells (Sarthy et al. 2005). As the molecular characterization of such transporters unfolds, it will be very informative to determine their expression levels and sensitivity to cellular stress. Interestingly, although Na+-independent uptake of glutamate can occur via the AGT1 transporter in some systems, there is no evidence for expression of this transporter in the retina (Sarthy et al, 2005), thus system xc− is the only known transporter for glutamate in Müller cells under sodium-free conditions.
Acknowledgments
Supported by: NIH R01 EY014560
Literature Cited
- Abu El-Asrar AM, Dralands L, Missotten L, Al-Jadaan IA, Geboes K. Expression of apoptosis markers in the retinas of human subjects with diabetes. Invest Ophthalmol Vis Sci. 2004;45:2760–2766. doi: 10.1167/iovs.03-1392. [DOI] [PubMed] [Google Scholar]
- Ambati J, Chalam KV, Chawls DK, D’Angio CT, Guillet EG, Rose SJ, Vanderlinde RE, Ambati BK. Elevated gamma-aminobutyric acid, glutamate, and vascular endothelial growth factor levels in the vitreous of patients with proliferative diabetic retinopathy. Arch Ophthalmol. 1997;115:1161–1166. doi: 10.1001/archopht.1997.01100160331011. [DOI] [PubMed] [Google Scholar]
- Arriza JL, Eliasof S, Kavanaugh MP, Amara SG. Excitatory amino acid transporter 5, a retinal glutamate transporter coupled to a chloride conductance. Proc Natl Acad Sci USA. 1997;94:4155–4160. doi: 10.1073/pnas.94.8.4155. [DOI] [PMC free article] [PubMed] [Google Scholar]
- Asai R, Nishino T, Matsumura T, Okamoto K, Igarashi K, Pai EF, Nishino T. Two mutations convert mammalian xanthine oxidoreductase to highly superoxide-productive xanthine oxidase. J Biochem. 2007;14:525–534. doi: 10.1093/jb/mvm054. [DOI] [PubMed] [Google Scholar]
- Bannai S, Kitamura E. Transport interaction of L-cystine and L-glutamate in human diploid fibroblasts in culture. J Biol Chem. 1980;6:2372–2376. [PubMed] [Google Scholar]
- Bannai S, Sato H, Ishii T, Sugita Y. Induction of cystine transport activity in human fibroblasts by oxygen. J Biol Chem. 1989;31:18480–18484. [PubMed] [Google Scholar]
- Barber AJ. A new view of diabetic retinopathy: a neurodegenerative disease of the eye. Prog Neuropsychopharmacol Biol Psychiatry. 2003;27:283–290. doi: 10.1016/S0278-5846(03)00023-X. [DOI] [PubMed] [Google Scholar]
- Barber AJ, Antonetti DA, Kern TS, Reiter CEN, Soans RS, Krady KJ, Levison SW, Gardner TW, Bronson SK. The Ins2Akita mouse as a model of early retinal complications in diabetes. Invest Ophthalmol Vis Sci. 2005;6:2210–2217. doi: 10.1167/iovs.04-1340. [DOI] [PubMed] [Google Scholar]
- Barber AJ, Lieth E, Khin SA, Antonetti DA, Buchanan AG, Gardner TW The Penn State Retina Research Group. Neural apoptosis in the retina during experimental and human diabetes. J Clin Invest. 1998;102:783–791. doi: 10.1172/JCI2425. [DOI] [PMC free article] [PubMed] [Google Scholar]
- Beltramo E, Berrone E, Giunti S, Gruden G, Perin PC, Porta M. Effects of mechanical stress and high glucose on pericyte proliferation, apoptosis, and contractile phenotype. Exp Eye Res. 2006;4:989–994. doi: 10.1016/j.exer.2006.05.008. [DOI] [PubMed] [Google Scholar]
- Bridges CC, Hu H, Miyauchi S, Siddaramappa UN, Ganapathy ME, Ignatowicz L, Maddox DM, Smith SB, Ganapathy V. Induction of cystine-glutamate transporter system xc− by human immunodeficiency virus type I transactivator protein tat in retinal pigment epithelium. Invest Ophthalmol Vis Sci. 2004;45:2906–2914. doi: 10.1167/iovs.03-1355. [DOI] [PMC free article] [PubMed] [Google Scholar]
- Bridges CC, Kekuda R, Wang H, Prasad PD, Mehta P, Huang W, Smith SB, Ganapathy V. Structure, function, and regulation of human cystine/glutamate transporter in retinal pigment epithelial cells. Invest Ophthalmol Vis Sci. 2001;42:47–54. [PubMed] [Google Scholar]
- Diabetes Control and Complications Trial Research Group. The effect of intensive treatment of diabetes on the development and progression of long-term complications in insulin-dependent diabetes mellitus. New Eng J of Med. 1993;329:977–986. doi: 10.1056/NEJM199309303291401. [DOI] [PubMed] [Google Scholar]
- Diabetes Control and Complications Trial Research Group. The absence of a glycemic threshold for the development of long-term complications: The perspective of the diabetes control and complications trial. Diabetes. 1996;45:1289–1298. [PubMed] [Google Scholar]
- Du Y, Miller CM, Kern TS. Hyperglycemia increases mitochondrial superoxide in retina and retinal cells. Free Radic Biol Med. 2003;35:1491–1499. doi: 10.1016/j.freeradbiomed.2003.08.018. [DOI] [PubMed] [Google Scholar]
- Dun Y, Mysona B, Van Ells T, Amarnath L, Shamsul Ola M, Ganapathy V, Smith SB. Expression of the cystine-glutamate exchanger (xc−) in retinal ganglion cells and regulation by nitric oxide and oxidative stress. Cell Tiss Res. 2006;324:189–202. doi: 10.1007/s00441-005-0116-x. [DOI] [PMC free article] [PubMed] [Google Scholar]
- Genuth S. Insights from the diabetes control and complications trial/epidemiology of diabetes interventions and complications study on the use of intensive glycemic treatment to reduce the risk of complications of type 1 diabetes. Endocr Prac. 2006;S1:34–41. doi: 10.4158/EP.12.S1.34. [DOI] [PubMed] [Google Scholar]
- Goto W, Ota T, Morikawa N, Otori Y, Hara H, Kawazu K, Miyawaki N, Tano Y. Protective effects of timolol against the neuronal damage induced by glutamate and ischemia in the rat retina. Brain Res. 2002;958:10–19. doi: 10.1016/s0006-8993(02)03372-3. [DOI] [PubMed] [Google Scholar]
- Gürler B, Vural H, Yilmaz N, Oguz H, Satici A, Aksoy N. The role of oxidative stress in diabetic retinopathy. Eye. 2000;5:730–735. doi: 10.1038/eye.2000.193. [DOI] [PubMed] [Google Scholar]
- Jiang G, Mysona B, Dun Y, Gnana-Prakasam JP, Pabla N, Li W, Dong Z, Ganapathy V, Smith SB. Expression, subcellular localization, and regulation of sigma receptor in retinal Müller cells. Invest Ophthalmol Vis Sci. 2006;12:5576–5582. doi: 10.1167/iovs.06-0608. [DOI] [PMC free article] [PubMed] [Google Scholar]
- Kanai Y, Hediger M. The glutamate/neutral amino acid transporter family SLC1: molecular, physiological, and pharmacological aspects. Pflugers Arch Eur J Physiol. 2004;447:469–479. doi: 10.1007/s00424-003-1146-4. [DOI] [PubMed] [Google Scholar]
- Kato S, Ishita S, Sugawara K, Mawatari K. Cystine/glutamate antiporter expression in retinal Müller glial cells: implications for DL-alpha-aminoadipate toxicity. Neurosci. 1993;57:473–482. doi: 10.1016/0306-4522(93)90080-y. [DOI] [PubMed] [Google Scholar]
- Kim JY, Kanai Y, Chairoungdua A, Cha AH, Matsuo H, Kim DK, Inatomi J, Sawa H, Ida Y, Endou H. Human cystine/glutamate transporter: cDNA cloning and upregulation by oxidative stress in glioma cells. Biochim Biophys Acta. 2001;2:335–344. doi: 10.1016/s0005-2736(01)00338-8. [DOI] [PubMed] [Google Scholar]
- Kowluru RA, Chan PS. Oxidative stress and diabetic retinopathy. Exp Diabetes Res. 2007;2007:43603. doi: 10.1155/2007/43603. [DOI] [PMC free article] [PubMed] [Google Scholar]
- Kowluru RA, Engerman RL, Case GL, Kern TS. Retinal glutamate in diabetes and effect of antioxidants. Neurochem Int. 2001;38:385–390. doi: 10.1016/s0197-0186(00)00112-1. [DOI] [PubMed] [Google Scholar]
- Kusner LL, Sarthy VP, Mohr S. Nuclear translocation of glyceraldehydes-3-phosphate dehydrogenase: A role in high glucose-induced apoptosis in retinal Müller cells. Invest Ophthalmol Vis Sci. 2004;5:1553–1561. [PubMed] [Google Scholar]
- Li Q, Puro DG. Diabetes-induced dysfunction of the glutamate transporter in retinal Müller cells. Invest Ophthalmol Vis Sci. 2002;43:3109–3116. [PubMed] [Google Scholar]
- Lieth E, Barber AJ, Xu B, Dice C, Ratz MJ, Tanase D, Strother JM. Glial reactivity and impaired glutamate metabolism in short term experimental diabetic retinopathy. The Penn State Research Group. Diabetes. 1998;47:815–820. doi: 10.2337/diabetes.47.5.815. [DOI] [PubMed] [Google Scholar]
- Martin PM, Roon P, Van Ells TK, Ganapathy V, Smith SB. Death of retinal neurons in streptozotocin-induced diabetic mice. Invest Ophthalmol Vis Sci. 2004;45:3330–3336. doi: 10.1167/iovs.04-0247. [DOI] [PubMed] [Google Scholar]
- McBean G. Cerebral cystine uptake: a tale of two transporters. Trends Pharmacol Sci. 2002;23:299–302. doi: 10.1016/s0165-6147(02)02060-6. [DOI] [PubMed] [Google Scholar]
- Naggar H, Shamsul Ola M, Moore P, Huang W, Bridges CC, Ganapathy V, Smith SB. Downregulation of reduced-folate transporter by glucose in cultured RPE cells and in RPE of diabetic mice. Invest Ophthalmol Vis Sci. 2002;43:556–563. [PMC free article] [PubMed] [Google Scholar]
- Nishikawa T, Edelstein D, Du XL, Yamagishi S, Matsumura T, Kaneda Y, Yorek MA, Beebe D, Oates PJ, Hammes HP, Giardino I, Brownlee M. Normalizing mitochondrial superoxide production blocks three pathways of hyperglycaemic damage. Nature. 2000;404:787–790. doi: 10.1038/35008121. [DOI] [PubMed] [Google Scholar]
- Otori Y, Wei JY, Barnstable CJ. Neurotoxic effects of low doses of glutamate on purified rat retinal ganglion cells. Invest Ophthalmol Vis Sci. 1998;39:972–981. [PubMed] [Google Scholar]
- Pulido JE, Pulido JS, Erie JC, Arroyo J, Bertram K, Lu M-J, Shippy SA. A role for excitatory amino acids in diabetic eye disease. Exp Diabetes Res. 2007;2007:36150. doi: 10.1155/2007/36150. [DOI] [PMC free article] [PubMed] [Google Scholar]
- Rauen T, Rothstein JD, Wässle H. Differential expression of three glutamate transporter subtypes in the rat retina. Cell Tiss Res. 1996;286:325–336. doi: 10.1007/s004410050702. [DOI] [PubMed] [Google Scholar]
- Rauen T, Taylor WR, Kuhlbrodt K, Wiessner M. High-affinity glutamate transporters in the rat retina: a major role of the glial glutamate transporter GLAST-1 in transmitter clearance. Cell Tiss Res. 1998;291:19–31. doi: 10.1007/s004410050976. [DOI] [PubMed] [Google Scholar]
- Sarthy VP, Pignataro L, Pannicke T, Weick M, Reichenbach A, Harada T, Tanaka K, Marc R. Glutamate transport by retinal Muller cells in glutamate/aspartate transporter-knockout mice. Glia. 2005;49:184–196. doi: 10.1002/glia.20097. [DOI] [PubMed] [Google Scholar]
- Sato H, Tamba M, Ishii T, Bannai S. Cloning and expression of a plasma membrane cystine/glutamate exchanger transporter composed of two distinct proteins. J Biol Chem. 1999;274:11455–11458. doi: 10.1074/jbc.274.17.11455. [DOI] [PubMed] [Google Scholar]
- Smith SB, Duplantier JN, Dun Y, Mysona B, Martin PM, Ganapathy V. In vivo protection against retinal neurodegeneration by the sigma receptor 1 ligand (+)-pentazocine Invest. Ophthamol Vis Sci. 2008;49:4154–61. doi: 10.1167/iovs.08-1824. [DOI] [PMC free article] [PubMed] [Google Scholar]
- Tomi M, Funaki T, Abukawa H, Katayama K, Kondo T, Sumio O, Ueda M, Obinata M, Terasaki T, Hosoya K. Expression and regulation of L-cystine transporter, system xc−, in the newly developed rat retinal Muller cell line (TR-MUL) Glia. 2003;43:208–217. doi: 10.1002/glia.10253. [DOI] [PubMed] [Google Scholar]
- Umapathy NS, Li W, Mysona BA, Smith SB, Ganapathy V. Expression and function of glutamine transporters SN1 (SNAT3) and SN2 (SNAT5) in retinal Müller cells. Invest Ophthalmol Vis Sci. 2005;46:3980–3987. doi: 10.1167/iovs.05-0488. [DOI] [PubMed] [Google Scholar]
- Van Reyk DM, Gillies MC, Davies MJ. The retina: oxidative stress and diabetes. Redox Report. 2003;8:187–192. doi: 10.1179/135100003225002673. [DOI] [PubMed] [Google Scholar]
- Vorwerk CK, Lipton SA, Zurakowski D, Hyman BT, Sabel BA, Dreyer EB. Chronic low-dose glutamate is toxic to retinal ganglion cells. Toxicity blocked by memantine. Invest Ophthalmol Vis Sci. 1996;37:1618–24. [PubMed] [Google Scholar]
- Ward MM, Jobling AI, Kalloniatis M, Fletcher EL. Glutamate uptake in retinal glial cells during diabetes. Diabetologia. 2005;2:351–360. doi: 10.1007/s00125-004-1639-5. [DOI] [PubMed] [Google Scholar]