

Abstract
Dendritic spines undergo the processes of formation, maturation, and pruning during development. Molecular mechanisms controlling spine maturation and pruning remain largely unknown. The gene for brain-derived neurotrophic factor (BDNF) produces two pools of mRNA, with either a short or long 3′ untranslated region (3′ UTR). Our previous results show that short 3′ UTR Bdnf mRNA is restricted to cell bodies, whereas long 3′ UTR Bdnf mRNA is also trafficked to dendrites for local translation. Mutant mice lacking long 3′ UTR Bdnf mRNA display normal spines at 3 weeks of age, but thinner and denser spines in adults compared to wild-type littermates. These observations suggest that BDNF translated from long 3′ UTR Bdnf mRNA, likely in dendrites, is required for spine maturation and pruning. In this study, using rat hippocampal neuronal cultures, we found that knocking down long 3′ UTR Bdnf mRNA blocked spine head enlargement and spine elimination, whereas overexpressing long 3′ UTR Bdnf mRNA had the opposite effect. The effect of long 3′ UTR Bdnf mRNA on spine head enlargement and spine elimination was diminished by a human single-nucleotide polymorphism (SNP, rs712442) in its 3′ UTR that inhibited dendritic localization of Bdnf mRNA. Furthermore, we found that overexpression of either Bdnf mRNA increased spine density at earlier time points. Spine morphological alterations were associated with corresponding changes in density, size, and function of synapses. These results indicate that somatically synthesized BDNF promotes spine formation, whereas dendritically synthesized BDNF is a key regulator of spine head growth and spine pruning.
Introduction
The dendritic tree of a typical projection neuron in the mammalian brain contains thousands of dendritic spines, which serve as the postsynaptic sites for the vast majority of excitatory synapses (Harris, 1999). Dendritic spines are highly dynamic structures that undergo changes in size, shape, and number during development, as well as in response to physiological stimuli such as learning (Holtmaat and Svoboda, 2009; Yoshihara et al., 2009). Alterations in spine shape and density are associated with a number of neurological disorders including mental retardation, epilepsy, and neurodegenerative diseases (Bhatt et al., 2009). In many cortical areas of humans and other mammals, spine density increases over a short period in early postnatal life, followed by a reduction to reach mature levels that requires a much longer period of time. During the pruning phase, up to 40% of spines are selectively eliminated, while the remaining spines mature, changing in morphology from long and thin to short and stubby (Marin-Padilla, 1967; Huttenlocher, 1979; Rakic et al., 1986; Grutzendler et al., 2002; Zuo et al., 2005b). Spine maturation and spine pruning are dependent upon neural activity and play a key role in the activity-dependent refinement of neuronal connections (Churchill et al., 2002; Mataga et al., 2004; Ethell and Pasquale, 2005; Zuo et al., 2005b). Many physiological and molecular factors have been found to regulate spine formation (Sala et al., 2008); however, the mechanism governing spine maturation is not well understood and very little is known about the molecular mechanisms underlying spine pruning.
Brain-derived neurotrophic factor (BDNF) is a potent regulator of neuronal development and synaptic plasticity (Waterhouse and Xu, 2009). The rodent and human Bdnf genes produce two populations of mRNA species, one with a short 3′ UTR (∼0.35 kb) and the other with a long 3′ UTR (∼2.85 kb) (Timmusk et al., 1993; Weickert et al., 2003). It has been shown that short 3′ UTR Bdnf mRNA is restricted to cell bodies in cortical and hippocampal neurons, whereas long 3′ UTR Bdnf mRNA is also transported to dendrites for local translation (An et al., 2008). Interestingly, cortical and hippocampal neurons in mutant mice lacking long 3′ UTR Bdnf mRNA have normal dendritic spines at 3 weeks of age, but thinner and denser dendritic spines (morphological features of immaturity) in the adult, compared to wild-type mice (An et al., 2008; Kaneko et al., 2012). These observations suggest that BDNF derived from long 3′ UTR Bdnf mRNA, likely in dendrites, plays a key role in spine pruning and late-phase spine maturation. In this study we established long-term cultures of rat hippocampal neurons, which allowed us to investigate the formation, maturation, and pruning of dendritic spines in vitro. Using this culture system, we showed that BDNF synthesized in cell bodies stimulated spine formation, whereas BDNF synthesized in dendrites regulated maturation and pruning of dendritic spines. These results indicate that the same protein synthesized in different subcellular compartments can have very distinct roles in the nervous system.
Materials and Methods
Animals and DNA constructs.
Sprague Dawley rats of both genders were purchased from Charles River Laboratories. All animal procedures were approved by the Georgetown University Animal Care and Use Committee.
The pActin-GFP construct has been described previously (Fischer et al., 1998). To generate BDNF-expressing constructs, we sequentially cloned the CMV promoter, the mouse Bdnf coding region that had a sequence insert encoding the Flag epitope (DYKDDDDK) immediately after the sequence encoding the signal peptide and was extended at its 3′ end with a sequence encoding the Myc epitope (EQKLISEEDL), and the mouse genomic sequence encoding the short Bdnf 3′ UTR (A) or the long Bdnf 3′ UTR (A*B) into pBluescript II KS (−) (Stratagene), thus generating pBDNF-A and pBDNF-A*B, respectively. We added 1 aa (Ala) between the Bdnf coding region and the Myc tag and 2 aa (AsnSer) to the C terminus of the Myc tag. In pBDNF-A*B, the first polyadenylation site was mutated from the sequence AATAAA to TTTTTT, and thus it only produces long 3′ UTR Bdnf mRNA.
To generate a construct expressing either short hairpin RNA (shRNA) or a scrambled derivative of the shRNA (control shRNA), two pairs of oligonucleotides were designed to produce DNA duplexes and subsequently cloned into pSUPER (Brummelkamp et al., 2002). The following oligonucleotides were used to generate shRNAs: long Bdnf 3′UTR shRNA, 5′-gatccccggaaggctcggaagcacccttcaagagagggtgcttccgagccttcctttttggaaa-3′ and 5′-agcttttccaaaaaggaaggctcggaagcaccctctcttgaagggtgcttccgagccttccggg-3′; scrambled shRNA, 5′-gatccccgccggacgcaccaggtagattcaagagatctacctggtgcgtccggctttttggaaa-3′ and 5′ agcttttccaaaaagccggacgcaccaggtagatctcttgaatctacctggtgcgtccggcggg-3′.
The GFP constructs for mRNA trafficking assays were generated by replacing the BGH 3′ UTR of the previously described GFP-BGH construct (An et al., 2008) with either the normal human Bdnf 3′ UTR (pBDNF-h3′UTR) or a human Bdnf 3′ UTR containing the G allele of SNP6 (pBDNF-h3′UTRsnp6g). The two constructs produce both transcripts with either a short or a long Bdnf 3′ UTR.
Production of adenoassociated virus.
To generate BDNF-expressing adenoassociated virus (AAV) constructs, we digested the pAAV-MCS vector (Stratagene) with NotI to remove the 1.7 kb fragment containing the CMV promoter, the β-globin intron, the multiple cloning sites (MCS), and the human growth hormone polyadenylation signal between the two AAV2 inverted terminal repeats. We then subcloned the NotI fragments from pBDNF-A and pBDNF-A*B, CMV-Flag-BDNF-Myc-A (1.8 kb), and CMV-Flag-BDNF-Myc-A*B (4.2 kb), into the NotI-digested pAAV-MCS vector, generating pAAV-BDNF-A and pAAV-BDNF-A*B, respectively. HEK293T cells were cultured in DMEM growth media (containing 4.5 g/L glucose, 110 mg/L sodium pyruvate, and 4 mm l-glutamine; Invitrogen) supplemented with 10% (v/v) heat-inactivated fetal bovine serum. Plasmid pAAV-BDNF-A or pAAV-BDNF-A*B was cotransfected with the helper plasmid pDC2 into HEK293T cells at >90% confluence. Media were refreshed 24 h after transfection. Cells and media were harvested 48 h after transfection. For infection of neuronal cultures, viral particles were purified through four consecutive freeze/thaw cycles, followed by centrifugation. For microinjection into the hippocampus, viral particles were purified using the AAV purification ViraKit (Virapur) according to the manufacture's protocol, and concentrated through VIVASPIN 6 columns (Sartrius Stedim Biotech).
Virus titers were determined by quantitative PCR, and 2 μl of viral preparation (∼8 × 10⁹ viral particles) was stereotaxically injected into the hippocampal CA1 and dentate gyrus regions of adult male Sprague Dawley rats, using the following coordinates: 3.3 mm posterior to bregma, 2.6 mm lateral to the midline, and 3.2 mm ventral to the dura (CA1); 4.4 mm posterior to bregma, 3.2 mm lateral to the midline, and 3.1 mm ventral to the dura (dentate gyrus). Virus was injected via a 30 gauge needle connected to a 10 μl Hamilton syringe by polyethylene tubing. Infusions were controlled by an infusion pump (New Era Pump Systems), which delivered virus at a rate of 0.15 μl/min. After infusion, the needle was left in place for at least 5 min before retraction to allow for diffusion of virus away from the needle tip. Upon retraction of the needle, a small piece of gelatin sponge was placed over the exposed brain and the scalp was sutured. Animals were allowed to survive for 3 weeks before being killed for subsequent immunohistochemistry.
Culture and transfection of primary neurons.
Hippocampal neurons, isolated from E18.5 Sprague Dawley rat embryos, were cultured at a density of 1.8 × 10⁵ cells per well in 12-well plates, according to procedures described previously (Sala et al., 2000; An et al., 2008). Briefly, isolated hippocampi were digested with 0.025% trypsin in 1× HBSS at 37°C for 15 min. Dissociated cells were plated onto 15-mm-diameter coverslips coated with poly-d-lysine (37.5 μg/ml) and laminin (2.5 μg/ml) in Neurobasal media (Invitrogen) supplemented with 2% B27, 0.5 mm l-glutamine, 0.125 mm glutamate, and 1% penicillin-streptomycin. At 7 d in vitro (DIV7), one half of the media was removed and replaced with an equal volume of fresh media, without glutamate. Each following week, cultures were supplemented with 200 μl of fresh medium. For transfection, 2 μl of Lipofectamine 2000 (Invitrogen) and plasmid DNA (0.4 μg/kb) were added to 100 μl of Neurobasal media individually and incubated at room temperature for 5 min. The two parts were then mixed and incubated at room temperature for another 25 min before adding onto each coverslip containing cultured hippocampal neurons. Culture media was replaced with conditioned media (fresh media mixed with 6-d-old culture media at a 1:1 ratio) after 3 h.
Immunocytochemistry.
Immunocytochemistry of cultured neurons was performed as described previously (An et al., 2008). The following primary antibodies were used: rabbit anti-GFP (Clontech Laboratories), 1:5000 dilution; mouse anti-GFP (BD Bioscience), 1:1000 dilution; mouse anti-Myc (Sigma-Aldrich), 1:5000 dilution; rabbit anti-Myc (Cell Signaling Technology), 1:1000 dilution; mouse anti-MAP2 (Sigma-Aldrich), 1:500 dilution; mouse anti-synaptophysin (EMD Millipore), 1:500 dilution; mouse anti-PSD95 (Millipore Cell Signaling Solutions), 1:1000 dilution; rabbit anti-GluR1 (synonyms, GluR1 and GluA1) (Calbiochem), 1:100 dilution. For protein distribution and synapse analyses, fluorescent immunocytochemistry was performed. Appropriate DyLight-conjugated secondary antibodies (Jackson ImmunoResearch Laboratories) were used at a dilution of 1:500. For analysis of surface expression of the GluA1 subunit of AMPA receptors, cells were live labeled with the anti-GluA1 antibody for 20 min at 37°C and then washed in 1× DMEM. Cells were then fixed for 10 min with 4% paraformaldehyde/4% sucrose at room temperature. Surface GluA1 receptors were labeled with an appropriate DyLight-conjugated secondary antibody. Cells were then permeabilized and stained with antibodies to GFP to mark neuronal architecture. For spine density and morphology analyses, immunocytochemistry was performed using a biotinylated secondary antibody and an avidin–biotin complex solution (Vector Laboratories). Immunoreactivity was visualized using a solution containing 0.05% DAB and 0.003% H2O2 in 100 mm Tris, pH 7.5. After colorimetric reaction was complete, cells were rinsed with 100 mm Tris and dehydrated, and then coverslips were mounted onto glass slides using DPX mounting medium.
Immunohistochemistry.
Animals were killed by transcardial perfusion of PBS followed by 4% paraformaldehyde. Brains were removed, mounted in OCT medium, and frozen at −80°C. Serial sections (50 μm) were cut through the hippocampus using a cryostat. Sections were stored in an antifreeze solution at −20°C until use. Immunohistochemistry of rat tissue was performed as described previously (An et al., 2008). The following primary antibodies were used: rabbit anti-Myc (Cell Signaling Technology), 1:1500 dilution; mouse anti-neurofilament (EMD Millipore), 1:1000 dilution.
Fluorescence in situ hybridization.
Fluorescence in situ hybridization (FISH) of cultured hippocampal neurons on coverslips was performed using DIG-labeled riboprobes and the TSA Plus Fluorescein System as described previously (An et al., 2008). Probe concentrations were 500 ng/ml for Bdnf mRNA and 100 ng/ml for GFP mRNA.
Western blotting.
Western blots were performed using the Odyssey Infrared Imaging System (LI-COR Biosciences). Cell lysates were collected using lysis buffer containing protease inhibitors for mammalian cell/tissue extracts (Sigma-Aldrich). Media samples were immunoprecipitated with Myc antibodies bound to protein G-Sepharose beads (Thermo Scientific). The following primary antibodies were used: mouse anti-Myc (Sigma-Aldrich), 1:500 dilution; rabbit anti-Myc (Cell Signaling Technology), 1:1000 dilution; mouse anti-α tubulin (Sigma-Aldrich), 1:1000 dilution. Appropriate IRDye infrared secondary antibodies were purchased from LI-COR Biosciences and used at a dilution of 1:10,000.
Spine analysis.
Transfected cultures were fixed and stained with an antibody to GFP at DIV14, DIV21, DIV28, DIV35, and DIV42, as described above. All dendritic spines on one entire main dendrite per neuron (>180 μm in length) were traced directly under a Nikon Eclipse E800 microscope with an oil-immersion lens (Nikon; Plan APO 60×/NA 1.40) using Neurolucida software (MicroBrightField) and a Retiga-2000R camera (QImaging). During tracing, we adjusted the focus along the dendrite to mark all of the recognizable spines. Spine density was then calculated from traced dendritic spines on the whole dendrite, using NeuroExplorer software (MicroBrightField). Spine densities of at least 10 neurons from multiple coverslips were analyzed for each experimental condition. To avoid variations that occur between different culture preparations, all neurons analyzed for each experiment were obtained from the same culture preparation. To analyze the morphology of spines, multiple high-magnification images using an oil-immersion lens (60×) were taken along a segment of one main dendrite that is 50–100 μm away from the soma for each neuron. Spine head diameter and length were measured using NIH ImageJ software. Spine head diameter and spine length are defined as the maximum width of the spine head and the distance from the tip of the spine head to the interface with the dendritic stalk, respectively. At least 10 neurons from multiple coverslips and ∼50 spines per neuron were analyzed for each experimental condition. Analyses of spine density, spine head diameter, and spine length were performed blindly.
Synapse measurements.
Fluorescent immunocytochemistry was performed as described above. Single confocal images were taken of stained cultured neurons using an Olympus Laser Scanning microscope (FV-500) with an oil-immersion 60× lens. Analyses were performed on synapses that were associated with either transfected neurons or nontransfected neurons. The size, density, and fluorescence intensity of immunoreactive puncta were quantified using a custom macro for NIH ImageJ software. Dendrites from 10–13 neurons were analyzed for each condition.
Protein and mRNA distribution analyses.
Immunocytochemistry or FISH was performed as described above. Single confocal images were taken of transfected neurons using an Olympus laser scanning microscope (FV-500) with a 60× oil-immersion lens. For somatic measurements, the outline of a cell body was traced, and fluorescence intensity was quantified using NIH ImageJ software. For dendritic measurements, dendrites were straightened, and fluorescence intensity per 10 or 50 μm bin was analyzed using a custom macro for NIH ImageJ software.
Real-time PCR analyses.
Total RNA was isolated from cultured hippocampal neurons at DIV7, DIV14, DIV21, and DIV28 using Trizol reagent according to the manufacturer's protocol (Invitrogen). Isolated RNA was treated with DNase I for 30 min at 37°C to remove genomic DNA. cDNA was synthesized using Superscript II Reverse Transcriptase and oligo(dT) primers according to the manufacturer's protocol (Invitrogen). The reactions were diluted with H2O to 120 μl. Five microliters of this mixture were added to each real-time (RT)-PCR reaction for measurement of mRNA levels for Rpl10a, Bdnf coding region, and the long Bdnf 3′ UTR using SYBR Green mix (Roche Applied Science). Each measurement was done in triplicate, and DNase I-treated RNA samples were used as negative controls. RT-PCR was performed using an Applied Biosystems Step One Real-Time PCR System (Invitrogen). The primers for RT-PCR are 5′-GAAGAAGGTGCTGTGTTTGGC-3′ (Rpl 10a), 5′-TCGGTCATCTTCACGTGGC-3′ (Rpl 10a), 5′-GCTGCGCCCATGAAAGAA-3′ (Bdnf coding), 5′-CACAGCTGGGTAGGCCAAGT-3′ (Bdnf coding), 5′-CATCACAATCTCACGGTATTCGA-3′ (Bdnf long 3′ UTR), and 5′-AGTTGCGGAGGGTCTCCTATG-3′ (Bdnf long 3′ UTR). To analyze changes in total Bdnf mRNA and long 3′ UTR Bdnf mRNA levels, the threshold cycle (CT) values were averaged for each sample per primer pair, to obtain a mean CT value. Ribosomal protein 10a (Rpl10a) mRNA was measured for internal sample normalization. Relative mRNA expression levels were calculated by the comparative threshold cycle method (ΔΔCt).
Electrophysiological recordings.
Cultured hippocampal neurons (DIV27–DIV29), plated on 15 mm glass coverslips, were used for recordings. Neurons were visualized under an upright microscope equipped with a 60× water-immersion objective with a long working distance (2 mm) and high numerical aperture (1.0). Identification of GFP-expressing neurons was performed by epifluorescent excitation of the culture with a mercury-based lamp and standard GFP filter sets. Green neurons with a pyramidal-shaped soma and three to six primary dendrites and the presence of spines were selected for recording purposes.
Recording electrodes were pulled on a vertical pipette puller from borosilicate glass capillaries. For examination of glutamate receptor responses, ruptured-patch whole-cell voltage-clamp recordings were obtained using pipettes (4–6 MΩ tip resistance) filled with an internal solution containing the following (in mm): 120 CsMeSO3, 5 NaCl, 10 tetraethylammonium-Cl, 10 HEPES, 5 QX-314, 1.1 EGTA, 4 Na-ATP, and 0.3 Na-GTP, pH adjusted to 7.2 with CsOH. Extracellular solution was perfused through the chamber at a rate of 2.0–2.8 ml/min and contained the following (in mm): 145 NaCl, 5 KCl, 1 CaCl2, 5 HEPES, 5 glucose, 26 sucrose, and 0.25 mg/L phenol red, with pH adjusted to 7.4 with NaOH. Voltage-clamp recordings were performed at a holding potential of −70 mV using either a Multiclamp 700B or an Axopatch 1-D amplifier (Molecular Devices).
Stock solutions of bicuculline methobromide (BMR), TTX, and 1,2,3,4-tetrahydro-6-nitro-2,3-dioxo-benzo[f]quinoxaline-7-sulfonamide disodium salt hydrate (NBQX) were prepared in water. AMPA receptor-mediated miniature EPSCs (mEPSCs) were isolated by local application of 25 μm BMR and 0.5 μm TTX through the “Y tube” method (Murase et al., 1989). Five micromolar NBQX was tested in a subset of cells to determine that all events were AMPA receptor mediated. Drug-containing stock solutions were diluted to the desired working concentration in the extracellular solution. Currents were low-pass filtered at 2 kHz and digitized at 5–10 kHz using a Dell computer equipped with Digidata 1322A data acquisition board and pCLAMP9 software (Molecular Devices). Off-line data analysis, curve fitting, and figure preparation were performed with Clampfit 10, Igor 6 software (Wavemetrics), and Mini Analysis Program (Synaptosoft 6.07). Selection of mEPSCs was performed manually, and at least 100 events were identified for each cell (mean, 135 events). The average frequency, amplitude, and decay time for each cell were used for comparison between groups.
Northern blotting.
Northern blots on HEK293T cell lysates were performed as described previously (An et al., 2008). Probes to the Bdnf coding region and GFP were used for hybridization.
Statistical analysis.
All data are expressed as mean ± SEM. Bartlett's test for equal variance was applied to all data sets, and the variances among groups were not shown to be statistically different from each other. The significance of differences was tested using unpaired Student's t test, or one-way or two-way ANOVA with post hoc Bonferroni's correction. Differences are considered significant for p values of <0.05. One or two-way ANOVAs were performed using GraphPad Prism (GraphPad Software).
Results
An in vitro system for the analysis of spine morphogenesis
It is difficult to dissect the molecular cascade underlying the effect of long 3′ UTR Bdnf mRNA on spine development in vivo. To address this issue, we established an in vitro system to investigate the formation, maturation, and pruning of dendritic spines. In this system, we transfected cultured rat embryonic hippocampal neurons at DIV7 with the pActin-GFP construct expressing actin-GFP (Fischer et al., 1998) and then examined the number and size of actin-GFP-labeled spines at DIV14, DIV21, DIV28, DIV35, and DIV42 (Fig. 1A). Actin-GFP was used because it intercalates into spines and improves visualization of the dendritic architecture (Fig. 1B,C). In all of the described in vitro spine morphology experiments, we analyzed pyramidal neurons with three to seven primary dendrite branches.
Figure 1.

Establishment of an in vitro system for the analysis of spine morphogenesis. A, Timeline of transfection with pActin-GFP and fixation for immunocytochemistry of cultured rat hippocampal neurons. B, A cultured rat hippocampal neuron at DIV28, stained with an antibody to GFP. C, Representative dendritic segments from transfected and stained neurons at DIV14, DIV21, and DIV28, showing density and morphology of dendritic spines. D, Density of dendritic spines in cultured neurons at DIV14, DIV21, and DIV28 (n = 10 neurons for each time point). E, Head diameter of dendritic spines in cultured neurons at DIV14, DIV21, and DIV28 (n = 10 neurons for each time point). F, Length of dendritic spines in cultured neurons at DIV14, DIV21, and DIV28 (n = 10 neurons for each time point). G, Representative images of dendrites from neurons transfected with pActin-GFP, showing spine morphology at DIV35 and DIV42. H–J, Density, head diameter, and length of dendritic spines in cultured neurons expressing actin-GFP at DIV35 and DIV42 (n = 10 neurons/condition). Note that the data presented in D–F and H–J were obtained from different experiments. Scale bars: 25 μm. *p < 0.05, compared to the earlier time point (Student's t test); **p < 0.01, ***p < 0.001, compared to the DIV14 time point (one-way ANOVA with post hoc Bonferroni's correction).
Analysis of dendritic spines at each time point revealed that spine density peaked at DIV14, followed by progressive spine head enlargement and spine shortening during weeks 3–5 and a reduction in spine density from the fourth week to at least the sixth week in vitro (Fig. 1C--J). This time course of spine development mimicked what occurs in vivo in the rodent cerebral cortex and hippocampus (Zuo et al., 2005a; An et al., 2008). To ensure that we investigated spine morphogenesis in healthy neurons, we analyzed dendritic spines only up to DIV28 in all of our subsequent experiments.
Long 3′ UTR Bdnf mRNA is essential for spine head enlargement and spine density reduction
Adult mutant mice, in which the long Bdnf 3′ UTR is truncated, display more numerous and thinner dendritic spines in cortical and hippocampal neurons than wild-type mice (An et al., 2008; Kaneko et al., 2012). We therefore asked whether selectively knocking down endogenous long 3′ UTR Bdnf mRNA would inhibit spine head growth and spine density reduction, normally observed during weeks 2–4 in vitro. We generated a construct expressing an shRNA that specifically targets rat long 3′ UTR Bdnf mRNA (termed long Bdnf 3′ UTR shRNA) as well as an shRNA construct expressing its scrambled sequence as a control. Cultured hippocampal neurons were transfected at DIV7 with one of these two shRNA constructs, in combination with pActin-GFP. FISH using riboprobes directed to a sequence unique to the long 3′ UTR of Bdnf mRNA, combined with fluorescent immunocytochemistry with a GFP antibody to label transfected neurons, indicated that long Bdnf 3′ UTR shRNA reduced levels of long 3′ UTR Bdnf mRNA by >80% in both somata and dendrites of transfected neurons, compared to neurons expressing scrambled shRNA (Fig. 2A–C). Long Bdnf 3′ UTR shRNA also significantly reduced levels of total Bdnf mRNA in both somata and dendrites of neurons, as measured with FISH using riboprobes directed to the Bdnf coding sequence (Fig. 2D–F).
Figure 2.

Knocking down endogenous long 3′ UTR Bdnf mRNA impairs spine head enlargement, spine shortening, and spine density reduction in cultured hippocampal neurons. A, Representative FISH images from neurons transfected with pActin-GFP and a construct expressing either scrambled shRNA or long Bdnf 3′ UTR shRNA. B, Levels of long 3′ UTR Bdnf mRNA in somata of neurons as represented in A. **p < 0.01 (Student's t test; n = 20–22 neurons/condition). C, Levels of long 3′ UTR Bdnf mRNA in dendrites of neurons as represented in A. F(2,120) condition × distance = 3.211; p < 0.05 (two-way ANOVA). ***p < 0.001 (post hoc tests with Bonferroni's correction). D, Representative FISH and immunocytochemistry images from neurons transfected with pActin-GFP and a construct expressing either scrambled shRNA or long Bdnf 3′ UTR shRNA, showing total Bdnf mRNA. E, Levels of total Bdnf mRNA in somata of neurons as represented in D. *p < 0.05 (Student's t test; n = 33 and 26 neurons/condition). F, Levels of total Bdnf mRNA in dendrites of neurons as represented in D. F(9,310) condition × distance = 6.477; p < 0.0001 (two-way ANOVA). *p < 0.05; **p < 0.01 when compared to the scrambled shRNA control at each binned distance (post hoc tests with Bonferroni's correction; n = 19 and 14 neurons/condition). G, Diagram of a construct that expresses mouse long 3′ UTR Bdnf mRNA (pBDNF-A*B). P, Promoter; CDS, coding sequence. H, Representative dendrites of neurons transfected with pActin-GFP and constructs expressing either scrambled shRNA, long Bdnf 3′ UTR shRNA, or long Bdnf 3′ UTR shRNA and mouse long 3′ UTR Bdnf mRNA, showing spine morphology at DIV28. I, Average spine density of neurons as represented in H (n = 10 neurons/condition). F(4,81) condition × DIV = 6.463; p < 0.0001 (two-way ANOVA). J, Average spine head diameter of neurons as represented in H (n = 10 neurons/condition). F(4,81) condition × DIV = 39.56; p < 0.0001 (two-way ANOVA). K, Average spine length of neurons as represented in H (n = 10 neurons/condition). F(4,81) condition × DIV = 13.31; p < 0.0001 (two-way ANOVA). *p < 0.05, **p < 0.01 when compared to scrambled shRNA at the same time point; †p < 0.05, ††p < 0.01 when two indicated groups were compared; ##p < 0.01 when compared to the DIV14 time point within the same condition (post hoc tests with Bonferroni's correction). Scale bars: A, 100 μm; D, 50 μm; H, 10 μm.
We transfected cultured hippocampal neurons with the construct expressing either long Bdnf 3′ UTR shRNA or scrambled shRNA, in combination with pActin-GFP, at DIV7 (Fig. 2H). As expected, neurons expressing scrambled shRNA showed a decrease in spine density from DIV21 to DIV28 (Fig. 2I), as well as an increase in spine head diameter and a concomitant decrease in spine length from DIV14 to DIV28 (Fig. 2J,K). However, knocking down endogenous long 3′ UTR Bdnf mRNA abolished these changes. Neurons expressing long Bdnf 3′ UTR shRNA exhibited significantly increased spine density and spine length, as well as decreased spine head diameter compared to control neurons at DIV28 (Fig. 2H–K).
To confirm the specificity of long Bdnf 3′ UTR shRNA, we generated a construct (pBDNF-A*B) to express mouse long 3′ UTR Bdnf mRNA, which is resistant to long Bdnf 3′ UTR shRNA (Fig. 2G). In pBDNF-A*B, the first polyA site was mutated so that this construct only produced long 3′ UTR Bdnf mRNA. The encoded BDNF contained a Flag tag immediately after the signal peptide and a Myc tag at its C terminus, so that the Flag tag labeled both proBDNF and the BDNF propeptide (the segment cleaved off to produce mature BDNF), whereas the Myc tag marked both mature BDNF and proBDNF. Expressing this mouse long 3′ UTR Bdnf mRNA completely reversed the inhibitory effect of long Bdnf 3′ UTR shRNA on spine head growth, spine shortening, and spine density reduction (Fig. 2H--K). Surprisingly, neurons overexpressing mouse long 3′ UTR Bdnf mRNA had higher spine density at DIV14 and DIV21 and much larger spine heads at DIV21 and DIV28 compared to neurons expressing scrambled shRNA (Fig. 2H–K). These results show that endogenous long 3′ UTR Bdnf mRNA is essential for spine head growth and spine shortening, as well as spine density reduction, while suggesting a correlation between levels of BDNF and the formation and head growth of dendritic spines.
BDNF translated from long 3′ UTR Bdnf mRNA is enriched in dendrites and largely remains as proBDNF
To further examine the effect of BDNF overexpression on morphogenesis of dendritic spines, we also generated a construct (pBDNF-A) to express mouse short 3′ UTR Bdnf mRNA (Fig. 3A). Except for the sequence for the 3′ UTR, pBDNF-A is otherwise identical to pBDNF-A*B. Twenty-four hours after transfection, Myc immunocytochemistry revealed that BDNF levels in neurons transfected with pBDNF-A*B (expressing long 3′ UTR Bdnf mRNA) were significantly greater in dendrites but significantly lower in somata compared to neurons transfected with pBDNF-A (expressing short 3′ UTR Bdnf mRNA) (Fig. 3B,C), indicating translation of long 3′ UTR Bdnf mRNA in dendrites. When neurons were transfected with pActin-GFP and BDNF-expressing constructs at DIV7, expression of both BDNF and actin-GFP persisted to at least DIV28 (Fig. 3D).
Figure 3.

Localization and processing of BDNF translated from short or long 3′ UTR Bdnf mRNA. A, Diagram of a construct that expresses mouse short 3′ UTR Bdnf mRNA (pBDNF-A). P, Promoter; CDS, coding sequence. B, Levels of Myc-tagged BDNF in somata of neurons transfected with either pBDNF-A or pBDNF-A*B. **p < 0.01 (Student's t test; n = 25–27 neurons/condition). C, Levels of Myc-tagged BDNF in dendrites of neurons transfected with either pBDNF-A or pBDNF-A*B. F(2,105) condition × distance = 24.39; p < 0.0001 (two-way ANOVA). **p < 0.01 (post hoc tests with Bonferroni's correction). D, Representative Myc and GFP immunocytochemistry images of DIV28 neurons transfected with pActin-GFP and either pBK (empty vector), pBDNF-A or pBDNF-A*B. E, Representative Myc immunohistochemistry images showing rat hippocampal CA1 neurons injected with AAV-BDNF-A or AAV-BDNF-A*B. F, Representative Myc and neurofilament immunohistochemistry images showing Myc-positive axonal terminals in the CA3 region of granule cells infected with AAV-BDNF-A or AAV-BDNF-A*B. G, Myc immunoblotting of cell lysates from DIV35 neurons infected with either AAV-BDNF-A (A) or AAV-BDNF-A*B (A*B), showing the relative abundance of mature BDNF and proBDNF. The left blot compares cell lysates from transfected and non-transfected neurons to reveal mature and pro-BDNF bands (arrows) and nonspecific bands (asterisks). H, Representative Myc immunoblot of conditioned media from DIV35 neuronal cultures infected with either AAV-BDNF-A (A) or AAV-BDNF-A*B (A*B). I, Quantification of mature BDNF levels in cell lysates and conditioned media from neuronal cultures infected with either AAV-BDNF-A or AAV-BDNF-A*B. *p < 0.05 (Student's t test for comparisons between conditions; cell lysate, n = 8 samples/condition; conditioned media, n = 5 samples/condition). J, Quantification of proBDNF levels in cell lysates and conditioned media from neuronal cultures infected with either AAV-BDNF-A or AAV-BDNF-A*B. ***p < 0.001 (Student's t test for comparisons between conditions; cell lysate, n = 8 samples/condition; conditioned media, n = 5 samples/condition). Scale bars: D, E, 50 μm; F, 10 μm.
To determine whether long 3′ UTR Bdnf mRNA is translated in dendrites in vivo, we generated adenoassociated viruses to express short 3′ UTR Bdnf mRNA (AAV-BDNF-A) and long 3′ UTR Bdnf mRNA (AAV-BDNF-A*B). We injected one of the two viruses into hippocampal CA1 and dentate gyrus regions of adult rats and used Myc immunohistochemistry to reveal virally expressed BDNF. In agreement with what we observed in cultured neurons (Fig. 3B–D), pyramidal neurons infected with AAV-BDNF-A*B had higher levels of virally expressed BDNF in distal dendrites than those infected with AAV-BDNF-A (Fig. 3E). This result indicates that a large portion of BDNF in distal dendrites comes from local translation of long 3′ UTR Bdnf mRNA in vivo. A previous study has shown that BDNF localizes to presynaptic nerve terminals (Dieni et al., 2012). In agreement with this observation, we also detected BDNF protein at presynaptic nerve terminals of neurons infected with either virus, as evidenced by colocalization of Myc immunoreactivity with an axonal marker, neurofilament, within mossy fiber terminals in the CA3 region of the hippocampus (Fig. 3F).
To investigate proBDNF and mature BDNF levels in neurons overexpressing short and long 3′ UTR Bdnf mRNA, we infected cultured hippocampal neurons at DIV21 with AAV-BDNF-A (expressing short 3′ UTR Bdnf mRNA) or AAV-BDNF-A*B (expressing long 3′ UTR Bdnf mRNA). At DIV35, we collected media (termed “conditioned media”) as well as cell lysates. BDNF in the media was immunoprecipitated with a mouse anti-Myc antibody. We used immunoblotting to detect BDNF in the cell lysates and immunoprecipitates using a rabbit anti-Myc antibody. Protein analysis revealed that cell lysates from neurons infected with AAV-BDNF-A contained a comparable amount of mature BDNF, but significantly less proBDNF than neurons infected with AAV-BDNF-A*B (Fig. 3G,I,J). The lower level of total BDNF (mature BDNF plus proBDNF) in neurons infected with AAV-BDNF-A compared to neurons infected with AAV-BDNF-A*B was likely a result of constitutive secretion of mature BDNF from these neurons, as evidenced by the observation that the conditioned media from neurons infected with AAV-BDNF-A had significantly higher levels of mature BDNF but similar levels of proBDNF, compared to neurons infected with AAV-BDNF-A*B (Fig. 3H–J).
Distinct roles of short and long 3′ UTR Bdnf mRNAs in spine morphogenesis
To determine the effects of overexpressing short or long 3′ UTR Bdnf mRNA on spine morphogenesis, we transfected neurons at DIV7 with pActin-GFP and pBK, pBDNF-A, or pBDNF-A*B (Fig. 4A). Spine number, head diameter, and length were analyzed at DIV14, DIV21, and DIV28. Overexpression of either short or long 3′ UTR Bdnf mRNA increased spine density at DIV14 and DIV21 (Fig. 4B). While overexpression of long 3′ UTR Bdnf mRNA promoted spine head enlargement during the third and fourth weeks (Fig. 4D,E) and spine density reduction during the fourth week (Fig. 4B,C), overexpression of short 3′ UTR Bdnf mRNA appeared to freeze spine development at DIV14 (Fig. 4B–G). As a consequence, compared to control neurons at DIV28, neurons overexpressing long 3′ UTR Bdnf mRNA displayed an 80% increase in spine head diameter and normal spine density and spine length, whereas neurons overexpressing short 3′ UTR Bdnf mRNA exhibited a 75% increase in spine density, a 68% increase in spine length, and a 49% decrease in spine head diameter (Fig. 4). It is important to note that changes observed in spine number and spine shape reflect changes in the spine population as a whole, as indicated by the density along dendrite plot (Fig. 4C) or cumulative distribution plots of spine head diameter and spine length (Fig. 4E,G). We found that actin-GFP expression did not interfere with spine morphogenesis, because the two Bdnf mRNAs had consistent opposing effects on spine head diameter and spine length at DIV28 when a non-actin-containing GFP was used to label transfected neurons (Fig. 5A,B). The observed effects on spine density and spine morphology from the two forms of Bdnf mRNA result from the direct action of BDNF, rather than a secondary effect from altered neuronal properties due to long-term BDNF overexpression, because transfection of the two BDNF-expressing constructs at DIV21 (instead of DIV7) still induced similar changes in spine head diameter and spine length at DIV28 (Fig. 5C,D). These results indicate that while both short and long 3′ UTR Bdnf mRNAs promote spine formation, their overexpression has opposing effects on the morphology and density of spines at later time points. Because spine head enlargement and spine shortening occur concordantly during spine maturation, we focused on the former in the majority of the subsequent experiments.
Figure 4.
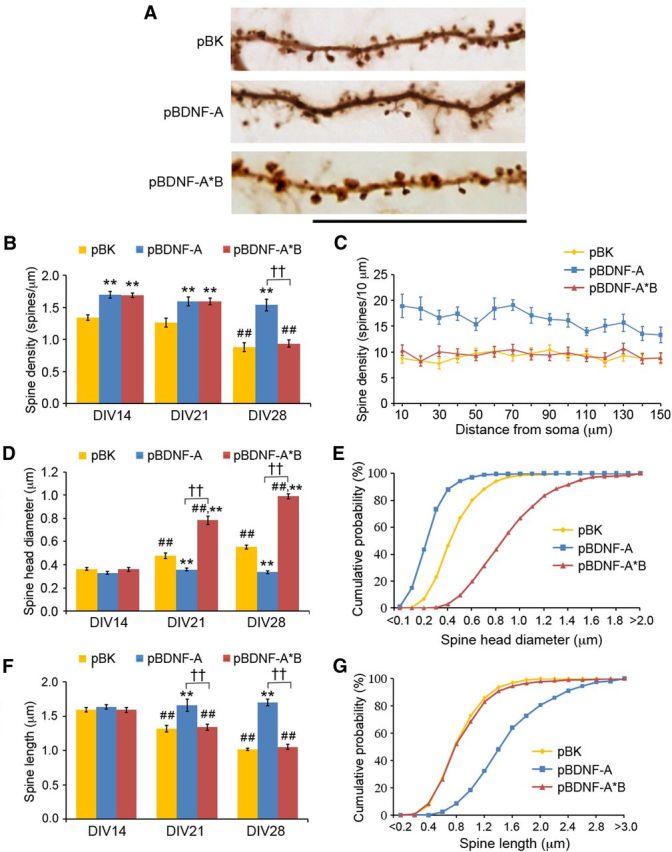
Short and long 3′ UTR Bdnf mRNAs have distinct roles in spine morphogenesis. A, Representative dendrites of neurons transfected with pActin-GFP and pBK, pBDNF-A, or pBDNF-A*B, showing spine morphology at DIV28. Scale bar, 25 μm. B, Average spine density of neurons transfected with pActin-GFP and pBK, pBDNF-A, or pBDNF-A*B at DIV14, DIV21, and DIV28 (n = 10 neurons/condition). F(4,81) condition × DIV = 7.607; p < 0.0001 (two-way ANOVA). C, Spine density along dendrites of DIV28 hippocampal neurons transfected with pActin-GFP and pBK, pBDNF-A, or pBDNF-A*B. F(20,270) condition × distance = 2.802; p < 0.0001 (two-way ANOVA; n = 10 neurons/condition). D, Average spine head diameter of neurons transfected with pBK, pBDNF-A, or pBDNF-A*B in combination with pActin-GFP at DIV14, DIV21, and DIV28 (n = 10 neurons/condition). F(4,81) condition × DIV = 67.27; p < 0.0001 (two-way ANOVA). E, Cumulative distribution of spine head diameter of neurons transfected with pBK, pBDNF-A, or pBDNF-A*B in combination with pActin-GFP at DIV14, DIV21, and DIV28. F(40,567) condition × diameter = 74.90; p < 0.0001 (two-way ANOVA; n = 10 neurons/condition). F, Average spine length of neurons transfected with pBK, pBDNF-A, or pBDNF-A*B in combination with pActin-GFP at DIV14, DIV21, and DIV28 (n = 10 neurons/condition). F(4,81) condition × DIV = 14.87; p < 0.0001 (two-way ANOVA). G, Cumulative distribution of spine length of neurons transfected with pBK, pBDNF-A, or pBDNF-A*B in combination with pActin-GFP at DIV14, DIV21, and DIV28 (n = 10 neurons/condition). F(58,810) condition × length = 88.28; p < 0.0001 (two-way ANOVA). **p < 0.01 when compared to the pBK control at the same time point; ††p < 0.01 when two indicated groups were compared; ##p < 0.01 when compared to the DIV14 time point within the same condition (post hoc tests with Bonferroni's correction).
Figure 5.
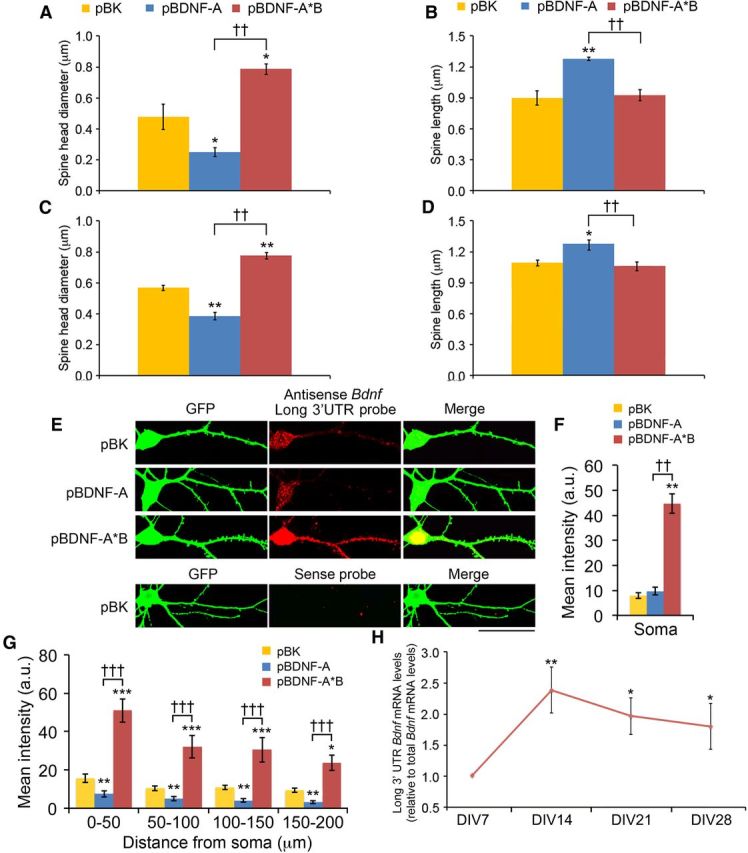
Effects of overexpressing Bdnf mRNA on dendritic spines and mRNA localization. A, B, Average spine head diameter and spine length of DIV28 neurons transfected with a non-actin-containing GFP construct and pBK, pBDNF-A, or pBDNF-A*B (n = 10 neurons/condition). C, D, Average spine head diameter and spine length of DIV28 neurons transfected with pActin-GFP and pBK, pBDNF-A, or pBDNF-A*B at DIV21 (n = 10 neurons/condition). E, Representative FISH and immunocytochemistry images for DIV19 neurons transfected with pActin-GFP and pBK, pBDNF-A, or pBDNF-A*B. The antisense long Bdnf 3′ UTR probe was used to detect long 3′ UTR Bdnf mRNA. Scale bar, 50 μm. F, Levels of long 3′ UTR Bdnf mRNA in somata (n = 13, 15 and 16 neurons/condition) of neurons as represented in E. **p < 0.01 when compared to the pBK control; ††p < 0.01 when two indicated groups were compared (one-way ANOVA with post hoc Bonferroni's correction; A–D, F). G, Levels of long 3′ UTR Bdnf mRNA in dendrites (n = 12, 13, and 16 neurons/condition) of neurons as represented in E. F(6,144) condition × distance = 1.878; p < 0.0884 (two-way ANOVA). *p < 0.05, **p < 0.01, ***p < 0.001 when compared to the pBK control at the same time point; †††p < 0.001 when two indicated groups were compared (post hoc tests with Bonferroni's correction). H, Relative abundance of long 3′ UTR Bdnf mRNA to total Bdnf mRNA in cultured hippocampal neurons (n = 8 samples per time point, performed in triplicate). *p < 0.05; **p < 0.01 when compared to the DIV7 time point (one-way ANOVA with post hoc Bonferroni's correction).
Both knocking down long 3′ UTR Bdnf mRNA and overexpressing short 3′ UTR Bdnf mRNA inhibited spine head enlargement, spine shortening, and spine density reduction (Figs. 2, 4). We thus considered the possibility that overexpression of short 3′ UTR Bdnf mRNA might impair the function of endogenous long 3′ UTR Bdnf mRNA. Indeed, neurons transfected with pBDNF-A (expressing short 3′ UTR Bdnf mRNA) showed significantly reduced levels of long 3′ UTR Bdnf mRNA in dendrites without affecting its levels in somata, whereas neurons transfected with pBDNF-A*B (expressing long 3′ UTR Bdnf mRNA) exhibited significantly increased levels of long 3′ UTR Bdnf mRNA in both somata and dendrites (Fig. 5E–G). This result suggests that overexpression of short 3′ UTR Bdnf mRNA inhibits spine head enlargement, spine shortening, and spine density reduction by impairing dendritic localization of Bdnf mRNA and/or destabilizing dendritic long 3′ UTR Bdnf mRNA.
The aforementioned results suggest that short and long 3′ UTR Bdnf mRNAs play different roles in spine morphogenesis. We therefore asked whether endogenous levels of short and long 3′ UTR Bdnf mRNA change during development of dendritic spines, and tested this by measuring Bdnf mRNA levels in hippocampal cultures at DIV7, DIV14, DIV21, and DIV28. Total Bdnf mRNA and long 3′ UTR Bdnf mRNA were detected using quantitative RT-PCR, with primer pairs directed to the Bdnf coding sequence and a sequence unique to the long 3′ UTR segment. Analysis revealed that compared to Bdnf mRNA expression at DIV7, the ratio of long 3′ UTR Bdnf mRNA to total Bdnf mRNA was significantly higher at DIV14, DIV21, and DIV28 (Fig. 5H).
Collectively, the results from the knockdown and overexpression experiments show that both forms of Bdnf mRNA increase spine density at weeks 2 and 3 in vitro, while long 3′ UTR Bdnf mRNA is a key regulator of spine head enlargement, spine shortening, and spine density reduction during weeks 3 and 4 in vitro. Because short 3′ UTR Bdnf mRNA is restricted to the soma, whereas long 3′ UTR Bdnf mRNA also localizes to dendrites for local translation (An et al., 2008), our results suggest that BDNF synthesized in the soma promotes spine formation, whereas BDNF synthesized in the dendrites controls spine head enlargement and spine density reduction.
Effects of a single-nucleotide polymorphism on dendritic localization of long 3′ UTR Bdnf mRNA, spine head enlargement, and spine density reduction
If dendritically synthesized BDNF indeed controls the late-phase development of dendritic spines, a mutation that impairs dendritic localization of long 3′ UTR Bdnf mRNA would diminish its stimulatory effects on spine head enlargement and spine density reduction. We investigated the effect of SNPs in the human Bdnf 3′ UTR on trafficking of transcripts to dendrites. There were eight listed SNPs (termed SNP1–SNP8 here) in the human long Bdnf 3′ UTR at the time when we searched the NCBI SNP database (Fig. 6A). SNP1 is located within the short Bdnf 3′ UTR, whereas the other seven SNPs are within the sequence unique to the long Bdnf 3′ UTR.
Figure 6.

A common human Bdnf SNP impairs mRNA trafficking to dendrites as well as spine head enlargement and spine density reduction in cultured hippocampal neurons. A, Diagram depicting SNP variants in the human 3′ UTR of Bdnf mRNA. B, Representative FISH images from neurons transfected with pGFP-BGH-3′UTR, pGFP-hBdnf-3′UTR, or pGFP-hBdnf3′UTRsnp6g. C, Levels of GFP mRNA in dendrites of neurons transfected with pGFP-BGH-3′UTR, pGFP-hBdnf-3′UTR, or pGFP-hBdnf3′UTRsnp6g (n = 14, 20, and 20 neurons, respectively). *p < 0.05, **p < 0.01 when compared to pGFP-BGH-3′UTR; †p < 0.05, ††p < 0.01 when two indicated groups were compared (Student's t test). D, Levels of GFP mRNA in somata of neurons transfected with pGFP-BGH-3′UTR, pGFP-hBdnf-3′UTR, or pGFP-hBdnf3′UTRsnp6g (n = 19, 33, and 30, respectively). Student's t test, not significant. E, Northern blot analysis of Bdnf mRNA from HEK293T cells transfected with pActin-GFP and either pBDNF-h3′UTR (snp6a) or pBDNF-h3′UTRsnp6g (snp6g). F, Representative dendrites of neurons transfected with pActin-GFP and pBK, pBDNF-h3′UTR, or pBDNF-h3′UTRsnp6g showing spine morphology at DIV28. G, Average spine density of neurons transfected with pActin-GFP and pBK, pBDNF-h3′UTR, or pBDNF-h3′UTRsnp6g at DIV21 and DIV28 (n = 10 neurons/condition). F(2,54) condition × DIV = 3.590; p < 0.0345 (two-way ANOVA). H, Average spine head diameter of neurons transfected with pActin-GFP and pBK, pBDNF-h3′UTR, or pBDNF-h3′UTRsnp6g at DIV21 and DIV28 (n = 10 neurons/condition). F(2,54) condition × DIV = 1.132; p value not significant (two-way ANOVA). *p < 0.05, **p < 0.01, ***p < 0.001 when compared to pBK at the same time point; †p < 0.05, †††p < 0.001 when two indicated groups were compared; #p < 0.05, ##p < 0.01 when compared to the DIV21 time point within the same condition (post hoc tests with Bonferroni's correction). Scale bars: B, 50 μm; F, 25 μm.
We cloned the genomic sequence encoding the human long Bdnf 3′ UTR into an expression vector, 3′ to the GFP coding sequence (pGFP-hBdnf-3′UTR). We then used site-directed mutagenesis to create SNP2–8 minor alleles (pGFP-hBdnf-3′UTRsnp2–8) and tested the effect of these SNP variants on dendritic localization of GFP mRNA containing the Bdnf 3′ UTR in cultured hippocampal neurons. A GFP construct containing the bovine growth hormone 3′ UTR (pGFP-BGH-3′UTR) was used as a negative control. FISH showed that, as expected, GFP-hBdnf 3′UTR mRNA, but not GFP-BGH 3′UTR mRNA, was detected in the distal dendrites of transfected neurons (Fig. 6B,C). Notably, levels of dendritic GFP mRNA in neurons transfected with pGFP-hBdnf-3′UTRsnp6g, which has the G allele of SNP6 (rs7124442), were comparable to those in neurons expressing GFP-BGH 3′ UTR mRNA, but were markedly lower (at least a 63% reduction) compared to neurons expressing GFP-hBdnf-3′UTR mRNA that has the A allele of SNP6 (Fig. 6B,C). This dendritic mRNA deficit was not likely a result of instability of SNP6g-containing transcripts, because neurons expressing GFP-hBdnf-3′UTRsnp6g mRNA had similar somatic levels of GFP mRNA compared to neurons expressing GFP-hBdnf-3′UTR mRNA (Fig. 6D). Additionally, we did not find any other SNPs in the human Bdnf 3′ UTR that significantly altered levels of GFP mRNA in the dendrites of cultured neurons (data not shown). These results reveal that the SNP6g variant impairs the ability of the human long Bdnf 3′ UTR to localize mRNA to dendrites.
We next examined whether the SNP6g variant alters the effect of long 3′ UTR Bdnf mRNA on spine head enlargement and spine density. We generated two constructs to express Bdnf mRNA with the human Bdnf 3′ UTR containing either SNP6a (pBDNF-h3′UTR) or SNP6g (pBDNF-h3′UTRsnp6g). Because neuronal transfection efficiency is very low, we first used transfected HEK293T cells to determine whether SNP6g had any effect on Bdnf mRNA stability. The SNP6a- and SNP6g-containing Bdnf mRNAs had comparable stability, as HEK293T cells transfected with one of these two BDNF-expressing constructs contained similar levels of Bdnf mRNA (Fig. 6E). Note that HEK293T cells were derived from the kidney, and that the ratio of long to short 3′ UTR Bdnf mRNA is much lower in somatic tissues than in the brain (Timmusk et al., 1993). We then transfected cultured hippocampal neurons at DIV7 with an empty vector (pBK), pBDNF-h3′UTR, or pBDNF-h3′UTRsnp6g, in combination with pActin-GFP. Similar to neurons overexpressing mouse long 3′ UTR Bdnf mRNA (Fig. 4), neurons transfected with pBDNF-h3′UTR had a higher spine density at DIV21 and larger spine heads at both DIV21 and DIV28 compared to control neurons (Fig. 6F–H). Overexpression of Bdnf mRNA with SNP6g also increased spine density at DIV21 (Fig. 6G), but impaired spine density reduction during week 4 and spine head enlargement at both DIV21 and DIV28 (Fig. 6G,H). This effect is similar to the phenotype observed in neurons overexpressing short 3′ UTR Bdnf mRNA (Fig. 4). These results indicate that impaired dendritic localization of long 3′ UTR Bdnf mRNA results in a phenotype similar to that of overexpressing short 3′ UTR Bdnf mRNA in spine development, and thus strongly support our hypothesis that somatically synthesized BDNF promotes spine formation, whereas dendritically synthesized BDNF regulates spine head enlargement and spine density reduction.
Corresponding synaptic changes in association with BDNF-induced spine alterations
Several studies have shown that synaptic size is proportional to spine head diameter (Murthy et al., 1997; Schikorski and Stevens, 1997; Nusser et al., 1998; Racca et al., 2000). BDNF-induced changes in spine head diameter and spine density might therefore lead to alterations in the size and composition of the postsynaptic density (PSD) and presynaptic active zone. We examined the size and number of excitatory synapses throughout entire dendrites (both proximal and distal regions) of transfected neurons at DIV28 using immunocytochemistry with antibodies against the presynaptic protein, synaptophysin, and the postsynaptic protein PSD95 (Fig. 7A,D). Quantitative analysis of immunoreactive puncta on, or directly adjacent to, GFP-labeled spines revealed that neurons overexpressing short 3′ UTR Bdnf mRNA (pBDNF-A) exhibited a 32% decrease in presynaptic site area (Fig. 7B), a 48% increase in presynaptic site density (C), a 30% decrease in postsynaptic site area (E), and a 36% increase in postsynaptic site density (F). Conversely, neurons overexpressing long 3′ UTR Bdnf mRNA (pBDNF-A*B) exhibited a 97% increase in presynaptic site area (Fig. 7B), a 226% increase in postsynaptic site area (Fig. 7E), and normal densities of presynaptic or postsynaptic sites (Fig. 7C,F), compared to control neurons (pBK). Notably, no changes in the size or density of presynaptic or postsynaptic sites were observed in nearby nontransfected neurons in any neuronal culture, compared to neurons transfected with pBK (Fig. 7B,C,E,F). Thus, these BDNF-induced effects on synapse size and density are restricted to the synapses associated with transfected neurons. Together, these results indicate that BDNF derived from the two transcript forms induces distinct changes in the number and size of excitatory synapses in an autocrine manner.
Figure 7.

BDNF-induced changes in spines correlate with changes in synaptic structure and composition. A, Representative immunocytochemistry images for GFP and synaptophysin from neurons transfected with pActin-GFP and pBK, pBDNF-A, or pBDNF-A*B at DIV28. B, Size of synaptophysin puncta for neurons transfected with pBK, pBDNF-A, or pBDNF-A*B in combination with pActin-GFP or nontransfected (non-tfx) neurons on the same coverslips at DIV28 (n = 10–13 neurons/condition). C, Density of synaptophysin puncta for neurons transfected with pBK, pBDNF-A, or pBDNF-A*B in combination with pActin-GFP or nontransfected neurons on the same coverslips at DIV28 (n = 10–13 neurons/condition). D, Representative immunocytochemistry images for GFP and PSD95 from neurons transfected with pActin-GFP and pBK, pBDNF-A, or pBDNF-A*B at DIV28. E, Size of PSD-95 puncta for neurons transfected with pBK, pBDNF-A, or pBDNF-A*B in combination with pActin-GFP or nontransfected neurons on the same coverslips at DIV28 (n = 10–13 neurons/condition). F, Density of PSD-95 puncta for neurons transfected with pBK, pBDNF-A, or pBDNF-A*B in combination with pActin-GFP or nontransfected neurons on the same coverslips at DIV28 (n = 10–13 neurons/condition). G, Representative immunocytochemistry images for GFP and surface GluA1 from neurons transfected with pActin-GFP and pBK, pBDNF-A, or pBDNF-A*B at DIV28. H, Surface GluA1 puncta density in neurons transfected with pActin-GFP and pBK, pBDNF-A, or pBDNF-A*B at DIV28 (n = 10 neurons/condition). I, Surface GluA1 immunofluorescence per puncta in neurons transfected with pActin-GFP and pBK, pBDNF-A, or pBDNF-A*B at DIV28 (n = 10 neurons/condition). *p < 0.05; **p < 0.01 when compared to the pBK control (one-way ANOVA with post hoc Bonferroni's correction). Scale bars: 5 μm.
As the vast majority of spine synapses are glutamatergic, we investigated the effect of the two forms of Bdnf transcripts on the surface expression of the AMPA receptor (AMPAR) at synapses throughout whole dendrites by performing nonpermeabilized immunocytochemistry for the GluA1 subunit of the AMPAR, coupled with a subsequent permeabilized immunostaining for GFP to mark transfected neurons. Previous studies have shown that GluA1 intensity correlates with spine head size (Matsuzaki et al., 2001, 2004). Neurons overexpressing short 3′ UTR Bdnf mRNA exhibited a 50% increased density of surface GluA1-immunoreactive puncta (Fig. 7G,H), as well as a 46% decrease in surface GluA1 immunofluorescence (G,I). No changes in surface GluA1 puncta density were observed in neurons overexpressing long 3′ UTR Bdnf mRNA, compared to control neurons (Fig. 7G,H). However, neurons overexpressing long 3′ UTR Bdnf mRNA exhibited a 71% increase in surface GluA1 immunofluorescence (Fig. 7G,I), which correlates with the structural changes observed in these neurons.
In agreement with the GluA1 puncta density data, voltage-clamp recordings of AMPAR-mediated mEPSCs, which reflect the response of the AMPAR to spontaneous glutamate release from presynaptic sites, revealed that overexpression of short, but not long, 3′ UTR Bdnf mRNA caused a drastic 166% increase in the frequency of mEPSCs (Fig. 8A–C). However, BDNF overexpression had no effects on mEPSC amplitude or decay (Fig. 8D,E). As the majority of recorded mEPSCs at the soma likely result from synaptic inputs on or near cell bodies, we examined synapses on the first 20 μm dendritic segments of transfected neurons, to understand why there was no effect of BDNF overexpression on mEPSC amplitude. Overexpressing short 3′ UTR Bdnf mRNA still increased the density of synapses and GluA1 puncta in the proximal dendrites (Fig. 8F,H). However, overexpressing either form of Bdnf mRNA did not alter the size of synapses or GluA1 puncta in the proximal dendrites (Fig. 8G,I).
Figure 8.

BDNF-induced changes in synaptic composition and function in proximal dendrites. A, Representative AMPAR-mediated mEPSC traces from neurons transfected with pActin-GFP and pBK, pBDNF-A, or pBDNF-A*B at DIV27–29. B, Cumulative probability of miniature events of mEPSCs recorded from neurons transfected with pActin-GFP and pBK, pBDNF-A, or pBDNF-A*B at DIV27–29 (n = 12–13 neurons/condition). C, Average frequency of mEPSCs recorded from neurons transfected with pActin-GFP and pBK, pBDNF-A, or pBDNF-A*B at DIV27–29 (n = 12–13 neurons/condition). D, Average amplitude of mEPSCs recorded from neurons transfected with pActin-GFP and pBK, pBDNF-A, or pBDNF-A*B at DIV27–29 (n = 12–13 neurons/condition). One-way ANOVA with post hoc Bonferroni's correction's was not significant. E, Average decay time of mEPSCs recorded from neurons transfected with pActin-GFP and pBK, pBDNF-A, or pBDNF-A*B at DIV27–29 (n = 12–13 neurons/condition). One-way ANOVA with post hoc Bonferroni's correction was not significant. F, Density of PSD95 puncta on the first 20 μm proximal dendrites of neurons transfected with pActin-GFP and pBK, pBDNF-A, or pBDNF-A*B at DIV28 (n = 10 neurons/condition). G, Size of PSD95 puncta on the first 20 μm proximal dendrites of neurons transfected with pActin-GFP and pBK, pBDNF-A, or pBDNF-A*B at DIV28 (n = 10 neurons/condition). One-way ANOVA with post hoc Bonferroni's correction, not significant. H, Density of surface GluA1 puncta on the first 20 μm proximal dendrites of neurons transfected with pActin-GFP and pBK, pBDNF-A, or pBDNF-A*B at DIV28 (n = 10 neurons/condition). I, Immunofluorescence of surface GluA1 puncta on the first 20 μm proximal dendrites of neurons transfected with pActin-GFP and pBK, pBDNF-A, or pBDNF-A*B at DIV28 (n = 10 neurons/condition). One-way ANOVA with post hoc Bonferroni correction was not significant. *p < 0.05; **p < 0.01 when compared to neurons transfected with pBK (one-way ANOVA with post hoc Bonferroni's correction).
Discussion
Our results show that neurons overexpressing long 3′ UTR Bdnf mRNA have much higher levels of BDNF protein in dendrites than neurons overexpressing short 3′ UTR Bdnf mRNA. This observation is not in conflict with previous reports that tagged BDNF translated from overexpressed and soma-restricted mRNA (with a 3′ UTR from a mammalian expression vector) is transported to dendrites of cultured neurons and released there (Adachi et al., 2005; Dean et al., 2009; Matsuda et al., 2009), as we also detected some dendritic BDNF translated from short 3′ UTR Bdnf mRNA. However, a previous immunohistochemistry study found endogenous BDNF in axonal terminals, but not dendrites, in the mouse hippocampus (Dieni et al., 2012). This raises the possibility that dendritic localization of BDNF is an artifact of neuronal culture. Our results from viral BDNF expression argue against this explanation, as we detected BDNF in both proximal and distal dendrites of hippocampal CA1 neurons in adult rats that were infected with AAV-BDNF-A*B. Importantly, levels of BDNF were much lower in distal dendrites of neurons infected with AAV-BDNF-A. Although virally expressed BDNF may be present at higher levels in the brain than endogenously expressed BDNF, these results do indicate that short and long 3′ UTR Bdnf mRNA have different subcellular distributions in vivo.
Many dendritic spines are eliminated through an activity-dependent process in mammalian brains from early postnatal life into adolescence (Rakic et al., 1986; Grutzendler et al., 2002; Zuo et al., 2005b). This pruning process likely plays key roles in the formation of a precise and competent neural circuit. Despite the importance of spine pruning, little is known about its underlying molecular mechanisms, in part due to lack of an in vitro system for studying this biological process. Rat neuronal cultures have been widely used to examine formation and maturation of dendritic spines (Papa et al., 1995; Ethell et al., 2001; Sala et al., 2001; Tolias et al., 2007); however, in the vast majority of these studies, neurons were only cultured for up to 3 weeks. At this age, neurons are still too young for examination of spine pruning, because significant spine loss occurs after the third postnatal week in rodents (Comery et al., 1997; Zuo et al., 2005b; An et al., 2008). In the present study, we were able to keep rat hippocampal neuron cultures healthy for over 4 weeks. In this culture system, dendritic spine density peaks during the first 2 weeks, spine heads are enlarged up to DIV35, and a significant reduction in spine density begins after DIV21. The reduction in spine density is due to spine elimination rather than death of some cultured neurons, because we did not observe spine density reduction in neuronal cultures where long 3′ UTR Bdnf mRNA was selectively knocked down or short 3′ UTR Bdnf mRNA was overexpressed. Furthermore, this spine development course mimics what happens in vivo in rodent cortical areas (Comery et al., 1997; Zuo et al., 2005b; An et al., 2008; Kaneko et al., 2012). These observations indicate that in our neuronal cultures dendritic spines are formed during the first 2 weeks, mature during weeks 3–5 as indicated by spine head enlargement, and are pruned after week 3 as reflected in spine density reduction. Therefore, this neuronal culture system provides a useful in vitro model for mechanistic studies of spine pruning as well as spine maturation.
Previous studies show that in mutant mice in which the long Bdnf 3′ UTR is truncated, hippocampal CA1 and cortical L2/3 pyramidal neurons have denser and less mature dendritic spines at 2–4 months of age (An et al., 2008; Kaneko et al., 2012), suggesting that long 3′ UTR Bdnf mRNA plays important roles in spine maturation and spine pruning in vivo. The current study confirms these observations by showing that selectively knocking down long 3′ UTR Bdnf mRNA impairs spine maturation and spine pruning in cultured rat hippocampal neurons. The similarity in spine phenotypes observed in vivo and in vitro further validates our neuronal culture as a valuable system for analysis of spine maturation and spine pruning. The current study further indicates that long 3′ UTR Bdnf mRNA has to be translated in dendrites to achieve these roles in spine morphogenesis. First, we found that there was more BDNF protein in distal dendrites in neurons overexpressing long 3′ UTR Bdnf mRNA than in neurons overexpressing short 3′ UTR Bdnf mRNA. Second, overexpressing long, but not short, 3′ UTR Bdnf mRNA in cultured hippocampal neurons increased spine head growth during the third and fourth weeks and the magnitude of spine density reduction during the fourth week. Last, long 3′ UTR Bdnf mRNA containing the SNP6g allele lost the ability to stimulate maturation and pruning of dendritic spines, because the nucleotide change impaired dendritic localization of Bdnf mRNA. On the basis of these observations, we propose that dendritically synthesized BDNF is a key regulator of spine maturation and spine pruning.
Immunoblotting analysis indicates that dendritically synthesized BDNF is predominantly present as proBDNF inside neurons. It is unlikely that this is due to a capacity limitation of processing BDNF, because we saw little proBDNF in neurons expressing short 3′ UTR Bdnf mRNA. It will be intriguing to elucidate how proBDNF regulates spine maturation and pruning in the future. As indicated by our RT-PCR analysis, developing hippocampal neurons are programmed to increase dendritic BDNF synthesis by elevating the ratio of long 3′ UTR Bdnf mRNA over short 3′ UTR Bdnf mRNA when dendritic spines are maturing. Further studies are needed to understand whether neurons increase this ratio by preferentially using the second polyadenylation site or selectively stabilizing long 3′ UTR Bdnf mRNA.
SNP6 (rs7124442) is a common polymorphism in humans. Interestingly, its homozygosity frequency among human races is almost opposite to that of another common Bdnf SNP, Val66Met (rs6265): 0% (rs7124442) versus 25.3% (rs6265) in Asians, 13.3 versus 3.4% in Europeans, and 25.7 versus 0% in sub-Saharan Africans. A previous study showed that SNP6g is associated with worsened postinjury recovery of general cognitive intelligence following traumatic brain injury (Rostami et al., 2011). This result is particularly exciting, as it reinforces the idea that SNP6g may affect plasticity and cognitive performance in humans. Future studies are needed to understand the full impact of SNP6g on human health.
Our results indicate that somatically synthesized BDNF also has a role in spine morphogenesis. The evidence for this role came from the observation that overexpression of soma-restricted short 3′ UTR Bdnf mRNA increased spine density in cultured hippocampal neurons at DIV14 and DIV21. This effect is not a result of the negative impact of short 3′ UTR Bdnf mRNA overexpression on the dendritic level of endogenous long 3′ UTR Bdnf mRNA, because knocking down endogenous long 3′ UTR Bdnf mRNA with shRNA did not affect spine density at DIV14 and DIV21. This knockdown experiment also indicates that dendritically synthesized BDNF is not essential for spine formation. It is worth noting that overexpressing long 3′ UTR Bdnf mRNA in cultured hippocampal neurons also increased spine density at DIV14 and DIV21. This effect on spine formation is probably a result of somatic translation of long 3′ UTR Bdnf mRNA, because a large fraction of this mRNA species is also present in the soma (An et al., 2008).
Analyses of both presynaptic and postsynaptic sites indicate that the effect of overexpressing either short or long 3′ UTR Bdnf mRNA only affects the dendritic spines on transfected neurons and the presynaptic sites that innervate them. A previous study indicated that BDNF also cell-autonomously regulates spine density in vivo (English et al., 2012). These findings suggest that dendritically synthesized BDNF has to be released locally to regulate spine maturation and spine pruning. The cell-autonomous action of BDNF on spine formation suggests that small amounts of somatically synthesized BDNF may be transported to dendrites to promote spine formation.
Somatically synthesized BDNF increases the number of functional synapses, as indicated by an increased frequency of mEPSCs in neurons transfected with pBDNF-A. However, BDNF overexpression did not cause any significant changes in mEPSC amplitude or decay time. Based on our in vitro protein distribution data, it is likely that somatically synthesized mature BDNF may be trafficked to proximal dendrites to stimulate spine formation, but these spines do not undergo the same maturation processes observed in distal dendrites. In support of this speculation, our analysis of the first 20 μm proximal dendrites indicate an increase in synapse number for neurons transfected with pBDNF-A, but no changes in synapse size for neurons transfected with either pBDNF-A or pBDNF-A*B.
In summary, this study demonstrates that two populations of Bdnf mRNA have distinct effects on the formation and maturation of glutamatergic synapses in hippocampal neurons through autocrine action, due to their different subcellular localizations. Furthermore, given the large number of mouse and human genes with multiple polyadenylation sites, our findings suggest that alternative polyadenylation be an important mechanism to increase gene functionality and to regulate physiological processes.
Footnotes
This work was supported by National Institutes of Health Grants R01 NS073930 and R01 NS050596 (B.X.), F31 NS074840 (L.L.O.), and F30 DK084717 (E.G.W.). We thank Drs. Daniel Pak and William Rebeck for critical reading of this manuscript, Dr. Patrick Forcelli for microinjection of AAV into the rat hippocampus, and Dr. Maria Fischer for pActin-GFP.
References
- Adachi N, Kohara K, Tsumoto T. Difference in trafficking of brain-derived neurotrophic factor between axons and dendrites of cortical neurons, revealed by live-cell imaging. BMC Neurosci. 2005;6:42. doi: 10.1186/1471-2202-6-42. [DOI] [PMC free article] [PubMed] [Google Scholar]
- An JJ, Gharami K, Liao GY, Woo NH, Lau AG, Vanevski F, Torre ER, Jones KR, Feng Y, Lu B, Xu B. Distinct role of long 3′ UTR BDNF mRNA in spine morphology and synaptic plasticity in hippocampal neurons. Cell. 2008;134:175–187. doi: 10.1016/j.cell.2008.05.045. [DOI] [PMC free article] [PubMed] [Google Scholar]
- Bhatt DH, Zhang S, Gan WB. Dendritic spine dynamics. Annu Rev Physiol. 2009;71:261–282. doi: 10.1146/annurev.physiol.010908.163140. [DOI] [PubMed] [Google Scholar]
- Brummelkamp TR, Bernards R, Agami R. A system for stable expression of short interfering RNAs in mammalian cells. Science. 2002;296:550–553. doi: 10.1126/science.1068999. [DOI] [PubMed] [Google Scholar]
- Churchill JD, Grossman AW, Irwin SA, Galvez R, Klintsova AY, Weiler IJ, Greenough WT. A converging-methods approach to fragile X syndrome. Dev Psychobiol. 2002;40:323–338. doi: 10.1002/dev.10036. [DOI] [PubMed] [Google Scholar]
- Comery TA, Harris JB, Willems PJ, Oostra BA, Irwin SA, Weiler IJ, Greenough WT. Abnormal dendritic spines in fragile X knockout mice: maturation and pruning deficits. Proc Natl Acad Sci U S A. 1997;94:5401–5404. doi: 10.1073/pnas.94.10.5401. [DOI] [PMC free article] [PubMed] [Google Scholar]
- Dean C, Liu H, Dunning FM, Chang PY, Jackson MB, Chapman ER. Synaptotagmin-IV modulates synaptic function and long-term potentiation by regulating BDNF release. Nat Neurosci. 2009;12:767–776. doi: 10.1038/nn.2315. [DOI] [PMC free article] [PubMed] [Google Scholar]
- Dieni S, Matsumoto T, Dekkers M, Rauskolb S, Ionescu MS, Deogracias R, Gundelfinger ED, Kojima M, Nestel S, Frotscher M, Barde YA. BDNF and its pro-peptide are stored in presynaptic dense core vesicles in brain neurons. J Cell Biol. 2012;196:775–788. doi: 10.1083/jcb.201201038. [DOI] [PMC free article] [PubMed] [Google Scholar]
- English CN, Vigers AJ, Jones KR. Genetic evidence that brain-derived neurotrophic factor mediates competitive interactions between individual cortical neurons. Proc Natl Acad Sci U S A. 2012;109:19456–19461. doi: 10.1073/pnas.1206492109. [DOI] [PMC free article] [PubMed] [Google Scholar]
- Ethell IM, Pasquale EB. Molecular mechanisms of dendritic spine development and remodeling. Prog Neurobiol. 2005;75:161–205. doi: 10.1016/j.pneurobio.2005.02.003. [DOI] [PubMed] [Google Scholar]
- Ethell IM, Irie F, Kalo MS, Couchman JR, Pasquale EB, Yamaguchi Y. EphB/syndecan-2 signaling in dendritic spine morphogenesis. Neuron. 2001;31:1001–1013. doi: 10.1016/S0896-6273(01)00440-8. [DOI] [PubMed] [Google Scholar]
- Fischer M, Kaech S, Knutti D, Matus A. Rapid actin-based plasticity in dendritic spines. Neuron. 1998;20:847–854. doi: 10.1016/S0896-6273(00)80467-5. [DOI] [PubMed] [Google Scholar]
- Grutzendler J, Kasthuri N, Gan WB. Long-term dendritic spine stability in the adult cortex. Nature. 2002;420:812–816. doi: 10.1038/nature01276. [DOI] [PubMed] [Google Scholar]
- Harris KM. Structure, development, and plasticity of dendritic spines. Curr Opin Neurobiol. 1999;9:343–348. doi: 10.1016/S0959-4388(99)80050-6. [DOI] [PubMed] [Google Scholar]
- Holtmaat A, Svoboda K. Experience-dependent structural synaptic plasticity in the mammalian brain. Nat Rev Neurosci. 2009;10:647–658. doi: 10.1038/nrn2699. [DOI] [PubMed] [Google Scholar]
- Huttenlocher PR. Synaptic density in human frontal cortex - developmental changes and effects of aging. Brain Res. 1979;163:195–205. doi: 10.1016/0006-8993(79)90349-4. [DOI] [PubMed] [Google Scholar]
- Kaneko M, Xie Y, An JJ, Stryker MP, Xu B. Dendritic BDNF synthesis is required for late-phase spine maturation and recovery of cortical responses following sensory deprivation. J Neurosci. 2012;32:4790–4802. doi: 10.1523/JNEUROSCI.4462-11.2012. [DOI] [PMC free article] [PubMed] [Google Scholar]
- Marin-Padilla M. Number and distribution of the apical dendritic spines of the layer V pyramidal cells in man. J Comp Neurol. 1967;131:475–490. doi: 10.1002/cne.901310407. [DOI] [PubMed] [Google Scholar]
- Mataga N, Mizuguchi Y, Hensch TK. Experience-dependent pruning of dendritic spines in visual cortex by tissue plasminogen activator. Neuron. 2004;44:1031–1041. doi: 10.1016/j.neuron.2004.11.028. [DOI] [PubMed] [Google Scholar]
- Matsuda N, Lu H, Fukata Y, Noritake J, Gao H, Mukherjee S, Nemoto T, Fukata M, Poo MM. Differential activity-dependent secretion of brain-derived neurotrophic factor from axon and dendrite. J Neurosci. 2009;29:14185–14198. doi: 10.1523/JNEUROSCI.1863-09.2009. [DOI] [PMC free article] [PubMed] [Google Scholar]
- Matsuzaki M, Ellis-Davies GC, Nemoto T, Miyashita Y, Iino M, Kasai H. Dendritic spine geometry is critical for AMPA receptor expression in hippocampal CA1 pyramidal neurons. Nat Neurosci. 2001;4:1086–1092. doi: 10.1038/nn736. [DOI] [PMC free article] [PubMed] [Google Scholar]
- Matsuzaki M, Honkura N, Ellis-Davies GC, Kasai H. Structural basis of long-term potentiation in single dendritic spines. Nature. 2004;429:761–766. doi: 10.1038/nature02617. [DOI] [PMC free article] [PubMed] [Google Scholar]
- Murase K, Ryu PD, Randic M. Excitatory and inhibitory amino acids and peptide-induced responses in acutely isolated rat spinal dorsal horn neurons. Neurosci Lett. 1989;103:56–63. doi: 10.1016/0304-3940(89)90485-0. [DOI] [PubMed] [Google Scholar]
- Murthy VN, Sejnowski TJ, Stevens CF. Heterogeneous release properties of visualized individual hippocampal synapses. Neuron. 1997;18:599–612. doi: 10.1016/S0896-6273(00)80301-3. [DOI] [PubMed] [Google Scholar]
- Nusser Z, Lujan R, Laube G, Roberts JD, Molnar E, Somogyi P. Cell type and pathway dependence of synaptic AMPA receptor number and variability in the hippocampus. Neuron. 1998;21:545–559. doi: 10.1016/S0896-6273(00)80565-6. [DOI] [PubMed] [Google Scholar]
- Papa M, Bundman MC, Greenberger V, Segal M. Morphological analysis of dendritic spine development in primary cultures of hippocampal neurons. J Neurosci. 1995;15:1–11. doi: 10.1523/JNEUROSCI.15-01-00001.1995. [DOI] [PMC free article] [PubMed] [Google Scholar]
- Racca C, Stephenson FA, Streit P, Roberts JD, Somogyi P. NMDA receptor content of synapses in stratum radiatum of the hippocampal CA1 area. J Neurosci. 2000;20:2512–2522. doi: 10.1523/JNEUROSCI.20-07-02512.2000. [DOI] [PMC free article] [PubMed] [Google Scholar]
- Rakic P, Bourgeois JP, Eckenhoff MF, Zecevic N, Goldman-Rakic PS. Concurrent overproduction of synapses in diverse regions of the primate cerebral cortex. Science. 1986;232:232–235. doi: 10.1126/science.3952506. [DOI] [PubMed] [Google Scholar]
- Rostami E, Krueger F, Zoubak S, Dal Monte O, Raymont V, Pardini M, Hodgkinson CA, Goldman D, Risling M, Grafman J. BDNF polymorphism predicts general intelligence after penetrating traumatic brain injury. PLoS One. 2011;6:e27389. doi: 10.1371/journal.pone.0027389. [DOI] [PMC free article] [PubMed] [Google Scholar]
- Sala C, Rudolph-Correia S, Sheng M. Developmentally regulated NMDA receptor-dependent dephosphorylation of cAMP response element-binding protein (CREB) in hippocampal neurons. J Neurosci. 2000;20:3529–3536. doi: 10.1523/JNEUROSCI.20-10-03529.2000. [DOI] [PMC free article] [PubMed] [Google Scholar]
- Sala C, Piëch V, Wilson NR, Passafaro M, Liu G, Sheng M. Regulation of dendritic spine morphology and synaptic function by Shank and Homer. Neuron. 2001;31:115–130. doi: 10.1016/S0896-6273(01)00339-7. [DOI] [PubMed] [Google Scholar]
- Sala C, Cambianica I, Rossi F. Molecular mechanisms of dendritic spine development and maintenance. Acta Neurobiol Exp (Wars) 2008;68:289–304. doi: 10.55782/ane-2008-1696. [DOI] [PubMed] [Google Scholar]
- Schikorski T, Stevens CF. Quantitative ultrastructural analysis of hippocampal excitatory synapses. J Neurosci. 1997;17:5858–5867. doi: 10.1523/JNEUROSCI.17-15-05858.1997. [DOI] [PMC free article] [PubMed] [Google Scholar]
- Timmusk T, Palm K, Metsis M, Reintam T, Paalme V, Saarma M, Persson H. Multiple promoters direct tissue-specific expression of the rat BDNF gene. Neuron. 1993;10:475–489. doi: 10.1016/0896-6273(93)90335-O. [DOI] [PubMed] [Google Scholar]
- Tolias KF, Bikoff JB, Kane CG, Tolias CS, Hu L, Greenberg ME. The Rac1 guanine nucleotide exchange factor Tiam1 mediates EphB receptor-dependent dendritic spine development. Proc Natl Acad Sci U S A. 2007;104:7265–7270. doi: 10.1073/pnas.0702044104. [DOI] [PMC free article] [PubMed] [Google Scholar]
- Waterhouse EG, Xu B. New insights into the role of brain-derived neurotrophic factor in synaptic plasticity. Mol Cell Neurosci. 2009;42:81–89. doi: 10.1016/j.mcn.2009.06.009. [DOI] [PMC free article] [PubMed] [Google Scholar]
- Weickert CS, Hyde TM, Lipska BK, Herman MM, Weinberger DR, Kleinman JE. Reduced brain-derived neurotrophic factor in prefrontal cortex of patients with schizophrenia. Mol Psychiatry. 2003;8:592–610. doi: 10.1038/sj.mp.4001308. [DOI] [PubMed] [Google Scholar]
- Yoshihara Y, De Roo M, Muller D. Dendritic spine formation and stabilization. Curr Opin Neurobiol. 2009;19:146–153. doi: 10.1016/j.conb.2009.05.013. [DOI] [PubMed] [Google Scholar]
- Zuo Y, Lin A, Chang P, Gan WB. Development of long-term dendritic spine stability in diverse regions of cerebral cortex. Neuron. 2005a;46:181–189. doi: 10.1016/j.neuron.2005.04.001. [DOI] [PubMed] [Google Scholar]
- Zuo Y, Yang G, Kwon E, Gan WB. Long-term sensory deprivation prevents dendritic spine loss in primary somatosensory cortex. Nature. 2005b;436:261–265. doi: 10.1038/nature03715. [DOI] [PubMed] [Google Scholar]