Abstract
Tree shrew primary visual cortex (V1) exhibits a pronounced laminar segregation of inputs from different classes of relay neurons in the lateral geniculate nucleus (LGN). We examined how several receptive field (RF) properties were transformed from LGN to V1 layer 4 to V1 layer 2/3. The progression of RF properties across these stages differed markedly from that found in the cat. V1 layer 4 cells are largely similar to the the LGN cells that provide their input, being dominated by a single sign (ON or OFF) and being strongly modulated by sinusoidal gratings. Some layer 4 neurons, notably those near the edges of layer 4, exhibited increased orientation selectivity, and most layer 4 neurons exhibited a preference for lower temporal frequencies. Neurons in cortical layer 2/3 differ significantly from those in the LGN; most exhibited strong orientation tuning and both ON and OFF responses. The strength of orientation selectivity exhibited a notable sublaminar organization, with the strongest orientation tuned neurons in the most superficial parts of layer 2/3. Modulation indexes provide evidence for simple and complex cells in both layer 4 and layer 2/3. However, neurons with high modulation indexes were heterogenous in the spatial organization of ON and OFF responses, with many of them exhibiting unbalanced ON and OFF responses rather than well-segregated ON and OFF subunits. When compared to the laminar organization of V1 in other mammals, these data show that the process of natural selection can result in significantly altered structure/function relationships in homologous cortical circuits.
Introduction
Layer 4 neurons in primary visual cortex (V1) receive the vast majority of the inputs from the lateral geniculate nucleus (LGN) and play a critical role in generating the visual responses of layer 2/3 neurons. Much of our understanding of this sequential feedforward architecture is derived from work in cat V1, where the convergence of LGN terminals onto layer 4 neurons is accompanied by the emergence of orientation-selective “simple” cells. These simple cells respond to both stimulus onset (ON) and offset (OFF) in specific subregions within their receptive fields (RFs; Reid and Alonso, 1995; Ferster et al., 1996; Chung and Ferster, 1998; Martinez et al., 2005). Layer 4 neurons project to layer 2/3 neurons, generating orientation-selective “complex” cells that respond to stimulus onset and offset at all locations in their receptive fields (Alonso and Martinez, 1998). This hierarchical model for the generation of simple and complex RFs, first hypothesized by Hubel and Wiesel (1962), is often taken as the canonical circuit for building orientation-selective RFs.
But are the principles that underlie the construction of RFs in cat V1 universal, or are there differences in the mechanisms for elaborating cortical response properties that might reflect each species' evolutionary history? Area V1 of tree shrew presents a particularly vivid example of an organization that appears different from that of cat. Layer 4 in tree shrew V1 consists of two tiers: layer 4A receives projections from ON-center LGN neurons, whereas layer 4B receives projections from OFF-center LGN neurons (Conley et al., 1984; Fitzpatrick and Raczkowski, 1990). The responses of layer 4 neurons maintain the segregation of ON and OFF inputs (Kretz et al., 1986), and previous studies suggest that these neurons are only weakly tuned to stimulus orientation (Humphrey and Norton, 1980; Chisum et al., 2003). Orientation selectivity is robust in layer 2/3, and anatomical studies suggest that projections from 4 to 2/3 are arranged in a fashion that supports the emergence of orientation-selective responses (Mooser et al., 2004).
Here, we sought to clarify two questions. First, are response properties of V1 layer 4 neurons identical to those of LGN neurons, or are there differences that can be ascribed to the contributions of local circuits? Second, do simple and complex cells types exist in tree shrew V1, and if so, do they have a distinct laminar distribution? Our results confirm that most layer 4 neurons in tree shrew resemble their LGN inputs, although some exhibit an increase in orientation selectivity. The most compelling difference between LGN and layer 4 neurons was in their response to temporal modulation: most LGN neurons prefer temporal frequencies of >5 Hz, whereas most layer 4 neurons respond preferentially to frequencies of <5 Hz. We also confirm that layer 2/3 neurons exhibit strong orientation selectivity and find that they comprise a mixture of simple and complex cell types. Thus, although the sequential anatomical structure of cortical circuits is common to a range of mammals, the computations that are performed at each stage and the properties that emerge differ across species.
Materials and Methods
Tree shrews of either sex ranging from 3 months to 1 year of age were anesthetized with a mixture of ketamine (200 mg/k, i.m.) and xylazine (4.7 mg/kg, i.m.). A cannula was inserted into the intraperitoneal cavity for later delivery of neuromuscular blockers, a tracheostomy was performed, and the animal was inserted in a custom stereotaxic frame that did not block vision. All wound margins were infused with the long-lasting analgesic bupivicane (10–30 μl, 2.5 mg/ml). Contact lenses (Platt Contact Lens) were inserted to protect the corneas. A small craniotomy (2–4 mm2) was made; in some experiments, the dura was left intact, while in other experiments, a small hole was made in the dura with a 31.5 gauge needle to ease the insertion of electrodes. At the conclusion of these procedures, tree shrews were paralyzed with the neuromuscular blocker pancuronium bromide (0.2 mg/h) to suppress spontaneous eye movements and ventilated with 0.5–2.5% isofluorane in a 1:1 mixture of nitrous oxide and oxygen. The animal's EKG was continuously monitored to ensure adequate anesthesia, and the percentage of isofluorane was increased if the EKG indicated any distress.
In most experiments (eight), we used fine-tipped carbon fiber electrodes (CarboStar-1; Kation Scientific) to record single units. In the first six experiments, we used commercial tetrodes (Thomas Recording) to record single units in layer 4 (Adams and Horton, 2006). We found that both electrode types could effectively isolate neurons in layer 4, although well-isolated neurons were encountered less frequently with carbon fibers than with tetrodes. Eventually, we used carbon fiber electrodes exclusively because they caused less dimpling in layer 2/3. Spikes on single channels or multiple channels were amplified with a preamplifier/amplifier system by Multichannel Systems and acquired and clustered using a Micro1401 acquisition board and Spike2 software (Cambridge Electronic Design).
During each penetration, we identified the boundaries of the LGN or cortical layers as we advanced the electrode, and again as we retracted the electrode. The electrode was advanced by a Sutter MP-285 manipulator, and electrode position was recorded digitally with a resolution of 1 μm. We listened to the low frequency cortical “hash” while flashing the animal's eyes with light from an ophthalmoscope, 0.5 s on and 0.5 s off. In the LGN, the layers progressed from 6 to 1 going from dorsal and lateral to ventral and medial, and were identified by noting the dominant eye (6, 4, 3, and 1 are innervated by the contralateral eye, whereas 5 and 2 are innervated by the ipsilateral eye) and physiological responses (layers 5 and 4 exhibit OFF responses, layers 6 and 3 exhibit ON–OFF responses, and layers 2 and 1 exhibit ON responses; Conway and Schiller, 1983).
In the cortex, we recorded in the binocular region of area V1. The transition between cortical layers 2/3 and 4A was clear when we began to hear the dominant ON response in layer 4a, where axons from LGN layers 1 and 2 form synapses with cortical neurons (Kretz et al., 1986). Similarly, the transition between layers 4A and 4B could be discerned when the hash response switched from ON to OFF, as LGN layers 4 and 5 project to layer 4B. Finally, we identified the boundary between layers 4B and 5 by the disappearance of the strong OFF hash responses, and continued advancing until we could identify the beginning of the white matter. The depths at which the strong ON and strong OFF hash transitions occurred could be determined very reliably: at the end of the experiment, the electrode was advanced and retracted in the vicinity of layer 4 several times, and the same locations were identified within ∼25 μm.
In some experiments, we made electrolytic lesions (5 uA constant current for about 5 s, electrode negative) to verify our electrode positions within the LGN or cortical layers. Animals were perfused with 0.9% saline followed by 10% formalin, and brains were placed in 20% sucrose until they sank. Brains were then blocked, 50 μm coronal sections were cut on a freezing microtome, and alternate sections were stained for Nissl or cytochrome oxidase so that lesions were easy to observe. In each case, the lesions were located in the layer or at the layer transition that was predicted by the cortical hash responses.
The depths of all cells and layer transitions were recorded digitally. In some plots, cortical depths were combined across animals by projecting onto a “standard cortex” on a layer-by-layer basis. Depths of neurons recorded in layer 2/3 were normalized (linearly) to be between 0 mm (surface) and 900 mm (layer 4 border), neurons in layer 4 were normalized to be between 900 and 1300 mm, and neurons in layer 5 and below were normalized to be between 1300 and 2200 mm.
Visual stimuli were created in Matlab using the Psychophysics Toolbox (Brainard, 1997; Pelli, 1997) on a Macintosh G3 running OS9 and displayed on a Sony GDM-520 monitor (white point; x = 0.291, y = 0.307; mean brightness, 54 cd/m2). Spike tuning curves were analyzed with custom software in Matlab (Heimel et al., 2005; Van Hooser et al., 2006). Stimuli were either drifting sinusoidal gratings or flashed (3–7 Hz) thin (0.25–0.5°) black or white bars, at least 20° in length, that appeared on a gray background.
We developed several indexes to quantify the ON and OFF responses of cells to thin white and black bars at different positions. The ON/OFF index was defined as follows:
 |
where RON (p) is the response to a white bar at position p, and ROFF (p) is the response to a black bar at position p.
To calculate ON/OFF segregation, we did not explicitly define ON and OFF subregions (Schiller et al., 1976), but instead defined the ON/OFF segregation index as the total area under the ON/OFF response curve that is not shared by ON and OFF responses divided by the total area of the ON/OFF responses. To reduce noise in the ON/OFF segregation index, we considered only responses that were one SE above “blank” responses:
 |
where R̂ON (p) = max[RON (p) − blank − SE, 0], and R̂OFF (p) is defined similarly; blank is the response to a control “gray screen” stimulus the same duration as the bars; SE is the average SE of the response across all positions.
Finally, the sign index was defined as follows:
 |
The orientation selectivity index was defined as 1 minus circular variance (CV; Ringach et al., 2002) as follows:
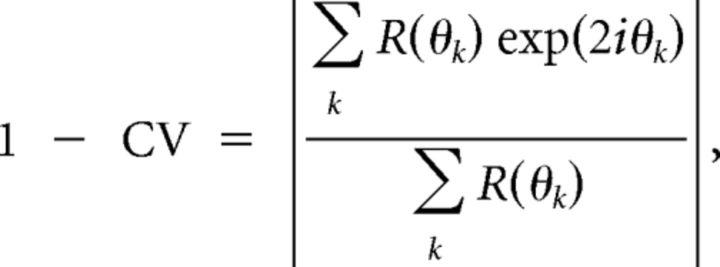 |
where θk are the direction angles used for stimulation, and R(θk) is the response to angle θk (after subtraction of the spontaneous rate). The direction selectivity index was similarly defined except that it was computed as 1 minus direction circular variance in direction space (DCV; Grabska-Barwinska et al., 2012):
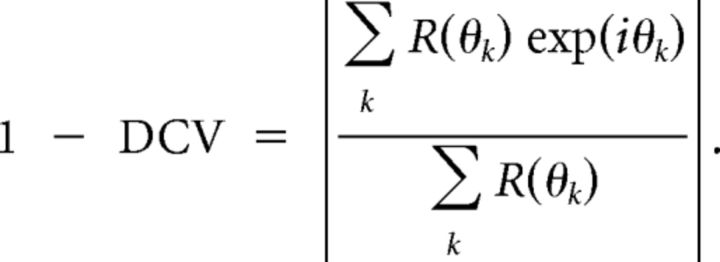 |
For sinusoidal grating responses, we also calculated a modulation index: modulation index = 2[F1/(F0 + F1)], where F1 is the magnitude of the Fourier coefficient of the response at the stimulus temporal frequency (that is, the magnitude of the sinusoidal component or the modulated component), and F0 is the mean response (DC response, or the unmodulated component). This modulation index can vary from 0 to 2, and is 1 when the F1 and F0 components are equal. In previous studies, cells have been classified as “simple” when the F1 component of an orientation-selective cell is equal to or larger than the F0 component, and as “complex” if the F0 component is larger than the F1 component (Skottun et al., 1991). Our index preserves the value of 1 as a dividing threshold as in classical studies, but differs in that we divide by the sum of F1 + F0 rather than dividing by F0 alone, so that our modulation index has a maximum value of 2 rather than infinity.
Responses to gratings of varying spatial and temporal frequencies were fit with a difference of Gaussians (DOG) function (Enroth-Cugell and Robson, 1966; Heimel et al., 2005): R(f) = a1exp(−f/σ12) − a2exp(−f2/σ22), where f is the (spatial or temporal) frequency, a1 and a2 are the amplitudes of the Gaussians, and σ1 and σ2 are the width parameters. From these DOG fits, we determined the frequency that gave the peak response. We defined the low frequency cutoff as the frequency, lower than the peak frequency, for which the response dropped to half the peak response; if the response did not drop to half the peak response for the lowest frequency examined, then the cell was said to exhibit “low-pass” selectivity. We defined the high frequency cutoff similarly for higher frequencies, and if the response did not drop to half the maximum, then the cell was said to exhibit “high-pass” selectivity.
Results
Our goal was to characterize how receptive field properties of neurons evolved across from the thalamus to the superficial layers of the cortex, so we sampled (1) the relay neurons in the LGN, (2) cells in cortical layer 4, and (3) cells in cortical layer 2/3. To make direct comparisons, we used the same protocol for all cells (Fig. 1).
Figure 1.
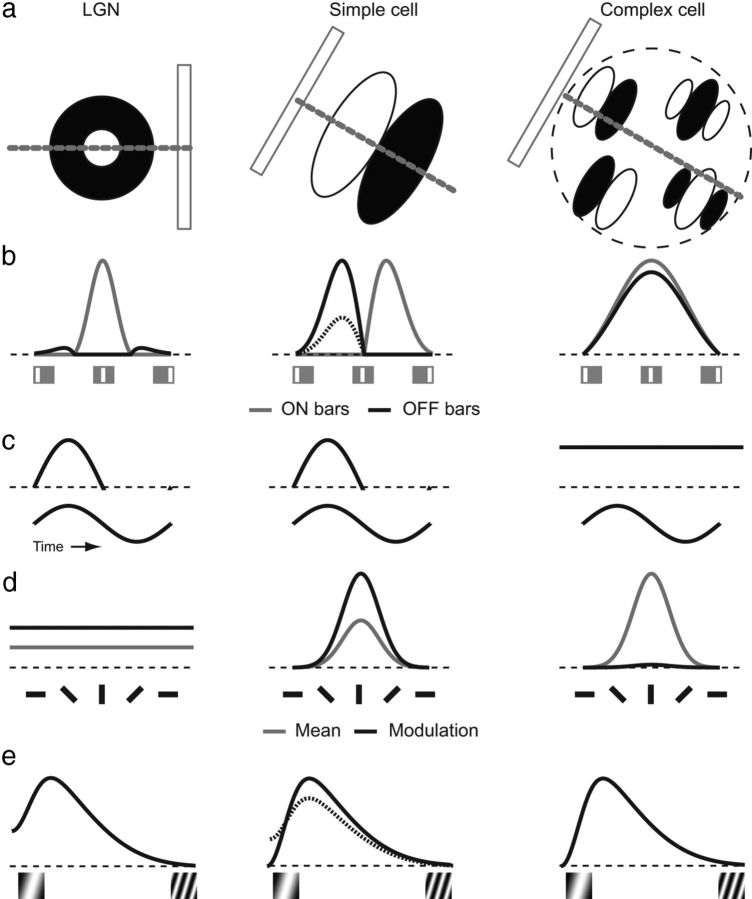
Predicted responses of “classical” cat LGN, simple, and complex cells to the stimuli used in this study. a, Schematic of a thin bar moving across the RF of LGN, simple, and complex cells. LGN and simple cells receive ON and OFF drive at distinct locations in the visual field; complex cells respond to a properly oriented bar at any location within the receptive field, as indicated by the multiple “simple” subunits shown (Hubel and Wiesel, 1959, 1961, 1962; Movshon et al., 1978b). b, Responses of each cell to thin ON and OFF bars at distinct locations. LGN cells are dominated by a single sign (ON in this example), whereas simple cells exhibit segregated subunits that may be balanced (thick lines) or not balanced (dotted OFF line), and complex cells exhibit overlapping ON and OFF responses. c, Responses to sinusoidal grating stimulation at the orientation that gives maximum response. LGN and simple cells exhibit modulated responses, while complex cells exhibit more constant responses. d, Responses to gratings at different orientations (gray line, mean response, F0; black line, magnitude of response modulation, F1). LGN cells are primarily indifferent to orientation, whereas simple and complex cells are orientation selective. e, Spatial frequency selectivity. LGN cells respond maximally at a preferred spatial frequency, but also respond to very low spatial frequencies; that is, they are low-pass cells. Simple cells are often bandpass and do not respond to low spatial frequencies, although they can be low pass if the ON and OFF subunits are not balanced (dotted line). Complex cells commonly exhibit bandpass responses.
First, each cell's receptive field location was determined by manually moving an oriented bar on the screen. Next, we coarsely sampled orientation selectivity with drifting square wave gratings (80% contrast; spatial frequency, 0.2 cycles per degree; temporal frequency, 4 Hz; stimulus size, 10° circular; 30° angle steps presented in pseudorandom order). We then measured responses to sinusoidal gratings at different spatial frequencies (orientation set to the preferred orientation) and temporal frequencies (orientation and spatial frequency set to preferred values). Subsequently, we made a “fine” measurement of orientation and/or direction selectivity by sampling responses to drifting sinusoidal gratings (22.5° angle steps; spatial and temporal frequencies set to preferred values). In some cells, we also examined contrast responses with drifting gratings.
Once we had established the cell's orientation selectivity with fine resolution, we measured the contribution of ON and OFF inputs by measuring responses to thin bars (Movshon et al., 1978a; Palmer and Davis, 1981; DeAngelis et al., 1993). The bars were as long as the screen permitted (>20° in length) and narrow (0.25–0.5° wide). The center location of the bar was varied in 0.25–0.5° steps orthogonal to the preferred orientation, and the contrast was varied, either white (to measure ON responses) or black (to measure OFF responses) on a gray background. Oriented bars were used here instead of black or white spots because the vast majority of cells in our study responded reliably to bars, whereas many cortical cells did not exhibit robust responses to small spots.
The predicted responses to classical cat receptive field profiles are shown in Figure 1. Figure 1a shows a thin bar being moved across a schematic RF map of an LGN cell (cat X cell; Kuffler, 1953; Hochstein and Shapley, 1976), a cat simple cell, and a cat complex cell (Hubel and Wiesel, 1962; Movshon et al., 1978a,b). Small ON bars (Fig. 1b) will produce responses in the ON regions of the LGN and simple cell RFs, which are both position sensitive, and will produce responses throughout the RF of a complex cell. OFF bars will produce responses at spatially segregated locations of LGN and simple cell RFs, while OFF bar responses will overlap the ON bar responses for complex receptive fields. Cat LGN and simple cells exhibit modulated responses to sinusoidal gratings (Fig. 1c), while complex cells exhibit less modulated and more constant responses to sinusoidal gratings (Skottun et al., 1991). LGN cells do not exhibit strong orientation preferences (Fig. 1d; Hubel and Wiesel, 1961; Zhou et al., 1995), whereas simple cells and complex cells exhibit strong orientation selectivity (Hubel and Wiesel, 1962; Movshon et al., 1978a,b). Spatial frequency tuning (Fig. 1e) for LGN cells is generally low pass (cells respond to low spatial frequencies), and is more variable for simple cells, depending upon whether the ON and OFF subunits are balanced (bandpass) or not balanced (low pass); complex receptive fields are typically bandpass (Maffei and Fiorentini, 1973; Bauman and Bonds, 1991; Johnson et al., 2001; Bredfeldt and Ringach, 2002; Shapley and Hawken, 2002; Heimel et al., 2005; Martinez et al., 2005).
ON/OFF responses, modulation, and orientation selectivity in LGN
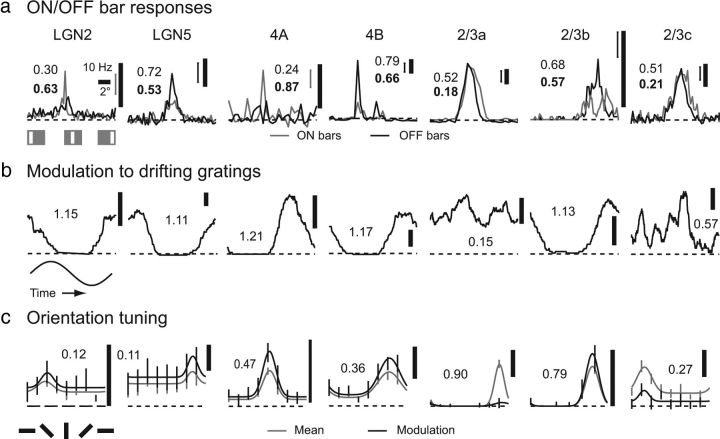
As expected, neurons in layers 1 and 2 and layers 4 and 5 in the lateral geniculate nucleus exhibited strong ON and OFF responses, respectively, in the center of their receptive fields, as shown in Figure 2a. Also, as expected from previous work (Kuffler, 1953), these ON- or OFF-center cells gave spiking responses to the opposite polarity at the receptive field edges (corresponding to the surround of the LGN receptive fields). Similar to LGN cells in other mammals, tree shrew LGN neurons were highly modulated by drifting sinusoidal gratings, and tended to respond with sinusoidal output (Fig. 2b). Finally, these LGN cells tended to exhibit very low orientation selectivity, that is, they responded equally well to gratings with different orientations (Fig. 2c).
Figure 2.
Visual responses of seven representative LGN and V1 cells in tree shrew. One example cell is shown from LGN layers 2 and 5 and cortical layers 4A, 4B, and three example cells are shown from layer 2/3. a, Responses to thin (0.25–0.5° of visual angle), optimally oriented bars of either sign (ON or OFF) presented at different positions within the cell's receptive field. Bar position was varied along the axis orthogonal to each cell's preferred orientation. LGN and cortical layer 4 cell responses were commonly dominated by a single sign (ON or OFF). LGN layers 1/2 and cortical layer 4A were dominated by ON responses, while LGN layers 4/5 and cortical layer 4B were dominated by OFF responses. Cells in cortical layer 2/3 commonly responded equally to stimulation with either sign at the same spatial positions, but some cells exhibited spatial segregation of ON and OFF responses (2/3b). Plain numbers indicate ON/OFF index values; bold numbers indicate the ON/OFF segregation index. Error bars indicate the SE of the mean at the position with the largest response. b, Cycle-by-cycle averages of responses to drifting sinusoidal gratings. Cells in LGN and cortical layers 4A and 4B were typically highly modulated by sinusoidal gratings, while cells in layer 2/3 commonly responded in a more constant fashion. Numbers indicate modulation index values. c, Orientation tuning curves for both mean responses (F0 component) and modulated responses (F1 component). Cells in LGN exhibited weak orientation selectivity. A few cortical layer 4 cells, like the layer 4A cell shown here, exhibited strong orientation selectivity, although most exhibited orientation selectivity that was only slightly increased from LGN cells. Layer 2/3 cells exhibited increased orientation selectivity, and upper layer 2/3 neurons showed the highest orientation selectivity of all layers examined. Numbers indicate orientation index values for either mean or modulated responses. (The greater response was used to calculate the orientation index.)
To quantitatively compare these responses with those of cortical neurons, we developed several index values (Figs. 2, 3). We created a normalized ON/OFF index that varied between 0 (ON) and 1 (OFF). In addition, we created an ON/OFF segregation index that varied from 0 (perfect spatial overlap of ON and OFF responses) to 1 (perfect spatial segregation of ON and OFF responses; see Materials and Methods). Furthermore, we made a sign index that indicated to what degree the cell was balanced in ON or OFF responses (near 0) or favored a particular sign (near 1). A modulation index was used to indicate the degree to which visual responses were modulated by sinusoidal grating stimulation (see Materials and Methods).
Figure 3.
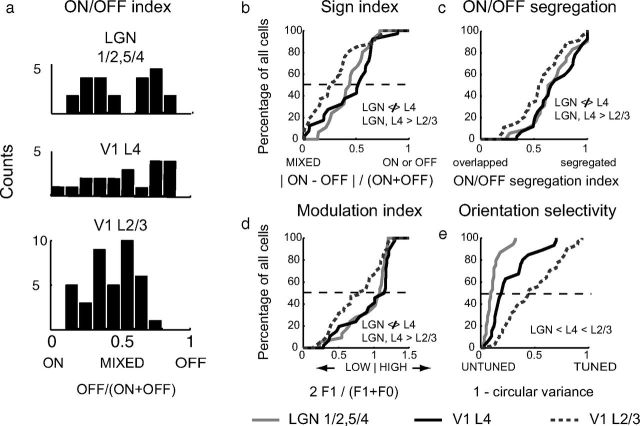
Distribution of index values in LGN layers 1, 2, 4, and 5 and cortical layers 4 and 2/3. a, ON/OFF index value histograms (bin width, 0.1). LGN and V1 layer 4 cells were most commonly dominated by single signs, whereas V1 layer 2/3 cells tended to be more mixed. b, Cumulative histogram of sign index values. V1 layer 2/3 cells were more mixed and had lower median sign index values than LGN and V1 layer 4 cells, which did not differ from each other. All statistical comparisons in this figure were made using the Kruskal–Wallis test with the Bonferonni correction, and p values of <0.05 were deemed significant. c, Cumulative histogram of ON/OFF segregation index values. LGN did not differ from cortical layer 4, and cortical layer 2/3 cells had lower ON/OFF segregation values than LGN/cortical layer 4. d, Cumulative histogram of modulation index values. LGN and V1 layer 4 cells were more modulated than V1 layer 2/3 cells. e, Orientation selectivity index values (1 − circular variance). LGN cells exhibited less orientation selectivity than V1 layer 4 cells, which in turn exhibited less orientation selectivity than V1 layer 2/3 cells.
Finally, we defined an index of orientation selectivity. Many cells in the lateral geniculate nucleus did not exhibit much orientation selectivity, so we wanted to choose an index that did not depend on Gaussian fits or the orthogonal to preferred ratio, as these quantities could indicate spurious peaks (that is, peaks due to noise) in cells with low orientation selectivity (Swindale, 1998). Instead, we chose a vector-based index, 1 minus the circular variance (Ringach et al., 2002), or 1 − CV = |R|, as an index of orientation selectivity that was robust for cells with either low or high orientation selectivity (Grabska-Barwinska et al., 2012). This value can vary from 0, if a cell responds equally at all orientations, to 1, if a cell responds for a single orientation only.
ON/OFF responses, modulation, and orientation selectivity in cortex
Single neuron responses in cortical layers 4A and 4B were remarkably similar to responses in LGN layers 1 and 2 and layers 4 and 5, respectively. Layer 4A was dominated by units with strong ON responses, while layer 4B was dominated by units with strong OFF responses (Fig. 2b), matching the response properties of the LGN layers that supply their input (Kretz et al., 1986). Like the neurons in the LGN, layer 4A and 4B neurons also gave much weaker responses to stimuli of the opposite sign (OFF in 4A and ON in 4B), and the dominant and opposite sign responses exhibited a spatial offset comparable to that seen in the LGN. Furthermore, cells in layers 4A and 4B were highly modulated by drifting gratings. As shown in Figure 3, there were no significant differences between sign index values, ON/OFF segregation index values, or modulation index values between cortical layers 4A and 4B and LGN layers 1, 2, 4, and 5 (Kruskal–Wallis test, p = 0.38, p = 0.73, and p = 0.62, respectively).
The only substantive difference between LGN cells and cells in cortical layers 4A and 4B was that cells in layers 4A and 4B exhibited modestly stronger orientation selectivity (Fig. 2c; Kruskal–Wallis test with Bonferonni correction, p < 0.001). The median orientation selectivity value was 0.19 in layers 4A and 4B, while it was only 0.09 in LGN layers 1, 2, 4, and 5.
Neurons in layer 2/3 exhibited a greater mixing of ON and OFF responses, with some cells exhibiting strong responses to both ON and OFF stimulation at the same, overlapping receptive field locations (Fig. 2a). However, many layer 2/3 cells were still biased toward preferring ON or OFF responses, and a majority of cells showed a bias toward ON responses (Fig. 3a,b). Compared to LGN and layer 4 neurons, fewer layer 2/3 neurons showed modulated responses, and cells in layer 2/3 most commonly exhibited more constant (that is, unmodulated) responses (Fig. 2b). The median modulation index value was 0.67. Finally, orientation selectivity was dramatically increased in layer 2/3 compared to layers 4A and 4B; the median orientation selectivity value was 0.44 (Fig. 2c).
The cumulative distributions in Figure 3 do not allow one to observe any finer-scale changes within the cortical layers, or to appreciate the diversity of the cortical responses within the layers. The index values for all cells in our study and their normalized depths within cortex (see Materials and Methods) or layers within the LGN are shown in Figure 4.
Figure 4.
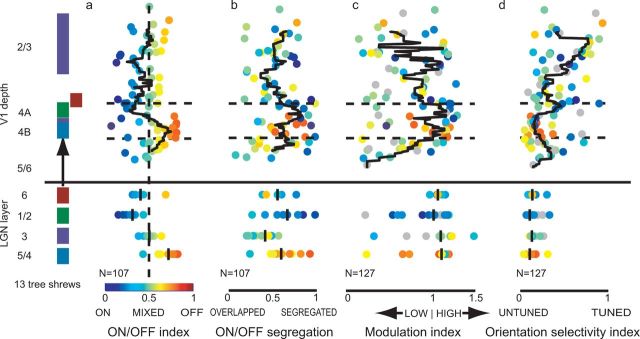
Laminar organization of receptive field properties for all cells. Left, Thalamocortical projection pattern in the tree shrew; colors in cortical layers match the colors of the LGN layers that provide direct thalamocortical input (Raczkowski and Fitzpatrick, 1990; Usrey et al., 1992). a, ON/OFF index values for LGN and V1 cells; the depths of V1 cells have been reconstructed and projected onto a “standard cortex” (see Materials and Methods). The black line indicates the sliding median value using a window size of 200 μm and a step size of 10 μm. Median values for each LGN layer are indicated by a black bar. The color of each cell matches the ON/OFF index color scale at bottom, and this ON/OFF index color is used for the same cell in all panels. As in previous studies, cells in LGN 1/2 and V1 4A are dominated by ON responses, while cells in LGN 4/5 and V1 4B are dominated by OFF responses (Conway and Schiller, 1983; Kretz et al., 1986; Holdefer and Norton, 1995). The transition between ON- and OFF-dominated responses in layer 4 is abrupt as expected and serves as a validation of the laminar reconstruction methods. b, ON/OFF segregation index (conventions are as in a). Color indicates the cell's ON/OFF index value. There is relatively high segregation of ON and OFF inputs in LGN layers 1, 2, 4, and 5 and cortical layer 4, whereas segregation is more variable in cortical layer 2/3. c, Modulation index values, conventions as in a). Color indicates the cell's ON/OFF index value; gray indicates cells where ON/OFF responses were not measured or not significant (ANOVA, p < 0.05). While a majority of LGN and V1 layer 4 cells exhibit high modulation index values, cells in layer 2/3 are more variable. A majority of layer 2/3 cells had modulation index values of <1, but a considerable minority exhibited high modulation. d, Orientation selectivity index values (conventions are as in c). There is substantial sublaminar organization of orientation selectivity. The top of V1 layer 4A exhibits increased orientation selectivity compared to the rest of layer 4, and orientation selectivity increases markedly as one moves superficially in V1 layer 2/3.
Before examining this data in more detail, it is worth considering the accuracy with which we are able to assign each unit's depth within cortex. It is possible that, for some units, we recorded spikes from dendritic or axonal segments rather than the soma, and the soma may be located hundreds of microns away from our recording site. The strongest validation of our laminar assignment comes from the fact that we were able to observe the known sublaminar organization of cortical layer 4, as strong ON biases were found in layer 4A, and strong OFF biases in layer 4B (Fig. 4a) This result gives us confidence that our cell localization procedures are sufficient to draw conclusions about the average properties of units within subdivisions of layer 4 and within layer 2/3. However, without anatomical labeling of individual physiologically characterized neurons, the precise location of the recorded units, especially those that reside near laminar borders, remains uncertain.
The most interesting findings to emerge from this finer-depth analysis have to do with the distribution of orientation selectivity within layers 2/3 and 4. Overall, orientation selectivity in layer 2/3 was significantly greater than in layer 4, but what is especially evident with this analysis is that neurons in the upper part of layer 2/3 (layers 2–3B) are much more narrowly tuned for orientation than those in the lower part of layer 2/3 (layer 3C). In addition, there also appears to be a sublaminar structure to orientation selectivity within layer 4. The majority of the layer 4 neurons fell within the range of orientation selectivity evident in the population of LGN neurons. Those with orientation tuning that fell well outside the range found for the LGN neurons were located at the upper and lower borders of layer 4, regions that are distinguished by projections from LGN layer 6 (Usrey et al., 1992).
Simple and complex cells in tree shrew V1
Orientation-selective cells have traditionally been divided into two classes: simple cells, which respond to light and/or dark bars at separate and specific spatial positions, and complex cells, which respond to bars of either sign, that is, light or dark, at any position within the cell's receptive field (Hubel and Wiesel, 1962). Simple cells are highly modulated by drifting sinusoidal gratings, owing to their separated ON/OFF receptive fields, whereas complex cells typically exhibit a constant (unmodulated) response to drifting gratings (Movshon et al., 1978a,b). Different studies have used different criteria for defining a simple cell; some use the separate subunit criteria, whereas others use the modulation index (Skottun et al., 1991).
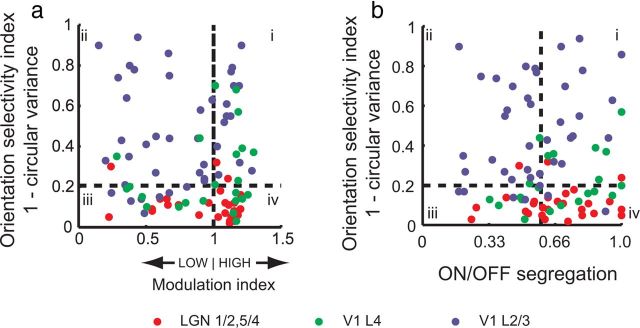
In Figure 5, we examine cells by both criteria by examining orientation selectivity, ON/OFF segregation, and modulation indexes for the neurons in our population. As in other mammals, a majority of LGN cells exhibited high modulation index values and low orientation selectivity, and only 2 of 27 neurons showed an orientation selectivity of >0.2 and a modulation index value of >1. However, 8 of 23 layer 4 cells could be classified as simple by this criteria (Skottun et al., 1991). Approximately the same percentage (6 of 21 layer 4 cells) could be classified as simple by the criteria of exhibiting both a high ON/OFF segregation and strong orientation selectivity (Fig. 5c). Note that a majority of these orientation-selective layer 4 cells are located near the upper and lower borders of layer 4 rather than being uniformly distributed within layer 4 (Fig. 4a). Layer 2/3 responses were more variable; 13 of 44 cells exhibited orientation selectivity and modulation index values that were considered simple, whereas a small majority of cells (23 of 44) were orientation selective and exhibited low modulation indexes, consistent with their classification as complex.
Figure 5.
Simple and complex cells in tree shrew V1. a, Orientation selectivity index plotted against the modulation index. To be considered simple, a cell's responses to drifting gratings must exhibit a modulation index of >1 and exhibit significant orientation selectivity (quadrant i; Skottun et al., 1991). By these criteria, several cells in V1 layers 4 and 2/3 can be classified as simple. Cells in quadrant ii are classic complex cells, and cells in quadrants iii and iv are unoriented. b, Orientation selectivity plotted against ON/OFF segregation index. The first investigators identified simple cells as those that exhibited both orientation selectivity and a spatial segregation of ON/OFF responses (Hubel and Wiesel, 1962). By this criteria, several cells among the cortical layer 4 and layer 2/3 cells in tree shrew would be classified as simple (quadrant i).
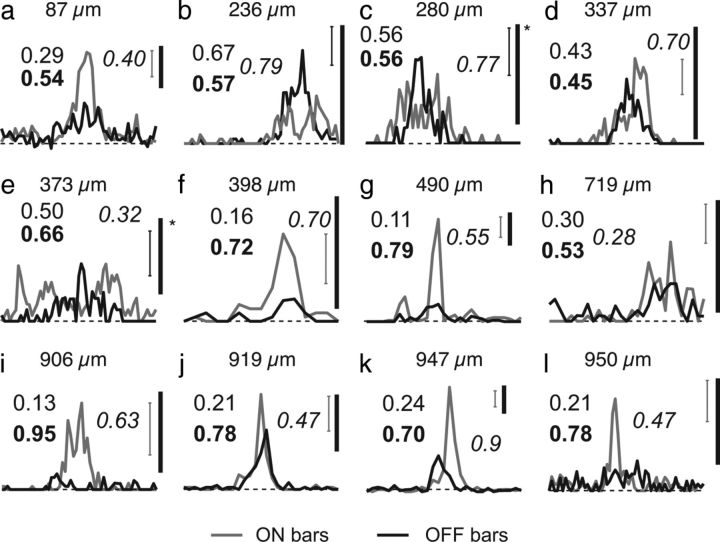
The high modulation index values in some orientation-selective cells indicate that the tree shrew has neurons that would be classified as simple by many studies, but these index values alone do not allow one to unambiguously infer the subunit structure of these cells. The “classic” simple cells first described by Hubel and Wiesel (1962) commonly had two to three distinct ON and OFF subregions, and others have shown that the strength of these ON and OFF inputs are well balanced in many cat simple cells (Hirsch et al., 1998). The ON and OFF subunits that are found in the cat visual cortex are derived from the convergence of inputs from ON- and OFF-center LGN cells, respectively (Reid and Alonso, 1995). Such convergence seems especially unlikely for the majority of cells in layer 4 of the tree shrew given the anatomical segregation of ON- and OFF-center LGN inputs to layer 4 and the strong dominance of ON or OFF responses in single layer 4 neurons. Moreover, neurons that are dominated by a single sign input, such as those described in the mouse (Liu et al., 2009), would also be expected to exhibit high modulation (Kagan et al., 2002). We wondered whether this would also be true for layer 2/3 neurons that exhibited both high modulation and high orientation selectivity (Fig. 6). We found that many of the cells classified as simple on the basis of modulation index exhibit dominance by a single sign, or unbalanced ON/OFF responses without spatially segregated ON/OFF responses. Thus, cells classified as simple based on modulation index comprise a heterogenous class, where only some cells exhibit the classic signature of simple cells: ON/OFF segregation.
Figure 6.
a–l, One-dimensional receptive field profiles for example layer 2/3 cells that exhibit high modulation (modulation index, ≥0.99). Scale bars: no asterisk, 10 Hz; asterisk, 5 Hz. Error bars indicate the SE of the mean at the position with the largest response. Plain numbers indicate ON/OFF index values; bold numbers indicate the ON/OFF segregation index; italics indicate orientation selectivity index values (1 − CV). Layer 2/3 cells with high modulation and orientation selectivity exhibit a variety of profiles, including profiles dominated by single signs (f, g, i, l), profiles that reflect unbalanced ON/OFF drive (a, j, k), and relatively balanced and segregated ON/OFF input (b–e).
Spatial frequency responses
Another way to examine whether subunit inputs are balanced or unbalanced is to examine spatial frequency responses. Orientation-selective cells in other mammals typically exhibit bandpass spatial frequency tuning (Maffei and Fiorentini, 1973; Bauman and Bonds, 1991; Bredfeldt and Ringach, 2002; Heimel et al., 2005). In the LGN, the center and surround receptive field subunits are generally not balanced (the center region has a larger weight than the surround), so LGN cells respond reliably to very low spatial frequencies such as a full-field flash; that is, LGN cells exhibit low-pass spatial frequency tuning. In layer 4 simple cells in the cat, the ON and OFF subunits are typically balanced (Hirsch et al., 1998), and simple cells do not respond strongly to a full-field flash.
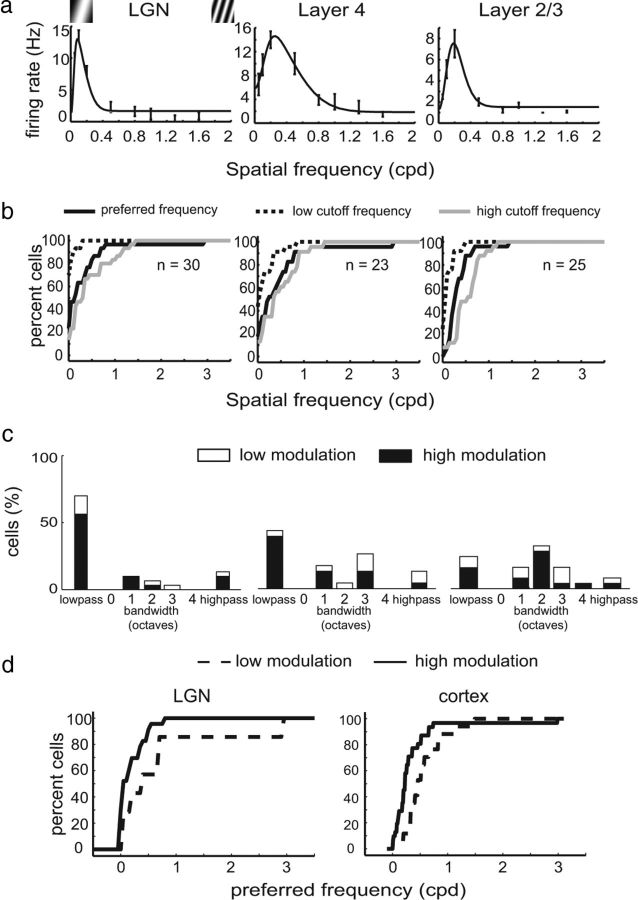
We examined spatial frequency tuning in tree shrew V1 neurons and found that a majority cortical layer 4 cells exhibited low-pass tuning properties similar to those in the LGN (χ2 frequency test, p = 0.10). In contrast, there was a sharp reduction in the percentage of cells exhibiting low-pass responses in layer 2/3 and substantial increase in cells exhibiting bandpass selectivity (Fig. 7). A few cells that exhibited high modulation index values were low pass, whereas several others showed bandpass tuning, consistent with the idea that these cells have balanced subunits.
Figure 7.
Spatial frequency selectivity in tree shrew LGN/V1. a, Responses of a typical LGN cell (left), cortical layer 4 cell (middle), and cortical layer 2/3 cell (right). b, Cumulative distributions of low cutoff, preferred spatial frequency, and high spatial frequency for LGN cells (left), layer 4 cells (middle), and layer 2/3 cells (right). c, Histograms of spatial frequency bandwidth for the same cell groups; a majority of LGN and layer 4 cells exhibit low-pass spatial frequency tuning, whereas a majority of layer 2/3 cells exhibit bandpass tuning. d, Preferred spatial frequency tuning for cells with low (<1) and high (>1) modulation index values. Cells that exhibited low modulation index values also tended to exhibit higher preferred spatial frequencies.
Temporal frequency responses
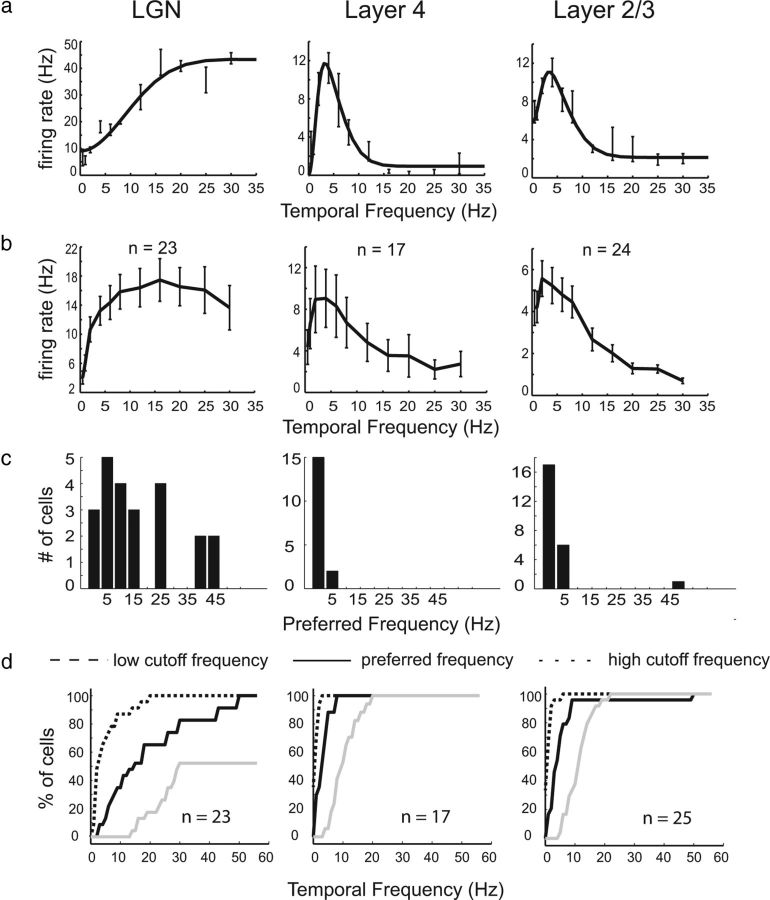
There is also a dramatic transformation in temporal frequency selectivity from LGN to cortex. In the macaque monkey, LGN cells respond to a wide range of temporal frequencies, including many frequencies >16 Hz, whereas cortical cells almost exclusively prefer temporal frequencies that are <16 Hz (Hawken et al., 1996). The transformation in the tree shrew was very similar to that in the macaque (Fig. 8). The transition to lower temporal frequency preferences in the tree shrew occurs immediately in layer 4 (Fig. 8b), whereas the transition to highly orientation-selective and highly bandpass-selective cells does not occur until layer 2/3, suggesting the mechanisms of temporal frequency tuning may be distinct from those of orientation tuning and spatial frequency tuning.
Figure 8.
Temporal frequency tuning in tree shrew LGN/V1. a, Responses of typical LGN cell (left), cortical layer 4 cell (middle), and cortical layer 2/3 cell (right). b, Mean responses, averaged over all cells of the same cell groups as in a. LGN cells exhibit strong responses over a broad range of temporal frequencies, whereas cortical layer 4 and 2/3 cells exhibit strong firing for temporal frequencies <16 Hz. c, Histograms of preferred temporal frequencies for these three cell groups. d, Cumulative distribution of low cutoff, preferred, and high cutoff values for these groups.
Lack of direction selectivity in LGN and cortical layers 4 and 2/3
Direction selectivity is also an emergent property of cortical circuits in the cat and monkey, and we thought it would be useful to assay whether direction-selective responses arise in tree shrew V1 and, if so, in which layers. We observed very little evidence of direction selectivity in either LGN or layers 4 or 2/3 of V1, as shown in Figure 9. Median 1 − DCV values across cortex were 0.06, and only a single cell (Fig. 9b) exhibited a 1 − DCV value >0.5. We did not record many neurons in the infragranular layers 5/6, so it is possible that there are some direction-selective cells in those layers, as there are in the squirrel (Heimel et al., 2005). We cannot exclude the possibility that there are some direction-selective cells that were not sampled, but they are not likely to be present in great numbers.
Figure 9.
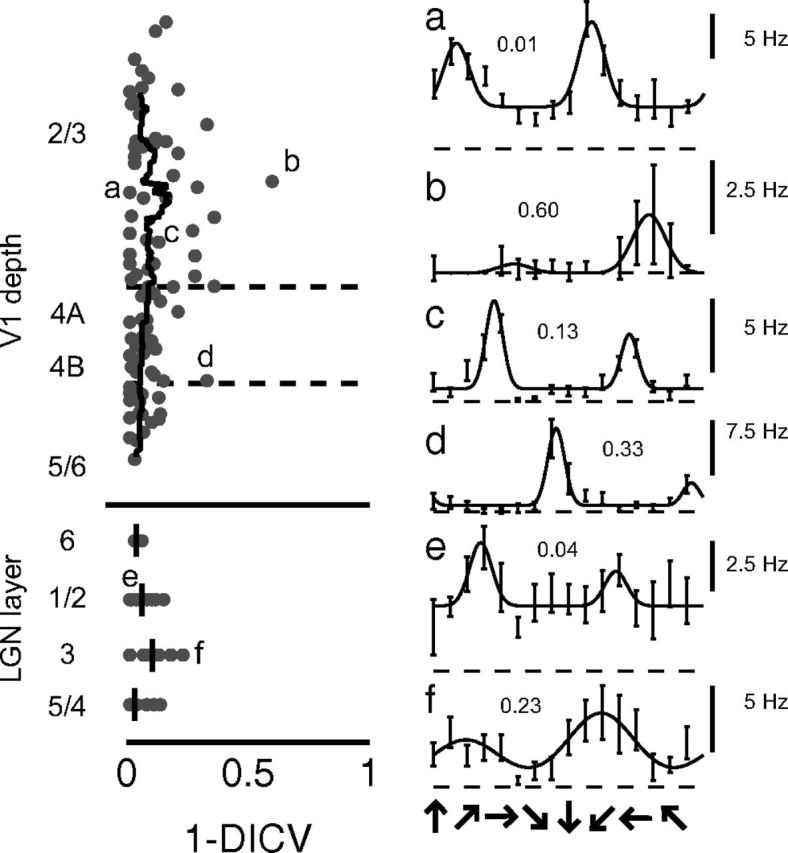
Little evidence for direction selectivity in LGN, V1 layers 4, 2/3. Left, Laminar profile of the direction selectivity index (1 − DCV). Right, Example direction tuning curves of several neurons (a–f). Only a handful of neurons exhibit moderate to high direction selectivity index values. Numbers indicate direction selectivity index values.
Discussion
These results confirm that RF properties in tree shrew V1 layer 4 are similar to those of the LGN cells that provide their input. LGN cells are unselective for orientation, dominated by a single sign, and give strongly modulated responses to sinusoidal gratings. Most neurons in cortical layer 4 also exhibited these properties, although some, notably those near the edges of layer 4, exhibited increased orientation selectivity, and most layer 4 neurons exhibited a preference for lower temporal frequencies. Neurons in cortical layer 2/3 differ significantly from those in LGN; most exhibited strong orientation tuning and both ON and OFF responses. Modulation indexes provide evidence for simple and complex cells in both layer 4 and layer 2/3. However, neurons with high modulation indexes were heterogenous in the spatial organization of ON and OFF responses, and many exhibited unbalanced ON/OFF responses rather than segregated ON and OFF subunits.
Species differences in the cortical transform of LGN inputs
Neurons in layer 4 of cat V1 exhibit dramatically different properties from those supplied by LGN inputs. Most layer 4 neurons exhibit orientation-selective responses and well-defined ON and OFF subunits (Reid and Alonso, 1995; Ferster et al., 1996; Chung and Ferster, 1998), reflecting the convergence of inputs from ON- and OFF-center LGN neurons. The orientation selectivity in these cells is conferred by the spatial alignment, in an elongated fashion, of inputs from center-surround LGN RFs. In addition to orientation, layer 4 in cat V1 is also the site of emergence of direction selectivity, with a high percentage of neurons exhibiting a strong response to a preferred direction of motion.
In contrast, neurons in layer 4 of tree shrew V1 exhibit responses that are similar to those of LGN neurons. A majority of layer 4 cells are poorly tuned for orientation and direction, and exhibit strongly biased ON or OFF responses. Thus, the first stage of cortical processing in tree shrew is fundamentally different from that found in cat and presumably reflects the distinct evolutionary histories that have shaped the visual systems in these species.
Early studies of RFs in layer 4C of macaque visual cortex also indicated that the responses were similar to those in LGN, with little sign of the orientation selectivity that is the hallmark of the responses in layer 4 of the cat (Hubel and Wiesel, 1968). Subsequent studies confirmed that neurons in the parvocellular-recipient strata of layer 4C were not orientation selective, but detected orientation-selective neurons in the strata that receive inputs from the magnocellular LGN layers (Blasdel and Fitzpatrick, 1984; Gur et al., 2005; but see Ringach et al., 2002). Thus, the organization in the tree shrew appears similar to the organization responsible for elaborating responses from the parvocellular layers of macaque LGN. The lack of direction selectivity in cortical layer 4 and in the superficial layers of the tree shrew visual cortex is also similar to the cortical circuits that process information from the primate parvocellular pathway (Hawken et al., 1988; Livingstone and Hubel, 1988; Gur et al., 2005; Saul et al., 2005).
It has been suggested that the first stage of processing in mouse V1 resembles the first stage in cat since a majority of layer 4 neurons exhibit orientation selectivity and modulation to sinusoidal stimulation (Niell and Stryker, 2008). But many of these neurons appear to be dominated by responses to a single sign (either ON or OFF). Moreover, it has been suggested that the orientation tuning of layer 4 neurons in the mouse is substantially broader than that found in layer 4 of the cat, and the subthreshold responses of these cells could result from the orientation bias that is supplied by individual LGN neurons (Tan et al., 2011; Scholl et al., 2013). In addition, imaging of mouse LGN indicates that some LGN relay cells exhibit direction selectivity (Marshel et al., 2012; Piscopo et al., 2013), suggesting that both orientation and direction selectivity of at least some cortical neurons could result from biases that are already present in LGN inputs.
These comparisons suggest that there are striking species differences in the first stage of cortical processing, ranging from modest elaborations of LGN inputs to the emergence of multiple response properties not present in LGN. Given millions of years of evolution [the relationship between tree shrews and cats is thought to be more distant than the relationships between tree shrews and primates or rodents (Krubitzer and Seelke, 2012)] and the marked differences in the natural habitats occupied by these species, perhaps it is not surprising that there are substantial differences in the properties displayed by layer 4 neurons. Nevertheless, these differences raise challenges for elucidating the principles that underlie the evolutionary flexibility of cortical circuit organization and the developmental mechanisms that guide their construction.
Simple and complex cells
In cat, the majority of neurons in layer 4 have well-segregated, balanced ON and OFF subfields that yield highly modulated responses to grating stimulation. In contrast, most neurons in layer 2/3 have complex RFs with poorly modulated responses. In the tree shrew, many neurons in layer 4 and in layer 2/3 exhibit high modulation index values, and some of these are selective for orientation, qualifying them for inclusion in the simple cell class. By the orientation/modulation criteria, simple and complex RFs have been observed in every mammal examined, including rodents (Girman et al., 1999; Heimel et al., 2005; Niell and Stryker, 2008), carnivores (Hubel and Wiesel, 1962), primates (Hubel and Wiesel, 1968) and prosimians (DeBruyn et al., 1993), marsupials (Ibbotson et al., 2005), and now tree shrews (order Scandentia). We note, however, that many cells with high modulation indexes in tree shrew V1 lack the highly segregated and balanced ON and OFF fields that characterize most cells in cat layer 4. Cells classified as simple based on modulation index comprise a heterogenous class where only some cells exhibit strong spatial segregation of ON and OFF responses. Such diversity challenges the merits of using the modulation ratio criteria as a definition of simple cell RFs without fully exploring the underlying basis for the linear response behavior.
Relation of findings to anatomy of V1 circuits
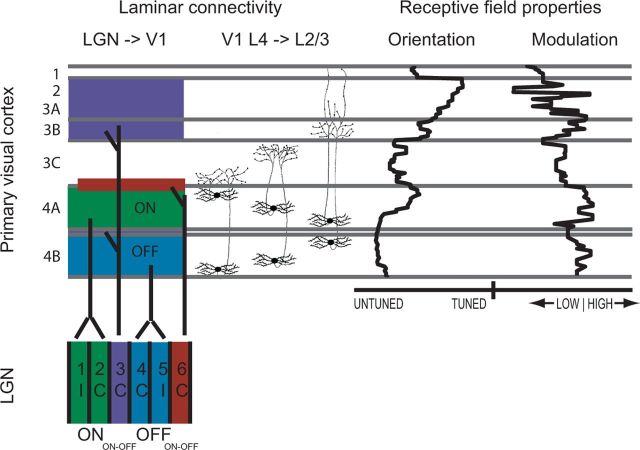
Tree shrew V1 exhibits a fine laminar organization of both inputs that arise from LGN and inputs that arise within a local cortical column (Fig. 10). The ON-dominated LGN layers (1/2) project to cortical layer 4A, whereas the OFF-dominated LGN layers (4/5) project to 4B (Raczkowski and Fitzpatrick, 1990). The ON/OFF LGN layers (3/6), project directly to subtiers of cortical layer 3 as shown, and LGN layer 3 also makes a small projection to middle cortical layer 4 (Usrey et al., 1992). Cells in the subtiers of cortical layer 4 make highly ordered connections with cortical layer 3: cells at the outer regions of layer 4 project to lower layer 3C, while cells near the center of layer 4 project densely to layer 3B and lightly to the more superficial layers (Muly and Fitzpatrick, 1992).
Figure 10.
A comparison of laminar connectivity and receptive field properties. Left, Connections from LGN to V1 layers 4 and 2/3 and connections from V1 layer 4 to V1 layer 2/3 (Raczkowski and Fitzpatrick, 1990; Muly and Fitzpatrick, 1992; Usrey et al., 1992). Right, Median orientation index values and modulation index values across these layers (present study). V1 layer 3B exhibits both strong orientation selectivity index values and strong modulation index values, but primarily receives input from the middle of layer 4, which exhibits weak orientation tuning. We speculate that layer 3B may be comprised of orientation-selective simple cells, which in turn may project to V1 layers 2 and 3A, where a majority of cells exhibit complex receptive fields. Orientation selectivity index values continue to increase as one moves superficially in layer 4. These upper layers send short- and long-range horizontal connections across the cortical surface, and these horizontal connections may participate in the sharpening of orientation tuning in these layers (Chisum and Fitzpatrick, 2004).
If we juxtapose these laminar connections with the median values of orientation selectivity and the modulation index that were obtained, two observations are immediately clear. First, the middle tier of cortical layer 4 exhibits very weak orientation selectivity, yet it projects densely to layer 3B, which exhibits moderate orientation selectivity. Second, the upper portion of 4A, which exhibits moderately higher orientation selectivity than the rest of layer 4, projects to layer 3C, which exhibits little orientation selectivity. This correspondence raises the possibility that the orientation selectivity that is found within layer 2/3 is derived primarily from synaptic inputs of cells that are relatively unselective for orientation. The spatial organization of the projections from layer 4 to layer 2/3 is arranged in a fashion that is consistent with this idea (Mooser et al., 2004).
The strongest orientation selectivity was observed in the most superficial layers, layers 2 and 3A. These superficial layers also send and receive short- and long-range connections across the cortical surface (Bosking et al., 1997), and previous studies have suggested that contributions from these horizontal connections are needed to fully explain the very large aspect ratio of the elongated RFs in the superficial layers (Chisum and Fitzpatrick, 2004). The fact that the cells with the highest degree of orientation selectivity are found primarily in layers with widespread horizontal connections lends additional support to this idea.
Conclusion
V1 is homologous across mammals. Yet despite this common heritage, there are fundamental differences in the principles of V1 circuit organization, differences that reflect an accumulation of changes favored by natural selection operating in different environments over millions of years of evolution. In cat, orientation selectivity is derived from the pattern of connections of LGN cells onto layer 4 neurons, whereas in tree shrew it is largely derived from the pattern of connections from layer 4 to 2/3. While these mechanisms are similar in description, the cells involved are unlikely to be homologous, suggesting that these mechanisms reflect convergent evolution. A complete understanding of the principles of cortical circuit function will require an appreciation of this diversity and analysis of the mechanisms that support it.
Footnotes
This work was supported by grants from the National Institutes of Health to D.F. and S.D.V.H. We thank Elizabeth Johnson and other members of the Fitzpatrick lab for helpful discussions, and Alexander Heimel for Matlab code.
References
- Adams DL, Horton JC. Monocular cells without ocular dominance columns. J Neurophysiol. 2006;96:2253–2264. doi: 10.1152/jn.00131.2006. [DOI] [PubMed] [Google Scholar]
- Alonso JM, Martinez LM. Functional connectivity between simple cells and complex cells in cat striate cortex. Nat Neurosci. 1998;1:395–403. doi: 10.1038/1609. [DOI] [PubMed] [Google Scholar]
- Bauman LA, Bonds AB. Inhibitory refinement of spatial frequency selectivity in single cells of the cat striate cortex. Vis Res. 1991;31:933–944. doi: 10.1016/0042-6989(91)90201-F. [DOI] [PubMed] [Google Scholar]
- Blasdel GG, Fitzpatrick D. Physiological organization of layer 4 in macaque striate cortex. J Neurosci. 1984;4:880–895. doi: 10.1523/JNEUROSCI.04-03-00880.1984. [DOI] [PMC free article] [PubMed] [Google Scholar]
- Bosking WH, Zhang Y, Schofield B, Fitzpatrick D. Orientation selectivity and the arrangement of horizontal connections in tree shrew striate cortex. J Neurosci. 1997;17:2112–2127. doi: 10.1523/JNEUROSCI.17-06-02112.1997. [DOI] [PMC free article] [PubMed] [Google Scholar]
- Brainard DH. The psychophysics toolbox. Spatial Vis. 1997;10:433–436. doi: 10.1163/156856897X00357. [DOI] [PubMed] [Google Scholar]
- Bredfeldt CE, Ringach DL. Dynamics of spatial frequency tuning in macaque V1. J Neurosci. 2002;22:1976–1984. doi: 10.1523/JNEUROSCI.22-05-01976.2002. [DOI] [PMC free article] [PubMed] [Google Scholar]
- Chisum HJ, Fitzpatrick D. The contribution of vertical and horizontal connections to the receptive field center and surround in V1. Neural Netw. 2004;17:681–693. doi: 10.1016/j.neunet.2004.05.002. [DOI] [PubMed] [Google Scholar]
- Chisum HJ, Mooser F, Fitzpatrick D. Emergent properties of layer 2/3 neurons reflect the collinear arrangement of horizontal connections in tree shrew visual cortex. J Neurosci. 2003;23:2947–2960. doi: 10.1523/JNEUROSCI.23-07-02947.2003. [DOI] [PMC free article] [PubMed] [Google Scholar]
- Chung S, Ferster D. Strength and orientation tuning of the thalamic input to simple cells revealed by electrically evoked cortical suppression. Neuron. 1998;20:1177–1189. doi: 10.1016/S0896-6273(00)80498-5. [DOI] [PubMed] [Google Scholar]
- Conley M, Fitzpatrick D, Diamond IT. The laminar organization of the lateral geniculate body and the striate cortex in the tree shrew (Tupaia glis) J Neurosci. 1984;4:171–197. doi: 10.1523/JNEUROSCI.04-01-00171.1984. [DOI] [PMC free article] [PubMed] [Google Scholar]
- Conway JL, Schiller PH. Laminar organization of tree shrew dorsal lateral geniculate nucleus. J Neurophysiol. 1983;50:1330–1342. doi: 10.1152/jn.1983.50.6.1330. [DOI] [PubMed] [Google Scholar]
- DeAngelis GC, Ohzawa I, Freeman RD. Spatiotemporal organization of simple-cell receptive fields in the cat's striate cortex. I. General characteristics and postnatal development. J Neurophysiol. 1993;69:1091–1117. doi: 10.1152/jn.1993.69.4.1091. [DOI] [PubMed] [Google Scholar]
- DeBruyn EJ, Casagrande VA, Beck PD, Bonds AB. Visual resolution and sensitivity of single cells in the primary visual cortex (V1) of a nocturnal primate (bush baby): correlations with cortical layers and cytochrome oxidase patterns. J Neurophysiol. 1993;69:3–18. doi: 10.1152/jn.1993.69.1.3. [DOI] [PubMed] [Google Scholar]
- Enroth-Cugell C, Robson JG. The contrast sensitivity of retinal ganglion cells of the cat. J Physiol. 1966;187:517–552. doi: 10.1113/jphysiol.1966.sp008107. [DOI] [PMC free article] [PubMed] [Google Scholar]
- Ferster D, Chung S, Wheat H. Orientation selectivity of thalamic input to simple cells of cat visual cortex. Nature. 1996;380:249–252. doi: 10.1038/380249a0. [DOI] [PubMed] [Google Scholar]
- Fitzpatrick D, Raczkowski D. Innervation patterns of single physiologically identified geniculocortical axons in the striate cortex of the tree shrew. Proc Natl Acad Sci U SA. 1990;87:449–453. doi: 10.1073/pnas.87.1.449. [DOI] [PMC free article] [PubMed] [Google Scholar]
- Girman SV, Sauvé Y, Lund RD. Receptive field properties of single neurons in rat primary visual cortex. J Neurophysiol. 1999;82:301–311. doi: 10.1152/jn.1999.82.1.301. [DOI] [PubMed] [Google Scholar]
- Grabska-Barwińska A, Ng BS, Jancke D. Orientation selective or not? Measuring significance of tuning to a circular parameter. J Neurosci Methods. 2012;203:1–9. doi: 10.1016/j.jneumeth.2011.08.026. [DOI] [PubMed] [Google Scholar]
- Gur M, Kagan I, Snodderly DM. Orientation and direction selectivity of neurons in V1 of alert monkeys: functional relationships and laminar distributions. Cereb Cortex. 2005;15:1207–1221. doi: 10.1093/cercor/bhi003. [DOI] [PubMed] [Google Scholar]
- Hawken MJ, Parker AJ, Lund JS. Laminar organization and contrast sensitivity of direction-selective cells in the striate cortex of the Old World monkey. J Neurosci. 1988;8:3541–3548. doi: 10.1523/JNEUROSCI.08-10-03541.1988. [DOI] [PMC free article] [PubMed] [Google Scholar]
- Hawken MJ, Shapley RM, Grosof DH. Temporal-frequency selectivity in monkey visual cortex. Vis Neurosci. 1996;13:477–492. doi: 10.1017/S0952523800008154. [DOI] [PubMed] [Google Scholar]
- Heimel JA, Van Hooser SD, Nelson SB. Laminar organization of response properties in primary visual cortex of the gray squirrel (Sciurus carolinensis) J Neurophysiol. 2005;94:3538–3554. doi: 10.1152/jn.00106.2005. [DOI] [PubMed] [Google Scholar]
- Hirsch JA, Alonso JM, Reid RC, Martinez LM. Synaptic integration in striate cortical simple cells. J Neurosci. 1998;18:9517–9528. doi: 10.1523/JNEUROSCI.18-22-09517.1998. [DOI] [PMC free article] [PubMed] [Google Scholar]
- Hochstein S, Shapley RM. Quantitative analysis of retinal ganglion cell classifications. J Physiol. 1976;262:237–264. doi: 10.1113/jphysiol.1976.sp011594. [DOI] [PMC free article] [PubMed] [Google Scholar]
- Holdefer RN, Norton TT. Laminar organization of receptive field properties in the dorsal lateral geniculate nucleus of the tree shrew (Tupaiaglis belangeri) J Comp Neurol. 1995;358:401–413. doi: 10.1002/cne.903580307. [DOI] [PubMed] [Google Scholar]
- Hubel DH, Wiesel TN. Receptive fields of single neurones in the cat's striate cortex. J Physiol. 1959;148:574–591. doi: 10.1113/jphysiol.1959.sp006308. [DOI] [PMC free article] [PubMed] [Google Scholar]
- Hubel DH, Wiesel TN. Integrative action in the cat's lateral geniculate body. J Physiol. 1961;155:385–398. doi: 10.1113/jphysiol.1961.sp006635. [DOI] [PMC free article] [PubMed] [Google Scholar]
- Hubel DH, Wiesel TN. Receptive fields, binocular interaction and functional architecture in the cat's visual cortex. J Physiol. 1962;160:106–154. doi: 10.1113/jphysiol.1962.sp006837. [DOI] [PMC free article] [PubMed] [Google Scholar]
- Hubel DH, Wiesel TN. Receptive fields and functional architecture of monkey striate cortex. J Physiol. 1968;195:215–243. doi: 10.1113/jphysiol.1968.sp008455. [DOI] [PMC free article] [PubMed] [Google Scholar]
- Humphrey AL, Norton TT. Topographic organization of the orientation column system in the striate cortex of the tree shrew (Tupaia glis). I. Microelectrode recording. J Comp Neurol. 1980;192:531–547. doi: 10.1002/cne.901920311. [DOI] [PubMed] [Google Scholar]
- Ibbotson MR, Price NS, Crowder NA. On the division of cortical cells into simple and complex types: a comparative viewpoint. J Neurophysiol. 2005;93:3699–3702. doi: 10.1152/jn.01159.2004. [DOI] [PubMed] [Google Scholar]
- Johnson EN, Hawken MJ, Shapley R. The spatial transformation of color in the primary visual cortex of the macaque monkey. Nat Neurosci. 2001;4:409–416. doi: 10.1038/86061. [DOI] [PubMed] [Google Scholar]
- Kagan I, Gur M, Snodderly DM. Spatial organization of receptive fields of V1 neurons of alert monkeys: comparison with responses to gratings. J Neurophysiol. 2002;88:2557–2574. doi: 10.1152/jn.00858.2001. [DOI] [PubMed] [Google Scholar]
- Kretz R, Rager G, Norton TT. Laminar organization of ON and OFF regions and ocular dominance in the striate cortex of the tree shrew (Tupaia belangeri) J Comp Neurol. 1986;251:135–145. doi: 10.1002/cne.902510110. [DOI] [PubMed] [Google Scholar]
- Krubitzer LA, Seelke AM. Cortical evolution in mammals: the bane and beauty of phenotypic variability. Proc Natl Acad Sci U S A. 2012;109(Suppl 1):10647–10654. doi: 10.1073/pnas.1201891109. [DOI] [PMC free article] [PubMed] [Google Scholar]
- Kuffler SW. Discharge patterns and functional organization of mammalian retina. J Neurophysiol. 1953;16:37–68. doi: 10.1152/jn.1953.16.1.37. [DOI] [PubMed] [Google Scholar]
- Liu BH, Li P, Li YT, Sun YJ, Yanagawa Y, Obata K, Zhang LI, Tao HW. Visual receptive field structure of cortical inhibitory neurons revealed by two-photon imaging guided recording. J Neurosci. 2009;29:10520–10532. doi: 10.1523/JNEUROSCI.1915-09.2009. [DOI] [PMC free article] [PubMed] [Google Scholar]
- Livingstone M, Hubel D. Segregation of form, color, movement, and depth: anatomy, physiology, and perception. Science. 1988;240:740–749. doi: 10.1126/science.3283936. [DOI] [PubMed] [Google Scholar]
- Maffei L, Fiorentini A. The visual cortex as a spatial frequency analyser. Vision Res. 1973;13:1255–1267. doi: 10.1016/0042-6989(73)90201-0. [DOI] [PubMed] [Google Scholar]
- Marshel JH, Kaye AP, Nauhaus I, Callaway EM. Anterior-posterior direction opponency in the superficial mouse lateral geniculate nucleus. Neuron. 2012;76:713–720. doi: 10.1016/j.neuron.2012.09.021. [DOI] [PMC free article] [PubMed] [Google Scholar]
- Martinez LM, Wang Q, Reid RC, Pillai C, Alonso JM, Sommer FT, Hirsch JA. Receptive field structure varies with layer in the primary visual cortex. Nat Neurosci. 2005;8:372–379. doi: 10.1038/nn1404. [DOI] [PMC free article] [PubMed] [Google Scholar]
- Mooser F, Bosking WH, Fitzpatrick D. A morphological basis for orientation tuning in primary visual cortex. Nat Neurosci. 2004;7:872–879. doi: 10.1038/nn1287. [DOI] [PubMed] [Google Scholar]
- Movshon JA, Thompson ID, Tolhurst DJ. Spatial summation in the receptive fields of simple cells in the cat's striate cortex. J Physiol. 1978a;283:53–77. doi: 10.1113/jphysiol.1978.sp012488. [DOI] [PMC free article] [PubMed] [Google Scholar]
- Movshon JA, Thompson ID, Tolhurst DJ. Receptive field organization of complex cells in the cat's striate cortex. J Physiol. 1978b;283:79–99. doi: 10.1113/jphysiol.1978.sp012489. [DOI] [PMC free article] [PubMed] [Google Scholar]
- Muly EC, Fitzpatrick D. The morphological basis for binocular and ON/OFF convergence in tree shrew striate cortex. J Neurosci. 1992;12:1319–1334. doi: 10.1523/JNEUROSCI.12-04-01319.1992. [DOI] [PMC free article] [PubMed] [Google Scholar]
- Niell CM, Stryker MP. Highly selective receptive fields in mouse visual cortex. J Neurosci. 2008;28:7520–7536. doi: 10.1523/JNEUROSCI.0623-08.2008. [DOI] [PMC free article] [PubMed] [Google Scholar]
- Palmer LA, Davis TL. Receptive-field structure in cat striate cortex. J Neurophysiol. 1981;46:260–276. doi: 10.1152/jn.1981.46.2.260. [DOI] [PubMed] [Google Scholar]
- Pelli DG. The Video Toolbox software for visual psychophysics: transforming numbers into movies. Spatial Vis. 1997;10:437–442. doi: 10.1163/156856897X00366. [DOI] [PubMed] [Google Scholar]
- Piscopo DM, El-Danaf RN, Huberman AD, Niell CM. Diverse visual features encoded in mouse lateral geniculate nucleus. J Neurosci. 2013;33:4642–4656. doi: 10.1523/JNEUROSCI.5187-12.2013. [DOI] [PMC free article] [PubMed] [Google Scholar]
- Raczkowski D, Fitzpatrick D. Terminal arbors of individual, physiologically identified geniculocortical axons in the tree shrew's striate cortex. J1 Comp1 Neurol. 1990;302:500–514. doi: 10.1002/cne.903020307. [DOI] [PubMed] [Google Scholar]
- Reid RC, Alonso JM. Specificity of monosynaptic connections from thalamus to visual cortex. Nature. 1995;378:281–284. doi: 10.1038/378281a0. [DOI] [PubMed] [Google Scholar]
- Ringach DL, Shapley RM, Hawken MJ. Orientation selectivity in macaque V1: diversity and laminar dependence. J Neurosci. 2002;22:5639–5651. doi: 10.1523/JNEUROSCI.22-13-05639.2002. [DOI] [PMC free article] [PubMed] [Google Scholar]
- Saul AB, Carras PL, Humphrey AL. Temporal properties of inputs to direction-selective neurons in monkey V1. J Neurophysiol. 2005;94:282–294. doi: 10.1152/jn.00868.2004. [DOI] [PubMed] [Google Scholar]
- Schiller PH, Finlay BL, Volman SF. Quantitative studies of single-cell properties in monkey striate cortex. I. Spatiotemporal organization of receptive fields. J Neurophysiol. 1976;39:1288–1319. doi: 10.1152/jn.1976.39.6.1288. [DOI] [PubMed] [Google Scholar]
- Scholl B, Tan AY, Corey J, Priebe NJ. Emergence of orientation selectivity in the mammalian visual pathway. J Neurosci. 2013;33:10616–10624. doi: 10.1523/JNEUROSCI.0404-13.2013. [DOI] [PMC free article] [PubMed] [Google Scholar]
- Shapley R, Hawken M. Neural mechanisms for color perception in the primary visual cortex. Curr Opin Neurobiol. 2002;12:426–432. doi: 10.1016/S0959-4388(02)00349-5. [DOI] [PubMed] [Google Scholar]
- Skottun BC, De Valois RL, Grosof DH, Movshon JA, Albrecht DG, Bonds AB. Classifying simple and complex cells on the basis of response modulation. Vision Res. 1991;38:1079–1086. doi: 10.1016/0042-6989(91)90033-2. [DOI] [PubMed] [Google Scholar]
- Swindale NV. Orientation tuning curves: empirical description and estimation of parameters. Biol Cybern. 1998;78:45–56. doi: 10.1007/s004220050411. [DOI] [PubMed] [Google Scholar]
- Tan AY, Brown BD, Scholl B, Mohanty D, Priebe NJ. Orientation selectivity of synaptic input to neurons in mouse and cat primary visual cortex. J Neurosci. 2011;31:12339–12350. doi: 10.1523/JNEUROSCI.2039-11.2011. [DOI] [PMC free article] [PubMed] [Google Scholar]
- Usrey WM, Muly EC, Fitzpatrick D. Lateral geniculate projections to the superficial layers of visual cortex in the tree shrew. J Comp Neurol. 1992;319:159–171. doi: 10.1002/cne.903190113. [DOI] [PubMed] [Google Scholar]
- Van Hooser SD, Heimel JA, Chung S, Nelson SB. Lack of patchy horizontal connectivity in primary visual cortex of a mammal without orientation maps. J Neurosci. 2006;26:7680–7692. doi: 10.1523/JNEUROSCI.0108-06.2006. [DOI] [PMC free article] [PubMed] [Google Scholar]
- Zhou Y, Leventhal AG, Thompson KG. Visual deprivation does not affect the orientation and direction sensitivity of relay cells in the lateral geniculate nucleus of the cat. J Neurosci. 1995;15:689–698. doi: 10.1523/JNEUROSCI.15-01-00689.1995. [DOI] [PMC free article] [PubMed] [Google Scholar]


