

Abstract
One of the most remarkable properties of the visual system is the ability to identify and categorize a wide variety of objects effortlessly. However, the underlying neural mechanisms remain elusive. Specifically, the question of how individual object information is represented and intrinsically organized is still poorly understood. To address this question, we presented images of isolated real-world objects spanning a wide range of categories to awake monkeys using a rapid event-related functional magnetic resonance imaging (fMRI) design and analyzed the responses of multiple areas involved in object processing. We found that the multivoxel response patterns to individual exemplars in the inferior temporal (IT) cortex, especially area TE, encoded the animate-inanimate categorical division, with a subordinate cluster of faces within the animate category. In contrast, the individual exemplar representations in V4, the amygdala, and prefrontal cortex showed either no categorical structure, or a categorical structure different from that in IT cortex. Moreover, in the IT face-selective regions (“face patches”), especially the anterior face patches, (1) the multivoxel response patterns to individual exemplars showed a categorical distinction between faces and nonface objects (i.e., body parts and inanimate objects), and (2) the regionally averaged activations to individual exemplars showed face-selectivity and within-face exemplar-selectivity. Our findings demonstrate that, at both the single-exemplar and the population level, intrinsic object representation and categorization are organized hierarchically as one moves anteriorly along the ventral pathway, reflecting both modular and distributed processing.
Introduction
The ability to identify and categorize a wide variety of objects effortlessly is one of the most remarkable properties of the visual system. The neural mechanisms underlying this ability have been the focus of many studies (for review, see Reddy and Kanwisher, 2006; Ungerleider and Bell, 2011). Previous studies, especially neuroimaging ones, have typically investigated brain responses to different predefined categories (e.g., animate and inanimate), without distinguishing responses to individual exemplars. For example, it has been demonstrated that there are several discrete regions (“patches”) in both monkeys and humans responding more strongly to one category relative to others (category-selective regions) (Tsao et al., 2008; Bell et al., 2009). However, by this approach, those studies have left unclear whether the commonly defined categorical structure actually reflects the intrinsic organization of individual exemplar representations in the brain. Moreover, it remains elusive to what extent category-selectivity holds for individual exemplars.
Recently, interest in these questions has increased (Kriegeskorte et al., 2008; Connolly et al., 2012). For example, by presenting images of a wide range of objects in random order (i.e., in an event-related design), Kriegeskorte et al. (2008) found that the functional magnetic resonance imaging (fMRI) response patterns elicited by individual exemplars in human inferior temporal (IT) cortex reflect the conventional animate-inanimate categorical structure. Moreover, they found that category-selectivity holds for individual exemplars in category-selective regions (Mur et al., 2012).
The macaque provides a good model for studying neural mechanisms underlying object processing. However, to our knowledge, few studies have investigated the intrinsic organization and category-selectivity at the single-exemplar level in the monkey visual system (Kiani et al., 2007; Popivanov et al., 2012). Moreover, existing studies sampled only parts of IT cortex (e.g., the anterior portion); therefore, responses to individual exemplars in different subdivisions of IT cortex and in other low-level/high-level object processing areas remain unclear. Furthermore, because of the differences in approaches (sampled brain regions and stimulus sets) and techniques (single-unit recording vs fMRI), it is difficult to directly compare the data in monkeys with those obtained in humans.
Here, we sought to fill this gap by applying the same approach used previously in humans (Kriegeskorte et al., 2008) to awake monkeys. Our objective was to answer the following questions: (1) Do the multivoxel fMRI response patterns to individual exemplars in monkey IT cortex show a categorical structure similar to comparable measurements in human fMRI and monkey electrophysiological studies? (2) Do these patterns reveal a hierarchical organization in IT cortex (anterior vs posterior, within vs outside category-selective regions)? (3) Do response patterns in the input region (V4) and two output regions of IT cortex, namely, the amygdala (AMG) and prefrontal cortex (PFC), show a categorical structure? (4) To what extent does category-selectivity hold for individual exemplars in IT category-selective regions?
To answer these questions, three monkeys were presented with 96 images of isolated real-world objects while they performed a fixation task in a rapid event-related fMRI experiment. Object representations were analyzed at the single-exemplar level.
Materials and Methods
Subjects and general procedures
Three male macaque monkeys (Monkeys I, J, and P; Macaca mulatta, 6 years, 6.5–7.5 kg) were used. All procedures followed the Institute of Laboratory Animal Research (part of the National Research Council of the National Academy of Sciences) guidelines and were approved by the National Institute of Mental Health (NIMH) Animal Care and Use Committee. Each monkey was surgically implanted with an MR-compatible headpost in sterile conditions under isoflurane anesthesia. After recovery, subjects were trained to sit in a sphinx position in a plastic restraint chair (Applied Prototype) and to fixate a central target for long durations with their heads fixed, facing a screen on which visual stimuli were presented (Hadj-Bouziane et al., 2008; Bell et al., 2009).
Brain activity measurements
Before each scanning session, an exogenous contrast agent [monocrystalline iron oxide nanocolloid (MION)] was injected into the femoral or external saphenous vein (8–10 mg/kg) to increase the contrast/noise ratio and to optimize the localization of fMRI signals (Vanduffel et al., 2001; Leite et al., 2002). Imaging data were collected in a 3T GE scanner with a surface coil array (8 elements). Twenty-seven 1.5 mm coronal slices (no gap) were acquired using single-shot interleaved gradient-recalled Echo Planar Imaging (EPI) with a sensitivity-encoding sequence (SENSE, acceleration factor: 2) (Pruessmann, 2004). Imaging parameters were as follows: voxel size: 1.5 × 1.5625 × 1.5625 mm3, field of view (FOV): 100 × 100 mm, matrix size: 64 × 64, echo time (TE): 17.9 ms, repetition time (TR): 2 s, flip angle: 90°. A low-resolution anatomical scan was also acquired in the same session to serve as an anatomical reference (fast spoiled gradient recalled [FSPGR] sequence, voxel size: 1.5 × 0.390625 × 0.390625 mm3, FOV: 100 × 100 mm, matrix size: 256 × 256, TE: 2.932 ms, TR: 6.24 ms, flip angle: 12°). To facilitate cortical surface alignments, we acquired high-resolution T1-weighted whole-brain anatomical scans in a 4.7T Bruker scanner with a modified driven equilibrium Fourier transform (MDEFT) sequence. Imaging parameters were as follows: voxel size: 0.5 × 0.5 × 0.5 mm3, TE: 4.9 ms, TR: 13.6 ms, flip angle: 14°.
Experimental design and task
We presented 96 images to each monkey in a rapid event-related fMRI experiment using Presentation software (version 12.2, www.neurobs.com). The images included 48 animate objects (faces and body parts of humans and nonhuman animals) and 48 inanimate objects (natural and artificial inanimate objects), as described previously (Kriegeskorte et al., 2008). Stimuli spanned a visual angle of 7° (maximal horizontal and/or vertical extent) and were presented foveally for 300 ms on a constantly visible uniform gray background with a fixation cross (0.2°) superimposed on each image. Each stimulus was presented once in every two runs, during which there were a total of 32 randomly interspersed null trials with no stimulus presented. Individual scanning runs began and ended with four null trials. The trial-onset asynchrony was 4 s. The stimulus-onset asynchrony was either 4 s, or a multiple of that duration when null trials occurred in the sequence. Each run lasted 4 min and 48 s. The trials (including stimulus presentations and interspersed null trials) occurred in random order (random without replacement, no sequence optimization). Different random sequences were used in each run. The three monkeys were scanned in three to four separate sessions each, resulting in a total of 64–76 runs (32–38 stimulus repetitions) per monkey.
To locate the regions of interest (ROIs), we also performed an independent functional localizer experiment in all three animals, using the same fMRI parameters as in the main experiment, but with a separate set of stimuli. In the localizer experiment, the stimuli were presented in a block design. Grayscale photos of neutral monkey faces, familiar places, and familiar objects were presented in categorical blocks. Each block lasted 40 s, during which each of 20 images was presented for 2 s, alternating with 20 s fixation blocks (neutral gray background). Individual runs began and ended with a fixation block. Each categorical block was presented once in each run. The three monkeys were scanned in two localizer sessions each, resulting in a total of 36–47 runs per monkey. The localizer experiment was conducted before the event-related experiment, with at least 2 weeks intervening. Thus, it is unlikely that the localizer experiment had any impact on the event-related experiment.
In both the event-related and localizer experiments, the monkeys were required to maintain fixation on a cross (event-related experiment) or a square (localizer experiment) superimposed on the stimuli to receive a liquid reward. In the reward schedule, the frequency of reward increased as the duration of fixation increased (Hadj-Bouziane et al., 2008; Bell et al., 2009). Eye position was monitored with an infrared pupil tracking system (ISCAN).
Data analysis
FMRI data preprocessing
Functional data were preprocessed using AFNI (Analysis of Functional NeuroImages) software (Cox, 1996). All runs were concatenated across all sessions. Images were realigned to the first volume of the first session. The data were smoothed with a 2 mm full-width half-maximum Gaussian kernel. Signal intensity was normalized to the mean signal value within each run. For each voxel, we performed a single univariate linear model fit to estimate the response amplitude to each of the 96 stimuli. The model included a hemodynamic response predictor for each of the 96 stimuli and regressors of no interest [baseline, movement parameters from realignment corrections, and signal drifts (linear as well as quadratic)]. A general linear model and a MION kernel were used to model the hemodynamic response function (Leite et al., 2002).
Definition of ROIs
All ROIs were defined based on the localizer data. For each monkey, the set of visual-object responsive voxels was defined as the voxels that were significantly more active during stimulus blocks than during fixation for at least one category (p < 10-3 uncorrected) (Kriegeskorte et al., 2008) and were restricted to the anatomically defined areas of the posterior portion (area TEO) and the anterior portion (area TE) of IT cortex, V4, the AMG, and PFC (Fig. 1a,c). Here, we defined TEO as extending from just anterior to the inferior occipital sulcus (IOS) rostrally for 1 cm, dorsally to include the fundus and ventral bank of the superior temporal sulcus (STS), and ventromedially to include the lateral bank of the occipitotemporal sulcus (OTS). TE was defined as adjacent and rostral to TEO, extending to the tip of the temporal pole, dorsally to include the fundus and ventral bank of the STS, and ventromedially to include the lateral bank of the OTS. V4 was defined as described previously (Gattass et al., 1988), posterior to TEO, between the lunate sulcus and the STS on the prelunate gyrus, and extending ventrally anterior to the IOS. The extent of the AMG was determined from high-resolution structural MRIs. PFC was defined as the region extending rostrally from the fundus of the arcuate sulcus to include the lateral, medial, and orbital cortex.
Figure 1.

ROIs defined using an independent localizer experiment. Visual-object responsive voxels (a, green/yellow), face-selective voxels (b, red/purple), and object-selective voxels (b, blue/cyan) are shown on lateral view of the left hemisphere of inflated cortex of monkey P. Visual-object responsive voxels: defined as the voxels that were significantly more active during stimulus blocks than during fixation. The borders of anatomically defined areas V4, TEO, TE, and PFC are indicated by the dashed lines. The posterior and anterior borders of the coverage area are indicated by the black solid line. Face-selective regions: defined as regions showing greater activation for faces relative to inanimate objects. Object-selective regions: defined as regions showing greater activation for inanimate objects relative to faces. c shows visual-object responsive voxels within the AMG. The location of the shown slice is marked by the orange line in a. The color bars show the statistical value of the contrast between stimulus and fixation (visual-object responsive)/between faces and inanimate objects (face-selective/object-selective). d, The major selected voxels in each ROI are circled using the same color code as in other panels. as, arcuate sulcus; ios, inferior occipital sulcus; ls, lateral sulcus; lus, lunate sulcus; pmts, posterior middle temporal sulcus; sts, superior temporal sulcus.
We identified face-selective regions using the classic contrast of neutral faces versus inanimate objects (p < 10−3 uncorrected). Consistent with previous studies (Tsao et al., 2003; Bell et al., 2009), this yielded two main face patches in IT cortex in each hemisphere, in all three subjects: one posteriorly near area TEO (posterior face patches, AP ≈ +6 mm) and another anteriorly in area TE (anterior face patches, AP ≈ +18 mm) (Fig. 1b). These face patches corresponded to the previously described anterior and middle face patches (Tsao et al., 2006, 2008). Within each face patch, the peak voxel was first identified. Then, all face-selective voxels within a radius of 3.2 mm of the peak voxel were combined to yield a spherical mask. Object-selective regions were defined analogously by using the contrast of inanimate objects versus neutral faces (p < 10−3 uncorrected). Consistent with previous studies (Bell et al., 2009), object-selective regions were found throughout the STS and the IT gyrus. To serve as controls, we chose two object-selective regions close to the face patches: the posterior (AP ≈ +9 mm) and anterior object-selective regions (AP ≈ +17.5 mm).
Multivoxel pattern analysis
As noted previously (Spiridon and Kanwisher, 2002), response patterns elicited by exemplars may depend on the number of voxels in the sampled area. To address that concern, we ran our analysis procedure using different numbers of voxels (40–600 voxels for TEO, TE, and PFC; 40–140 voxels for the AMG). For simplicity, we used the same number of voxels for all three subjects. We found that the results in TEO, TE, and PFC became more significant when more voxels were selected, and saturated when the 80 most visual-object responsive voxels were selected. The results from the AMG did not change with an increasing number of voxels. Moreover, the results based on bilateral samples were similar to those when the sampled areas were restricted to either hemisphere based on an equivalent number of voxels (data not shown). Thus, the analyses shown in Results were based on the 80 voxels (40 voxels per hemisphere) most activated by visual stimuli. For V4, due to the limitation of the FOV, we could locate 40 visual-object responsive voxels from both hemispheres for one of the three monkeys (Monkey P), but could locate 40 visual-object responsive voxels in only the left hemisphere of V4 for the other two monkeys. Thus, we did the analyses for V4 based on: (1) 80 voxels (40 voxels per hemisphere) in Monkey P, and (2) 40 voxels in the left hemisphere averaged across the three monkeys. As a control, the same analyses were performed in other areas (e.g., TEO and TE). The results based on these two methods were similar. The analyses shown in Results were based on the 40 most visual-object responsive voxels in the left V4 averaged across the three subjects.
The number of voxels within category-selective regions varied across regions and subjects. To control for the variation introduced by the number of selected voxels, we chose 30 voxels (15 voxels per hemisphere), which was the maximum number we could locate in all the category-selective regions of the three subjects.
Our multivoxel pattern analysis (MVPA) procedure closely resembled the procedure used previously in human fMRI (Kriegeskorte et al., 2008). Multidimensional scaling (MDS) was used to visualize the distribution of stimuli based on the representational dissimilarity, which we defined as 1 minus the Pearson's r correlation coefficient across selected voxels within a ROI (0 for perfect correlation, 1 for no correlation, 2 for perfect anticorrelation). For each stimulus, the t value was used for the Pearson's r correlation analysis (Misaki et al., 2010).
To quantify the categorical representations in ROIs, we analyzed the category cluster effect (CCE), defined as the difference (in percentile points) between the mean dissimilarity for within-category pairs (e.g., two animate exemplars or two inanimate exemplars) relative to the mean dissimilarity for between-category pairs (e.g., one animate exemplar and one inanimate exemplar) (Eq. 1). A cluster is indicated only for those categories that have a significantly smaller mean dissimilarity for within-category pairs compared with the mean dissimilarity for between-category pairs. That is, such a category can be reflected by the intrinsic representation patterns of individual exemplars. The CCE is analyzed between a given pair of categories. If one of the two categories is changed, the CCE for both categories may also change.
 |
where n is the number of exemplars belonging to category A, m is the number of exemplars belonging to category B, and Dij is the dissimilarity between response patterns elicited by exemplar i and exemplar j.
Although a higher dissimilarity for within-category pairs may indicate a poor capacity of category detection (“categorization”), it may also indicate an enhanced capacity to distinguish exemplars within this category, provided the dissimilarity is not simply caused by noise. To evaluate the variability (noise level) of the multivoxel fMRI response patterns to individual exemplars, we divided the data from each subject into odd and even runs, and computed the mean dissimilarity between response patterns elicited by the same exemplars from odd and even runs, which we call the variability of the exemplar representation pattern (VERP). If VERP for one category in a given area is high, then the dissimilarity for within-category pairs may be high only due to the fact that the variability of the multivoxel fMRI response patterns to exemplars is large. Thus, only if VERPs are approximately equivalent across regions (or categories), a weaker cluster (i.e., a higher dissimilarity for within-category pairs) in one region (or category) than another may suggest a greater capacity to distinguish exemplars within this category. To access the capacity of exemplar discrimination within a given category, we computed the difference between the mean dissimilarity among response patterns elicited by different exemplars, relative to the mean dissimilarity between response patterns elicited by the same exemplars from odd and even runs, which we call the exemplar discrimination index (EDI) (Eq. 2). If the EDI for one category in a given area is significantly larger than zero, then that area can distinguish exemplars within this category (Haxby et al., 2001).
 |
where n is the number of exemplars belonging to category A, Diodd jeven is the dissimilarity between response patterns elicited by exemplar i from odd runs and exemplar j from even runs, and Diodd ieven is the dissimilarity between response patterns elicited by exemplar i from odd runs and even runs.
The statistical methods were as described previously (Kriegeskorte et al., 2008). Briefly, the randomization test and bootstrap test were used, reflecting nonindependent measurements for the response dissimilarity. In the randomization test, the stimulus labels were randomly permuted and the null hypothesis that the condition labels are interchangeable was tested. In the bootstrap test, the p values were calculated by a bootstrap resampling of the stimulus set, which simulates the distributions of mean dissimilarities if the experiment were to be repeated with different stimuli from the same categories and with the same subjects.
Regionally averaged activations analyses
We also investigated the regionally averaged fMRI activation evoked by individual exemplars (single-exemplar activations) in IT category-selective regions. The analysis of single-exemplar activations was described in detail previously (Mur et al., 2012). The analyses were based on the same set of voxels as in the MVPA. The same analyses were also conducted in V4, IT cortex, the AMG, and PFC, excluding face-selective and object-selective voxels. In V4, we could locate 15 visual-object responsive voxels from both hemispheres for two of the three monkeys. Thus, we did the analyses for V4 based on 30 voxels (15 voxels per hemisphere) averaged across the two monkeys. As a control, the same analyses were performed in other areas (e.g., face-selective regions, TEO and TE), which found similar results as those based on 30 voxels averaged across the three subjects (data not shown).
Receiver-operating characteristic curves.
To quantify the capacity to distinguish two categories (e.g., faces and nonface objects), receiver-operating characteristic (ROC) curves were computed based on ROIs. An area under the ROC curve (AUC) of 1.0 indicates that the response distributions for the two tested categories are completely dissociable. A value of 0.5 (diagonal line) indicates that the two categories are overlapping, that is, the capacity to assign a given response to the correct category is at chance (50%). To determine whether the distinguishing capacity was significantly above chance, we used a one-tailed randomization test on the AUCs. For group analysis, single-exemplar activations were either averaged or concatenated across subjects. The former method is sensitive to the distinguishing capacity that is consistent across subjects, while the latter method is sensitive to the subject-unique distinguishing capacity.
Replicability of within-category single-exemplar activation.
Did any preferred exemplar activate category-selective regions more strongly than other preferred exemplars? To address this question, we computed a Spearman's rank correlation coefficient (Spearman's r) between the single-exemplar activations for one category (e.g., faces) in odd and even runs. A one-tailed test was performed to determine whether Spearman's r was significantly greater than zero. For group analysis, the single-exemplar activations for one category were either averaged or concatenated across subjects. The averaging approach is sensitive to replicable within-category ranking that is consistent across subjects. The concatenation approach is sensitive to replicable within-category ranking across odd and even runs, even if ranking order differs across subjects.
Results
Multivoxel response patterns to individual exemplars
IT Cortex
TEO versus TE.
We first mapped the population responses to individual exemplars in IT cortex, using a set of 96 images of objects that have been studied in monkey single-unit and human fMRI studies (Kiani et al., 2007; Kriegeskorte et al., 2008). FMRI activity was sampled from the 80 voxels (40 voxels per hemisphere) (see Materials and Methods) that showed the greatest visual-object responses, separately within areas TEO and TE, in each of the three monkeys. The response dissimilarity (defined as 1 minus the Pearson linear correlation between the associated patterns across selected voxels) was measured for each pair of exemplars in each monkey, and then averaged across the three subjects. The exemplars were arranged using the MDS (see Materials and Methods), such that their pairwise distances reflected their response dissimilarities. Exemplars that elicited similar response patterns are displayed closer together, whereas exemplars that elicited dissimilar response patterns are displayed farther apart. Figure 2, a and d, show the unsupervised arrangements of the tested exemplars and Figure 2, b and e, illustrate these arrangements using icons denoting the conventional experimental categories (animate: faces and body parts; inanimate: natural and artificial objects) for areas TEO and TE, respectively.
Figure 2.
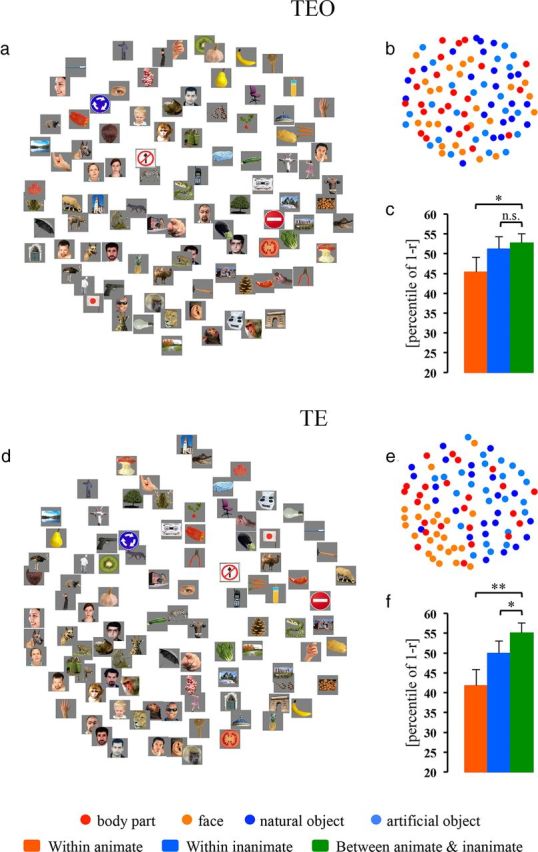
MDS arrangements and cluster effects (animate and inanimate) in areas TEO and TE. MDS results in TEO and TE are shown as arrangements of the experimental exemplars (a and d) or icons denoting the experimental conditions (b and e). The experimental exemplars/icons have been arranged such that their pairwise distances approximately reflect their response-pattern dissimilarities (multidimensional scaling, dissimilarity: 1 − Pearson r, criterion: metric stress). In each arrangement, exemplars/icons placed close together elicit similar response patterns, whereas exemplars/icons placed far apart elicit dissimilar response patterns. The arrangement is unsupervised and does not presuppose any categorical structure. The bar graphs next to the MDS arrangements show the animate and inanimate cluster effects in TEO (c) and TE (f): the mean dissimilarities (percentile of 1 − Pearson r) for within-animate pairs (red bar), within-inanimate pairs (blue bar), and between-animate-and-inanimate pairs (green bar). Error bars indicate the SD of the mean dissimilarity estimated by bootstrap resampling of the stimulus set. We defined the CCE as the difference (in percentile points) between the mean dissimilarity for within-category pairs (e.g., two animate exemplars or two inanimate exemplars) relative to the mean dissimilarity for between-category pairs (e.g., one animate exemplar and one inanimate exemplar). The significance of the CCEs is given above the bars in each panel (*p < 0.05, **p < 0.01; n.s., not significant). The p value is from a bootstrap test.
Several results are apparent by simple visual inspection. In TEO and more so in TE, a majority of the animate exemplars (warm color dots) are on the left, while a majority of the inanimate exemplars (cool color dots) are on the right. This global grouping indicates the categorical distinction between the representations of animate and inanimate objects in both subdivisions of IT cortex. This animate–inanimate categorical distinction is evident, despite the fact that neighboring exemplars often differed markedly in both shape and color.
To quantify the categorical representations in TEO and TE, we analyzed the CCE (see Materials and Methods). In TEO (Fig. 2c), the mean dissimilarity for within-animate pairs, but not that for within-inanimate pairs, was smaller than that for between-animate-and-inanimate pairs (animate: CCE = 7.38%, p = 0.013; inanimate: CCE = 1.52%, p = 0.294). By contrast, in TE (Fig. 2f), both the mean dissimilarity for within-animate pairs and that for within-inanimate pairs were smaller than that for between-animate-and-inanimate pairs (animate: CCE = 13.29%, p = 0.002; inanimate: CCE = 5.14%, p = 0.037). These results indicate that the response patterns for the tested exemplars formed an animate cluster in TEO but both animate and inanimate clusters in TE.
In MDS arrangements in IT cortex, we noticed some differences between TEO and TE in how subordinate categories clustered together. To better characterize this impression, we first analyzed the face and body part cluster effects within animate objects in these areas (Fig. 3a). In TEO, neither the face nor the body part cluster effect was present. By contrast, in TE, the mean dissimilarity for within-face pairs, but not that for within-body pairs, was significantly smaller than that for between-face-and-body pairs (face: CCE = 18.28%, p = 0.006; body part: CCE =−2.96%, p = 0.758). These findings indicate that response patterns for the tested exemplars formed a face cluster within the animate cluster in TE but not in TEO. Next, we further investigated the potential subclusters within faces: human faces, monkey/ape faces, and nonprimate faces. We found that the mean dissimilarity for within-monkey/ape-face pairs was significantly smaller than that for between-monkey/ape-face-and-nonprimate-face pairs in TE (CCE = 23.25%, p = 0.017) but not in TEO (CCE = 16.29%, p = 0.092). This finding suggests that, in TE, different monkey/ape faces elicited similar response patterns, which were distinct from those elicited by nonprimate faces. We did not find either a human face cluster or a nonprimate face cluster.
Figure 3.

Subcategorical structure within animate and inanimate categories in TEO, TE, and PFC. a, The bar graphs show the mean dissimilarities (percentile of 1 − Pearson r) for within-face pairs (white bar), within-body pairs (gray bar), and between-face-and-body pairs (dark bar). b, The bar graphs show the mean dissimilarities for within-natural pairs (white bar), for within-artificial pairs (gray bar), and for between-natural-and-artificial pairs (dark bar). Error bars indicate the SD of the mean dissimilarity estimated by bootstrap resampling of the stimulus set. The significance of the CCEs is given above the bars in each panel (**p < 0.01; n.s., not significant). The p value is from a bootstrap test.
Regarding inanimate objects, neither TEO nor TE showed evidence of subclusters (natural objects and artificial objects) in MDS arrangements (Fig. 3b).
Category-selective regions versus noncategory-selective regions in IT cortex.
Within IT cortex, several discrete category-selective regions have been located using fMRI in both monkeys and humans (Tsao et al., 2003; Bell et al., 2009). Consistent with previous studies, we found two main face-selective regions and chose two object-selective regions bilaterally within IT cortex in the localizer experiment. Could these category-selective regions represent the preferred versus nonpreferred categorical structure? If so, were there any differences between the categorical structures within and outside category-selective regions?
First, we analyzed the CCEs for faces and two nonface categories (body parts and inanimate objects) within the IT face patches (Figs. 4, 5). In the posterior face patches, both the mean dissimilarity for within-face pairs and that for within-body pairs were smaller than that for between-face-and-inanimate pairs (CCE = 15.88%, p = 0.002; Fig. 4b) and that for between-body-and-inanimate pairs (CCE = 8.07%, p = 0.025; Fig. 4c), respectively. In the anterior face patches, the mean dissimilarity for within-face pairs was smaller than that for between-face-and-inanimate pairs (CCE = 25.20%, p < 0.001; Fig. 5b), whereas the mean dissimilarity for within-body pairs was not significantly smaller than that for between-body-and-inanimate pairs (CCE = 6.03%, p = 0.073; Fig. 5c). These results suggest that in the IT face patches, different faces (and body parts in the posterior face patches) elicited similar response patterns, which were distinct from those elicited by inanimate objects. The mean dissimilarity for within-inanimate pairs was not smaller than either that for between-face-and-inanimate pairs or that for between-body-and-inanimate pairs (Figs. 4b,c, 5b,c), indicating that different inanimate objects did not elicit similar response patterns in the IT face patches. Moreover, in the anterior face patches, but not in the posterior face patches, we found that the mean dissimilarity for within-face pairs, but not that for within-body pairs, was smaller than that for between-face-and-body-pairs (face: CCE = 16.21%, p < 0.001; body part: CCE = −12.24%, p = 1.000; Fig. 5a), suggesting that response patterns elicited by different faces were distinct from those elicited by body parts in the anterior face patches. Together, these results suggest that the IT face patches mainly represented the preferred (face) versus nonpreferred (nonface) categorical structure. In addition, the anterior face patches represented this categorical structure better than the posterior face patches (faces vs inanimate objects: p = 0.029; face vs body parts: p = 0.028). When we examined the potential subclusters within faces (i.e., human faces, monkey/ape faces, and nonprimate faces), we found that the mean dissimilarity for within-monkey/ape-face pairs was smaller than that for between-monkey/ape-face-and-nonprimate face pairs in the anterior face patches (CCE = 16.05%, p = 0.039) but not in the posterior face patches (CCE =−4.07%, p = 0.652). We did not find either a human face cluster or a nonprimate face cluster in the IT face patches.
Figure 4.
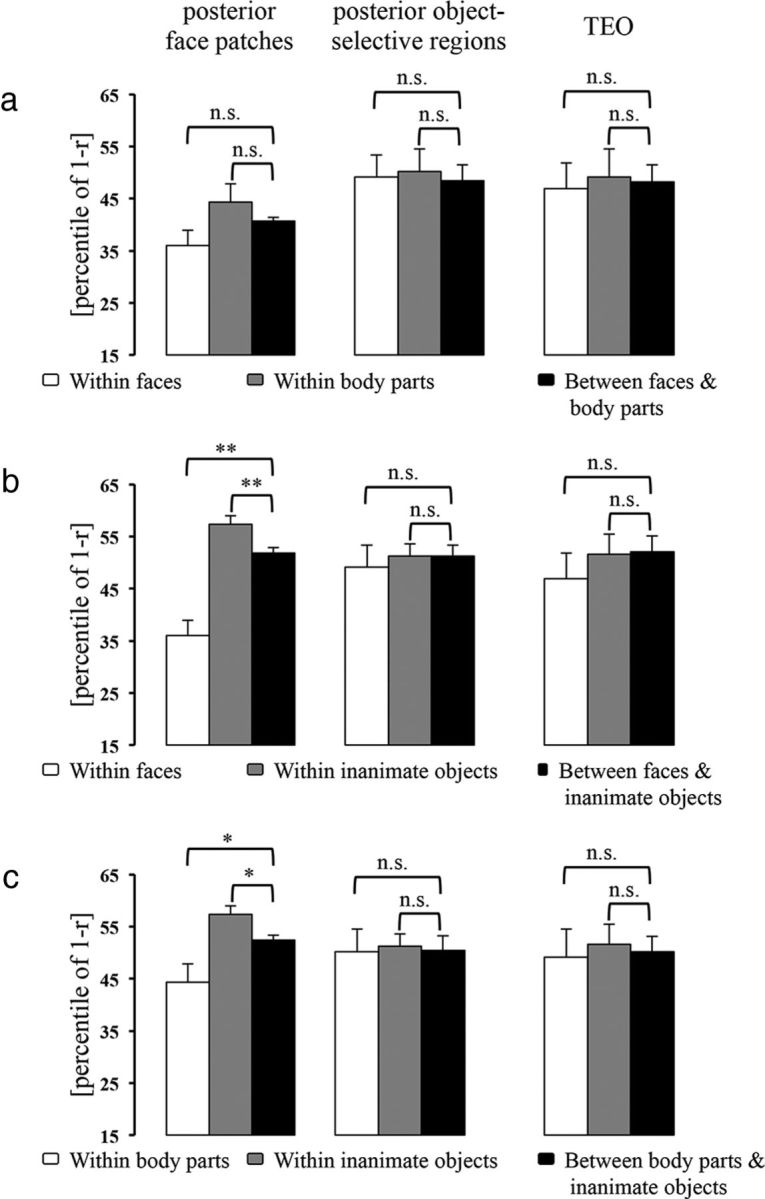
The CCEs in the posterior face-selective regions, posterior object-selective regions and TEO (excluding face-selective and object-selective voxels). The bar graphs show the category clusters when comparing the representations of faces versus body parts (a), faces versus inanimate objects (b), and body parts versus inanimate objects (c). Error bars indicate the SD of the mean dissimilarity estimated by bootstrap resampling of the stimulus set. The significance of the CCEs is given above the bars in each panel (*p < 0.05, **p < 0.01; n.s., not significant). The p value is from a bootstrap test.
Figure 5.
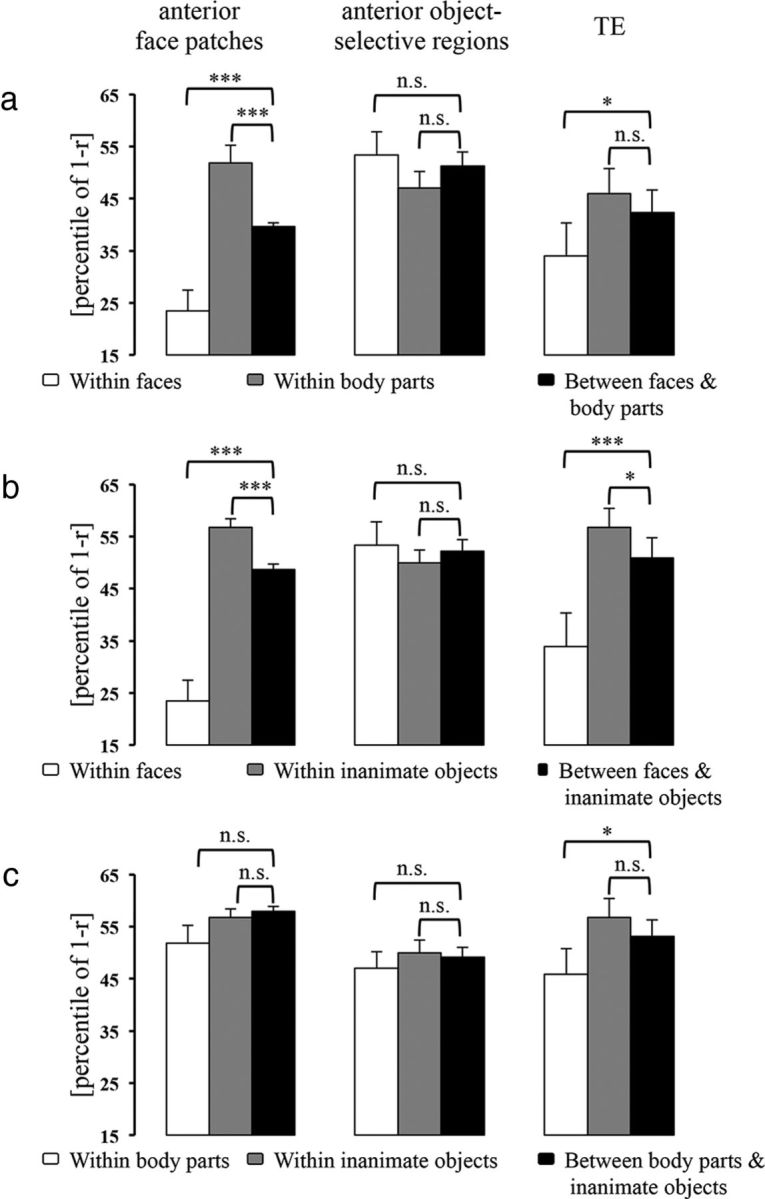
The CCEs in the anterior face-selective regions, anterior object-selective regions and TE (excluding face-selective and object-selective voxels). The bar graphs show the category clusters when comparing the representations of faces versus body parts (a), faces versus inanimate objects (b), and body parts versus inanimate objects (c). Error bars indicate the SD of the mean dissimilarity estimated by bootstrap resampling of the stimulus set. The significance of the CCEs is given above the bars in each panel (*p < 0.05, ***p < 0.001; n.s., not significant). The p value is from a bootstrap test.
Next, we performed the same analyses in object-selective regions. We did not find any clusters or subclusters within either animate (Figs. 4, 5) or inanimate objects.
Finally, we analyzed the CCEs in IT cortex excluding face-selective and object-selective voxels (Figs. 4, 5). To control for the variation introduced by the number of selected voxels, we performed analyses using the 30 most visual-object responsive voxels in either TEO or TE. The results showed that in TE but not TEO: (1) both the mean dissimilarity for within-face pairs and that for within-body pairs were smaller than that for between-face-and-inanimate pairs (CCE = 17.00%, p < 0.001; Fig. 5b) and that for between-body-and-inanimate pairs (CCE = 7.22%, p = 0.048; Fig. 5c), respectively; and (2) the mean dissimilarity for within-face pairs, but not that for within-body pairs, was smaller than that for between-face-and-body-pairs (CCE = 8.40%, p = 0.033; Fig. 5a). These findings suggest that the selected TE voxels, like the IT face patches, represented the face versus nonface categorical structure. However, further analyses revealed that the face cluster in TE was not as distinct as that in the anterior face patches, which are located in TE (faces vs inanimate objects: p = 0.035; face vs body parts: p = 0.047). Moreover, we also found that the mean dissimilarity for within-monkey/ape-face pairs was smaller than that for between-monkey/ape-face-and-nonprimate face pairs (CCE = 18.53%, p = 0.050) in TE, which was not significantly different from the results in the anterior face patches. We did not find either a human face cluster or a nonprimate face cluster in IT cortex excluding face-selective and object-selective voxels.
The above results indicate that response patterns to individual exemplars in IT nonface-selective regions did not form a face cluster as well as those in the IT face patches. That is, response patterns elicited by individual faces in nonface-selective regions were more different from each other than those in face-selective regions. Does this result reflect an enhanced capacity to distinguish individual faces or simply a higher noise level in nonface-selective regions relative to the face patches? To address this question, we compared noise levels across these areas by calculating the VERP (see Materials and Methods). A lower VERP indicates a lower variability of the multivoxel fMRI response patterns to the same exemplar. We found that the VERPs for faces in the regions that formed a face cluster (posterior face patches: VERP = 0.873; anterior face patches: VERP = 0.798; TE: VERP = 0.763) were somewhat smaller than those in the regions that did not form a face cluster. For example, the VERP for faces in the anterior face patches, which presented the best face versus nonface categorical structure, was significantly smaller than those in the anterior object-selective regions (VERP = 1.011, p < 0.001), the posterior object-selective regions (VERP = 0.921, p < 0.001), and TEO (VERP = 0.933, p < 0.001), suggesting that the variability of response patterns to the same faces in the regions that did not represent a face versus nonface categorical structure was greater than that in the anterior face patches. Thus, the higher dissimilarity across response patterns to different faces in the regions that did not form a face cluster likely reflected a higher noise level rather than an enhanced capacity to distinguish individual faces. Next, we asked whether the regions that formed a face cluster might also distinguish individual faces. We computed the EDI (see Materials and Methods) in the face patches and TE. If the EDI for one category in a given area is significantly above zero, then that area can distinguish exemplars within this category. We did not find any significant positive EDI for faces in the regions that formed a face cluster (posterior face patches: EDI = 0.002, p = 0.488; anterior face patches: EDI = 0.004, p = 0.420; TE: EDI = 0.017, p = 0.120). These results indicate that individual faces cannot be discriminated by fMRI response patterns in the regions that represent the face versus nonface categorical structure. Unsurprisingly, we also did not find significant positive EDIs for faces in the regions that did not form a face cluster (posterior object-selective regions: EDI = 0.030, p = 0.088; anterior object-selective regions: EDI = −0.050, p = 0.974; TEO: EDI = −0.034, p = 0.945).
V4, the AMG, and PFC
To clarify whether input and output regions of IT cortex could also represent information about object categories, we computed MDS arrangements in V4, the AMG, and PFC (Figs. 6a, 7a,d, respectively). Visual inspection of MDS arrangements in these regions suggested no obvious categorical representations: animate exemplars (warm color dots) and inanimate exemplars (cool color dots) appeared to be randomly intermixed (especially in V4 and the AMG). Because a previous study indicated that the CCE may detect a subtle categorical structure (Kriegeskorte et al., 2008), we further performed the CCE analysis in these areas.
Figure 6.

MDS arrangement and cluster effects (animate and inanimate) in V4. The MDS result for V4 is shown as an arrangement of the experimental exemplars (a) or icons denoting the experimental conditions (b). The bar graph next to the MDS arrangement shows the animate and inanimate cluster effects in V4 (c). The significance of the CCEs is given above the bars (n.s., not significant). The p value is from a bootstrap test. For all other notations, see Figure 2.
Figure 7.
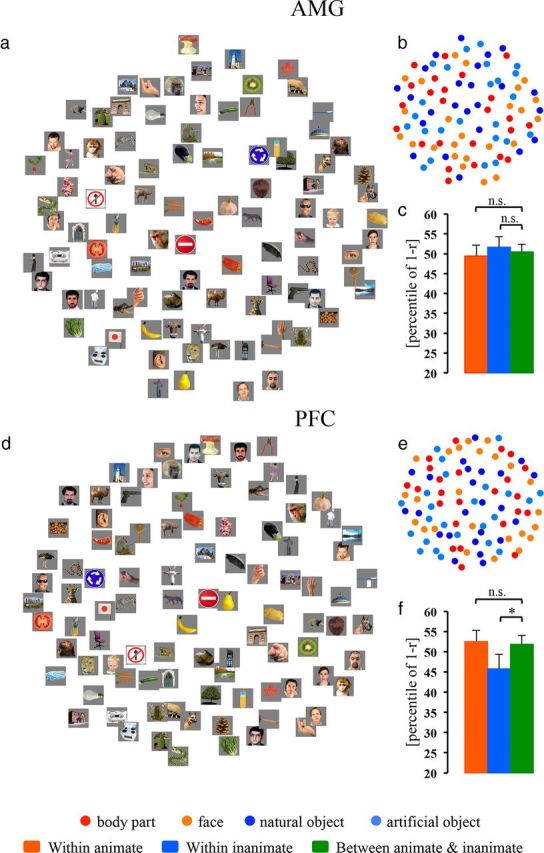
MDS arrangements and cluster effects (animate and inanimate) in the AMG and PFC. The MDS results for the AMG and PFC are shown as arrangements of the experimental exemplars (a and d, respectively) or icons denoting the experimental conditions (b and e, respectively). The bar graphs next to MDS arrangements show the animate and inanimate cluster effects in the AMG and PFC (c and f, respectively). The significance of the CCEs is given above the bars in each panel (*p < 0.05; n.s., not significant). The p value is from a bootstrap test. For all other notations, see Figure 2.
The statistical tests in V4 were based on the 40 most visual-object responsive voxels in the left hemisphere (see Materials and Methods). Neither the animate nor the inanimate cluster effect was present in V4 (animate: CCE =−0.57%, p = 0.573; inanimate: CCE = 2.00%, p = 0.240; Fig. 6c). By contrast, response patterns based on the same number of voxels in the left IT cortex could still form an animate cluster (TEO: CCE = 4.47%, p = 0.042; TE: CCE = 11.74%, p < 0.001).
The statistical tests confirmed that neither animate nor inanimate cluster effects were present in the AMG (Fig. 7c). In PFC (Fig. 7f), interestingly, the mean dissimilarity for within-inanimate pairs, but not that for within-animate pairs, was smaller than that for between-animate-and-inanimate pairs (inanimate: CCE = 6.07%, p = 0.027; animate: CCE = −0.68%, p = 0.616). That is, the object representations in PFC showed a cluster for inanimate objects, but not for animate objects.
We did not find that response patterns for the tested animate objects formed a face or a body part cluster in V4, the AMG, or PFC. Although the object representations showed an inanimate cluster in PFC, there was no evidence of subclusters (i.e., natural objects and artificial objects) within inanimate objects (Fig. 3b).
Regionally averaged activation to individual exemplars
The above MVPA tested the pattern information of individual exemplars. Such results cannot be directly compared with results obtained in classic fMRI studies in category-selectivity, because differences between tested stimuli (individual exemplar versus categories) are confounded with differences between the types of investigated responses [response patterns vs response amplitudes averaged across voxels within contiguous regions (e.g., face patches)]. To fill in this missing link, we measured responses to individual exemplars at the regionally averaged activation level. Here, we asked the following questions, which cannot be accessed by the classic method, in category-selective regions: (1) Can categories be discriminated at the single-exemplar level? (2) Are there differences across the activations to preferred/nonpreferred exemplars (exemplar-selectivity)? To answer these questions, we investigated the regionally averaged fMRI activation evoked by individual exemplars (single-exemplar activations) in the IT face-selective and object-selective regions. In addition, we compared the results in these category-selective regions with those in V4, IT cortex, the AMG, and PFC, excluding face-selective and object-selective voxels.
Object categorization at the single-image level
First, we examined face-selective regions. We ranked the 96 exemplars by averaging the single-exemplar activations across subjects (Fig. 8a,d). Visual inspection of the ranking results indicated that both the posterior and anterior face patches showed a clear preference for faces: most faces (orange color) are ranked before most nonface objects (body parts: red; inanimate objects: light/dark blue).
Figure 8.
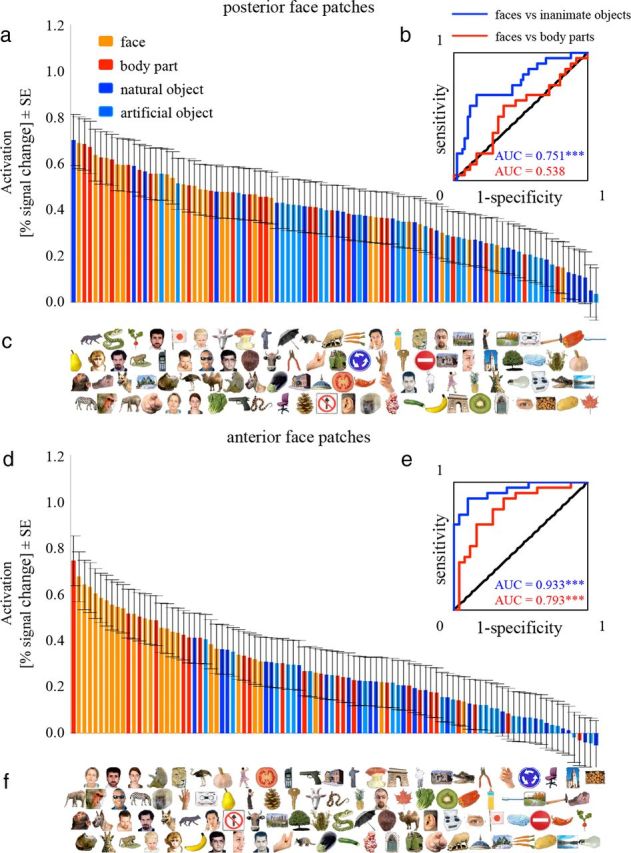
The ranked averaged single-exemplar activations elicited by the 96 exemplars in the IT face patches. a, d, Each bar represents the regionally averaged activation to one of the 96 exemplars in percentage signal change, averaged across subjects in the posterior (a) and the anterior (d) face patches. c, f, Each exemplar is placed exactly below the bar that reflects its activation, so that the exemplars are ordered from left to right. The bars are color-coded for categories to give an overall impression of face-selectivity without having to inspect each individual exemplar. b, e, ROC curves indicate performance for discriminating faces from body parts (red) or from inanimate objects (blue). Inserted values indicate the AUC using the same color code. The AUC of 1 or 0 indicates that the response distributions for the two categories are completely dissociable. A value of 0.5 (diagonal line) indicates that the response distributions for the two categories are overlapping and the capacity to assign a given response to the correct category is at chance (50%). ***p < 0.001. The p value is from a one-tailed randomization test.
To quantify these results, we computed the ROC curve and AUC (see Materials and Methods) (Fig. 8b,e). If the value of AUC is significantly >0.5 (chance level), the capacity to assign a given response to the correct category (categorization) is significantly greater than chance (p < 0.05); that is, most faces are ranked before most nonface objects. If the value of AUC is significantly <0.5, then the capacity to assign a given response to the correct category is significantly greater than chance as well, but based on the opposite response pattern; that is, most faces are ranked after most nonface objects. The two group analysis methods (averaging and concatenation) showed similar results (Table 1). Using the averaging method, which is sensitive to the categorization capacity that is consistent across subjects, single-exemplar activations in both the posterior and anterior face patches showed a significant capacity to distinguish faces from inanimate objects (p < 0.001), with the anterior face patches showing a better categorization capacity than the posterior face patches (p = 0.002). A significant capacity to distinguish faces from body parts was only found in the anterior face patches (p < 0.001), which was also better than that in the posterior face patches (p < 0.001). These results indicate that single-exemplar activations in both the posterior and anterior face patches ranked most faces before most nonface objects, with the anterior face patches categorizing faces from nonface objects (body parts and inanimate objects) better than the posterior face patches. In both face patches, the capacity to distinguish faces from inanimate objects was better than that to distinguish faces from body parts (posterior face patches: p = 0.003; anterior face patches: p = 0.011). Additionally, in both the posterior and anterior face patches, the capacity to distinguish monkey/ape faces from human faces and also from nonprimate faces was significantly above chance (Table 1). There were no significant differences in these two categorization capacities between the posterior and anterior face patches. These findings indicate that single-exemplar activations in the IT face patches could distinguish conspecific faces from heterospecific faces.
Table 1.
Group analysis of the AUC
| Face vs Object | Face vs Body part | Monkey face vs Human face | Monkey face vs Nonprimate face | Objects vs Body parts | |
|---|---|---|---|---|---|
| Posterior face patches | |||||
| Averaging method | 0.751 (<0.001)*** | 0.538 (0.321) | 0.833 (0.016)* | 0.857 (0.024)* | 0.277 (>0.999)*** |
| Concatenation method | 0.673 (<0.001)*** | 0.540 (0.203) | 0.680 (0.020)* | 0.756 (0.006)** | 0.351 (>0.999)*** |
| Anterior face patches | |||||
| Averaging method | 0.933 (<0.001)*** | 0.793 (<0.001)*** | 0.750 (0.052) | 0.857 (0.021)* | 0.286 (0.998)** |
| Concatenation method | 0.838 (<0.001)*** | 0.711 (<0.001)*** | 0.669 (0.031)* | 0.714 (0.015)* | 0.345 (>0.999)*** |
| Posterior object-selective regions | |||||
| Averaging method | 0.368 (0.965)* | 0.387 (0.910) | 0.483 (0.537) | 0.171 (0.970)* | 0.544 (0.271) |
| Concatenation method | 0.396 (0.995)** | 0.434 (0.914) | 0.456 (0.684) | 0.321 (0.961)* | 0.535 (0.201) |
| Anterior object-selective regions | |||||
| Averaging method | 0.254 (>0.999)*** | 0.290 (0.996)** | 0.717 (0.087) | 0.429 (0.649) | 0.570 (0.172) |
| Concatenation method | 0.378 (0.998)** | 0.421 (0.945) | 0.630 (0.076) | 0.410 (0.817) | 0.543 (0.147) |
| TEO | |||||
| Averaging method | 0.586 (0.116) | 0.472 (0.627) | 0.733 (0.076) | 0.743 (0.085) | 0.371 (0.965)* |
| Concatenation method | 0.538 (0.181) | 0.485 (0.627) | 0.639 (0.059) | 0.571 (0.244) | 0.439 (0.930) |
| TE | |||||
| Averaging method | 0.524 (0.373) | 0.594 (0.130) | 0.767 (0.044)* | 0.857 (0.017)* | 0.578 (0.148) |
| Concatenation method | 0.523 (0.292) | 0.568 (0.082) | 0.726 (0.005)** | 0.759 (0.003)** | 0.548 (0.127) |
| AMG | |||||
| Averaging method | 0.536 (0.309) | 0.535 (0.336) | 0.700 (0.107) | 0.800 (0.049)* | 0.488 (0.564) |
| Concatenation method | 0.523 (0.296) | 0.528 (0.280) | 0.574 (0.208) | 0.635 (0.089) | 0.506 (0.440) |
| PFC | |||||
| Averaging method | 0.477 (0.622) | 0.429 (0.800) | 0.700 (0.117) | 0.714 (0.108) | 0.439 (0.800) |
| Concatenation method | 0.457 (0.854) | 0.436 (0.906) | 0.604 (0.121) | 0.651 (0.061) | 0.481 (0.670) |
| V4 | |||||
| Averaging method | 0.548 (0.261) | 0.594 (0.132) | 0.367 (0.798) | 0.629 (0.240) | 0.565 (0.192) |
| Concatenation method | 0.545 (0.186) | 0.563 (0.150) | 0.458 (0.640) | 0.607 (0.194) | 0.526 (0.300) |
The AUC of 1 or 0 indicates that the response distributions for the two categories are completely dissociable. A value of 0.5 (diagonal line) indicates that the response distributions for the two categories are overlapping and the capacity to assign a given response to the correct category is at chance (50%). The group analysis was performed using both the averaging and concatenation method (see Materials and Methods). p values are shown in parentheses: *p < 0.05 or p > 0.95,
**p < 0.01 or p > 0.99,
***p < 0.001 or p > 0.999. The p value is from a one-tailed randomization test.
We then performed the same analyses in object-selective regions (Fig. 9). We found that single-exemplar activations in both the posterior and anterior object-selective regions showed a significant capacity to distinguish inanimate objects from faces but not from body parts, with no significant difference between the posterior and anterior object-selective regions (Table 1).
Figure 9.
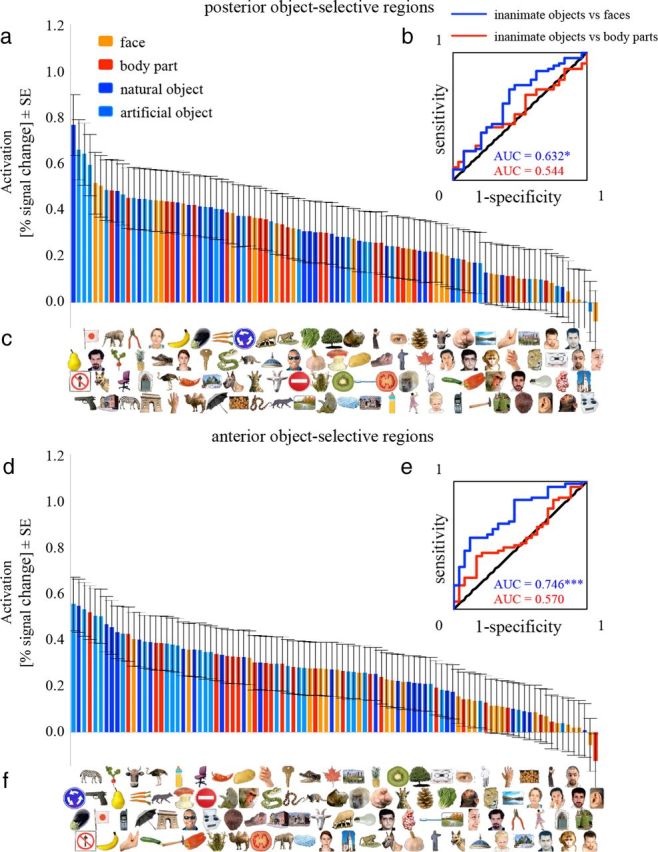
The ranked averaged single-exemplar activations elicited by the 96 exemplars in the IT object-selective regions. a, d, Each bar represents the regionally averaged activation to one of the 96 object exemplars in percentage signal change, averaged across subjects in the posterior (a) and the anterior (d) object-selective regions. c, f, Each exemplar is placed exactly below the bar that reflects its activation. b, e, ROC curves indicate performance for discriminating inanimate objects from faces (blue) or from body parts (red). *p < 0.05, ***p < 0.001. The p value is from a one-tailed randomization test. For all other notations, see Figure 8.
Finally, we examined V4, IT cortex, the AMG, and PFC, excluding face-selective and object-selective voxels. We found that single-exemplar activations in these areas did not show any significant capacity to distinguish among faces, body parts and inanimate objects. However, in TE, as in the face patches, the capacity to distinguish monkey/ape faces from human faces (AUC = 0.767, p = 0.044) and from nonprimate faces (AUC = 0.857, p = 0.017) was significantly above chance; in the AMG, the capacity to distinguish monkey/ape faces from nonprimate faces was significantly above chance (AUC = 0.800, p = 0.049).
Replicability of activation to preferred/nonpreferred objects
Here, we examined the replicability of within-category rankings across odd and even runs (see Materials and Methods). If the exemplars of one category activate a region equally strongly, we would expect that their ranking order would be random and therefore not replicable across odd and even runs. By contrast, if some exemplars of one category consistently activate a region more strongly than other exemplars of the same category, we would expect that their ranking order would replicate across odd and even runs. The two group analysis methods (averaging and concatenation) showed similar results (Table 2): single-exemplar activations in both the posterior and anterior face patches showed replicable rankings for faces, indicating that some specific faces consistently activated face-selective regions more strongly than other faces. However, single-exemplar activations in the posterior face patches, but not in the anterior face patches, also showed replicable rankings of body parts and inanimate objects. By contrast, in the anterior face patches but not in the posterior face patches: (1) the concatenated single-exemplar activations replicated the ranking of nonprimate faces; and (2) the averaged single-exemplar activations replicated the ranking of human faces, suggesting that within-human-face activations were similar across the three subjects.
Table 2.
Group analysis of the replicability of within-category ranking
| Face | Human face | Nonprimate face | Body part | Inanimate object | |
|---|---|---|---|---|---|
| Posterior face patches | |||||
| Averaging method | 0.343 (0.051) | 0.273 (0.196) | 0.464 (0.151) | 0.370 (0.038)* | 0.390 (0.003)** |
| Concatenation method | 0.208 (0.040)* | 0.211 (0.108) | 0.300 (0.093) | 0.211 (0.038)* | 0.213 (0.005)** |
| Anterior face patches | |||||
| Averaging method | 0.353 (0.046)* | 0.580 (0.026)* | 0.500 (0.133) | 0.196 (0.179) | 0.106 (0.237) |
| Concatenation method | 0.199 (0.047)* | −0.043 (0.599) | 0.564 (0.004)** | 0.074 (0.267) | 0.082 (0.165) |
| Posterior object-selective regions | |||||
| Averaging method | −0.285 (0.913) | 0.035 (0.461) | −0.393 (0.823) | 0.546 (0.003)** | −0.050 (0.633) |
| Concatenation method | 0.009 (0.470) | 0.138 (0.210) | 0.087 (0.354) | 0.381 (<0.001)*** | 0.204 (0.007)** |
| Anterior object-selective regions | |||||
| Averaging method | 0.277 (0.094) | 0.098 (0.383) | 0.179 (0.357) | −0.005 (0.511) | 0.197 (0.090) |
| Concatenation method | 0.178 (0.068) | 0.200 (0.120) | 0.197 (0.195) | 0.288 (0.007)** | 0.271 (<0.001)*** |
| TEO | |||||
| Averaging method | 0.326 (0.060) | 0.608 (0.020)* | −0.071 (0.580) | 0.118 (0.290) | 0.124 (0.200) |
| Concatenation method | 0.263 (0.013)* | 0.359 (0.016)* | 0.342 (0.065) | 0.154 (0.098) | 0.076 (0.181) |
| TE | |||||
| Averaging method | 0.336 (0.055) | 0.448 (0.074) | −0.393 (0.823) | 0.049 (0.411) | 0.005 (0.486) |
| Concatenation method | 0.237 (0.023)* | 0.260 (0.063) | 0.060 (0.399) | 0.111 (0.176) | 0.045 (0.296) |
| AMG | |||||
| Averaging method | 0.213 (0.158) | 0.552 (0.033)* | −0.107 (0.609) | −0.072 (0.633) | −0.055 (0.647) |
| Concatenation method | 0.155 (0.097) | 0.131 (0.223) | −0.174 (0.777) | 0.182 (0.063) | −0.003 (0.514) |
| PFC | |||||
| Averaging method | 0.075 (0.364) | 0.503 (0.049)* | 0.286 (0.278) | −0.257 (0.889) | 0.296 (0.021)* |
| Concatenation method | 0.308 (0.004)** | 0.436 (0.004)** | 0.461 (0.018)* | −0.008 (0.526) | 0.177 (0.017)* |
| V4 | |||||
| Averaging method | −0.090 (0.665) | −0.224 (0.765) | 0.214 (0.331) | −0.462 (0.988) | −0.206 (0.920) |
| Concatenation method | −0.098 (0.747) | −0.176 (0.796) | 0.152 (0.303) | 0.013 (0.465) | −0.044 (0.665) |
The group analysis was performed using both the averaging and concatenation method (see Materials and Methods). p values are shown in parentheses: *p < 0.05,
**p < 0.01,
***p < 0.001. The p value is from a one-tailed test on Spearman's r.
In object-selective regions, mainly the concatenated single-exemplar activations showed significant results: single-exemplar activations in both the posterior and anterior object-selective regions replicated the ranking of inanimate objects and body parts, but not the ranking of faces.
Interestingly, in TEO and TE, excluding face-selective and object-selective voxels, the two group analysis methods (averaging and concatenation) showed similar results to those in face-selective regions: there were replicable rankings for faces but not for either body parts or inanimate objects. We did not find replicable rankings for any tested categories (i.e., faces, body parts, inanimate objects) in V4 or the AMG. In PFC, the concatenated single-exemplar activations were replicable for the rankings of faces and inanimate objects but not for the ranking of body parts. Interestingly, in the AMG and PFC, the averaged single-exemplar activations replicated the ranking of human faces.
Discussion
In the present study, we investigated representations of visual exemplars and categories in the macaque brain using fMRI, First, we found that the multivoxel response patterns to individual exemplars formed: (1) both animate (with a face subcluster) and inanimate clusters in IT cortex; (2) no clusters in either V4 or the AMG; and (3) only an inanimate cluster in PFC. Second, we found that, in the IT face-selective regions but not object-selection regions, the multivoxel response patterns to individual exemplars represented the preferred (face) versus nonpreferred (nonface) categorical structure, especially in the anterior face patches. Finally, in both the IT face-selective regions and object-selection regions, regionally averaged activations to individual exemplars showed category-selectivity and within-category exemplar-selectivity. Our findings demonstrate that, at both the single-exemplar and the population level, intrinsic object representation and categorization are hierarchically organized as one moves anteriorly along the ventral pathway, reflecting both modular and distributed processing. Below, we discuss the significance of these findings for understanding object representation and categorization in the brain.
Spatial distribution of response patterns elicited by individual exemplars
IT cortex
Results from both monkey electrophysiology (Kiani et al., 2007) and human fMRI (Kriegeskorte et al., 2008) have shown that response patterns in IT cortex elicited by individual exemplars show an animate-inanimate categorical structure. Here we found analogous results in the macaque IT cortex using fMRI, thus providing a missing link between those previous studies. Furthermore, our findings demonstrate that the combination of an event-related design and MVPA is informative for studying brain function in behaving monkeys, enabling the detection of fine-grained spatial patterns elicited by individual exemplars.
In the single-unit study cited above, the recorded cells were limited to area TE (Kiani et al., 2007). Here, we sampled the entire temporal lobe and found important differences in object representations between TEO and TE: individual exemplar representations formed only an animate cluster (without any subclusters) in TEO, but both animate (with a face subcluster) and inanimate clusters in TE. Our findings support electrophysiological and lesion evidence in monkeys for a hierarchical organization from TEO to TE in object processing. Compared with TEO, TE shows greater selectivity for complex objects, with larger receptive fields and less precise retinotopy (Gross et al., 1969; Kobatake and Tanaka, 1994). In addition, lesions of TE cause greater deficits in object recognition, whereas lesions of TEO cause greater deficits in visual perception (Iwai and Mishkin, 1969; Merigan and Saunders, 2004).
We also found that the intrinsic organization of the multivoxel response patterns to individual exemplars showed the preferred (face) versus nonpreferred (nonface) categorical structure in the IT face patches, weaker in noncategory-selective regions located adjacent to them, but not in object-selective regions. These results suggest that the population activities of these fMRI-identified face patches may encode face information (Kriegeskorte et al., 2007). Furthermore, these findings indicate that object representations in IT cortex reflect both modular (for review, see Reddy and Kanwisher, 2006) and distributed (Tanaka et al., 1991; Haxby et al., 2001; Tanaka, 2003) components. Such a “combined ” model is supported by a recent monkey electrophysiological study, which found that face-selective cells are concentrated inside but also exist outside the fMRI-identified face patches (Bell et al., 2011). Moreover, findings from human fMRI studies also suggest that the neural structures responsible for categorical representation may be organized into modules, whereas distinguishing individual exemplars within a category may rely on a more distributed organization (Weiner and Grill-Spector, 2010). We did not find an object (inanimate) cluster in object-selective regions. However, it should be noted that an object cluster was represented in TE when 80 instead of 30 voxels were selected, indicating that inanimate object information may be coded in a more distributed way than face information.
V4, the AMG, and PFC
Here, we also examined the categorical structure in one input region (V4) and two output regions of IT cortex (the AMG and PFC). Unlike IT cortex, V4 and the AMG did not exhibit any categorical structure, suggesting that they play a less important role in object categorization than IT cortex. Previous studies found that V4 is an intermediate stage of object processing (e.g., processing the contours of objects) (Carlson et al., 2011), but below the stage of object representation (Palmeri and Gauthier, 2004). Our findings confirm that V4 does not represent object categorization found in high-level visual cortex (i.e., IT cortex). The absence of categorical structure in the AMG is consistent with studies in monkeys with amygdala lesion and human patients, which have not reported deficits related to object discrimination or categorization per se (Aggleton and Passingham, 1981; Becker et al., 2012). PFC showed a different categorical structure from that in IT cortex: an inanimate cluster, but no animate cluster. Compared with the IT face patches, the number and size of the PFC face patches were smaller and likely represented a very small proportion of the PFC visual-object responsive voxels selected in the present study. This may have precluded the detection in PFC of an animate cluster. Further studies will be needed to clarify this issue.
Category-selectivity at the single-exemplar level and exemplar-selectivity in category-selective regions
Category-selectivity at the single-exemplar level
Previous neuroimaging studies have rarely distinguished the responses to individual exemplars in category-selective regions. Here, we studied this question by investigating the regionally averaged activations evoked by individual exemplars within two types of IT category-selective regions: face-selective regions and object-selective regions. Consistent with a recent human fMRI study (Mur et al., 2012), we found that the preferred category could be distinguished from other nonpreferred categories at the single-exemplar level in these category-selective regions, but not in noncategory-selective regions.
Few studies have been able to tackle the functional differences between the posterior and anterior face patches. Electrophysiological studies in monkeys have compared the proportion of face-selective cells in the posterior and anterior face patches and how they represent head orientation (Freiwald and Tsao, 2010; Bell et al., 2011). Only one study, to our knowledge, has investigated differences in category-selectivity based on the regionally averaged responses to different predefined categories (Bell et al., 2009). Our results provide new evidence that the anterior face patches process face-related information more selectively than the posterior face patches at the single-exemplar level. This result is consistent with our findings at the population level: the anterior face patches represented the face versus nonface categorical structure better than did the posterior face patches.
Although we did not find such differences between the posterior and anterior object-selective regions at either the population or the single-exemplar level, it should be noted that TE but not TEO formed an object (inanimate) cluster when the 80 most visual-object responsive voxels were selected. Thus, differences between the posterior and anterior object-selective regions might still exist but in a subtle way.
Exemplar-selectivity
In addition to category-selectivity, we also found within-category exemplar-selectivity in IT category-selective regions: some exemplars in the preferred category consistently elicited stronger fMRI activations than other exemplars in the same category. A previous electrophysiological study found that a proportion (∼23%) of cells within the IT face patches show exemplar-selectivity (Bell et al., 2011). Here, we demonstrated that the exemplar-selectivity is present at the level of entire patches, which is consistent with findings in a human fMRI study (Mur et al., 2012). This exemplar-selectivity could be driven by subcategories that elicit different levels of activations. This possibility was confirmed by our ROC and AUC results, which revealed distinct subcategorical representations for conspecific and heterospecific faces. It should be noted that replicable rankings were also found for different faces within the same subcategory (e.g., nonprimate faces and human faces in the anterior face patches). That is, exemplar-selectivity may even exist within subcategories in category-selective regions.
The observed exemplar-selectivity could also be interpreted as reflecting attentional effects. Previous studies have found that attention enhances responses to stimuli in category-selective regions (Wojciulik et al., 1998; O'Craven et al., 1999). Consistent with this explanation, we found within-human-face activation differences in the AMG and PFC. Further studies will be needed to fully understand the underlying mechanism.
Like category-selectivity, exemplar-selectivity for faces was more specific in the anterior face patches as compared with the posterior ones: (1) replicable within-category activation rankings were found for both face and nonface categories in the posterior face patches but only for faces in the anterior ones; and (2) replicable within-subcategory (e.g., human faces) ranking was only found in the anterior face patches. Human neuroimaging studies have also shown that individual faces elicit distinct response patterns in anterior temporal cortex (Kriegeskorte et al., 2007). Our results suggest that human anterior temporal face patches and the anterior face patches in macaques may share similar functions in terms of face processing.
Footnotes
This work was supported by the National Institute of Mental Health Intramural Research Program (N.L., N.K., M.M., F.H-B., W-M.L., and L.G.U.) and European Research Council Starting Grant (ERC-2010-StG 261352) to N.K. We thank Ziad S. Saad for his invaluable assistance with the analyses and James A. Ellis for help with animal training and collection of the imaging data.
References
- Aggleton JP, Passingham RE. Syndrome produced by lesions of the amygdala in monkeys (Macaca mulatta) J Comp Physiol Psychol. 1981;95:961–977. doi: 10.1037/h0077848. [DOI] [PubMed] [Google Scholar]
- Becker B, Mihov Y, Scheele D, Kendrick KM, Feinstein JS, Matusch A, Aydin M, Reich H, Urbach H, Oros-Peusquens AM, Shah NJ, Kunz WS, Schlaepfer TE, Zilles K, Maier W, Hurlemann R. Fear processing and social networking in the absence of a functional amygdala. Biol Psychiatry. 2012;72:70–77. doi: 10.1016/j.biopsych.2011.11.024. [DOI] [PubMed] [Google Scholar]
- Bell AH, Hadj-Bouziane F, Frihauf JB, Tootell RB, Ungerleider LG. Object representations in the temporal cortex of monkeys and humans as revealed by functional magnetic resonance imaging. J Neurophysiol. 2009;101:688–700. doi: 10.1152/jn.90657.2008. [DOI] [PMC free article] [PubMed] [Google Scholar]
- Bell AH, Malecek NJ, Morin EL, Hadj-Bouziane F, Tootell RB, Ungerleider LG. Relationship between functional magnetic resonance imaging-identified regions and neuronal category selectivity. J Neurosci. 2011;31:12229–12240. doi: 10.1523/JNEUROSCI.5865-10.2011. [DOI] [PMC free article] [PubMed] [Google Scholar]
- Carlson ET, Rasquinha RJ, Zhang K, Connor CE. A sparse object coding scheme in area V4. Curr Biol. 2011;21:288–293. doi: 10.1016/j.cub.2011.01.013. [DOI] [PMC free article] [PubMed] [Google Scholar]
- Connolly AC, Guntupalli JS, Gors J, Hanke M, Halchenko YO, Wu YC, Abdi H, Haxby JV. The representation of biological classes in the human brain. J Neurosci. 2012;32:2608–2618. doi: 10.1523/JNEUROSCI.5547-11.2012. [DOI] [PMC free article] [PubMed] [Google Scholar]
- Cox RW. AFNI: software for analysis and visualization of functional magnetic resonance neuroimages. Comput Biomed Res. 1996;29:162–173. doi: 10.1006/cbmr.1996.0014. [DOI] [PubMed] [Google Scholar]
- Freiwald WA, Tsao DY. Functional compartmentalization and viewpoint generalization within the macaque face-processing system. Science. 2010;330:845–851. doi: 10.1126/science.1194908. [DOI] [PMC free article] [PubMed] [Google Scholar]
- Gattass R, Sousa AP, Gross CG. Visuotopic organization and extent of V3 and V4 of the macaque. J Neurosci. 1988;8:1831–1845. doi: 10.1523/JNEUROSCI.08-06-01831.1988. [DOI] [PMC free article] [PubMed] [Google Scholar]
- Gross CG, Bender DB, Rocha-Miranda CE. Visual receptive fields of neurons in inferotemporal cortex of the monkey. Science. 1969;166:1303–1306. doi: 10.1126/science.166.3910.1303. [DOI] [PubMed] [Google Scholar]
- Hadj-Bouziane F, Bell AH, Knusten TA, Ungerleider LG, Tootell RB. Perception of emotional expressions is independent of face selectivity in monkey inferior temporal cortex. Proc Natl Acad Sci U S A. 2008;105:5591–5596. doi: 10.1073/pnas.0800489105. [DOI] [PMC free article] [PubMed] [Google Scholar]
- Haxby JV, Gobbini MI, Furey ML, Ishai A, Schouten JL, Pietrini P. Distributed and overlapping representations of faces and objects in ventral temporal cortex. Science. 2001;293:2425–2430. doi: 10.1126/science.1063736. [DOI] [PubMed] [Google Scholar]
- Iwai E, Mishkin M. Further evidence on the locus of the visual area in the temporal lobe of the monkey. Exp Neurol. 1969;25:585–594. doi: 10.1016/0014-4886(69)90101-0. [DOI] [PubMed] [Google Scholar]
- Kiani R, Esteky H, Mirpour K, Tanaka K. Object category structure in response patterns of neuronal population in monkey inferior temporal cortex. J Neurophysiol. 2007;97:4296–4309. doi: 10.1152/jn.00024.2007. [DOI] [PubMed] [Google Scholar]
- Kobatake E, Tanaka K. Neuronal selectivities to complex object features in the ventral visual pathway of the macaque cerebral cortex. J Neurophysiol. 1994;71:856–867. doi: 10.1152/jn.1994.71.3.856. [DOI] [PubMed] [Google Scholar]
- Kriegeskorte N, Formisano E, Sorger B, Goebel R. Individual faces elicit distinct response patterns in human anterior temporal cortex. Proc Natl Acad Sci U S A. 2007;104:20600–20605. doi: 10.1073/pnas.0705654104. [DOI] [PMC free article] [PubMed] [Google Scholar]
- Kriegeskorte N, Mur M, Ruff DA, Kiani R, Bodurka J, Esteky H, Tanaka K, Bandettini PA. Matching categorical object representations in inferior temporal cortex of man and monkey. Neuron. 2008;60:1126–1141. doi: 10.1016/j.neuron.2008.10.043. [DOI] [PMC free article] [PubMed] [Google Scholar]
- Leite FP, Tsao D, Vanduffel W, Fize D, Sasaki Y, Wald LL, Dale AM, Kwong KK, Orban GA, Rosen BR, Tootell RB, Mandeville JB. Repeated fMRI using iron oxide contrast agent in awake, behaving macaques at 3 Tesla. Neuroimage. 2002;16:283–294. doi: 10.1006/nimg.2002.1110. [DOI] [PubMed] [Google Scholar]
- Merigan WH, Saunders RC. Unilateral deficits in visual perception and learning after unilateral inferotemporal cortex lesions in macaques. Cereb Cortex. 2004;14:863–871. doi: 10.1093/cercor/bhh045. [DOI] [PubMed] [Google Scholar]
- Misaki M, Kim Y, Bandettini PA, Kriegeskorte N. Comparison of multivariate classifiers and response normalizations for pattern-information fMRI. Neuroimage. 2010;53:103–118. doi: 10.1016/j.neuroimage.2010.05.051. [DOI] [PMC free article] [PubMed] [Google Scholar]
- Mur M, Ruff DA, Bodurka J, De Weerd P, Bandettini PA, Kriegeskorte N. Categorical, yet graded- single-image activations of human category-selective cortical regions. J Neurosci. 2012;32:8649–8662. doi: 10.1523/JNEUROSCI.2334-11.2012. [DOI] [PMC free article] [PubMed] [Google Scholar]
- O'Craven KM, Downing PE, Kanwisher N. fMRI evidence for objects as the units of attentional selection. Nature. 1999;401:584–587. doi: 10.1038/44134. [DOI] [PubMed] [Google Scholar]
- Palmeri TJ, Gauthier I. Visual object understanding. Nat Rev Neurosci. 2004;5:291–303. doi: 10.1038/nrn1364. [DOI] [PubMed] [Google Scholar]
- Popivanov ID, Jastorff J, Vanduffel W, Vogels R. Stimulus representations in body-selective regions of the macaque cortex assessed with event-related fMRI. Neuroimage. 2012;63:723–741. doi: 10.1016/j.neuroimage.2012.07.013. [DOI] [PubMed] [Google Scholar]
- Pruessmann KP. Parallel imaging at high field strength: synergies and joint potential. Top Magn Reson Imaging. 2004;15:237–244. doi: 10.1097/01.rmr.0000139297.66742.4e. [DOI] [PubMed] [Google Scholar]
- Reddy L, Kanwisher N. Coding of visual objects in the ventral stream. Curr Opin Neurobiol. 2006;16:408–414. doi: 10.1016/j.conb.2006.06.004. [DOI] [PubMed] [Google Scholar]
- Spiridon M, Kanwisher N. How distributed is visual category information in human occipito-temporal cortex? An fMRI study. Neuron. 2002;35:1157–1165. doi: 10.1016/S0896-6273(02)00877-2. [DOI] [PubMed] [Google Scholar]
- Tanaka K. Columns for complex visual object features in the inferotemporal cortex: clustering of cells with similar but slightly different stimulus selectivities. Cereb Cortex. 2003;13:90–99. doi: 10.1093/cercor/13.1.90. [DOI] [PubMed] [Google Scholar]
- Tanaka K, Saito H, Fukada Y, Moriya M. Coding visual images of objects in the inferotemporal cortex of the macaque monkey. J Neurophysiol. 1991;66:170–189. doi: 10.1152/jn.1991.66.1.170. [DOI] [PubMed] [Google Scholar]
- Tsao DY, Freiwald WA, Knutsen TA, Mandeville JB, Tootell RB. Faces and objects in macaque cerebral cortex. Nat Neurosci. 2003;6:989–995. doi: 10.1038/nn1111. [DOI] [PMC free article] [PubMed] [Google Scholar]
- Tsao DY, Freiwald WA, Tootell RB, Livingstone MS. A cortical region consisting entirely of face-selective cells. Science. 2006;311:670–674. doi: 10.1126/science.1119983. [DOI] [PMC free article] [PubMed] [Google Scholar]
- Tsao DY, Moeller S, Freiwald WA. Comparing face patch systems in macaques and humans. Proc Natl Acad Sci U S A. 2008;105:19514–19519. doi: 10.1073/pnas.0809662105. [DOI] [PMC free article] [PubMed] [Google Scholar]
- Ungerleider LG, Bell AH. Uncovering the visual “alphabet”: advances in our understanding of object perception. Vision Res. 2011;51:782–799. doi: 10.1016/j.visres.2010.10.002. [DOI] [PMC free article] [PubMed] [Google Scholar]
- Vanduffel W, Fize D, Mandeville JB, Nelissen K, Van Hecke P, Rosen BR, Tootell RB, Orban GA. Visual motion processing investigated using contrast agent-enhanced fMRI in awake behaving monkeys. Neuron. 2001;32:565–577. doi: 10.1016/S0896-6273(01)00502-5. [DOI] [PubMed] [Google Scholar]
- Weiner KS, Grill-Spector K. Sparsely-distributed organization of face and limb activations in human ventral temporal cortex. Neuroimage. 2010;52:1559–1573. doi: 10.1016/j.neuroimage.2010.04.262. [DOI] [PMC free article] [PubMed] [Google Scholar]
- Wojciulik E, Kanwisher N, Driver J. Covert visual attention modulates face-specific activity in the human fusiform gyrus: fMRI study. J Neurophysiol. 1998;79:1574–1578. doi: 10.1152/jn.1998.79.3.1574. [DOI] [PubMed] [Google Scholar]