Background: Rhodopsin is distributed among various organisms.
Results: A proton pumping rhodopsin named TR was characterized.
Conclusion: TR showed high stability.
Significance: TR should be a useful protein for research on retinylidene proteins.
Keywords: 7-Helix Receptor, Membrane Proteins, Membrane Transport, Photobiology, Photoreceptors, Protein Denaturation, Rhodopsin, Ion Pump, Retinal, Thermal Stability
Abstract
So far retinylidene proteins (∼rhodopsin) have not been discovered in thermophilic organisms. In this study we investigated and characterized a microbial rhodopsin derived from the extreme thermophilic bacterium Thermus thermophilus, which lives in a hot spring at around 75 °C. The gene for the retinylidene protein, named thermophilic rhodopsin (TR), was chemically synthesized with codon optimization. The codon optimized TR protein was functionally expressed in the cell membranes of Escherichia coli cells and showed active proton transport upon photoillumination. Spectroscopic measurements revealed that the purified TR bound only all-trans-retinal as a chromophore and showed an absorption maximum at 530 nm. In addition, TR exhibited both photocycle kinetics and pH-dependent absorption changes, which are characteristic of rhodopsins. Of note, time-dependent thermal denaturation experiments revealed that TR maintained its absorption even at 75 °C, and the denaturation rate constant of TR was much lower than those of other proton pumping rhodopsins such as archaerhodopsin-3 (200 ×), Haloquadratum walsbyi bacteriorhodopsin (by 10-times), and Gloeobacter rhodopsin (100 ×). Thus, these results suggest that microbial rhodopsins are also distributed among thermophilic organisms and have high stability. TR should allow the investigation of the molecular mechanisms of ion transport and protein folding.
Introduction
Rhodopsin is a membrane-embedded protein that functions as a photoreceptor with a chromophore retinal (vitamin A aldehyde) which binds to a conserved lysine residue within seven transmembrane α-helices via a protonated Schiff base (PSB)2 linkage. Rhodopsins are generally classified into two types (1): type II (animal) rhodopsins belonging to the G protein-coupled receptor family, which play important roles for photoreception in animal eyes, and type I (microbial) rhodopsins, which function as ion transporters or photosensors. Although there are similarities and dissimilarities between type-I and type-II rhodopsins, isomerization of the retinal chromophore commonly leads to their biological functions. The number of rhodopsin molecules is dramatically growing, especially since the year 2000, by meta-genomic analyses (2, 3).
At present thousands of type-I rhodopsins have been discovered in large taxonomic groups including three biological kingdoms, eukaryotes, bacteria, and archaea, and some of them have been extensively characterized using a variety of methods (3, 4). Bacteriorhodopsin (BR) was initially discovered in the halophilic archaea Halobacterium salinarum, and it is the first and the most studied type I rhodopsin (5, 6). BR functions as an outward proton pump upon photoillumination through a kinetic photoreaction, termed the photocycle, which is triggered by trans-cis isomerization of the chromophore retinal. In addition to the sensory rhodopsins responsible for photo-signal transduction, a significant number of proton-pumping rhodopsins have been identified from the genes of prokaryotes (archaea and bacteria) and eukaryotes (fungi and algae) (Fig. 1) (7). These proton pumps are roughly divided into two groups: BR-like proteins from archaea and proteorhodopsin (PR)-like proteins from eubacteria (Fig. 1). In 2000, PR was discovered through genomic analysis in marine bacterioplankton (8). The native and recombinant PR, which has all-trans-retinal as a chromophore, showed active proton transport upon photoillumination (8, 9). The proton gradient produced by PR is utilized by ATP synthesis, generating biochemical energy from light (10). The continual discovery of PR-like proton pumping rhodopsins, such as xanthorhodopsin from a halophilic bacterium (11), Gloeobacter rhodopsin (GR) from a freshwater cyanobacterium Gloeobacter violaceus (12), Exiguobacterium sibiricum rhodopsin from a Gram-positive bacterium (13), and actinorhodopsin from an actinobacteria (14) (Fig. 1), has become a focus of interest in part because of their importance to the general understanding of energy production in nature. Thus a previously unsuspected mode of bacterially mediated light-driven energy production may commonly occur in environments worldwide. It is noteworthy that microbial rhodopsin from thermophilic organisms has not been discovered so far. These facts would be reasonable because free retinal is easy to degrade at temperatures higher than 50 °C in the presence of oxygen (15, 16) if there is no cooperative mechanism of retinal synthesis by putative retinal synthesis-related proteins and retinal uptake by opsin.
FIGURE 1.
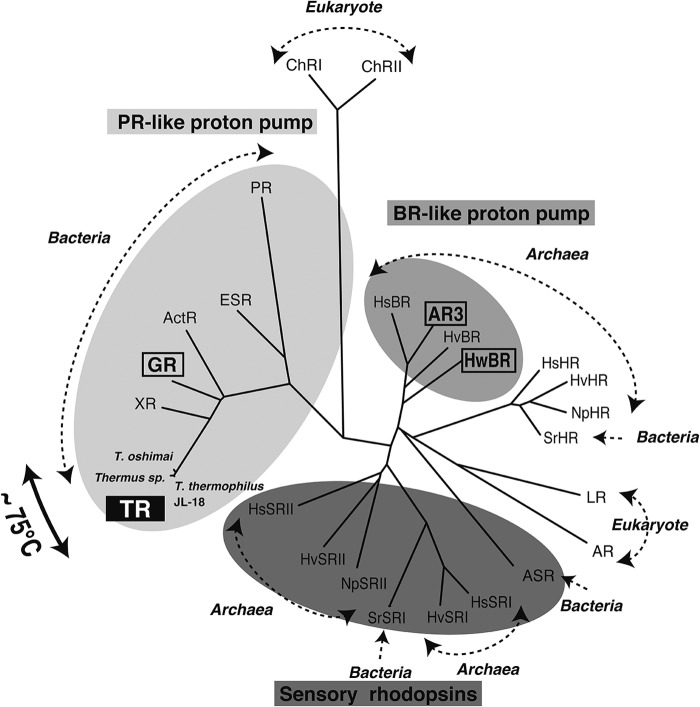
Phylogenetic tree of microbial rhodopsins. Archaea are: BR, halorhodopsin (HR), SRI and -II from H. salinarum (Hs), Natronomonas pharaonis (Np), Haloarcula vallismortis (Hv), H. walsbyi (Hw), archaerhodopsin-3 from H. sodomense (AR3). Bacteria are: TR from T. thermophilus JL-18, T. oshimai JL-2, and Thermus sp. CBB_US3_UF1, PR from marine proteobacteria, GR from G. violaceus, E. sibiricum rhodopsin (ESR) from E. sibiricum, actinorhodopsin (ActR) from actinobacteria, xanthorhodopsin (XR), halorhodopsin (HR), and SRI from Salinibacter ruber (Sr), and Anabaena sensory rhodopsin (ASR) from Anabaena sp. PCC7120. Eukaryotes are: channelrhodopsin I (ChRI) and II (ChRII) from Chlamydomonas reinhardtii, Leptosphaeria rhodopsin (LR) from Leptosphaeria maculans, and Acetabularia rhodopsin (AR) from Acetabularia acetabulum. Dashed-lined arrows indicate domains of life. PR-like and BR-like proton pumps are highlighted in light gray and gray, respectively, and sensory rhodopsins are highlighted in dark gray. TRs were discovered from thermophiles living at higher temperatures (∼73–77 °C, indicated by the bold black arrow).
In 2012 the existence of a gene encoding a type-I rhodopsin was revealed by whole genome sequencing of the extreme thermophilic bacterium Thermus thermophilus, which lives in a hot spring (∼73–77 °C) in the United States Great Basin (Fig. 1, NCBI accession ID YP_006059019) (17). Proteins related to retinal synthesis were also observed in its genome (17). In this study we report that the rhodopsin from T. thermophilus JL-18 strain is a functional proton pump. We named it “thermophilic rhodopsin (TR)” and characterized its photochemical properties. TR exhibits an absorption spectrum, a photocycle with intermediates and kinetics that are characteristic of retinal proteins. Of note, compared with other proton pumping rhodopsins, including the BR-like proteins from Haloquadratum walsbyi (HwBR) (18) and from Halorubrum sodomense (AR3) (19) and a PR-like protein GR, TR shows a high stability even at high temperature (75 °C). Thus, in addition to the expression system, the high stability of TR should allow the use of various methods to investigate the molecular mechanisms both of the ion transport and the protein folding.
EXPERIMENTAL PROCEDURES
Gene Preparation, Protein Expression, and Purification
The codon-optimized gene for TR with NdeI and XhoI restriction enzyme sites was chemically synthesized by Funakoshi Co. (Tokyo, Japan). Although the nucleotide sequence of the TR gene is different from the original one, the amino acid sequence of TR is completely identical. The TR gene was inserted into the arabinose-inducible expression vector pKI81, a pBAD derivative (a kind gift from Dr. Kunio Ihara) (18). The gene for AR3 was amplified using PCR from the genomic DNA of H. sodomense and was also inserted into the same vector. Consequently, the plasmids encode TR and AR3 with six histidines at the C terminus. The Escherichia coli DH5α strain was used as a host for DNA manipulation. All constructed plasmids were analyzed using an automated sequencer to confirm the expected nucleotide sequences. The expression plasmids for HwBR and GR were constructed as described previously (18, 20).
For protein expression, transformed E. coli BL21(DE3) cells harboring the plasmid were initially grown at 30 °C in 100 ml of LB medium supplemented with ampicillin (final concentration, 50 μg/ml) and were directly inoculated into 2 liters of LB medium containing ampicillin. The cells were grown in a rotary shaker (MIR-220R, Sanyo Electric Co., Ltd., Osaka, Japan) at 18 °C after overnight incubation with 0.1% l-arabinose and 5 μm all-trans-retinal. Cells were harvested by centrifugation at 4 °C, resuspended in buffer (50 mm MES, pH 6.5) containing 1 m NaCl, and disrupted by sonication or a French press. The preparation of crude membranes and the purification of proteins were performed using essentially a previously described method (18). Briefly, the cell membranes were solubilized by n-dodecyl-β-d-maltoside (DDM, Dojindo Laboratories, Kumamoto, Japan) and purified with a Ni2+ affinity column (GE Healthcare). When necessary, the samples were further purified with an anion exchange column as described previously (21). The purified sample was concentrated and exchanged using an Amicon Ultra filter (Millipore, Bedford, MA) against buffer A (1 m NaCl, 50 mm Tris-Cl, and 0.05% DDM, pH 7.0). GR was purified as previously reported (20). To adjust the concentration of DDM, the samples were prepared by dialysis against buffer A for 2–3 weeks. The concentration of all samples used for spectroscopic measurements described below was ∼0.6 absorbance at maximum absorption wavelength, λmax.
Light-induced Proton Transport Activity Measurement
The proton transport activity of TR was measured by monitoring pH changes using a glass electrode as described previously (18). Briefly, E. coli cells expressing TR were harvested by centrifugation (4800 × g for 3 min) and then were washed 3 times and resuspended in the solvent for the measurement (100 mm NaCl, initial pH ∼6). The cell suspension was kept in darkness and then was illuminated with the output of a 100-watt xenon arc lamp (LM103, Asahi Spectra, Tokyo, Japan) through a long-pass glass filter for 2.5 min (>510 nm). When necessary, a proton-selective ionophore, carbonyl cyanide 3-chlorophenylhydrazone (Sigma) was added to the suspension.
Spectroscopic Measurements of Purified TR
UV-visible spectra were recorded using a UV2450 spectrophotometer with an ISR2200 integrating sphere (Shimadzu, Kyoto, Japan). For the measurement of time-dependent thermal denaturation, the temperature was kept at the desired value (61–85 °C) on a block heater. During incubation, the suspension became turbid, maybe because of aggregation by the denatured protein. Therefore, before the spectrum measurement, the sample was centrifuged at 21,500 × g for 1 min to remove the aggregate. It is noted that judging from the color of the precipitate the native rhodopsin did not precipitate at all, indicating that the aggregate was composed of denatured and bleached protein. For spectroscopic titration, the TR sample was first suspended in buffer A, pH 7.0. The pH was then adjusted to the desired value by the addition of very small amounts of 2 or 4 n HCl followed by measurement of the absorption spectrum. After the pH was reduced to <1, it was adjusted by the addition of small amounts of 2 n NaOH until the pH reverted to pH 7. Before and after each spectrum, the pH was measured to ensure that the variation was less than 0.05 pH units. The retinal compositions under light and dark conditions were analyzed by normal-phase high performance liquid chromatography (HPLC) following a published procedure (22).
For the time-resolved flash-photolysis spectroscopy, the apparatus used was the same as described previously (18). The temperature was kept at the desired temperature during the measurements using a circulating thermostatted water bath. Data were acquired every 5 °C from 35 °C except for 83 °C. The wavelengths of the observation for original pigment and M- and N(O) intermediates were 530, 380, and 585 nm for TR, 550, 380, and 620 nm for HwBR and AR3, and 530, 380, and 620 nm for GR, respectively.
Data Analysis
For spectroscopic titration of TR, the absorption differences, ΔAbs, at 592 and 530 nm were plotted against pH and fitted by the Henderson-Hasselbalch equation with two pKa values,
 |
where a and b are the amplitudes of the ΔAbs change of the species with pK1a1 and pK1a2, respectively, and c is an offset. The pK1a3 and pK1a4 were calculated by the same equation.
The decay rate constant of the red-shifted intermediate and the concomitant recovery rate constant of the original state were obtained by a single exponential equation. The logarithms of the time constants were plotted against the reciprocal temperature to generate an Arrhenius plot. The Arrhenius plot of the kinetic constant, K, was analyzed by the following Eyring equations (23).
 |
where Ea stands for the activation energy calculated from the slope of the Arrhenius plot, and h and kB stand for the Planck and the Boltzmann constants, respectively.
For the time-dependent thermal denaturation, the residual protein activities after incubation were estimated from the absorbance at 530 nm for TR, 550 nm for HwBR, 550 nm for AR3, and 540 nm for GR. The logarithm of the amount of residual active protein, F, was plotted against time, t (min), and fitted by a single exponential decay function,
where k is the denaturation rate constant, and f0 is the initial amount of the active protein (∼0.6). The logarithm of the denaturation rate constants calculated at various temperatures was plotted against the reciprocal temperature to generate an Arrhenius plot. The activation energy, Ea, was calculated by the slope of the Arrhenius plot.
RESULTS
A Newly Identified Microbial Rhodopsin in a Thermophilic Bacterium T. thermophilus as a Proton Pump
The results of a genomic analysis in 2012 revealed that the T. thermophilus JL-18 strain contains a gene encoding a microbial rhodopsin composed of 260 amino acid residues (Fig. 2) (NCBI accession ID YP_006059019). We named it thermophilic rhodopsin, TR. Fig. 1 shows the phylogenetic tree of microbial type-I rhodopsins, which are divided into three major types: ion pumping rhodopsins from archaea (BR-like), ion pumping rhodopsins from eubacteria (PR-like), and sensory rhodopsins (SRs). The amino acid sequence of TR is relatively related to green proteorhodopsin (31% identity, 72% similarity) and more closely to xanthorhodopsin (54% identity, 83% similarity) (Fig. 1) and contains characteristic amino acids found in PR-like proton pumps, such as Asp-95, Asp-229, Glu-106, and His-61, which correspond to Asp-97, Asp-227, Glu-108, and His-75 in PR, respectively. Therefore, TR is expected to act as a PR-like light-driven proton pump. Compared with BR from H. salinarum, the amino acid sequence identity and similarity were 25 and 60%, respectively. Other than T. thermophilus JL-18, two different strains, Thermus oshimai JL-12 and Thermus sp. CBB_US3_UF1, also contain genes encoding TR homologs (∼95% identity) (Fig. 1) (NCBI accession IDs YP_006972578 and YP_005654174, respectively).
FIGURE 2.
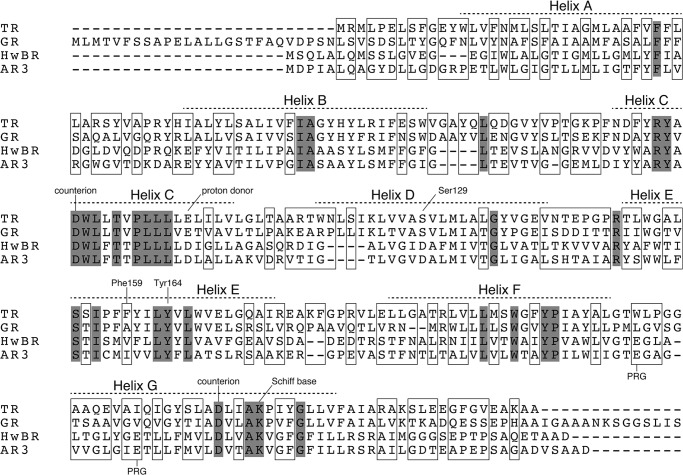
Amino acid sequence alignment of the microbial rhodopsins used in this study (TR, GR, HwBR, and AR3). The identical residues are highlighted in gray. The residues unique in TR are boxed. Prospective transmembrane regions and characteristic residues for proton pumps are indicated.
To confirm whether TR encodes a functional photoactive protein, we prepared a plasmid DNA encoding TR to express it in E. coli cells as a recombinant protein. The TR gene was chemically synthesized to have the optimized codons for E. coli. Some nucleotides (183 of 780, 23.5%) were substituted but without any changes in the amino acid sequence, as shown in Fig. 2. TR has 12 proline residues in its amino acid sequence, most of which are encoded by the CCC codon. Because this is a rare codon for E. coli, that codon was substituted by CCG or CCT. E. coli BL21(DE3) cells were transformed by the optimized gene, and upon addition of all-trans-retinal, the color of the cell pellets was obviously changed to red-pink. Using those cells, light-induced pH changes were measured at 50 °C, as shown in Fig. 3. The light illumination yielded a signal corresponding to the pH decrease of the cell suspension (Fig. 3a). The signal intensity was decreased in the presence of a proton-selective ionophore, carbonyl cyanide 3-chlorophenylhydrazone, because the proton motive force collapsed (Fig. 3b). These results suggest that TR transports protons outside the cells, similar to both BR and the known eubacterial proton pumps (8, 11, 13, 24, 25). Thus the TR protein was successfully and functionally expressed in E. coli cells.
FIGURE 3.
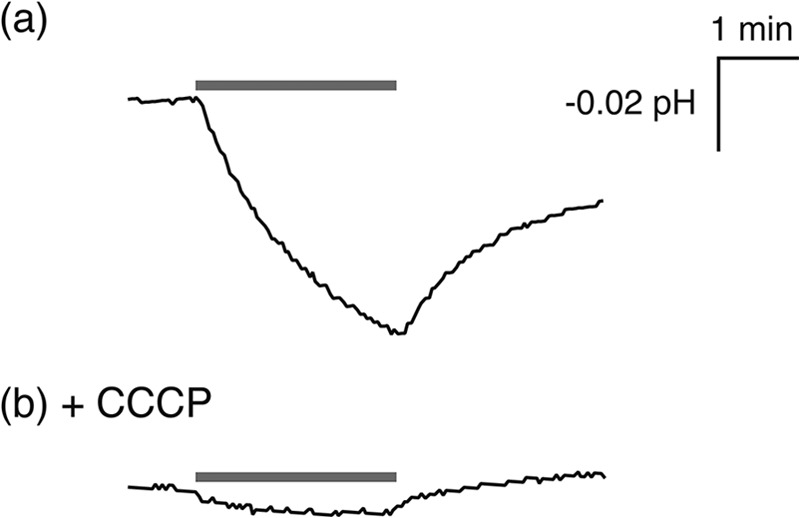
Light-induced pH changes in E. coli cells expressing TR in the absence (a) or in the presence (b) of a proton-selective ionophore, carbonyl cyanide 3-chlorophenylhydrazone (CCCP). The cells were suspended in 100 mm NaCl solution. The temperature was kept at 50 °C using a circulating thermostatted water bath. The initial pH was 5.5–5.7. Gray bars indicate the period of illumination by light equipped with a Y51 glass filter.
Spectroscopic Characterization of TR
TR was extracted from the cell membranes by the detergent DDM and was purified by column chromatography. The absorption spectrum of the purified TR was obtained and had an absorption maximum at 530 nm (Fig. 4a), which is similar to green PR (522 nm) (26), GR (540 nm) (12), and E. sibiricum rhodopsin (534 nm) (13) but was different from BR (568 nm) (5) and xanthorhodopsin (560 nm, the pure absorption maximum) (27) (Table 1). To investigate the retinal configuration of TR, we performed normal-phase HPLC analysis. The chromatograms in Fig. 4b show the retinal isomers extracted from TR under dark (solid line) and light (dotted line) conditions. Authentic all-trans- and 13-cis-retinal oximes were used as references for the chromatogram peak assignments (18). Three kinds of retinal isomers were identified from TR as all-trans/15-syn (labeled as Ts), all-trans/15-anti (Ta)- and 13-cis/15-syn (13s) configurations. The ratio of all-trans and 13-cis retinals in the dark were 97.8% and 1.9%, respectively. Upon light illumination, the content of 13-cis-retinal was slightly increased (2.5%); however, the all-trans configuration was still dominant (95.6%). The configuration is also a PR-like property (28) but not BR-like, because BR-like archaeal ion pumps have both all-trans and 13-cis isomers with ∼1:1 ratios (6, 29). Even at a higher temperature (75 °C), all-trans configuration in TR was dominant both under dark (97.4%) and light (93.5%) conditions, indicating that the isomer composition is not influenced by heat irradiation.
FIGURE 4.
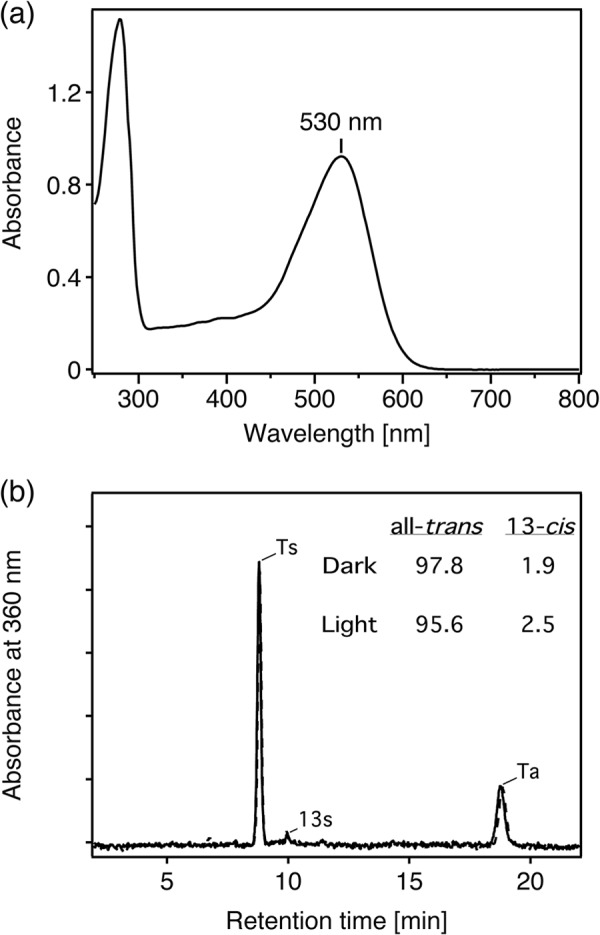
Absorption spectrum and retinal composition of TR. a, shown is an absorption spectrum of purified TR in buffer containing 1 m NaCl, 0.05% DDM, and 50 mm Tris-HCl, pH 7.0. The spectrum was recorded at room temperature (∼25 °C). b, shown are normal-phase HPLC chromatograms of retinal isomer extracted from TR in 1 m NaCl, 0.05% DDM, and 50 mm Tris-HCl, pH 7.0, in the dark (solid line) and after illumination with >500-nm light for 10 min (dotted line). Eluting retinal was detected at 360 nm. The molar composition of retinal isomers was calculated from the peak areas. Ts, Ta, and 13s denote retinal with all-trans/15-syn and all-trans/15-anti- and 13-cis/15-syn configurations, respectively. The molar ratios (%) of retinal isomers under dark and light conditions are indicated.
TABLE 1.
Comparison of photochemical properties for TR, PR, and BR
| Photochemical properties | TR | PR | BR |
|---|---|---|---|
| Absorption maximum (nm) | 530 | 522a | 568b |
| Retinal configuration | All-trans | All-transc | All-trans, 13-cisd |
| pKa, primary counterion | 3.4 (Asp-95) | 6.8 (Asp-97)e | 2.6 (Asp-85)b |
| pKa, secondary counterion | 1.1 (Asp-229?) | 3.3 (Asp-227)e | <1 (Asp-212)b |
| pKa, His in His-Asp cluster | 9 ∼ 10 | >9f | |
| pKa, Schiff base | 11 ∼ 12 | >10g | 11.2h |
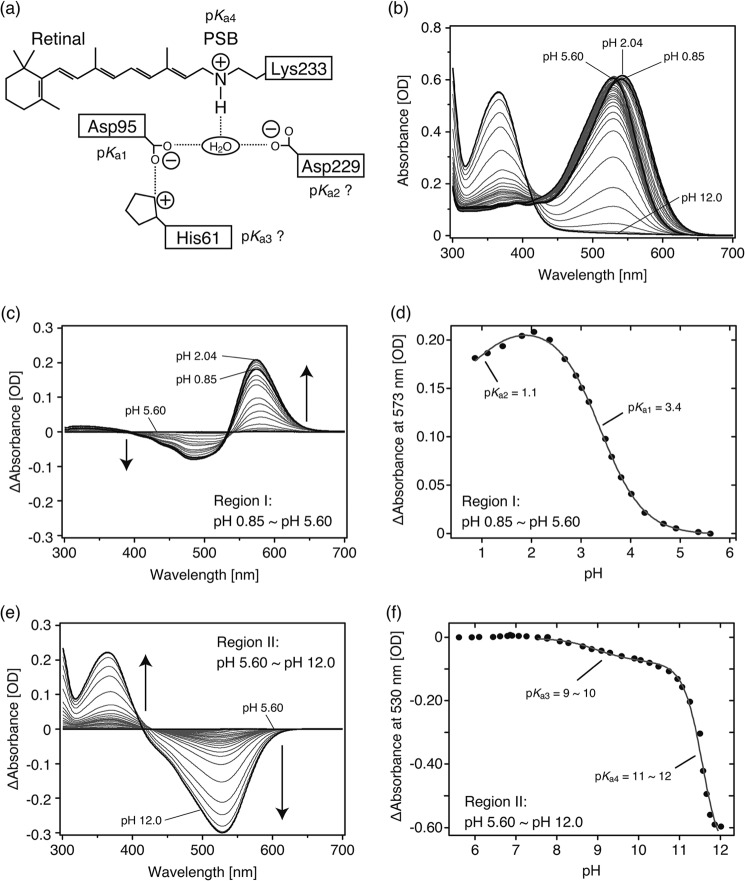
Spectral titration was carried out to estimate the pKa values of the charged residues, including counterions of the PSB and that of the PSB itself (Fig. 5a). It is well known that absorption spectra of microbial rhodopsins depend on the pH due to protonation changes of the charged residues mainly around the retinal chromophore (Fig. 5a) (5). The salt bridge between a lysine (Lys-233) and two aspartate residues (Asp-95 and Asp-229) is predicted to be necessary for the stabilization of the Schiff base as well as the other microbial rhodopsins, except for chloride pumping halorhodopsins, which lack one of the counterions. Fig. 5b shows the absorption spectra of TR at varying pH values in the presence of 1 m NaCl. To obtain the difference spectra, the spectrum at pH 5.60 was used as a standard and was subtracted from each spectrum because the difference spectrum becomes almost flat at pH 5∼7 (Fig. 5). We then carried out the analysis on the spectra classified into two pH regions; one is from pH 0.85 to 5.60 (Region I), and the other is from pH 5.60 to 12.0 (Region II). The difference spectra in each region are shown in Fig. 5, c and e, respectively.
FIGURE 5.
pH-induced absorbance changes of TR. Purified TR was suspended in 50 mm Tris-HCl, pH 7.0, 1 m NaCl, and 0.05% DDM. a, shown is a schematic illustration of the vicinity of the retinal chromophore based on the crystallographic structure of xanthorhodopsin (XR) (46). Four candidates, Asp-95, Asp-229, His-61, and the Schiff base, are represented that could influence the absorption spectra of TR. Symbols + and − denote positive and negative charges, respectively. The pKa values are tentatively assigned as shown. b, absorption spectra at various pH values are shown. Bold black lines represent the spectra at pH 5.60, where the spectrum was blue-shifted most, at pH 2.04, where the spectrum was red-shifted most, at pH 0.85, which is the end point for acidic pH, and at pH 12.0, which is the end point for alkaline pH. c and e, shown are difference spectra from pH 0.85 to pH 5.60 (Region I) (c) and from pH 5.60 to pH 12.0 (Region II) (e), respectively. The spectrum at pH 5.60 was subtracted from each spectrum and is described as a base line. In the pH range from 2.04 to 0.85, spectra were blue-shifted as indicated by the small decrease in absorption at 573 nm in the difference spectra (c). d and f, absorption differences at 573 nm (d) and at 530 nm (f) were plotted against pH ranging from 0.85 to 5.60 (Region I) and from 5.60 to 12.0 (Region II), respectively. The data in d were analyzed by the Henderson-Hasselbalch equation with two pKa values (Equation 1) as described in the gray line. The data in f were partially analyzed by the same equation, but the fitting resulted in poor convergence. The estimated pKa values were as follows; pK1a1 = 3.4, pK1a2 = 1.1, pK1a3 = 9 ∼ 10, and pK1a4 = 11 ∼ 12.
In Region I, the spectra were red-shifted until the pH reached 2.04 (528 → 543 nm), indicating the protonation of the primary counterion as is the case with the known proton-pumping rhodopsins (5, 20, 30–32). In the difference spectra shown in Fig. 5c, the largest absorbance change was observed at pH 2.04. In more acidic conditions, the spectral blue-shift was observed until the pH reached at 0.85 (543 → 540 nm). The absorbance changes at 573 nm are plotted as a function of pH (Fig. 5d). The pKa values were estimated by analysis with the Henderson-Hasselbalch equation (Equation 1 described under “Experimental Procedures”) and resulted in 3.4 and 1.1 for pK1a1 and pK1a2, respectively. The pK1a1 can be assigned as a pKa of the primary counterion because of the large absorption change with the spectral red shift as described above. Judging from the amino acid sequence identity between TR and the other proton pumps, the primary counterion is Asp-95 (Fig. 2), which corresponds to Asp-85 and Asp-97 in BR and PR, respectively. Therefore, the pKa of Asp-95 is determined to be 3.4. Because T. thermophilus lives in a neutral pH environment (pH 6 ∼ 7), Asp-95 is usually deprotonated at the physiological pH (33). The pK1a2 can be assigned as a pKa of the secondary counterion, Asp-229, in analogy with Asp-212 and Asp-227 in BR and PR, respectively (5, 30). Of note, TR is stable even in solution at pH 0.85 because the visible absorption spectrum almost completely coincided with the original one when the pH was returned to pH 5.6.
In Region II, the absorbance at 530 nm decreased with the increase in absorbance at 370 nm (Fig. 5e), which corresponds to the deprotonation of the Schiff base. The absorbance changes at 530 nm are plotted as a function of pH (Fig. 5f). The pH dependence seemed to be a complex titration curve, indicating that several dissociable residues are involved in the absorbance changes. Two pKa values were estimated; 9 ∼ 10 and 11 ∼ 12 for pK1a3 and pK1a4, respectively. The large absorbance change at pK1a4 enabled us to assign it as the pKa of the Schiff base in analogy to the other microbial rhodopsins. The pK1a3 was temporally assigned to His-61 located around the retinal chromophore and forming a salt bridge with Asp-95 in analogy with His-75 in PR (34), His-57 in E. sibiricum rhodopsin (32), and His-87 in GR (20). The pKa values obtained are summarized in Table 1.
To confirm the photocycle of TR, flash photolysis was measured at 25 °C (Fig. 6), and a schematic of the photocycle based on the results is shown (Fig. 6c). Fig. 6a shows the flash-induced light minus dark difference spectra of TR over the spectral range from 370 to 700 nm. Upon flashlight excitation, a photoproduct on the longer wavelength side (590 nm) appeared followed by a decrease in the absorbance at 530 nm and a slight increase in the absorbance at wavelengths shorter than 400 nm (Fig. 6a). According to the instrument conditions and the very small amplitude of this absorption band, the absorption maximum of the blue-shifted photoproduct is unclear. Judging from the absorption wavelength, the increase of the 590 nm band can be assigned to an N(O)-like intermediate (abbreviated as N(O) hereafter), from the analogy of PR-like proteins (12, 32, 35). The band at <400 nm would correspond to an M-like intermediate (M hereafter). The amount of the original state at 530 nm was decreased soon after the flashlight excitation and then recovered over time with a concomitant decrease in absorbance from 400 to 500 nm (increase in the magnitude of the negative band) (Fig. 6a). The absorption change in the 400–500-nm region may be due to the presence of an L-like intermediate (L hereafter) appearing before the M. In addition, the presence of a K-like intermediate appearing before the L is suggested because the absorption maximum in the difference spectrum at 5 ms is slightly red-shifted compared with the N(O), and it does not pass through an isosbestic point at around 552 nm (Fig. 6a).
FIGURE 6.
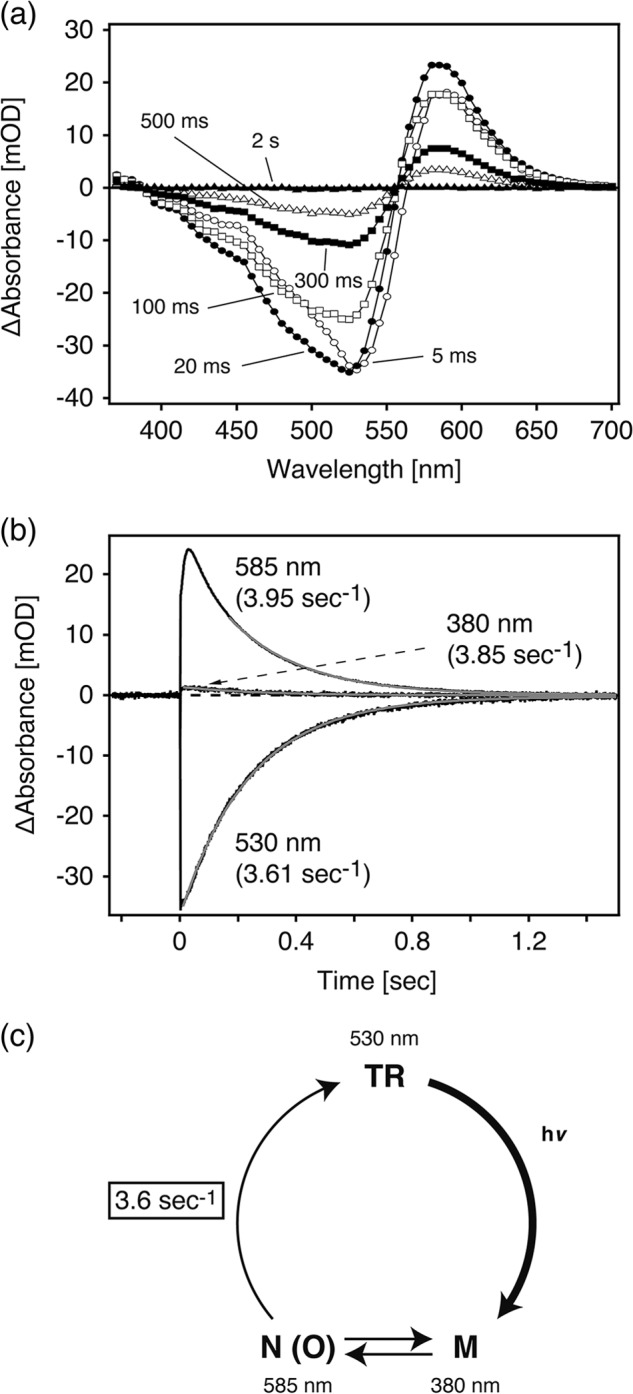
Photocycle kinetics of TR. a, shown are flash-induced light minus dark absorption spectra for the time range from 5 ms to 2 s. Purified TR was suspended in 50 mm Tris-HCl, pH 7.0, 1 m NaCl, and 0.05% DDM. The temperature was kept at 25 °C. b, shown are flash-induced photoreaction kinetics of absorbance changes at 530 nm representing the recovery of the original TR, 380 nm representing the M-decay, and 585 nm representing the N(O) decay. Traces described in black and gray are raw data and the fitting curve with a single exponential function, respectively. The rate constants of each intermediate and the original pigment are also described. The sample and temperature conditions were the same as described above. c, shown is a putative photocycle model of TR. After light absorption by the original TR, the M and the N(O) are formed, which were in equilibrium, and then the original state was recovered with a rate constant of ∼3.6 s−1 (time constant of 277 ms) at 25 °C.
Panel b in Fig. 6 shows the time courses of absorbance changes at selected wavelengths (380 nm for M, 585 nm for N(O), and 530 nm for the original (unphotolyzed) states). The M and N(O) decay rates were estimated as 3.85 s−1 (time constant; 260 ms) and 3.95 s−1 (253 ms) using a single exponential equation. The recovery rate is also estimated as 3.61 s−1 (277 ms), which is much smaller than that of ion pumping rhodopsins such as BR (∼ 100 s−1 (10 ms)) (5) and is close to that of sensory rhodopsins such as SrSRI (6 s−1 (167 ms)) (22) and of NpSRII (1.66 s−1 (602 ms)) (36). This slow photocycle is thought to be particularly important because a key difference between transport and sensory rhodopsins is the much slower kinetics of the photochemical reaction cycle of the sensors (37, 38). The ion-pumping rhodopsins (BR, halorhodopsin, and PR) have been optimized for fast photocycling rates to make them efficient pumps (39). The reason for this apparent discrepancy can be explained by the temperature dependence of the photocycle described below.
We also performed similar experiments at higher temperatures, which are more physiological conditions for TR. Fig. 7a shows the flash-induced absorption changes at 530 nm (the original TR), 380 nm (the M), and 585 nm (the N(O)). Because of the relatively smaller amount of the M, the data of 380 nm were not used for analysis. In general, the temperature rise leads to faster photoreaction because of the thermal reaction. The rate constants for the recovery of the original state became 20-fold faster at 50 °C (68.7 s−1 (14.5 ms)) than 25 °C (3.61 s−1 (277 ms)). The rate constant at 50 °C was almost the same as that of the known ion pumps described above. To obtain the thermodynamic parameters, the rate constants for the recovery of the original TR were plotted against the reciprocal temperature, as shown in Fig. 7b. For comparison, similar experiments were performed for the other BR-like proton pumps from H. walsbyi (HwBR) and H. sodomense (AR3) and a PR-like proton pump from G. violaceus (GR). All of them, HwBR, AR3, and GR, can be obtained as recombinant proteins using E. coli cells and established to have the proton pumping activity in previous reports (18, 25, 40). In addition, these molecules can be successfully purified from the membrane using the detergent DDM (12, 18, 40). These properties allow us to analyze the protein stability in the same solution condition, which is essential for the comparative studies because, in general, the protein stability depends on the environmental conditions including environmental pH, ionic strength, and the presence of the detergent. Although, PR could be a candidate protein, PR has both protonated and deprotonated counterions at pH 7.0 due to the relatively high pKa value of the counterion Asp-97 (pKa = 6.8) (30). The equilibrium of the two conformers in PR at neutral pH makes it difficult to compare the stability with other rhodopsins having only the deprotonated counterion. The plot was analyzed with the Eyring equations (see Equation 2 and 3 described under “Experimental Procedures”) to estimate the thermodynamic parameters listed in Table 2. The activation energy, Ea, value for TR (12.6 kcal/mol) was larger than those for HwBR (8.69 kcal/mol), AR3 (9.40 kcal/mol), and GR (9.10 kcal/mol), indicating the higher activation energy during the photocycle of TR. The high Ea value for TR is explained by the high ΔH‡o value (12.0 kcal/mol for TR, 8.09 kcal/mol for HwBR, 8.81 kcal/mol for AR3, and 8.50 kcal/mol for GR), which suggests the importance of hydrophilic interactions in the vicinity of the chromophore for the recovery to the original state.
FIGURE 7.
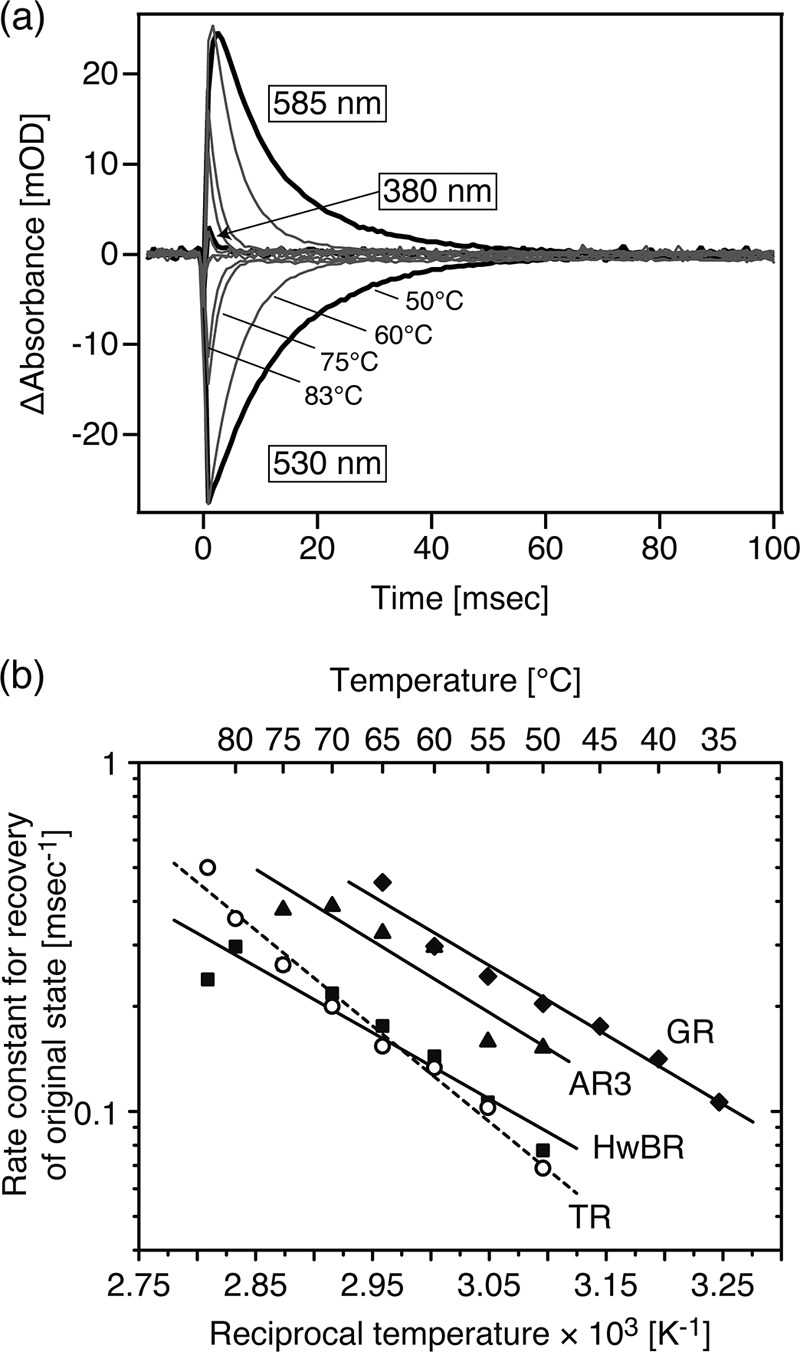
Temperature-induced change in photocycle kinetics of TR. a, shown are photocycle kinetics of TR at various temperatures (50–83 °C). The sample conditions were the same as described in Fig. 6, except for the temperature. The data for the recovery of the original state were used for the kinetic analysis. b, shown are Arrhenius plots for the recovery of the original TR (open circles), HwBR (squares), and AR3 (triangles), and GR (diamonds). The data for each sample were analyzed by Equation 2 and Equation 3 to calculate the thermodynamic parameters listed in Table 2. The fitting curve for TR is described as a broken line.
TABLE 2.
Thermodynamic parameters estimated of the recovery of the original pigment in TR, HwBR, and AR3*
Values for ΔH‡o, ΔG‡o, and TΔS‡o were evaluated at 300 K.
| Retinal proteins | Ea | ΔH‡o | ΔG‡o | TΔS‡o |
|---|---|---|---|---|
| kcal/mol | kcal/mol | kcal/mol | kcal/mol | |
| TR | 12.6 | 12.0 | 15.9 | −3.95 |
| HwBR | 8.69 | 8.09 | 15.5 | −7.41 |
| AR3 | 9.40 | 8.81 | 13.9 | −5.05 |
| GR | 9.10 | 8.50 | 15.0 | −6.51 |
Thermal Stability of TR
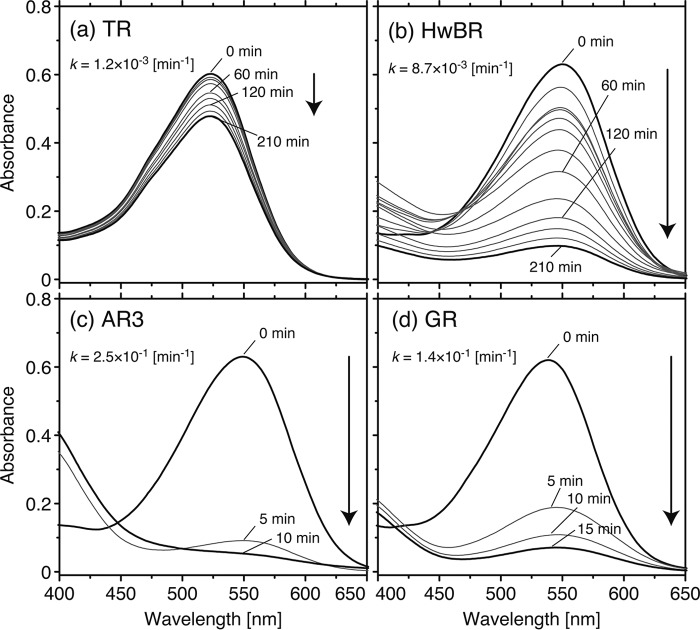
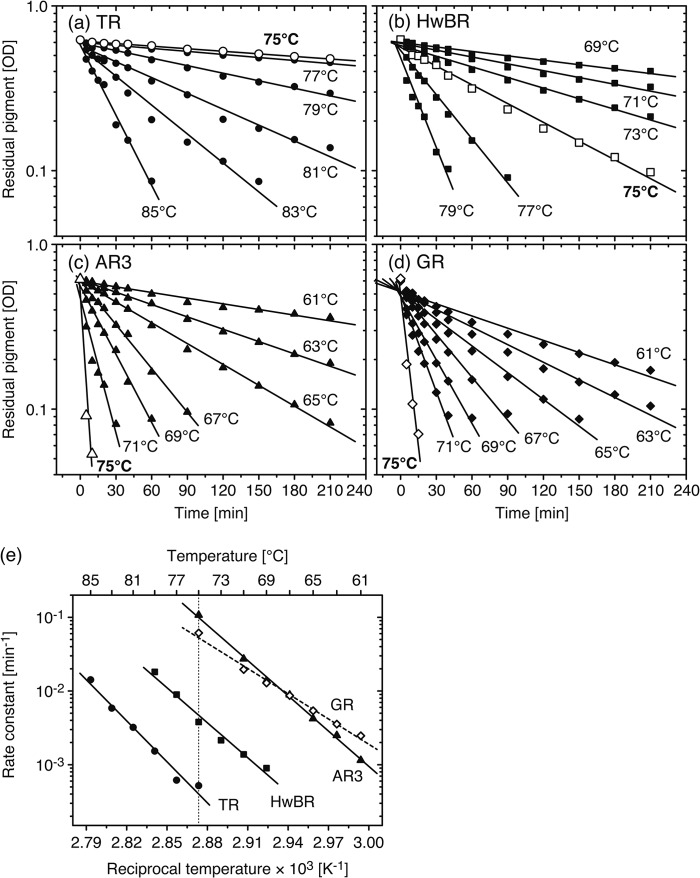
It is expected that TR has a high stability against heat because of the living environment for T. thermophilus (73–77 °C) (17, 33). To investigate the thermal stability of TR, the time-dependent thermal denaturation was monitored by UV-visible spectroscopy. In this experiment, two BR-like proton-pumping rhodopsins, HwBR and AR3, and one PR-like proton-pumping rhodopsin, GR, were used as references. Fig. 8 shows the time-dependent decrease in the absorbance of TR, HwBR, AR3, and GR at 75 °C. AR3 and GR lost absorbance at 550 and 540 nm, respectively, within 10 min (Fig. 8, c and d). With the decrease in absorbance at 550 nm for AR3 and at 540 nm for GR, the absorbance at 360 nm corresponding to liberated retinal was concomitantly increased. HwBR held the absorbance at 550 nm during the 210-min incubation time; however, ∼85% of HwBR was denatured and lost absorption (Fig. 8b), whereas, as shown in Fig. 8a, TR held the absorbance at 530 nm during the 210-min incubation time, and >85% of the protein retained the color. The denaturation rate (time) constants were estimated using a single exponential function (see Equation 4 described under “Experimental Procedures”) and resulted in 1.2 × 10⁻³ min−1 (836 min) for TR, 8.7 × 10⁻³ min−1 (114 min) for HwBR, 2.5 × 10⁻¹ min−1 (4.0 min) for AR3, and 1.4 × 10⁻¹ min−1 (7.1 min) for GR. These results indicate that TR is much more stable than the other 3 rhodopsins at 75 °C.
FIGURE 8.
Time-dependent decrease in the absorbance at 530 nm for TR (a), 550 nm for HwBR (b), 550 nm for AR3 (c), and at 540 nm for GR (d). The temperature was kept at 75 °C. The denaturation rate constants, k (min−1), are shown in each panel. Each sample was suspended in 50 mm Tris-HCl, pH 7.0, 1 m NaCl, and 0.05% DDM. The protein concentration of each sample was adjusted to ∼0.6 absorbance at each absorption maximum.
To determine the activation energy, we performed similar experiments under varying temperatures, as shown in Fig. 9. Panels a–d show the thermal denaturation kinetics of TR, HwBR, AR3, and GR, respectively. The temperature conditions were 75–85 °C for TR, 69–79 °C for HwBR, 61–75 °C for AR3, and 61–75 °C for GR. The residual amounts of active proteins were plotted logarithmically against the incubation time. The plots at 75 °C are commonly illustrated as white symbols. As mentioned above, the thermal denaturation rate, which is estimated from the slope of the fitting curve, of TR is the smallest at 75 °C (1.2 × 10⁻³ min−1). The denaturation rate constants of the samples estimated at each temperature are shown in Fig. 9e as a function of the reciprocal temperature. The Arrhenius plots (Fig. 9e) were fitted by a single exponential equation to estimate the activation energy, Ea. The Ea values resulted in a slightly larger value in TR (84.9 kcal/mol) than the other 3 rhodopsins (70.0, 73.1, and 52.3 kcal/mol for HwBR, AR3, and GR, respectively).
FIGURE 9.
Thermal stability of TR and the other rhodopsins. Denaturation kinetics of TR (circles, a), HwBR (squares, b), AR3 (triangles, c), and GR (diamonds, d) at various temperatures are shown. The data for open symbols of each sample are those at 75 °C. The sample conditions were the same as described for Fig. 8. The data were analyzed with a single exponential function (Equation 4) to calculate denaturation rate constants. e, shown are Arrhenius plots for the thermal denaturation of TR, HwBR, AR3, and GR. The fitting curve for GR is shown as a broken line. The data were analyzed by Equation 2 and Equation 3 to estimate the activation energy, Ea.
DISCUSSION
Similarities and Dissimilarities between TR and Other Microbial Rhodopsins
In this study, a microbial rhodopsin (TR) from a thermophilic organism was successfully expressed in E. coli cells and was characterized by mainly spectroscopic methods. This is the first report on a rhodopsin derived from a thermophile. Through these experiments, several significant similarities and dissimilarities of the properties of TR compared with other microbial rhodopsins, PR and BR, were revealed, as summarized in Table 1.
Absorption Maximum
The absorption maxima of rhodopsins were optimized by nature to mediate their biological functions as efficient photoactive proteins. TR showed a relatively blue-shifted absorption maximum (530 nm) compared with other microbial rhodopsins such as HwBR, AR3, and GR (Figs. 4a and 8). In general, the absorption maximum is related to the wavelength of light in environments where the organisms are living. We have previously identified the residues responsible for the color-tuning among various microbial rhodopsins, such as BR, HwBR, AR3, and sensory rhodopsin I (SRI), which show the color purple, and such as sensory rhodopsin II (SRII) and middle rhodopsin, which show the color orange (41–44). On the basis of these results, we speculate that Ser-129 (in helix-D) as well as Phe-159 and Tyr-164 (both in helix-E) (Fig. 2) are involved in the spectral blue-shift of TR.
Retinal Configurations
TR has only all-trans-retinal, which is well known to be an active isomer in all of the microbial rhodopsins (Fig. 4b) (45). The property is similar to PR-like proteins not BR-like ones (Table 1). This might be explained by the structure of the retinal binding site. Because the all-trans form is the most stable isomer in the solution, the chromophore binding cavity in TR would be less restricted to the retinal compared with the BR-like proteins.
Estimated pK1a Values of the Charged Residues in the Vicinity of the Chromophore
From the pH titration experiments, four pKa values in TR were revealed (Table 1). At the acidic Region I, two pKa values, pK1a1 and pK1a2, were tentatively assigned to be the protonation of two aspartates around the PSB, Asp-95 for pK1a1 of 3.4 and Asp229 for pK1a2 of 1.1, respectively (Fig. 5d). These values are very similar to those of BR (2.6 for Asp-85, less than 1 for Asp-212) (5) but not PR (6.8 for Asp-97, 3.3 for Asp-227) (30), indicating that the hydrogen bonding network around the PSB of TR is similar to BR, not to PR, beyond the sequence similarity between TR and PR (see the Introduction).
Photocycle Kinetics
In the millisecond time region, TR exhibited a photocycle with intermediates and kinetics characteristic of PR-like proteins, except for the lifetime (Fig. 6). Due to the large activation energy (12.6 kcal/mol), it highly depends on the temperature, compared with HwBR, AR3, and GR (see Table 2 and Fig. 7b). Because the photocycling rate positively coincides with the proton pumping activity, TR would have been optimized by nature to have high activity at a high temperature.
Thermal Stability of TR
As shown in Figs. 8 and 9, TR was proven to have a much higher thermal stability than the other three pigments, HwBR, AR3, and GR. One of the reasons for the slow denaturation rate of TR is the relatively larger activation energy, Ea (84.9 kcal/mol), than the others (70.0, 73.0, and 52.2 kcal/mol for HwBR, AR3, and GR, respectively). However, because TR is much more stable than HwBR (∼10-fold), AR3 (∼200-fold), and GR (∼100-fold) at 75 °C, it is difficult to explain the difference in stability by the slightly larger value of Ea. The Arrhenius equation gives the dependence of the rate constant, k, of a chemical reaction on the absolute temperature (T), pre-exponential factor (A), the activation energy (Ea), and the Universal gas constant (R) as follows (Equation 5),
Because the values R and T are constant, the high thermal stability of TR can be explained by the smaller value for the Arrhenius pre-exponential factor, A, compared with the others. This might be a general phenomenon not only among the microbial rhodopsins but also among membrane-embedded proteins.
How is TR so stable at the molecular level? The amino acid sequence of TR was compared with those of HwBR, AR3, and GR (Fig. 2). As can be seen, the variety of amino acid sequences among the four rhodopsins makes it difficult to determine which is the essential part for the high stability of TR. Thus the molecular origin of the high stability of TR is still unclear. However, it is of interest to study the basis for the high stability of TR, which is our next focus.
In conclusion, we present the first characterization of a proton-pumping rhodopsin TR from an extreme thermophile, T. thermophilus. TR was expressed well (2 mg/liter culture) as a recombinant protein having only all-trans-retinal as a chromophore, and it is much more stable than the other microbial proton pumping rhodopsins at high temperatures. Photocycle kinetics and pKa values of the charged residues of TR were determined by spectroscopic measurements. Although the molecular mechanism of the high stability is still unclear, TR should be a useful protein for research not only on proton transport, but also on membrane proteins.
Acknowledgments
We thank Yukie Kawase and Dr. Jin Yagasaki for technical assistance in sample preparation.
This work was supported by Japanese Ministry of Education, Culture, Sports, Science, and Technology Grants 23687019 and 23657100 (to Y. S).
- PSB
- protonated Schiff base
- BR
- bacteriorhodopsin
- TR
- thermophilic rhodopsin
- HwBR
- BR from H. walsbyi
- AR3
- archaerhodopsin-3
- GR
- Gloeobacter rhodopsin
- DDM
- n-dodecyl-β-d-maltoside
- PR
- proteorhodopsin
- SR
- sensory rhodopsin.
REFERENCES
- 1. Spudich J. L., Jung K.-H. (2005) in Handbook of Photosensory Receptors (Briggs W. R., Spudich J. L., eds) pp. 1–23, Wiley-VCH Verlag, Weinheim, Germany [Google Scholar]
- 2. Sharma A. K., Spudich J. L., Doolittle W. F. (2006) Microbial rhodopsins. Functional versatility and genetic mobility. Trends Microbiol. 14, 463–469 [DOI] [PubMed] [Google Scholar]
- 3. Jung K.-H. (2007) The distinct signaling mechanisms of microbial sensory rhodopsins in archaea, eubacteria, and eukarya. Photochem. Photobiol. 83, 63–69 [DOI] [PubMed] [Google Scholar]
- 4. Brown L. S., Jung K.-H. (2006) Bacteriorhodopsin-like proteins of eubacteria and fungi. The extent of conservation of the haloarchaeal proton-pumping mechanism. Photochem. Photobiol. Sci. 5, 538–546 [DOI] [PubMed] [Google Scholar]
- 5. Balashov S. P. (2000) Protonation reactions and their coupling in bacteriorhodopsin. Biochim. Biophys. Acta 1460, 75–94 [DOI] [PubMed] [Google Scholar]
- 6. Lanyi J. K. (2004) Bacteriorhodopsin. Annu. Rev. Physiol. 66, 665–688 [DOI] [PubMed] [Google Scholar]
- 7. Brown L. S. (2004) Fungal rhodopsins and opsin-related proteins. Eukaryotic homologues of bacteriorhodopsin with unknown functions. Photochem. Photobiol. Sci. 3, 555–565 [DOI] [PubMed] [Google Scholar]
- 8. Béjà O., Aravind L., Koonin E. V., Suzuki M. T., Hadd A., Nguyen L. P., Jovanovich S. B., Gates C. M., Feldman R. A., Spudich J. L., Spudich E. N., DeLong E. F. (2000) Bacterial rhodopsin. Evidence for a new type of phototrophy in the sea. Science 289, 1902–1906 [DOI] [PubMed] [Google Scholar]
- 9. Yoshizawa S., Kawanabe A., Ito H., Kandori H., Kogure K. (2012) Diversity and functional analysis of proteorhodopsin in marine Flavobacteria. Environ. Microbiol. 14, 1240–1248 [DOI] [PubMed] [Google Scholar]
- 10. Delong E. F., Béjà O. (2010) The light-driven proton pump proteorhodopsin enhances bacterial survival during tough times. PLoS Biol. 8, e1000359. [DOI] [PMC free article] [PubMed] [Google Scholar]
- 11. Balashov S. P., Imasheva E. S., Boichenko V. A., Antón J., Wang J. M., Lanyi J. K. (2005) Xanthorhodopsin. A proton pump with a light-harvesting carotenoid antenna. Science 309, 2061–2064 [DOI] [PMC free article] [PubMed] [Google Scholar]
- 12. Miranda M. R., Choi A. R., Shi L., Bezerra A. G., Jr., Jung K.-H., Brown L. S. (2009) The photocycle and proton translocation pathway in a cyanobacterial ion-pumping rhodopsin. Biophys. J. 96, 1471–1481 [DOI] [PMC free article] [PubMed] [Google Scholar]
- 13. Petrovskaya L. E., Lukashev E. P., Chupin V. V., Sychev S. V., Lyukmanova E. N., Kryukova E. A., Ziganshin R. H., Spirina E. V., Rivkina E. M., Khatypov R. A., Erokhina L. G., Gilichinsky D. A., Shuvalov V. A., Kirpichnikov M. P. (2010) Predicted bacteriorhodopsin from Exiguobacterium sibiricum is a functional proton pump. FEBS Lett. 584, 4193–4196 [DOI] [PubMed] [Google Scholar]
- 14. Sharma A. K., Zhaxybayeva O., Papke R. T., Doolittle W. F. (2008) Actinorhodopsins. Proteorhodopsin-like gene sequences found predominantly in non-marine environments. Environ. Microbiol. 10, 1039–1056 [DOI] [PubMed] [Google Scholar]
- 15. Ikeura Y., Shimono K., Iwamoto M., Sudo Y., Kamo N. (2003) Arg-72 of pharaonis phoborhodopsin (sensory rhodopsin II) is important for the maintenance of the protein structure in the solubilized states. Photochem. Photobiol. 77, 96–100 [DOI] [PubMed] [Google Scholar]
- 16. Sudo Y., Yamabi M., Iwamoto M., Shimono K., Kamo N. (2003) Interaction of Natronobacterium pharaonis phoborhodopsin (sensory rhodopsin II) with its cognate transducer probed by increase in the thermal stability. Photochem. Photobiol. 78, 511–516 [DOI] [PubMed] [Google Scholar]
- 17. Murugapiran S. K., Huntemann M., Wei C.-L., Han J., Detter J. C., Han C. S., Erkkila T. H., Teshima H., Chen A., Kyrpides N., Mavrommatis K., Markowitz V., Szeto E., Ivanova N., Pagani I., Lam J., McDonald A. I., Dodsworth J. A., Pati A., Goodwin L., Peters L., Pitluck S., Woyke T., Hedlund B. P. (2013) Whole genome sequencing of Thermus oshimai JL-2 and Thermus thermophilus JL-18, incomplete denitrifiers from the United States Great Basin. Genome Announc. 1, e00106-e0010612 [DOI] [PMC free article] [PubMed] [Google Scholar]
- 18. Sudo Y., Ihara K., Kobayashi S., Suzuki D., Irieda H., Kikukawa T., Kandori H., Homma M. (2011) A microbial rhodopsin with a unique retinal composition shows both sensory rhodopsin II and bacteriorhodopsin-like properties. J. Biol. Chem. 286, 5967–5976 [DOI] [PMC free article] [PubMed] [Google Scholar]
- 19. Ihara K., Umemura T., Katagiri I., Kitajima-Ihara T., Sugiyama Y., Kimura Y., Mukohata Y. (1999) Evolution of the archaeal rhodopsins. Evolution rate changes by gene duplication and functional differentiation. J. Mol. Biol. 285, 163–174 [DOI] [PubMed] [Google Scholar]
- 20. Tsukamoto T., Kikukawa T., Kurata T., Jung K.-H., Kamo N., Demura M. (2013) Salt bridge in the conserved His-Asp cluster in Gloeobacter rhodopsin contributes to trimer formation. FEBS Lett. 587, 322–327 [DOI] [PubMed] [Google Scholar]
- 21. Sudo Y., Okada A., Suzuki D., Inoue K., Irieda H., Sakai M., Fujii M., Furutani Y., Kandori H., Homma M. (2009) Characterization of a signaling complex composed of sensory rhodopsin I and its cognate transducer protein from the eubacterium Salinibacter ruber. Biochemistry 48, 10136–10145 [DOI] [PubMed] [Google Scholar]
- 22. Kitajima-Ihara T., Furutani Y., Suzuki D., Ihara K., Kandori H., Homma M., Sudo Y. (2008) Salinibacter sensory rhodopsin. Sensory rhodopsin I-like protein from a eubacterium. J. Biol. Chem. 283, 23533–23541 [DOI] [PMC free article] [PubMed] [Google Scholar]
- 23. Jencks W. P. (1987) Catalysis in Chemistry and Enzymology, pp. 599–614, Courier Dover Publications, Inc., New York [Google Scholar]
- 24. Oesterhelt D., Stoeckenius W. (1973) Functions of a new photoreceptor membrane. Proc. Natl. Acad. Sci. U.S.A. 70, 2853–2857 [DOI] [PMC free article] [PubMed] [Google Scholar]
- 25. Kawanabe A., Furutani Y., Jung K.-H., Kandori H. (2009) Engineering an inward proton transport from a bacterial sensor rhodopsin. J. Am. Chem. Soc. 131, 16439–16444 [DOI] [PubMed] [Google Scholar]
- 26. Kralj J. M., Bergo V. B., Amsden J. J., Spudich E. N., Spudich J. L., Rothschild K. J. (2008) Protonation state of Glu142 differs in the green- and blue-absorbing variants of proteorhodopsin. Biochemistry 47, 3447–3453 [DOI] [PubMed] [Google Scholar]
- 27. Balashov S. P., Lanyi J. K. (2007) Xanthorhodopsin. Proton pump with a carotenoid antenna. Cell. Mol. Life Sci. 64, 2323–2328 [DOI] [PMC free article] [PubMed] [Google Scholar]
- 28. Ikeda D., Furutani Y., Kandori H. (2007) FTIR study of the retinal Schiff base and internal water molecules of proteorhodopsin. Biochemistry 46, 5365–5373 [DOI] [PubMed] [Google Scholar]
- 29. Oesterhelt D., Meentzen M., Schuhmann L. (1973) Reversible dissociation of the purple complex in bacteriorhodopsin and identification of 13-cis and all-trans-retinal as its chromophores. Eur. J. Biochem. 40, 453–463 [DOI] [PubMed] [Google Scholar]
- 30. Tamogami J., Kikukawa T., Nara T., Shimono K., Demura M., Kamo N. (2012) Photoinduced proton release in proteorhodopsin at low pH. The possibility of a decrease in the pKa of Asp-227. Biochemistry 51, 9290–9301 [DOI] [PubMed] [Google Scholar]
- 31. Imasheva E. S., Balashov S. P., Wang J. M., Lanyi J. K. (2006) pH-dependent transitions in xanthorhodopsin. Photochem. Photobiol. 82, 1406–1413 [DOI] [PMC free article] [PubMed] [Google Scholar]
- 32. Balashov S. P., Petrovskaya L. E., Lukashev E. P., Imasheva E. S., Dioumaev A. K., Wang J. M., Sychev S. V., Dolgikh D. A., Rubin A. B., Kirpichnikov M. P., Lanyi J. K. (2012) Aspartate-histidine interaction in the retinal Schiff base counterion of the light-driven proton pump of Exiguobacterium sibiricum. Biochemistry 51, 5748–5762 [DOI] [PMC free article] [PubMed] [Google Scholar]
- 33. Hedlund B. P., McDonald A. I., Lam J., Dodsworth J. A., Brown J. R., Hungate B. A. (2011) Potential role of Thermus thermophilus and T. oshimai in high rates of nitrous oxide (N2O) production in ∼80 °C hot springs in the US Great Basin. Geobiology 9, 471–480 [DOI] [PubMed] [Google Scholar]
- 34. Bergo V. B., Sineshchekov O. A., Kralj J. M., Partha R., Spudich E. N., Rothschild K. J., Spudich J. L. (2009) His-75 in proteorhodopsin, a novel component in light-driven proton translocation by primary pumps. J. Biol. Chem. 284, 2836–2843 [DOI] [PMC free article] [PubMed] [Google Scholar]
- 35. Dioumaev A. K., Brown L. S., Shih J., Spudich E. N., Spudich J. L., Lanyi J. K. (2002) Proton transfers in the photochemical reaction cycle of proteorhodopsin. Biochemistry 41, 5348–5358 [DOI] [PubMed] [Google Scholar]
- 36. Sudo Y., Iwamoto M., Shimono K., Kamo N. (2001) pharaonis phoborhodopsin binds to its cognate truncated transducer even in the presence of a detergent with a 1:1 stoichiometry. Photochem. Photobiol. 74, 489–494 [DOI] [PubMed] [Google Scholar]
- 37. Yan B., Takahashi T., Johnson R., Spudich J. L. (1991) Identification of signaling states of a sensory receptor by modulation of lifetimes of stimulus-induced conformations. The case of sensory rhodopsin II. Biochemistry 30, 10686–10692 [DOI] [PubMed] [Google Scholar]
- 38. Hoff W. D., Jung K. H., Spudich J. L. (1997) Molecular mechanism of photosignaling by archaeal sensory rhodopsins. Annu. Rev. Biophys. Biomol. Struct. 26, 223–258 [DOI] [PubMed] [Google Scholar]
- 39. Sudo Y., Spudich J. L. (2006) Three strategically placed hydrogen-bonding residues convert a proton pump into a sensory receptor. Proc. Natl. Acad. Sci. U.S.A. 103, 16129–16134 [DOI] [PMC free article] [PubMed] [Google Scholar]
- 40. Sudo Y., Okazaki A., Ono H., Yagasaki J., Sugo S., Kamiya M., Reissig L., Inoue K., Ihara K., Kandori H., Takagi S., Hayashi S. (2013) A blue-shifted light-driven proton pump for neural silencing. J. Biol. Chem. 288, 20624–20632 [DOI] [PMC free article] [PubMed] [Google Scholar]
- 41. Shimono K., Ikeura Y., Sudo Y., Iwamoto M., Kamo N. (2001) Environment around the chromophore in pharaonis phoborhodopsin. Mutation analysis of the retinal binding site. Biochim. Biophys. Acta 1515, 92–100 [DOI] [PubMed] [Google Scholar]
- 42. Shimono K., Hayashi T., Ikeura Y., Sudo Y., Iwamoto M., Kamo N. (2003) Importance of the broad regional interaction for spectral tuning in Natronobacterium pharaonis phoborhodopsin (sensory rhodopsin II). J. Biol. Chem. 278, 23882–23889 [DOI] [PubMed] [Google Scholar]
- 43. Sudo Y., Yuasa Y., Shibata J., Suzuki D., Homma M. (2011) Spectral tuning in sensory rhodopsin I from Salinibacter ruber. J. Biol. Chem. 286, 11328–11336 [DOI] [PMC free article] [PubMed] [Google Scholar]
- 44. Mori A., Yagasaki J., Homma M., Reissig L., Sudo Y. (2012) Investigation of the chromophore binding cavity in the 11-cis acceptable microbial rhodopsin MR. Chem. Phys. 419, 23–29 [Google Scholar]
- 45. Spudich J. L., Yang C. S., Jung K. H., Spudich E. N. (2000) Retinylidene proteins. Structures and functions from archaea to humans. Annu. Rev. Cell Dev. Biol. 16, 365–392 [DOI] [PubMed] [Google Scholar]
- 46. Luecke H., Schobert B., Stagno J., Imasheva E. S., Wang J. M., Balashov S. P., Lanyi J. K. (2008) Crystallographic structure of xanthorhodopsin, the light-driven proton pump with a dual chromophore. Proc. Natl. Acad. Sci. U.S.A. 105, 16561–16565 [DOI] [PMC free article] [PubMed] [Google Scholar]
- 47. Yoshitsugu M., Shibata M., Ikeda D., Furutani Y., Kandori H. (2008) Color change of proteorhodopsin by a single amino acid replacement at a distant cytoplasmic loop. Angew. Chem. Int. Ed. Engl. 47, 3923–3926 [DOI] [PubMed] [Google Scholar]
- 48. Marti T., Rösselet S. J., Otto H., Heyn M. P., Khorana H. G. (1991) The retinylidene Schiff base counterion in bacteriorhodopsin. J. Biol. Chem. 266, 18674–18683 [PubMed] [Google Scholar]


