

Background: Lrig1 is a negative regulator of oncogenic receptor tyrosine kinases.
Results: Lrig3 opposes Lrig1 negative regulatory action and enhances ErbB receptor stability.
Conclusion: Lrig1 and Lrig3 oppose one another.
Significance: Despite structural homology, Lrig1 and Lrig3 are functionally distinct.
Keywords: Epidermal Growth Factor Receptor (EGFR), Protein Degradation, Receptor Tyrosine Kinase, Signal Transduction, Tumor Suppressor Gene, Lrig1, Lrig3, Growth Factor
Abstract
Lrig1 is the founding member of the Lrig family of transmembrane leucine-rich repeat proteins, which also includes Lrig2 and Lrig3. Lrig1 is a negative regulator of oncogenic receptor tyrosine kinases, including ErbB and Met receptors, and promotes receptor degradation. Lrig1 has recently emerged as both a tumor suppressor and a key regulator of epidermal and epithelial stem cell quiescence. Despite this, little is known of the mechanisms by which Lrig1 is regulated. Lrig3 was recently reported to increase ErbB receptor expression suggesting that it may function in a manner opposite to Lrig1. In this study, we explore the interaction between Lrig1 and Lrig3 and demonstrate that Lrig1 and Lrig3 functionally oppose one another. Lrig3 opposes Lrig1 negative regulatory activity and stabilizes ErbB receptors. Conversely, Lrig1 destabilizes Lrig3, limiting Lrig3's positive effects on receptors and identifying Lrig3 as a new target of Lrig1. These studies provide new insight into the regulation of Lrig1 and uncover a complex cross-talk between Lrig1 and Lrig3.
Introduction
Lrig1 is a member of the Lrig family of transmembrane leucine-rich repeat proteins and is a negative regulator of several oncogenic receptor tyrosine kinases, including all members of the ErbB family (1–3), the Met (4) and Ret receptors (5). Although the precise mechanisms by which Lrig1 functions are not yet understood, Lrig1 has been found to enhance the lysosomal degradation of its receptor targets (1, 2, 4, 6). Lrig1 is broadly expressed in healthy tissue (7), but its expression is decreased in various human cancers, including renal cell carcinoma (8), cervical cancer (9), and breast cancer (3). In colorectal and prostate cancer, however, Lrig1 expression is noted to be heterogeneous (10, 11). Low expression of Lrig1 has been linked to poor prognosis in breast (12), head and neck (13), lung, and bladder cancers as well as glioma and melanoma (14) suggesting that Lrig1 may function as a tumor suppressor (15).
Relief of Lrig1-mediated negative regulation in Lrig1 knock-out mice leads to up-regulation of ErbB (16, 17) and Met (16) receptors in intestinal epithelium, underscoring the physiological significance of receptor negative regulation by Lrig1 (17). Interestingly, loss of Lrig1 leads to expansion of intestinal stem/progenitor cells, driving intestinal crypt hyperplasia that is rescued by EGF receptor inhibition (16). The first in vivo evidence that Lrig1 functions as a tumor suppressor was provided by Powell et al. (17). In this study, homozygous deletion of Lrig1 resulted in elevated ErbB receptor expression and highly penetrant duodenal adenomas (17).
The Lrig family includes two additional members, Lrig2 and Lrig3, of which much less is known. Although both Lrig2 and Lrig3 share a common domain organization with Lrig1, Lrig3 is the most homologous to Lrig1 (18). Lrig3 was recently demonstrated to interact with ErbB receptors, but unlike Lrig1, Lrig3 was found to increase receptor expression when ectopically expressed (18). However, the mechanisms by which Lrig3 functions have not been explored. Because Lrig1 and Lrig3 share an ability to interact with ErbB receptors, we hypothesized that Lrig1 and Lrig3 oppose one another. Functional opposition within protein families is often observed in cellular signaling and may have evolved as a means of autoregulation. For example, within the Smad family of transcriptional regulators, receptor activated Smads (R-Smads) are opposed by inhibitory Smads (I-Smads), fine-tuning TGFβ/bone morphogenic protein signaling (19).
In this study, we examine the functional interaction between Lrig1 and Lrig3. We find that Lrig3 opposes Lrig1 negative action by enhancing ErbB receptor protein stability. Conversely, Lrig1 limits Lrig3 positive action by destabilizing Lrig3. Collectively, our data reveal a previously unappreciated complexity within the Lrig family.
EXPERIMENTAL PROCEDURES
Reagents and Cell Culture
HEK293T and MCF-7 cell lines were cultured in Dulbecco's modified Eagle's medium (DMEM), 10% fetal calf serum (FCS). JIMT-1 cells were cultured in DMEM/F-12, 1 μg/ml insulin, and 10% FCS. CHO cells were cultured in F12K medium and 10% FCS. siRNAs were purchased from Dharmacon, and Lrig1 shRNA viral particles were purchased from Santa Cruz Biotechnology. Antibodies used in this study include anti-Lrig1–151 (Agrisera), anti-Lrig2 (the peptide CFDFSRTRNIQDGSEGT was synthesized by Washington Biotechnology and injected into rabbits. Serum from these animals was affinity-purified in house), anti-Lrig3 (from R&D Systems and Novus, recognizing extracellular and intracellular domains, respectively), anti-EGFR 1005 (Santa Cruz Biotechnology), anti-ErbB2 Ab3 (Calbiochem), anti-ErbB3 C17 (Santa Cruz Biotechnology), anti-ErbB4 C18 (Santa Cruz Biotechnology), anti-actin AC-15 (Sigma), anti-tubulin (Sigma), anti-HA (Roche Applied Science), and anti-Myc (9E10, Calbiochem).
Constructs, Transient Transfection, and Western Blot Analysis
Myc-tagged Lrig1 construct was generated as described previously (1). Lrig2 and Lrig3 are I.M.A.G.E. Consortium clones. Both constructs were subcloned into pcDNA-3.1. Lrig1 and Lrig3 mutant constructs were generated by PCR from the wild type plasmids described above. HA-tagged Lrig3 was generated by amplifying the Lrig3 nucleotide sequence with primers containing the HA epitope tag sequence. The amplicon was then cloned into pcDNA3.1, and its fidelity was verified by sequencing. All constructs were fully sequenced and verified to be correct. Where deletions or truncations have been made, the amino acid residues at the extreme end of each deletion or truncation are indicated in Figs. 9 and 11; numbering is according to NCBI reference sequence NP_056356 for the human Lrig1 protein sequence and NM_153377.4 for the human Lrig3 mRNA sequence. The ubiquitin knock-out construct (Ub-KO)3 was obtained from Addgene (Addgene plasmid 17603, see Ref. 20). Cells were transiently transfected using PolyJet (SignaGen) according to the manufacturer's instructions. In those experiments where two or more plasmids were co-transfected, equal amounts of each plasmid were used, unless otherwise noted, and total amounts of DNA transfected were 500 ng/well for 12-well plates and 5 μg/plate for 10-cm plates. Samples were resolved by SDS-PAGE (monomer concentration 8%), transferred to nitrocellulose, and blotted with indicated antibodies. Detection of all antibodies was carried out using horseradish peroxidase-conjugated secondary antibodies, followed by developing with SuperSignal West chemicals. An Alpha Innotech imaging station with FluorChem software was used to capture images. ImageJ software was used for densitometry.
FIGURE 9.

Lrig1 interaction with Lrig3. A, schematic of Lrig1 mutants. Wild type Lrig1 is shown at top. Δ-cyto lacks the cytoplasmic domain. Δ-ecto lacks the extracellular domain. Δ-Ig lacks the three immunoglobulin-like domains. Δ-LRR lacks the 15 leucine-rich repeat domains. Amino acid boundaries of the mutants are notated in the schematic. HEK293T cells were transfected with Lrig3 and vector control or Lrig1 (wild type and mutants) as indicated. Immunoprecipitation (IP) was performed, and lysates that served as the source for the immunoprecipitation (designated Input) were blotted as indicated (B). Lrig3 was precipitated, and precipitates were blotted for Lrig3 (C, bottom panel) or Myc-tagged Lrig1 (C, top panel).
FIGURE 11.

Lrig3 interaction with Lrig1. A, schematic of Lrig3 mutants. Wild type Lrig3 is shown at top. The Δ-cyto lacks the cytoplasmic domain. The Δ-ecto lacks the extracellular domain. The Δ-Ig lacks the three immunoglobulin-like domains. Amino acid boundaries of the mutants are noted in the schematic. HEK293T cells were transfected with Lrig1 and vector control or Lrig3 (wild type and mutants) as indicated. Immunoprecipitation (IP) was performed, and lysates that served as the source for the immunoprecipitation (designated Input) were blotted as indicated with tubulin shown as a loading control (B). Lrig1 was precipitated and precipitates were blotted for Lrig1 (C, bottom panel), and Lrig3 using two different antibodies, one was directed against the intracellular domain to detect Δ-ecto Lrig3 (C, middle panel) and one was directed against the extracellular domain to detect the other Lrig3 forms (C, top panel). D, HEK293T cells were co-transfected with Lrig3 (wild type and mutants) and either vector control or Lrig1. Representative Western blots from more than five experiments are shown with tubulin as a loading control.
Cycloheximide Experiments
48 h after transfection, HEK293T cells, plated in 12-well plates, were treated with cycloheximide (50 μg/ml) for various time points. Samples were then lysed and resolved using SDS-PAGE. Data from three independent experiments were quantified and averaged. Quantitative analysis was carried out using nonlinear regression analysis. Curves were fitted by the least squares method to a single-phase exponential decay function, and curve slopes were compared by an F-test to obtain p values.
siRNA and shRNA Knockdown
JIMT-1 cells were plated in 6-well plates and transfected with siRNA (pooled or individual) using Pepmute (SignaGen) according to the manufacturer's instructions. 96 h after transfection, cells were harvested. HEK293T cells were transduced with Lrig1 shRNA viral particles according to manufacturer's guidelines (Santa Cruz Biotechnology).
MTT
JIMT-1 cells were plated in 24-well plates and transfected with siRNA as described above. Cells were maintained in full serum conditions for the duration of the experiment. 96 h after transfection, 500 μl of MTT reagent (Sigma) was added to the medium at a concentration of 0.5 mg/ml. Crystals were dissolved in acidic isopropyl alcohol, and the absorption was measured at 570 nm with a base-line subtraction at 655 nm. Four points were averaged for each condition, and the experiment was repeated four individual times. The average for all experiments is reported.
Co-immunoprecipitation (CoIP)
For endogenous CoIPs, cells were plated in 15-cm plates and allowed to reach 90% confluency. After lysing in CoIP buffer (20 mm Tris, pH 7.4, 137 mm NaCl, 0.1% Nonidet P-40, 100 μm 4-(2-aminoethyl)benzenesulfonyl fluoride, and 4 μg/ml each aprotinin, leupeptin, and pepstatin), cleared lysates were precipitated with 4 μg of each of the noted antibodies. For exogenous CoIP, cells were plated in 10-cm plates and cleared lysates were precipitated with 2 μg of each of the noted antibodies.
Biotinylation
24 h after transfection, HEK293T cells, plated in 10-cm plates, were serum-starved (0.1% FBS) overnight. Cells were then treated with EGF (0.1 μg/ml) for various time points. At the end of each time point, cells were washed twice with ice-cold PBS and then incubated with 6 ml of biotin-X-NHS (0.5 mg/ml) in borate buffer (10 mm boric acid, 150 mm NaCl, pH 8.0) for 45 min. Biotin coupling was then terminated by washing two times with 50 mm NH4Cl/PBS. Samples were then lysed with RIPA buffer (50 mm Tris, 0.1% SDS, 1% Nonidet P-40, 0.5% SDS, 150 mm NaCl, 0.5 mm EDTA, 100 μm 4-(2-aminoethyl)benzenesulfonyl fluoride, and 4 μg/ml each of aprotinin, leupeptin, and pepstatin) and precipitated using 2 μg of EGFR antibody. Immunoprecipitated samples, run on SDS-PAGE, were blotted using streptavidin-HRP, and the inputs for each immunoprecipitation were blotted using EGFR antibody.
RESULTS
Lrig1 Negative Regulatory Function Is Unique among the Lrig Family
Lrig1 was first described as an ErbB negative regulator in 2004 (1, 2), and subsequent studies extended this role to the Met (4) and Ret (5) receptors. Whether Lrig2 and Lrig3 share any functional redundancy with Lrig1 has remained an important question. Lrig3 was recently shown to interact with EGFR, ErbB2, and ErbB4, but unlike Lrig1, ectopic expression of Lrig3 increased receptor expression (18). Interestingly, Lrig3 was reported in a separate study to decrease Xenopus FGF receptor expression, suggesting that Lrig3 function could be receptor- and/or context-dependent (21). In Fig. 1, the impact of the three Lrig proteins on ErbB receptor expression is directly compared. Each of the Lrigs was co-expressed with either EGFR (Fig. 1A) or ErbB2 (Fig. 1B) in HEK293T cells, and relative receptor expression was examined. Representative immunoblots are shown. As expected, Lrig1 decreased the expression of both receptors. Lrig2 had no significant effect on receptor expression, although Lrig3 increased expression of both receptors. Similar results were observed with ErbB3 and ErbB4 (Figs. 1C and 3). These data demonstrate that Lrig1 and Lrig3 have unique functions, distinct from one another and from Lrig2.
FIGURE 1.
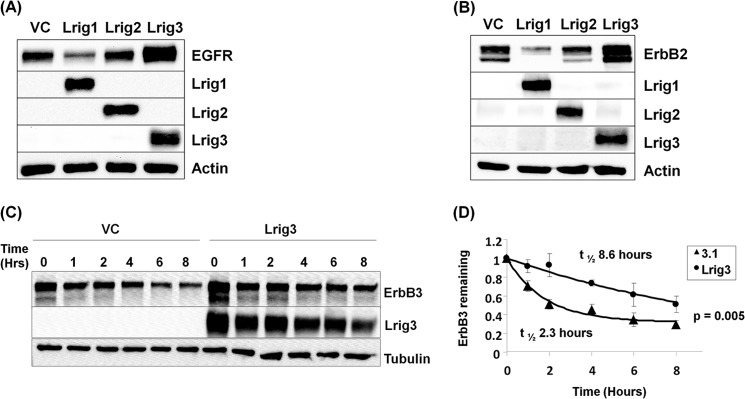
Lrig1 negative regulatory activity is unique among the Lrig family. HEK293T cells were transfected with either EGFR (A) or ErbB2 (B) and vector control, Lrig1, Lrig2 or Lrig3. The experiment was repeated more than five times, and a representative Western blot is shown. Actin is shown as a loading control (C). HEK293T cells were transfected with ErbB3 and vector control or Lrig3. Decay of ErbB3 protein was followed with a cycloheximide time course. The experiment was repeated three independent times, with a representative Western blot shown in C and quantification shown in D.
FIGURE 3.

Lrig1 and Lrig3 functionally oppose each other. HEK293T cells were transfected with either ErbB2 (A) or EGFR (B) and vector control, Lrig1, or Lrig3 under the indicated conditions. The experiment was repeated more than five times, and a representative Western blot is shown with tubulin as a loading control. HEK293T cells were transfected with ErbB2 (C) or ErbB4 (D and E) and vector control, Lrig1, Lrig3, or both. Total cell lysates were blotted as indicated, with actin shown as a loading control. Representative Western blots from more than five experiments are shown.
Lrig3 Stabilizes ErbB Receptors
Given that Lrig1 destabilizes receptors (1, 2), we next examined whether Lrig3 impacts receptor stability. ErbB3 was expressed with vector control or Lrig3 in HEK293T cells, and ErbB3 protein stability was examined using a cycloheximide time course. As shown in Fig. 1C, Lrig3 co-expression increased total ErbB3 expression (compare 1st lane with 7th lane) and significantly extended ErbB3 half-life from 2.3 to 8.6 h (Fig. 1D, p = 0.005). Lrig3 had no detectable effect on receptor transcript levels or mRNA stability as measured by quantitative PCR (data not shown) suggesting that Lrig3 functions post-transcriptionally. This provides the first evidence that Lrig3 impacts receptor protein stability in a manner opposite to Lrig1.
To examine the impact of Lrig3 on receptor in an endogenous setting, we silenced Lrig3 in JIMT-1 human breast cancer cells. JIMT-1 cells were chosen for this experiment because they are an ErbB2-positive cell line that also expresses the highest levels of Lrig3 transcript (as compared with 56 other breast cancer cell lines using the NextBio database). Indeed, Lrig3 is readily detectable by Western blotting in JIMT-1 cells (Fig. 2A, inset). Efficient silencing of Lrig3 was confirmed by Western blotting. Knockdown of Lrig3 decreased ErbB2 expression (Fig. 2A, inset and graph, p = 0.009) and decreased JIMT-1 cell proliferation (Fig. 2B, p = 0.006). Lrig3 knockdown had only a minor effect on ErbB2 transcript levels, again suggesting that Lrig3 functions predominantly post-transcriptionally (data not shown). To exclude off-target effects of the Lrig3 siRNA pool, the experiment was repeated with three individual siRNAs. In each case, depletion of Lrig3 decreased the expression of ErbB2 (representative blot shown in Fig. 2C with quantitation in Fig. 2D). Although the impact of Lrig3 knockdown on JIMT-1 proliferation was modest, Lrig3 knockdown inhibited JIMT-1 proliferation to a similar degree as direct inhibition of ErbB2 with 4557W, a small molecule kinase inhibitor (data not shown). Conversely, silencing of Lrig1 was previously found to increase ErbB2 expression and proliferation of ErbB2-positive breast cancer cells (3).
FIGURE 2.

Lrig3 enhances ErbB receptor expression. JIMT-1 cells were transfected with scramble control (SC) or Lrig3 siRNA (KD), and lysates were blotted as shown in the inset (A, representative blot). The experiment was repeated four times with ErbB2 quantification shown in the graph (A). JIMT-1 cells were subjected to an MTT assay, and the average of four independent experiments is shown in B. JIMT-1 cells were transfected with scramble control (SC) or Lrig3 siRNA (three independent oligonucleotides targeting three different regions of Lrig3). Representative Western blot is shown in C, and quantification of six independent experiments is shown in D.
Lrig1 and Lrig3 Functionally Oppose One Another
Unlike negative regulators such as c-Cbl, in which access to receptor targets is restricted by receptor activation state (22), Lrig1 interaction with receptors is constitutive (1, 2). Indeed, Lrig1 and Lrig3, respectively, decrease and increase ErbB receptor expression in the absence of exogenous receptor ligands (Fig. 3, A and B).
Because Lrig1 and Lrig3 both interact with ErbB receptors yet have opposite effects on receptor levels (Fig. 1), we hypothesized that Lrig1 and Lrig3 may functionally compete so that Lrig3 would limit Lrig1-mediated down-regulation of receptors. To explore this, we expressed ErbB receptors in HEK293T cells along with Lrig1, Lrig3, or Lrig1 and Lrig3 together. Representative immunoblots are shown in Fig. 3. Lrig1 decreased ErbB2 (Fig. 3C) and ErbB4 (Fig. 3D) levels, and Lrig3 increased the levels of both. When Lrig1 and Lrig3 were expressed together, receptor levels rebounded as Lrig3 levels were increased in the face of constant Lrig1, demonstrating that Lrig3 opposes Lrig1-mediated negative regulatory activity. To determine whether Lrig1 can oppose Lrig3, ErbB4 was expressed with Lrig3 or Lrig1 singly or together as shown in Fig. 3E. The stabilizing effect of Lrig3 on ErbB4 was completely overcome as Lrig1 levels were increased (Fig. 3E, compare 6th lane to 2nd lane). These data demonstrate that changes in the Lrig1/Lrig3 ratio are functionally important and may be one means by which Lrig1 effects on ErbB and other receptor targets are regulated. Of note, Lrig3 increased ErbB2 and ErbB4 levels but had no effect on Lrig1 expression, demonstrating specificity of Lrig3 action.
Interestingly, Lrig1 reproducibly decreased Lrig3 expression in these experiments (compare 3rd with 4th lanes in Fig. 3, C and D, and 2nd with 4th lanes in Fig. 3E) suggesting that Lrig3 may be a target of Lrig1 negative regulatory action. Because Lrig1 opposes the positive effects of Lrig3 while decreasing Lrig3 expression, this suggests that the two are functionally linked.
We next examined Lrig1 and Lrig3 interaction with ErbB2 to determine whether Lrig3 impacted the formation of Lrig1-ErbB2 complexes. ErbB2 was expressed in HEK293T cells with Lrig1 +/− Lrig3, as shown in Fig. 4. ErbB2 was immunoprecipitated, and precipitates were blotted for ErbB2, Lrig1, and Lrig3. The experiment was repeated six times and quantified by densitometry (Fig. 4C). We found that the amount of Lrig1 precipitating with ErbB2 reproducibly decreased when Lrig3 was co-expressed, coincident with the detection of Lrig3 in ErbB2 precipitates. This suggests that one mechanism by which Lrig3 functions is to restrict ErbB receptor interaction with Lrig1. However, when Lrig3 was knocked down in HEK293T cells, there was no significant increase in Lrig1-ErbB2 interaction (data not shown). Therefore, although our data indicate that Lrig1 and Lrig3 functionally oppose one another (Fig. 3), it is not clear whether this is linked to remodeling of ErbB-Lrig complexes.
FIGURE 4.
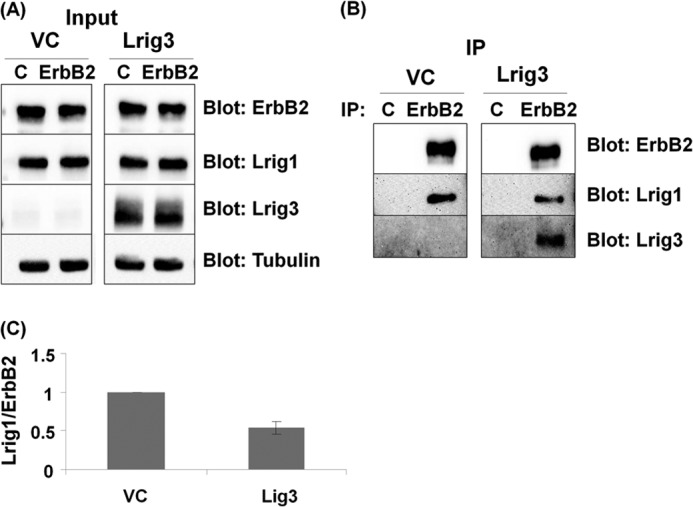
Lrig3 disrupts ErbB2-Lrig1 complexes. HEK293T cells were co-transfected with ErbB2, Lrig1, and vector control or Lrig3. Immunoprecipitation (IP) was performed, and lysates that served as the source for the immunoprecipitation (designated Input) were blotted as indicated (A). Lysates were precipitated with control or ErbB2 antibodies, and precipitates were blotted for ErbB2, Lrig1, and Lrig3 (B). The amount of Lrig1 precipitating with ErbB2 was quantified by densitometry and expressed as the Lrig1/ErbB2 ratio. Data from six independent experiments are shown in C.
Given the complexity of the interaction between Lrig1, Lrig3, and their receptor targets, we asked what effect Lrig1 depletion has on Lrig3 activity. Two independent pooled clones of HEK293T cells were generated in which endogenous Lrig1 was depleted by greater than 65% with shRNA (Fig. 5B). As shown in Fig. 5A, in both pooled clones, Lrig1 depletion led to increased expression of ErbB3 (compare 1st with 3rd and 5th with 7th lanes) and Lrig3 (compare 2nd with 4th and 6th with 8th lanes), providing further evidence that both are targets of Lrig1 negative regulatory action. Lrig3 maintained its ability to increase ErbB3 expression in Lrig-depleted cells (compare 3rd with 4th and 7th with 8th lanes). These data suggest that although Lrig3 limits Lrig1 negative regulatory action (Fig. 3), it may also function in an Lrig1-independent manner.
FIGURE 5.
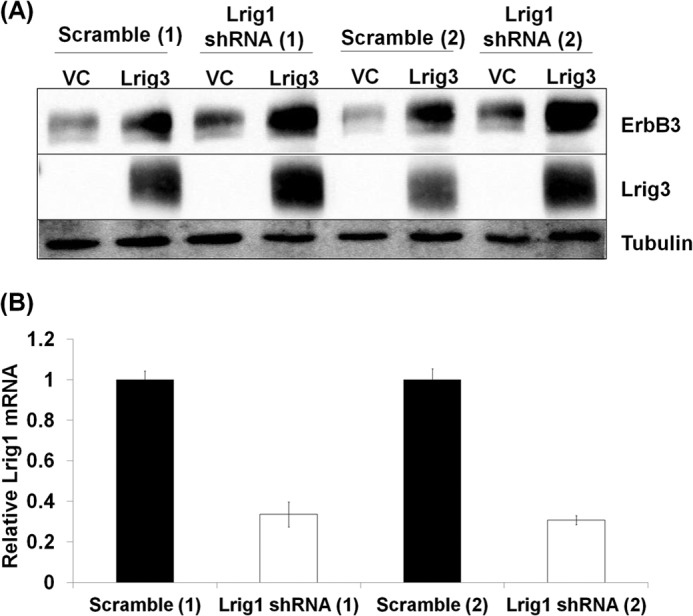
Lrig3 stabilizes ErbB3 in Lrig1-depleted cells. Two distinct stable pooled clones of HEK293T cells (Scramble 1 and 2 and Lrig1 shRNA 1 and 2) were transfected with ErbB3 and vector control or Lrig3. A, total cell lysates were blotted as indicated with tubulin shown as a loading control. A representative Western blot from three independent experiments is shown. B, total Lrig1 mRNA levels were quantified for each of the stable pooled clones using quantitative PCR.
Lrig3 Is an Lrig1 Target
To further characterize the interaction between Lrig1 and Lrig3, we examined whether Lrig1 and Lrig3 physically interact by co-immunoprecipitation analysis. MCF7 and MDA-MB-231 breast cancer cells were chosen for the co-immunoprecipitation assay because they both express endogenous Lrig1 and Lrig3. Relative expression in the two cell lines is shown in Fig. 6A. Because of the sensitivity of commercially available Lrig3 antibodies, we were unable to blot endogenous Lrig3 in Lrig1 immunoprecipitates. However, endogenous Lrig1 was readily blotted in Lrig3 immunoprecipitates, as shown in Fig. 6, B and C, indicating that the two proteins form a stable complex.
FIGURE 6.
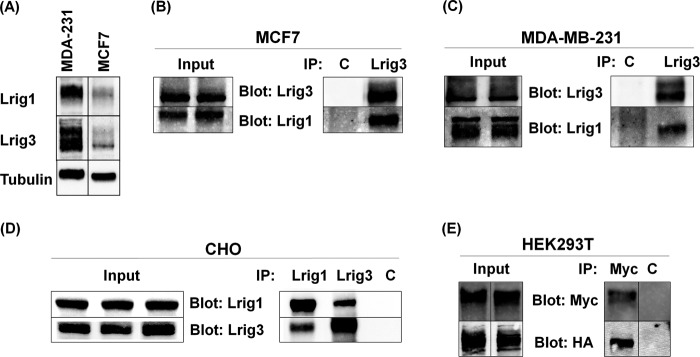
Lrig1 and Lrig3 co-immunoprecipitate. Lysates from MCF7 and MDA-MB-231 cells were blotted for Lrig1 and Lrig3 with tubulin shown as a loading control (A). Cell lysates from MCF7 (B), MDA-MB-231 (C), and CHO (D) cells were precipitated with control, Lrig1, or Lrig3 antibodies. Precipitates were blotted as indicated. E, HEK293T cells transfected with Myc-Lrig1 and HA-Lrig3 were precipitated with control or Myc antibodies and blotted for Myc or HA. Lysates that served as the source for immunoprecipitation (designated Input) were blotted as indicated, shown in the left panel for B–E.
Because both Lrig1 and Lrig3 have been reported to interact with ErbB receptors, we next examined whether ErbB receptors are required for Lrig1/3 complex formation. CHO cells were used for this experiment because they are an ErbB-null cell line (23, 24). CHO cells were transfected with Lrig1 and Lrig3, and expression of transfected proteins was confirmed by Western blotting of cell lysates. As shown in Fig. 6D, Lrig1-Lrig3 interactions were readily detected by co-immunoprecipitation analysis in CHO cells, demonstrating that Lrig1/3 interaction does not require ErbB receptors. We also separately examined Lrig1-Lrig3 interaction using antibodies to epitope tags to rule out the possibility that cross-reaction of Lrig antibodies was leading to an artifact. As shown in Fig. 6E, when Lrig1 was precipitated using anti-Myc antibodies, HA-tagged Lrig3 was readily and specifically detected in the precipitates.
Because Lrig1 decreases Lrig3 expression (Fig. 3), we examined whether Lrig1 decreases Lrig3 half-life. As shown in Fig. 7, co-expression of Lrig1 with Lrig3 in HEK293T cells significantly shortens Lrig3 protein half-life from 6.9 to 1.8 h (p = 0.03), demonstrating that Lrig3 is a target of Lrig1-mediated proteolysis. Interestingly, Lrig1 also decreases Lrig2 expression, but the effect on Lrig3 is reproducibly more pronounced (data not shown).
FIGURE 7.

Lrig3 is a target of Lrig1-mediated proteolysis. HEK293T cells were transfected with Lrig3 and vector control (left side of A) or Lrig3 and Lrig1 (right side of A). Lrig3 was transfected at a 5-fold excess relative to Lrig1 to ensure sufficient Lrig3 signal for the experiment. Decay of Lrig3 protein was followed with a cycloheximide time course. The experiment was repeated three independent times, with a representative Western blot shown in A. Two different exposures of Lrig3 are shown in A. Lrig3 half-life was quantified in B.
To further investigate Lrig1-mediated regulation of Lrig3, we asked whether polyubiquitination was involved. In prior studies, Lrig1 expression was associated with increased EGF receptor ubiquitination (1, 2), and in another study, Lrig1 expression did not enhance the ubiquitination of the Met receptor (4). Because a correlation between Lrig1 expression and ubiquitination does not imply causation, we made use of a functional mutant of ubiquitin termed Ub-KO (20). Ub-KO has all seven lysines involved in polyubiquitin chain elongation mutated to arginine and therefore can form monoubiquitin but not polyubiquitin linkages. Ub-KO functions in a dominant negative fashion with respect to the endogenous ubiquitin pool and can therefore be used to determine whether polyubiquitination is required for a particular function (4). As shown in Fig. 8A, Lrig3 was expressed with either vector control or Ub-KO. Interestingly, Ub-KO led to the stabilization of Lrig3 (Fig. 8A, compare 1st with 2nd lane) and Lrig1 (compare 3rd with 4th lane) indicating that polyubiquitination is involved in restricting their expression. However, Ub-KO had no effect on the efficiency with which Lrig1 down-regulated Lrig3, demonstrating the independence of this process from polyubiquitination (compare 1st with 3rd and 2nd with 4th lanes). These results are in agreement with what was previously found for the Met receptor (4). To determine whether this is also true for EGFR and ErbB2, the same experiment was performed. As shown in Fig. 8, B and C, Ub-KO dramatically stabilized both EGFR and ErbB2 but had no effect on the ability of Lrig1 to down-regulate either, again demonstrating the independence of this process from polyubiquitination. Therefore, although polyubiquitination plays a role in limiting Lrig3, EGFR, and ErbB2 expression, it is not involved in Lrig1-mediated down-regulation of these targets. While eliminating polyubiquitination as functionally important in Lrig1's mechanism, these studies do not allow us to address whether monoubiquitination is important.
FIGURE 8.
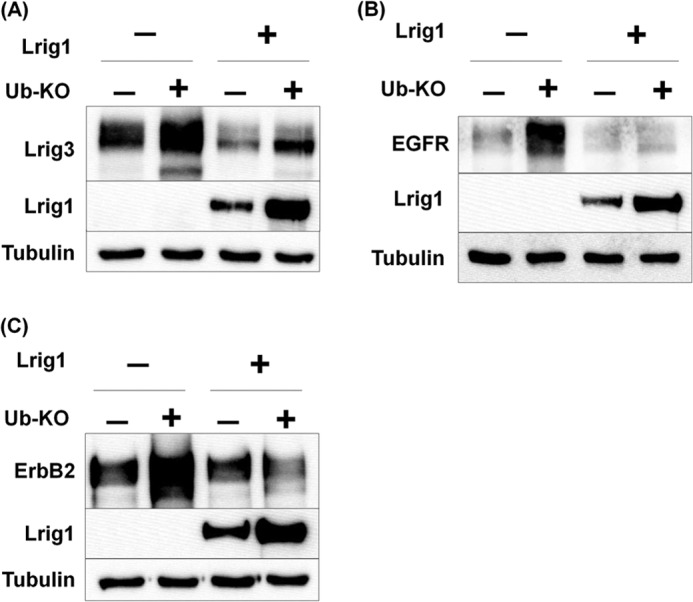
Polyubiquitination is not involved in Lrig1-mediated down-regulation of its substrates. HEK293T cells were transfected with either Lrig3 (A), EGFR (B), or ErbB2 (C) and vector control, Ub-KO, Lrig1, or both as indicated. The experiment was repeated more than three independent times. A representative Western blot is shown with tubulin as a loading control.
Structure-Function Analysis of Lrig1 and Lrig3
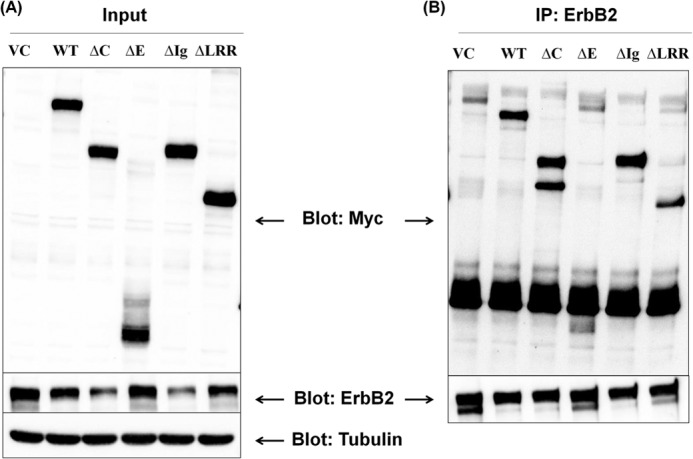
We next conducted a deletion analysis of Lrig1 to determine which domains are required for Lrig1 interaction with Lrig3. A diagram of the four Lrig1 mutants is shown in Fig. 9A with full-length Lrig1 portrayed at the top. The four Lrig1 mutants include Δ-cyto, lacking the cytoplasmic domain, Δ-ecto, lacking the extracellular domain, Δ-LRR, lacking the 15 leucine-rich repeats of the extracellular domain, and Δ-Ig, lacking the three immunoglobulin-like domains of the extracellular domain. HEK293T cells were co-transfected with Myc-tagged Lrig1 constructs (wild type or mutant as indicated) and Lrig3. Lrig3 was immunoprecipitated, and the precipitates were examined for Lrig3 (Fig. 9C, bottom panel) as well as the presence of various Myc-tagged Lrig1 proteins (Fig. 9C, top panel). Cell lysates are shown in Fig. 9B and confirm the expression of Lrig3 (bottom panel) as well as each of the Lrig1 mutants (top panel).
Several important points emerge from this aspect of the study. First, wild type Lrig1 and the Δ-cyto and Δ-Ig mutants are similarly efficient in decreasing Lrig3 expression, although Δ-ecto and Δ-LRR mutants have less activity compared with wild type Lrig1. The results with Δ-cyto-Lrig1 are particularly notable because a previous study reported that Lrig1 recruited the ubiquitin ligase c-Cbl through its cytoplasmic domain (2). These authors concluded that the cytoplasmic domain of Lrig1 was essential for its negative regulatory function and that c-Cbl was intimately involved in the Lrig1 mechanism through ubiquitination of Lrig1-interacting proteins. However, subsequent studies from our group revealed that Cbl knockdown had no effect on Lrig1 activity toward the Met receptor (4), calling into question the role of Cbl and, by extension, the Lrig1 cytoplasmic domain in Lrig1 action. In agreement with our results, Lee et al. (25) recently reported that the Met-targeting antibody SAIT301 promotes an Lrig1-dependent but c-Cbl-independent lysosomal degradation of the Met receptor. Our current results with Δ-Cyto-Lrig1 demonstrate unequivocally that the cytoplasmic domain of Lrig1 is not required for the following: (a) complex formation with Lrig3 and (b) Lrig3 suppression, revising the model of Lrig1 function. These results are supported by the recent finding that wild type Lrig1 and Δ-Cyto-Lrig1 have a similar ability to inhibit the growth of glioma cells (26). To pursue this further, we performed the same experiment examining Lrig1 interaction with ErbB2, and again, we found that the Δ-cyto Lrig1 mutant was fully active in suppressing ErbB2 expression (Fig. 10, discussed below).
FIGURE 10.
Lrig1 interaction with ErbB2. HEK293T cells were transfected with ErbB2 and vector control or Lrig1 (wild type and mutants) as indicated. Immunoprecipitation (IP) was performed, and lysates that served as the source for the immunoprecipitation (designated input) were blotted as indicated (A). ErbB2 was precipitated, and precipitates were blotted for ErbB2 (B, bottom panel) or Myc-tagged Lrig1 (B, top panel).
Fig. 9 demonstrates that the extracellular domain of Lrig1 is required for stable interaction with Lrig3 because no complex can be detected between the Δ-ecto mutant and Lrig3, despite expression of Δ-ecto in lysates (Fig. 9B, 4th lane). (Note that Δ-ecto runs below the IgG heavy chain so it is not obscured in the blot in Fig. 9C.) Δ-ecto activity toward Lrig3 is also diminished (but not ablated) when compared with wild type Lrig1, perhaps due to weak interaction. Both Δ-Ig and Δ-LRR interact with Lrig3, demonstrating that either element of the extracellular domain is sufficient for this interaction. However, the activity of Δ-LRR is diminished, although Δ-Ig maintains the same activity as wild type Lrig1. Because soluble Lrig1 has no effect on receptor expression (27), we can conclude that for full activity, Lrig1 must be membrane-anchored and contain the leucine-rich repeat domains, although the cytoplasmic domain and Ig domains appear to be dispensable for Lrig1 function. Because Δ-LRR still interacts with Lrig3, its lack of activity is not likely due to weak interaction.
As mentioned above, we also examined the interaction of Lrig1 mutants with ErbB2. HEK293T cells were co-transfected with Myc-tagged Lrig1 constructs (wild type or mutant as indicated) and ErbB2. ErbB2 was immunoprecipitated, and the precipitates were examined for ErbB2 (Fig. 10B, bottom panel) as well as the presence of various Myc-tagged Lrig1 proteins (Fig. 10B, top panel). Cell lysates are shown in Fig. 10A and confirm the expression of ErbB2 (bottom panel) as well as each of the Lrig1 mutants (top panel). The results obtained with ErbB2 parallel the results obtained with Lrig3. The Δ-cyto and Δ-Ig mutants are fully active in repressing ErbB2 expression (Fig. 10A), and both interact with ErbB2 (Fig. 10B), providing further evidence that these domains are dispensable for Lrig1 function. The Δ-ecto has a very modest effect on ErbB2 expression and does not appear to stably interact with ErbB2 (note that the smear running below the heavy chain in Fig. 10B runs higher than the Δ-ecto mutant). Because both Δ-LRR and Δ-Ig interact with ErbB2, we can conclude that either element of the extracellular domain is sufficient for receptor interaction, as observed with Lrig3. In the case of ErbB2, Δ-LRR appears to maintain some activity, although it is less active than the Δ-cyto and Δ-Ig mutants. Overall, our results regarding key structural elements of Lrig1 are in agreement with a previous study that examined Lrig1 interaction with the EGF receptor (2). However, in the previous study, the functional activity of Lrig1 mutants was not examined.
We next conducted a deletion analysis of Lrig3 to determine which domains of Lrig3 are required for interaction with Lrig1. A diagram of the Lrig3 mutants is shown in Fig. 11A with full-length Lrig3 displayed on top. We were unable to detect protein expression of Δ-LRR-Lrig3, so this mutant is not included in our experiments. As shown in Fig. 11B, Lrig1 interacted with wild type Lrig3 as well as with the Δ-cyto and Δ-Ig mutants. We were unable to detect a complex between Lrig1 and the Δ-ecto form of Lrig3 despite evidence of Δ-ecto expression in lysates. This pattern of interaction correlates well with what was observed for Lrig1 (Fig. 9) and indicates that the cytoplasmic and Ig domains of Lrig1 and Lrig3 are dispensable for interaction, although the ecto domains of both are required for stable complex formation (i.e. detectable in a co-precipitation assay). We also examined the impact of Lrig1 on the expression of Lrig3 mutants. As shown in Fig. 11D, Lrig1 decreased the expression of all forms of Lrig3 including the Δ-ecto mutant. Because Δ-ecto Lrig1 had some residual activity toward Lrig3 (and ErbB2) (Figs. 9 and 10), this suggests that although the ecto-domain provides the primary interaction interface, interaction is not abolished by ecto-domain removal. Alternatively, physical interaction may not be required for functional interaction.
Given the availability of the Lrig3 mutants, we next examined the impact of these mutants on ErbB3 expression (Fig. 12). ErbB3 was expressed in HEK293T cells along with vector control, wild type Lrig3, or the three Lrig3 mutants. As expected, wild type Lrig3 increased ErbB3 expression as did the Δ-Ig mutant. The Δ-ecto had only a modest effect on ErbB3 expression, here again emphasizing the importance of the ecto domain for Lrig family member function. All three experiments testing the importance of the Ig domain (Figs. 9, 10, and 12) indicate that it is dispensable. Of note, the Δ-cyto mutant of Lrig3 was unable to stabilize ErbB3, and in fact, in multiple experiments, it led to decreased ErbB3 expression, suggesting that it functions in a dominant negative manner. The functional dependence (Lrig3) or lack thereof (Lrig1) on the cytoplasmic domain highlights an important distinction between Lrig1 and Lrig3.
FIGURE 12.
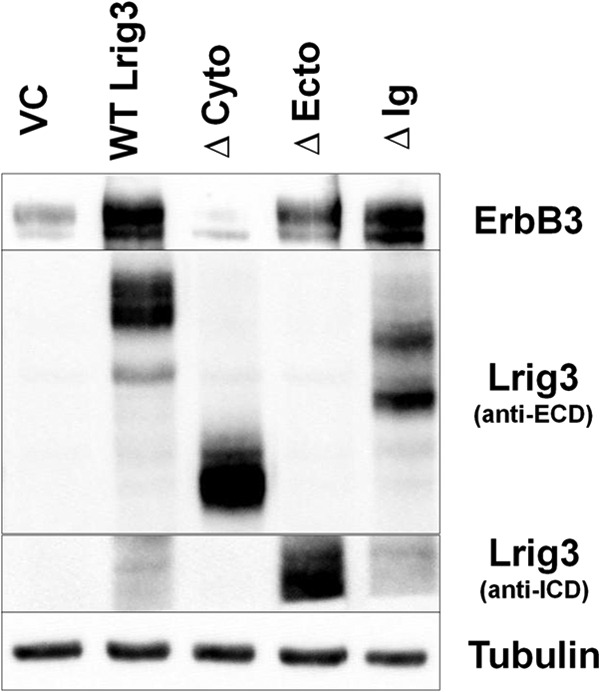
Structure-function analysis of Lrig3. HEK293T cells were co-transfected with ErbB3, vector control, and Lrig3 (wild type and mutants). Representative Western blots from more than five experiments are shown with tubulin as a loading control.
Lrig1 Promotes EGF Receptor Internalization
In a previous study, Lrig1 knockdown in keratinocytes led to a marked increase in the cell surface expression of EGF receptor (28) suggesting that Lrig1 may promote receptor internalization. Although the EGF receptor is known to signal from endosomal compartments (29), recent studies indicate that the bulk of oncogenic receptor signaling occurs at the plasma membrane (30, 31). This has led to the suggestion that therapeutics targeting EGF receptor should focus on surface-localized receptors and/or receptors in the earliest stages of trafficking (32). Hence, perturbations in mechanisms controlling the removal of receptor from the cell surface may contribute to EGF receptor-driven oncogenesis. Because EGF receptor accumulates at the cell surface when Lrig1 is depleted (28), we asked whether Lrig1 is involved in receptor internalization. EGF receptor was expressed in HEK293T cells with vector control, full-length Lrig1, or the Δ-ecto mutant of Lrig1. Cells were stimulated with EGF for the time points shown, and receptor remaining at the cell surface was labeled by biotinylation, immunoprecipitated, and detected by Western blotting with streptavidin-linked horseradish peroxidase. As shown in Fig. 13, EGF stimulation led to a time-dependent loss of cell surface EGF receptor, as expected, and this was augmented by co-expression of full-length Lrig1, demonstrating that Lrig1 promotes EGF receptor internalization. Interestingly, Δ-ecto Lrig1 also promoted receptor internalization but reproducibly had less of an effect than full-length Lrig1, in agreement with its diminished activity in all other assays. These data suggest that Lrig1's negative regulatory activity is due at least in part to its ability to promote receptor internalization.
FIGURE 13.
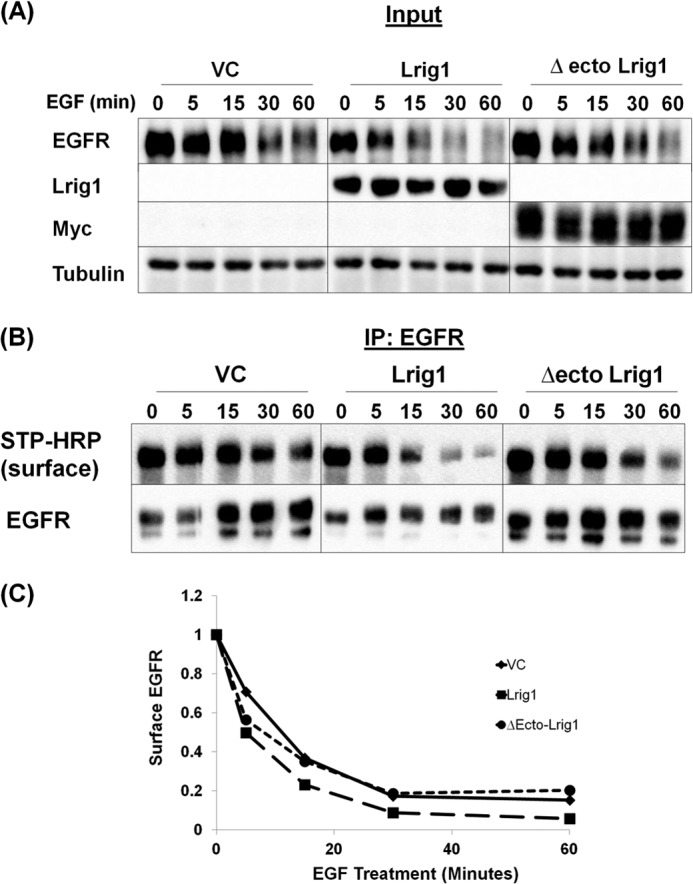
Lrig1 increases EGFR internalization. HEK293T cells were co-transfected with EGFR and vector control, Lrig1, or Δecto-Lrig1. Cells were treated with EGF for the indicated time points, and surface proteins were biotinylated. Immunoprecipitation (IP) was performed, and lysates that served as the source for the immunoprecipitation (designated Input) were blotted as indicated (A). EGFR was immunoprecipitated, and samples were blotted with anti-EGFR or streptavidin-HRP (STP-HRP) (B). Representative Western blots from more than six experiments are shown. Quantification of the experiment in B is shown in C. Lrig1 consistently accelerated the internalization of EGFR.
DISCUSSION
Lrig1 has recently emerged as an essential regulator of stem cell homeostasis with loss of Lrig1 perturbing both epidermal and epithelial stem cell dynamics (16, 17, 33). Furthermore, Lrig1 is now recognized as a bona fide tumor suppressor with knock-out mice demonstrating ErbB receptor up-regulation and duodenal adenomas (17). However, little is known of the mechanisms regulating Lrig1 negative regulatory activity. Lrig1 interaction with ErbB receptors was previously shown to be ligand-independent (1, 2) indicating that receptor activation does not likely play a role in augmenting or limiting Lrig1 recruitment. Interestingly, Lrig1 was recently reported to shed its ectodomain through ADAM17/TACE-mediated proteolysis (26). The shed ectodomain was found to act in a paracrine fashion, inhibiting EGF receptor signaling on neighboring cells through interference with EGF binding (26, 27). Because our data with the Δ-ecto mutant indicates that ectodomain shedding would substantially diminish Lrig1 activity in the cell from which it is shed, shedding may be one means by which Lrig1 activity is restricted. Of note, ADAM17 has also been implicated in shedding of EGF-like growth factors (34, 35). This suggests that ADAM17 may promote local ErbB receptor signaling in two ways as follows: through growth factor release, promoting autocrine signaling, and through Lrig1 inactivation in these same cells, promoting growth factor receptor accumulation. However, soluble Lrig1 released by ADAM17 could conceivably linger once cleaved, thereby limiting autocrine signaling.
In this study, we find that the negative regulatory activity of Lrig1 is unique among the Lrig family, with no evidence of functional redundancy when family members are directly compared. Rather, Lrig3 acts in a manner opposite to Lrig1, enhancing ErbB receptor stability. However, Lrig3 activity is attenuated by Lrig1-mediated proteolytic degradation of Lrig3, underscoring the complexity of Lrig family dynamics. Our study suggests that Lrig1 and Lrig3 may have evolved to functionally oppose one another when expressed in the same cell. Lrig1 was recently found to be an estrogen-stimulated gene (12). Exploration of the Gene Expression Omnibus Database indicates that Lrig3 is repressed by estrogen whereas Lrig1 expression is enhanced (GDS3217 and GDS3283, see Ref. 12). This is also reflected in lower expression of Lrig3 in estrogen receptor-positive breast cancer as compared with estrogen receptor-negative breast cancer (www.nci.nih.gov) and publicly available Oncomine data. Therefore, differential regulation of gene expression may be one mechanism by which the Lrig1/Lrig3 ratio is fine tuned. Given that Lrig3 stabilizes oncogenic receptor tyrosine kinases, it is unlikely to function as a tumor suppressor as recently found for Lrig1. However, caution must be exercised in this interpretation because so little is known of Lrig3 targets.
Our study also forces a revision of the model for Lrig1 mechanism of action. Gur et al. (2) reported that c-Cbl binds to amino acids 900–939 within the cytoplasmic domain of Lrig1 and that Cbl recruitment underlies Lrig1's ability to mediate receptor degradation. However, subsequent studies using Cbl siRNA suggested that Cbl was not required for Lrig1 function (4, 6). A more recent study reinforced this, reporting that SAIT301-mediated Met degradation is Lrig1-dependent but c-Cbl-independent (24). The full functionality of the Δ-cyto Lrig1 mutant provides compelling evidence that c-Cbl is not involved in Lrig1 function. In fact, we have found that Δ-cyto Lrig1 is reproducibly more efficient in decreasing ErbB receptor expression, suggesting that the cytoplasmic domain may instead limit Lrig1 function. Moreover, dominant negative Cbl does not interfere with the ability of Δ-cyto Lrig1 to destabilize EGFR.4 Interestingly, removal of the cytoplasmic domain of Lrig3 renders it incapable of stabilizing ErbB3. Instead, the Δ-cyto Lrig3 mutant consistently decreases the expression of co-expressed ErbB3, suggesting it functions as a dominant negative. Future study will focus on understanding how the cytoplasmic domain contributes to Lrig3 function.
The three Ig-like domains in the Lrig1 ectodomain are functionally inert because their removal has no effect on interaction with or suppression of ErbB2 and Lrig3. The Ig-like domains also appear to be functionally inert in Lrig3. This is surprising as the Ig-like domains are the most highly conserved between Lrig1 and Lrig3 (72% identity (18)). Interestingly, removal of the leucine-rich repeats appears to attenuate Lrig1 activity toward ErbB2/Lrig3 despite stable complex formation, indicating that complex formation and negative regulatory activity may be functionally separable. As previous studies found that soluble Lrig1 does not decrease ErbB receptor expression (26, 27), we conclude that for efficient negative regulatory activity, Lrig1 requires at a minimum the transmembrane and leucine-rich repeat domains.
How might Lrig1 engage the internalization and receptor proteolysis machinery (known to be located in the cytoplasm) in the absence of a cytoplasmic domain? One possibility is that Lrig1 interacts with a third component through its transmembrane and LRR domains, and this third component recruits the proteolysis machinery to the Lrig1-receptor complex. In this case, the primary interaction interface for the third component would be the LRR domains; however, there would be residual interaction through the transmembrane domain, explaining the diminished but not abolished activity of the Δ-ecto mutant (Fig. 14).
FIGURE 14.

Summary of structure-function analysis. A, summary of structure-function analysis of Lrig1 and Lrig3. B, based on published cited studies and experiments conducted within, we propose that Lrig1 engages the receptor proteolysis machinery through another component(s). The model proposes that the unknown component(s) are recruited through interaction with the leucine-rich repeats of Lrig1. The cytoplasmic domain of the unknown component(s) recruit the receptor proteolysis machinery (black double arrow) to the Lrig1-receptor complex. The receptor proteolysis machinery then acts on the receptor (dark gray curved arrow) to promote its internalization and degradation.
In summary, despite their close homology and overlapping interaction partners, Lrig1 and Lrig3 have diverse functions, and they may play opposing roles in development and disease.
Acknowledgments
We thank Shadd Cabalatungan for dedicated technical assistance. We thank Jason Hatakeyama for advice in molecular cloning.
This work was supported, in whole or in part, by National Institutes of Health Grants CA118384 (to C. S.) and CA123541 (to K. L. C. III).
H. Rafidi and C. Sweeney, unpublished observations.
- Ub-KO
- ubiquitin knock-out construct
- EGFR
- epidermal growth factor receptor
- CoIP
- co-immunoprecipitation
- MTT
- 3-(4,5-dimethylthiazol-2-yl)-2,5-diphenyltetrazolium bromide
- LRR
- leucine-rich repeat.
REFERENCES
- 1. Laederich M. B., Funes-Duran M., Yen L., Ingalla E., Wu X., Carraway K. L., 3rd, Sweeney C. (2004) The leucine-rich repeat protein LRIG1 is a negative regulator of ErbB family receptor tyrosine kinases. J. Biol. Chem. 279, 47050–47056 [DOI] [PubMed] [Google Scholar]
- 2. Gur G., Rubin C., Katz M., Amit I., Citri A., Nilsson J., Amariglio N., Henriksson R., Rechavi G., Hedman H., Wides R., Yarden Y. (2004) LRIG1 restricts growth factor signaling by enhancing receptor ubiquitylation and degradation. EMBO J. 23, 3270–3281 [DOI] [PMC free article] [PubMed] [Google Scholar]
- 3. Miller J. K., Shattuck D. L., Ingalla E. Q., Yen L., Borowsky A. D., Young L. J., Cardiff R. D., Carraway K. L., 3rd, Sweeney C. (2008) Suppression of the negative regulator LRIG1 contributes to ErbB2 overexpression in breast cancer. Cancer Res. 68, 8286–8294 [DOI] [PMC free article] [PubMed] [Google Scholar]
- 4. Shattuck D. L., Miller J. K., Laederich M., Funes M., Petersen H., Carraway K. L., 3rd, Sweeney C. (2007) LRIG1 is a novel negative regulator of the Met receptor and opposes Met and Her2 synergy. Mol. Cell. Biol. 27, 1934–1946 [DOI] [PMC free article] [PubMed] [Google Scholar]
- 5. Ledda F., Bieraugel O., Fard S. S., Vilar M., Paratcha G. (2008) Lrig1 is an endogenous inhibitor of Ret receptor tyrosine kinase activation, downstream signaling, and biological responses to GDNF. J. Neurosci. 28, 39–49 [DOI] [PMC free article] [PubMed] [Google Scholar]
- 6. Stutz M. A., Shattuck D. L., Laederich M. B., Carraway K. L., 3rd, Sweeney C. (2008) LRIG1 negatively regulates the oncogenic EGF receptor mutant EGFRvIII. Oncogene 27, 5741–5752 [DOI] [PMC free article] [PubMed] [Google Scholar]
- 7. Nilsson J., Starefeldt A., Henriksson R., Hedman H. (2003) LRIG1 protein in human cells and tissues. Cell Tissue Res. 312, 65–71 [DOI] [PubMed] [Google Scholar]
- 8. Thomasson M., Hedman H., Guo D., Ljungberg B., Henriksson R. (2003) LRIG1 and epidermal growth factor receptor in renal cell carcinoma: a quantitative RT-PCR and immunohistochemical analysis. Br. J. Cancer 89, 1285–1289 [DOI] [PMC free article] [PubMed] [Google Scholar]
- 9. Lindström A. K., Ekman K., Stendahl U., Tot T., Henriksson R., Hedman H., Hellberg D. (2008) LRIG1 and squamous epithelial uterine cervical cancer: correlation to prognosis, other tumor markers, sex steroid hormones, and smoking. Int. J. Gynecol. Cancer 18, 312–317 [DOI] [PubMed] [Google Scholar]
- 10. Ljuslinder I., Golovleva I., Palmqvist R., Oberg A., Stenling R., Jonsson Y., Hedman H., Henriksson R., Malmer B. (2007) LRIG1 expression in colorectal cancer. Acta Oncol. 46, 1118–1122 [DOI] [PubMed] [Google Scholar]
- 11. Thomasson M., Wang B., Hammarsten P., Dahlman A., Persson J. L., Josefsson A., Stattin P., Granfors T., Egevad L., Henriksson R., Bergh A., Hedman H. (2011) LRIG1 and the liar paradox in prostate cancer: a study of the expression and clinical significance of LRIG1 in prostate cancer. Int. J. Cancer 128, 2843–2852 [DOI] [PubMed] [Google Scholar]
- 12. Krig S. R., Frietze S., Simion C., Miller J. K., Fry W. H., Rafidi H., Kotelawala L., Qi L., Griffith O. L., Gray J. W., Carraway K. L., 3rd, Sweeney C. (2011) Lrig1 is an estrogen-regulated growth suppressor and correlates with longer relapse-free survival in ERα-positive breast cancer. Mol. Cancer Res. 9, 1406–1417 [DOI] [PMC free article] [PubMed] [Google Scholar]
- 13. Sheu J. J., Lee C. C., Hua C. H., Li C. I., Lai M. T., Lee S. C., Cheng J., Chen C. M., Chan C., Chao S. C., Chen J. Y., Chang J. Y., Lee C. H. (2013) LRIG1 modulates aggressiveness of head and neck cancers by regulating EGFR-MAPK-SPHK1 signaling and extracellular matrix remodelling. Oncogene, in press [DOI] [PubMed] [Google Scholar]
- 14. Rouam S., Moreau T., Broët P. (2010) Identifying common prognostic factors in genomic cancer studies: a novel index for censored outcomes. BMC Bioinformatics 11, 150. [DOI] [PMC free article] [PubMed] [Google Scholar]
- 15. Hedman H., Nilsson J., Guo D., Henriksson R. (2002) Is LRIG1 a tumour suppressor gene at chromosome 3p14.3? Acta Oncol. 41, 352–354 [DOI] [PubMed] [Google Scholar]
- 16. Wong V. W., Stange D. E., Page M. E., Buczacki S., Wabik A., Itami S., van de Wetering M., Poulsom R., Wright N. A., Trotter M. W., Watt F. M., Winton D. J., Clevers H., Jensen K. B. (2012) Lrig1 controls intestinal stem-cell homeostasis by negative regulation of ErbB signalling. Nat. Cell Biol. 14, 401–408 [DOI] [PMC free article] [PubMed] [Google Scholar]
- 17. Powell A. E., Wang Y., Li Y., Poulin E. J., Means A. L., Washington M. K., Higginbotham J. N., Juchheim A., Prasad N., Levy S. E., Guo Y., Shyr Y., Aronow B. J., Haigis K. M., Franklin J. L., Coffey R. J. (2012) The pan-ErbB negative regulator Lrig1 is an intestinal stem cell marker that functions as a tumor suppressor. Cell 149, 146–158 [DOI] [PMC free article] [PubMed] [Google Scholar]
- 18. Abraira V. E., Satoh T., Fekete D. M., Goodrich L. V. (2010) Vertebrate Lrig3-ErbB interactions occur in vitro but are unlikely to play a role in Lrig3-dependent inner ear morphogenesis. PLoS One 5, e8981. [DOI] [PMC free article] [PubMed] [Google Scholar]
- 19. Moustakas A., Heldin C. H. (2009) The regulation of TGFβ signal transduction. Development 136, 3699–3714 [DOI] [PubMed] [Google Scholar]
- 20. Lim K. L., Chew K. C., Tan J. M., Wang C., Chung K. K., Zhang Y., Tanaka Y., Smith W., Engelender S., Ross C. A., Dawson V. L., Dawson T. M. (2005) Parkin mediates nonclassical, proteasomal-independent ubiquitination of synphilin-1: implications for Lewy body formation. J. Neurosci. 25, 2002–2009 [DOI] [PMC free article] [PubMed] [Google Scholar]
- 21. Zhao H., Tanegashima K., Ro H., Dawid I. B. (2008) Lrig3 regulates neural crest formation in Xenopus by modulating Fgf and Wnt signaling pathways. Development 135, 1283–1293 [DOI] [PMC free article] [PubMed] [Google Scholar]
- 22. Sorkin A., Goh L. K. (2009) Endocytosis and intracellular trafficking of ErbBs. Exp. Cell Res. 315, 683–696 [DOI] [PubMed] [Google Scholar]
- 23. Kochupurakkal B. S., Harari D., Di-Segni A., Maik-Rachline G., Lyass L., Gur G., Kerber G., Citri A., Lavi S., Eilam R., Chalifa-Caspi V., Eshhar Z., Pikarsky E., Pinkas-Kramarski R., Bacus S. S., Yarden Y. (2005) Epigen, the last ligand of ErbB receptors, reveals intricate relationships between affinity and mitogenicity. J. Biol. Chem. 280, 8503–8512 [DOI] [PubMed] [Google Scholar]
- 24. Citri A., Alroy I., Lavi S., Rubin C., Xu W., Grammatikakis N., Patterson C., Neckers L., Fry D. W., Yarden Y. (2002) Drug-induced ubiquitylation and degradation of ErbB receptor tyrosine kinases: implications for cancer therapy. EMBO J. 21, 2407–2417 [DOI] [PMC free article] [PubMed] [Google Scholar]
- 25. Lee J. M., Kim B., Lee S. B., Jeong Y., Oh Y. M., Song Y. J., Jung S., Choi J., Lee S., Cheong K. H., Kim D. U., Park H. W., Han Y. K., Kim G. W., Choi H., Song P. H., Kim K. A. (2012) Cbl-independent degradation of Met: ways to avoid agonism of bivalent Met-targeting antibody. Oncogene 10.1038/onc.2012.551 [DOI] [PubMed] [Google Scholar]
- 26. Yi W., Holmlund C., Nilsson J., Inui S., Lei T., Itami S., Henriksson R., Hedman H. (2011) Paracrine regulation of growth factor signaling by shed leucine-rich repeats and immunoglobulin-like domains 1. Exp. Cell Res. 317, 504–512 [DOI] [PubMed] [Google Scholar]
- 27. Goldoni S., Iozzo R. A., Kay P., Campbell S., McQuillan A., Agnew C., Zhu J. X., Keene D. R., Reed C. C., Iozzo R. V. (2007) A soluble ectodomain of LRIG1 inhibits cancer cell growth by attenuating basal and ligand-dependent EGFR activity. Oncogene 26, 368–381 [DOI] [PubMed] [Google Scholar]
- 28. Jensen K. B., Watt F. M. (2006) Single-cell expression profiling of human epidermal stem and transit-amplifying cells: Lrig1 is a regulator of stem cell quiescence. Proc. Natl. Acad. Sci. U.S.A. 103, 11958–11963 [DOI] [PMC free article] [PubMed] [Google Scholar]
- 29. Burke P., Schooler K., Wiley H. S. (2001) Regulation of epidermal growth factor receptor signaling by endocytosis and intracellular trafficking. Mol. Biol. Cell 12, 1897–1910 [DOI] [PMC free article] [PubMed] [Google Scholar]
- 30. Brankatschk B., Wichert S. P., Johnson S. D., Schaad O., Rossner M. J., Gruenberg J. (2012) Regulation of the EGF transcriptional response by endocytic sorting. Sci. Signal. 5, ra21. [DOI] [PubMed] [Google Scholar]
- 31. Sousa L. P., Lax I., Shen H., Ferguson S. M., De Camilli P., Schlessinger J. (2012) Suppression of EGFR endocytosis by dynamin depletion reveals that EGFR signaling occurs primarily at the plasma membrane. Proc. Natl. Acad. Sci. U.S.A. 109, 4419–4424 [DOI] [PMC free article] [PubMed] [Google Scholar]
- 32. Lill N. L., Sever N. I. (2012) Where EGF receptors transmit their signals. Sci. Signal. 5, pe41. [DOI] [PMC free article] [PubMed] [Google Scholar]
- 33. Jensen K. B., Collins C. A., Nascimento E., Tan D. W., Frye M., Itami S., Watt F. M. (2009) Lrig1 expression defines a distinct multipotent stem cell population in mammalian epidermis. Cell Stem Cell 4, 427–439 [DOI] [PMC free article] [PubMed] [Google Scholar]
- 34. Sunnarborg S. W., Hinkle C. L., Stevenson M., Russell W. E., Raska C. S., Peschon J. J., Castner B. J., Gerhart M. J., Paxton R. J., Black R. A., Lee D. C. (2002) Tumor necrosis factor-α converting enzyme (TACE) regulates epidermal growth factor receptor ligand availability. J. Biol. Chem. 277, 12838–12845 [DOI] [PubMed] [Google Scholar]
- 35. Gooz M. (2010) ADAM-17: the enzyme that does it all. Crit. Rev. Biochem. Mol. Biol. 45, 146–169 [DOI] [PMC free article] [PubMed] [Google Scholar]