

Abstract
Purpose
Studies in the United States have found that patients’ sex, race, and age influence the pain assessment and treatment decisions of laypeople and medical professionals. However, there is limited research as to whether people of other nationalities make pain management decisions differently based on demographic characteristics. Therefore, the purpose of the following study was to compare pain assessment and treatment decisions of undergraduate students in Jordan and the United States as a preliminary examination of nationality as a potential proxy for cultural differences in pain decisions.
Methods
Virtual human (VH) technology was used to examine the influences of patients’ sex (male or female), race (light-skinned or dark-skinned), and age (younger or older) on students’ pain management decisions. Seventy-five American and 104 Jordanian undergraduate students participated in this web-based study.
Results
American and Jordanian students rated pain intensity higher in females and older adults and were more likely to recommend medical help to these groups, relative to males and younger adults. Furthermore, Jordanian participants rated pain intensity higher and were more likely to recommend medical help for all patient demographic groups (ie, sex, race, age) than American participants.
Conclusion
This is the first cross-national study that compares pain decisions between undergraduate students. The results suggest that sex, race, and age cues are used in pain assessment and treatment by both Americans and Jordanians, with Jordanians more likely to rate pain higher and recommend medical help to patients. Additional research is needed to determine the cultural determinants of these differences.
Keywords: pain management, pain disparities, nationality, stereotypes, biases
Introduction
There is an expansive body of literature documenting the prevalence of inequalities in pain management. Although results are not always consistent across studies,1 older adults2,3 and racial/ethnic minority patients are often at higher risk for receiving substandard pain treatment,4,5 and there is evidence of pain management disparities between men and women.6 Factors such as inadequate medical training in pain management and provider reluctance to prescribe opioids have been suggested to play a fundamental role in these disparities. More recently, however, attention has been directed towards understanding the influence of patient demographics (eg, sex, race, age) on pain management decisions, and studies examining this issue have found that provider stereotypes not only influence expectations about patients, but also affect the diagnostic and treatment process.7
Additional research has consistently shown that patient demographic characteristics such as sex, race, and age may influence the pain assessment and treatment decisions of health care trainees and professionals.8–14 Virtual human (VH) technology has been used to demonstrate that females are perceived as experiencing higher pain intensity8,9,12–15 and are more likely to be recommended medical treatment8,9,12–14 compared to males with the same clinical diagnoses. Furthermore, African American and older adult patients are considered to have greater pain and are recommended for medical management of their pain at a higher frequency than Caucasians and younger adults, respectively.8,9,12,13 It should be noted, however, that these findings have not always been consistent, an effect likely due to methodological differences across studies, as African Americans have also been found to have their pain undertreated when compared to Caucasians.16–18 These discrepancies underscore the importance of continued investigation of pain management disparities to better understand pain assessment and treatment in diverse populations.
It is well established that patients of different sex, racial, and age groups seem to have inequities in pain treatment. However, much of what we know about these disparities has been derived from studies in the United States, despite the fact that barriers to pain management have also been observed in other countries.19,20 Given that individuals in the United States have been found to use demographic characteristics to guide their pain management decisions, it is plausible that these same cues may be used in other countries. Unfortunately, limited efforts have been made to systematically address this issue.
Therefore, the aim of the present study was to compare the pain assessment and treatment decisions of undergraduate students from the United States and from Jordan. VH technology was employed to capture the extent to which participants used sex, race, and age cues to guide pain decision-making in each country. To our knowledge, this is the first time that VH technology was used in Jordan to evaluate the influences of patient demographic characteristics on pain management. Given our uncertainty about how Jordanian participants perceived the skin color (ie, race) of VHs, we defined race as light-skinned or dark-skinned for the purposes of cross-national comparison. Consistent with previous research, it was hypothesized that in American participants, VH females, older adults, and darker-skinned patients would be viewed as having higher pain and would be more likely to be recommended medical treatment (ie, opioid analgesics) than males, younger adults, and lighter-skinned patients. Due to the exploratory nature of this research, no directional hypotheses about sex, race, and age were made for Jordanian participants.
Materials and methods
Participants
Participants consisted of 179 undergraduate students from the University of Florida and the University of Jordan. Participants from the University of Florida were recruited via study announcements that were disseminated throughout the campus, while Jordanian students were recruited through classroom announcements. Inclusion criteria were: (1) adult aged 18 years or older; and (2) student enrolled at the University of Florida or the University of Jordan. Upon completion of the study, American participants were compensated with a $15 retail gift card and Jordanian participants received accreditation of 10 hours of community service towards the University of Jordan’s community service graduation requirement.
VH stimuli
The VH faces were created using People Putty (Haptek, Inc, Freedom, CA, USA), a computer software program that has been used to create VH faces in previous studies.8–13,15 Each VH video displayed different combinations of demographic characteristics such as sex (male or female), race (light-skinned or dark-skinned), age (younger or older adult) and pain expression (high pain or low pain). VH demographic features were manipulated (eg, skin tone, hair color, hair length) to enable participants to evaluate the VH patients displaying different demographic cues. Pain expression on the VH patients’ faces was attained by using the empirically validated Facial Action Coding System (FACS) which identifies specific facial movements that patients use when they are experiencing pain: brow lowering; tightening of the orbital muscles surrounding the eye; nose wrinkling; upper lip rising; and eye closure.15,21,22 Figures 1 and 2 represent still frame images of VH patients displaying high and low pain expressions.
Figure 1.
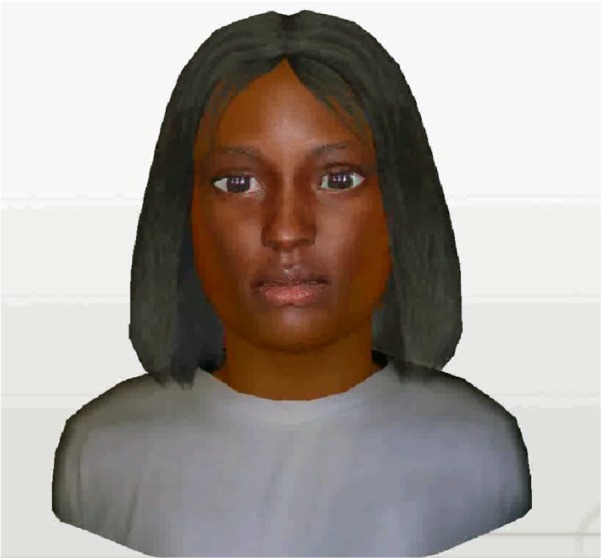
Still frame of virtual human cues representing female sex, dark-skinned race, younger age, and low-pain expression.
Figure 2.

Still frame of virtual human cues representing male sex, light-skinned race, older age, and high-pain expression.
Questionnaires
Pain rating scale
For assessment of pain, participants were asked to “Please rate the pain intensity that the patient is experiencing in the video.” An electronic 100-point visual analog scale (VAS) was used to record pain assessment ratings. Participants responded by moving an indicator along the scale with endpoints ranging from “no pain sensation” to the “most intense pain imaginable.”
Treatment recommendation scale
Participants were asked to “Please rate to what degree you recommend that the patient should seek medical help” and were instructed to make their treatment recommendation rating using the VAS. Responses were made by moving an indicator along the scale with endpoints ranging from “not at all likely” to “complete certainty.”
Procedure
The study was approved by the University of Florida’s Institutional Review Board (Gainesville, FL, USA), and data collection was authorized to be completed at both the University of Florida and the University of Jordan. The study used a web-based delivery method. A Jordanian research assistant fluent in both Arabic and English translated the study questionnaires from English to Arabic for the Jordanian undergraduate students. Interested participants contacted the study coordinator to receive a username and password and were subsequently directed to a private and secure website to complete the study. All of the participants provided informed consent. After giving informed consent electronically, participants completed a demographic questionnaire and viewed VH patient profiles, which consisted of viewing a patient, viewing the patient’s vital status, reading a clinical vignette, and answering pain assessment and treatment questions.
A total of 16 VH patient profiles were presented in a random order to each participant via a 20-second looped clip. Each patient contained four characteristics: sex (male or female); race (light-skinned or dark-skinned); age (young or old); and pain expression (high-pain expression or low-pain expression). For example, a combination of cues may be present in a patient who is male, dark-skinned, young, and expressing low pain. The same procedure was followed for the rest of the demographic cues. Participants were required to complete one VH profile before viewing the next one and were not allowed to revisit completed VH profiles. Within each video clip, participants were presented with a clinical vignette for each patient that read as follows:
Patient presents with lower back pain for the past year of greater than one year duration. Patient reports that the pain began after a work-related lifting incident. The pain is located in the lumbar region of the back. The pain limits patient’s ability to move around freely. Patient reports no prior surgical treatments and has current prescriptions for anti-inflammatory and analgesic medications.
Following the clinical vignette, participants completed the pain assessment and treatment questionnaires for the 16 patient profiles and were debriefed regarding the study objectives. The study took approximately 1–1.5 hours to complete.
Statistical analysis
All data analyses were performed using SPSS for Windows (v 20; IBM Corporation, Armonk, NY, USA). Paired samples t-tests were used to evaluate whether participants could reliably distinguish between high- and low-pain expressions of VH-patients when addressing pain assessment and treatment recommendations. Repeated measures analysis of variance was also conducted to examine the influences of VH demographic characteristics (sex, race, and age) on pain assessment and treatment recommendations. For this study, sex (male or female), race (light-skinned or dark-skinned), and age (younger adult or older adult) were the within-subject variables, whereas the nationality (American or Jordanian) of the participants was the between-subjects variable. Partial η2 was reported as the effect size for F-tests and significance was set at P < 0.05. Based upon previous studies in our laboratory using VH stimuli, a total sample size of 100 was estimated to detect significant effects at power = 0.80.
Results
Participant characteristics
The sample included a total of 179 undergraduate students consisting of 75 (22 male, 53 female) students from the University of Florida and 104 (35 male, 69 female) students from the University of Jordan. Results revealed no significant differences between the two groups in relation to sex of the participant (P > 0.05). There was a significant difference between participants in relation to age (t = 5.29, df = 136.02, P < 0.001), with American participants (mean [M] = 21.01 years, standard deviation [SD] = 2.03) being significantly older than Jordanian participants (M = 19.52 years, SD = 1.61), though both groups clearly fell within the range expected of a college population.
Validating low- or high-pain expressing VH faces
The participants were able to distinguish between VH patients’ high-pain and low-pain expressing faces while rating pain intensity and willingness to recommend medical treatment, regardless of the VH patients’ sex, race, or age. American and Jordanian participants rated pain intensity higher and were more willing to recommend medical treatment to high-pain expressing VH faces than to low-pain expressing VH faces. These results are consistent with previous work,9,13 and serve as further validation of the VH stimuli. Since the participants were able to distinguish between high-pain and low-pain expressing faces, this study used only the high-pain expressing faces to examine the participants’ pain assessment and treatment decisions. Descriptive statistics for pain assessment and pain treatment across both groups are presented in Table 1.
Table 1.
Descriptive statistics for pain assessment and pain treatment across levels of pain expression
| Decision | Cue | Low-pain expression
|
High-pain expression
|
t | Cohen’s d | ||
|---|---|---|---|---|---|---|---|
| M | SD | M | SD | ||||
| Pain assessment | Male light-skinned younger | 45.31 | 25.69 | 46.58 | 29.31 | −0.45* | 0.05 |
| Male light-skinned older | 31.80 | 22.84 | 59.91 | 25.46 | −13.90* | 1.16 | |
| Male dark-skinned younger | 37.61 | 26.48 | 52.74 | 30.98 | −4.54* | 0.52 | |
| Male dark-skinned older | 27.65 | 22.69 | 60.87 | 24.71 | −16.05* | 1.40 | |
| Female light-skinned younger | 41.40 | 26.63 | 50.29 | 28.91 | −3.04* | 0.36 | |
| Female light-skinned older | 35.93 | 24.20 | 65.96 | 23.04 | −15.73* | 1.27 | |
| Female dark-skinned younger | 43.25 | 26.75 | 51.04 | 31.28 | −2.36* | 0.27 | |
| Female dark-skinned older | 27.69 | 22.82 | 59.87 | 25.25 | −14.56* | 1.34 | |
| Pain treatment | Male light-skinned younger | 53.60 | 27.90 | 51.04 | 33.08 | 0.90 | 0.08 |
| Male light-skinned older | 37.80 | 29.01 | 64.76 | 28.72 | −11.95* | 0.93 | |
| Male dark-skinned younger | 45.83 | 28.86 | 56.35 | 33.65 | −3.26* | 0.34 | |
| Male dark-skinned older | 36.06 | 30.02 | 64.85 | 26.63 | −12.73* | 1.01 | |
| Female light-skinned younger | 51.56 | 29.67 | 53.89 | 31.27 | 0.77 | 0.08 | |
| Female light-skinned older | 47.41 | 30.84 | 70.71 | 25.19 | −11.24* | 0.83 | |
| Female dark-skinned younger | 50.20 | 28.90 | 56.28 | 34.10 | −1.81* | 0.19 | |
| Female dark-skinned older | 38.92 | 30.15 | 63.69 | 28.42 | −9.52* | 0.85 | |
Note:
P < 0.05.
Abbreviations: M, mean; SD, standard deviation.
Assessment of pain intensity
Table 2 reports descriptive and inferential statistics for measures of pain assessment. There were significant main effects of nationality, sex, and age for pain intensity ratings. Specifically, Jordanians rated pain intensity for all cue-combinations (ie, sex, race, age) of patient profiles significantly higher than American participants. Overall, pain intensity was rated higher for female and older adult patients than for male and younger adult patients, respectively. The main effect of race for pain intensity ratings was non-significant (P > 0.05).
Table 2.
Descriptive and inferential statistics for pain assessment across demographic cues
| M | SD | F | Partial η2 | ||||||||||
|---|---|---|---|---|---|---|---|---|---|---|---|---|---|
| Main effects | |||||||||||||
| Nationality | |||||||||||||
| American | 39.84 | 20.53 | 143.42* | 0.44 | |||||||||
| Jordanian | 67.67 | 24.21 | |||||||||||
| Sex | |||||||||||||
| Male | 52.77 | 22.01 | 5.30* | 0.03 | |||||||||
| Female | 54.74 | 20.54 | |||||||||||
| Race | |||||||||||||
| Light-skinned | 53.42 | 23.93 | 0.47 | 0.00 | |||||||||
| Dark-skinned | 54.09 | 21.67 | |||||||||||
| Age | |||||||||||||
| Younger | 46.89 | 26.42 | 123.35* | 0.41 | |||||||||
| Older | 60.62 | 19.19 | |||||||||||
| Interactions | |||||||||||||
| Nationality × Sex | |||||||||||||
| American × Male | 38.59 | 14.76 | 0.39 | 0.00 | |||||||||
| American × Female | 41.10 | 15.18 | |||||||||||
| Jordanian × Male | 66.95 | 18.59 | |||||||||||
| Jordanian × Female | 68.38 | 15.97 | |||||||||||
| Nationality × Race | |||||||||||||
| American × Light-skinned | 39.12 | 21.98 | 0.59 | 0.00 | |||||||||
| American × Dark-skinned | 40.56 | 14.85 | |||||||||||
| Jordanian × Light-skinned | 67.71 | 17.49 | |||||||||||
| Jordanian × Dark-skinned | 67.62 | 18.72 | |||||||||||
| Nationality × Age | |||||||||||||
| American × Younger | 26.23 | 16.06 | 119.54* | 0.40 | |||||||||
| American × Older | 53.46 | 17.54 | |||||||||||
| Jordanian × Younger | 67.56 | 17.40 | |||||||||||
| Jordanian × Older | 67.77 | 18.24 | |||||||||||
| Sex × Race | |||||||||||||
| Male × Light-skinned | 50.74 | 24.13 | 11.34* | 0.06 | |||||||||
| Male × Dark-skinned | 54.80 | 23.90 | |||||||||||
| Female × Light-skinned | 56.09 | 22.67 | |||||||||||
| Female × Dark-skinned | 53.39 | 22.46 | |||||||||||
| Sex × Age | |||||||||||||
| Male × Younger | 46.46 | 27.43 | 1.42 | 0.01 | |||||||||
| Male × Older | 59.08 | 22.12 | |||||||||||
| Female × Younger | 47.32 | 27.66 | |||||||||||
| Female × Older | 62.16 | 20.08 | |||||||||||
| Race × Age | |||||||||||||
| Light-skinned × Younger | 45.51 | 26.15 | 6.10* | 0.03 | |||||||||
| Light-skinned × Older | 61.32 | 21.03 | |||||||||||
| Dark-skinned × Younger | 48.28 | 29.29 | |||||||||||
| Dark-skinned × Older | 59.91 | 21.57 | |||||||||||
| Nationality × Sex × Race | |||||||||||||
| American × Male × Light-skinned | 36.15 | 16.33 | 0.00 | 0.00 | |||||||||
| American × Male × Dark-skinned | 41.03 | 16.42 | |||||||||||
| American × Female × Light-skinned | 42.10 | 17.50 | |||||||||||
| American × Female × Dark-skinned | 40.10 | 16.39 | |||||||||||
| Jordanian × Male × Light-skinned | 65.33 | 21.34 | |||||||||||
| Jordanian × Female × Light-skinned | 68.57 | 22.08 | |||||||||||
| Jordanian × Female × Light-skinned | 70.09 | 18.61 | |||||||||||
| Jordanian × Female × Dark-skinned | 66.68 | 19.58 | |||||||||||
| Nationality × Sex × Age | |||||||||||||
| American × Male × Younger | 26.34 | 17.39 | 3.04 | 0.02 | |||||||||
| American × Male × Older | 50.84 | 20.03 | |||||||||||
| American × Female × Younger | 26.11 | 17.88 | |||||||||||
| American × Female × Older | 56.08 | 17.99 | |||||||||||
| Jordanian × Male × Younger | 66.58 | 20.01 | |||||||||||
| Jordanian × Male × Older | 67.31 | 21.14 | |||||||||||
| Jordanian × Female × Younger | 68.53 | 18.36 | |||||||||||
| Jordanian × Female × Older | 68.23 | 20.14 | |||||||||||
| Nationality × Race × Age | |||||||||||||
| American × Light-skinned × Younger | 26.87 | 16.96 | 32.53* | 0.16 | |||||||||
| American × Light-skinned × Older | 51.37 | 19.29 | |||||||||||
| American × Dark-skinned × Younger | 25.58 | 16.93 | |||||||||||
| American × Dark-skinned × Older | 55.55 | 18.20 | |||||||||||
| Jordanian × Light-skinned × Younger | 64.15 | 19.81 | |||||||||||
| Jordanian × Light-skinned × Older | 71.27 | 18.28 | |||||||||||
| Jordanian × Dark-skinned × Younger | 70.97 | 20.16 | |||||||||||
| Jordanian × Dark-skinned × Older | 64.28 | 23.17 | |||||||||||
| Sex × Race × Age | |||||||||||||
| Male × Light-skinned × Younger | 43.55 | 29.31 | 0.14 | 0.00 | |||||||||
| Male × Light-skinned × Older | 57.92 | 25.78 | |||||||||||
| Male × Dark-skinned × Younger | 49.37 | 30.98 | |||||||||||
| Male × Dark-skinned × Older | 60.23 | 24.70 | |||||||||||
| Female × Light-skinned × Younger | 47.47 | 28.91 | |||||||||||
| Female × Light-skinned × Older | 64.72 | 23.04 | |||||||||||
| Female × Dark-skinned × Younger | 47.18 | 31.28 | |||||||||||
| Female × Dark-skinned × Older | 59.60 | 25.25 | |||||||||||
| Nationality × Sex × Race × Age | |||||||||||||
| American × Male × Light-skinned × Younger | 24.72 | 18.84 | 2.69 | 0.02 | |||||||||
| American × Male × Light-skinned × Older | 47.57 | 23.30 | |||||||||||
| American × Male × Dark-skinned × Younger | 27.96 | 19.73 | |||||||||||
| American × Male × Dark-skinned × Older | 54.11 | 21.74 | |||||||||||
| American × Female × Light-skinned × Younger | 29.03 | 21.01 | |||||||||||
| American × Female × Light-skinned × Older | 55.17 | 20.26 | |||||||||||
| American × Female × Dark-skinned × Younger | 23.20 | 18.31 | |||||||||||
| American × Female × Dark-skinned × Older | 56.99 | 21.06 | |||||||||||
| Jordanian × Male × Light-skinned × Younger | 62.38 | 25.12 | |||||||||||
| Jordanian × Male × Light-skinned × Older | 68.27 | 24.04 | |||||||||||
| Jordanian × Male × Dark-skinned × Younger | 70.79 | 24.56 | |||||||||||
| Jordanian × Male × Dark-skinned × Older | 66.35 | 25.65 | |||||||||||
| Jordanian × Female × Light-skinned × Younger | 65.91 | 23.68 | |||||||||||
| Jordanian × Female × Light-skinned × Older | 74.26 | 21.82 | |||||||||||
| Jordanian × Female × Dark-skinned × Younger | 71.16 | 21.88 | |||||||||||
| Jordanian × Female × Dark-skinned × Older | 62.20 | 27.80 | |||||||||||
Notes:
P < 0.05. Degrees of freedom were 1, 176 for all main effects and interactions.
Abbreviations: M, mean; SD, standard deviation.
These effects were qualified by several significant interactions. For instance, there was a significant nationality × age interaction, indicating that the difference in pain assessment by age (younger < older) was greater for American participants than Jordanians. There was also a significant sex × race interaction, indicating that the difference in pain assessment by sex (male < female) was greater for light-skinned patients than for dark-skinned patients. Furthermore, the race × age interaction was significant, revealing that the difference in pain assessment by age (younger < older) was greater for light-skinned than dark-skinned patients.
Finally, there was a significant nationality × race × age interaction, revealing that, within the American group, the difference in pain assessment by age (younger < older) was more pronounced for dark-skinned patients than light-skinned patients. Examination of the Jordanian group indicated that the difference in pain assessment by age (younger < older) was greater for light-skinned than dark-skinned patients.
Recommendation for pain treatment
Table 3 reports descriptive and inferential statistics for measures of pain treatment. For pain treatment, there were significant main effects for nationality, sex, and age. In general, Jordanians recommended medical treatment at a higher rate to all cue-combinations of patient profiles than American participants. Overall, participants were more likely to recommend medical treatment for female and older adult patients than for male and younger adult patients, respectively. The main effect of race for pain treatment recommendations was non-significant (P > 0.05).
Table 3.
Descriptive and inferential statistics for pain treatment across demographic cues
| M | SD | F | Partial η2 | |
|---|---|---|---|---|
| Main effects | ||||
| Nationality | ||||
| American | 45.44 | 21.31 | 75.26* | 0.30 |
| Jordanian | 70.84 | 17.77 | ||
| Sex | ||||
| Male | 57.11 | 24.26 | 4.58* | 0.03 |
| Female | 59.17 | 23.49 | ||
| Race | ||||
| Light-skinned | 57.81 | 23.93 | 0.35 | 0.00 |
| Dark-skinned | 58.47 | 24.40 | ||
| Age | ||||
| Younger | 51.34 | 21.35 | 95.58* | 0.35 |
| Older | 64.94 | 29.05 | ||
| Interactions | ||||
| Nationality × Sex | ||||
| American × Male | 43.87 | 22.09 | 1.24 | 0.01 |
| American × Female | 47.01 | 21.69 | ||
| Jordanian × Male | 70.34 | 19.23 | ||
| Jordanian × Female | 71.34 | 19.10 | ||
| Nationality × Race | ||||
| American × Light-skinned | 43.70 | 21.98 | 6.52* | 0.04 |
| American × Dark-skinned | 47.18 | 22.09 | ||
| Jordanian × Light-skinned | 71.92 | 17.49 | ||
| Jordanian × Dark-skinned | 69.75 | 22.09 | ||
| Nationality × Age | ||||
| American × Younger | 32.53 | 24.82 | 77.26* | 0.30 |
| American × Older | 58.35 | 22.38 | ||
| Jordanian × Younger | 70.15 | 20.41 | ||
| Jordanian × Older | 71.53 | 18.82 | ||
| Sex × Race | ||||
| Male × Light-skinned | 55.42 | 25.48 | 7.86* | 0.04 |
| Male × Dark-skinned | 58.79 | 26.03 | ||
| Female × Light-skinned | 60.21 | 24.60 | ||
| Female × Dark-skinned | 58.14 | 26.03 | ||
| Sex × Age | ||||
| Male × Younger | 50.67 | 30.93 | 0.48 | 0.00 |
| Male × Older | 63.55 | 23.60 | ||
| Female × Younger | 52.02 | 29.65 | ||
| Female × Older | 66.33 | 23.56 | ||
| Race × Age | ||||
| Light-skinned × Younger | 49.58 | 29.04 | 8.17* | 0.04 |
| Light-skinned × Older | 66.04 | 23.51 | ||
| Dark-skinned × Younger | 53.10 | 31.91 | ||
| Dark-skinned × Older | 63.83 | 24.53 | ||
| Nationality × Sex × Race | ||||
| American × Male × Light-skinned | 40.12 | 24.12 | 1.82 | 0.01 |
| American × Male × Dark-skinned | 47.62 | 23.52 | ||
| American × Female × Light-skinned | 47.29 | 23.07 | ||
| American × Female × Dark-skinned | 46.73 | 22.96 | ||
| Jordanian × Male × Light-skinned | 70.72 | 21.89 | ||
| Jordanian × Male × Dark-skinned | 69.97 | 22.01 | ||
| Jordanian × Female × Light-skinned | 73.13 | 19.52 | ||
| Jordanian × Female × Dark-skinned | 69.55 | 23.92 | ||
| Nationality × Sex × Age | ||||
| American × Male × Younger | 31.97 | 27.21 | 1.61 | 0.01 |
| American × Male × Older | 55.77 | 23.07 | ||
| American × Female × Younger | 33.09 | 25.51 | ||
| American × Female × Older | 60.93 | 24.02 | ||
| Jordanian × Male × Younger | 69.36 | 23.01 | ||
| Jordanian × Male × Older | 71.33 | 21.86 | ||
| Jordanian × Female × Younger | 70.95 | 21.10 | ||
| Jordanian × Female × Older | 71.73 | 22.25 | ||
| Nationality × Race × Age | ||||
| American × Light-skinned × Younger | 31.81 | 25.39 | 23.95* | 0.12 |
| American × Light-skinned × Older | 55.59 | 24.35 | ||
| American × Dark-skinned × Younger | 33.25 | 26.04 | ||
| American × Dark-skinned × Older | 61.11 | 27.39 | ||
| Jordanian × Light-skinned × Younger | 67.35 | 21.46 | ||
| Jordanian × Light-skinned × Older | 76.50 | 18.56 | ||
| Jordanian × Dark-skinned × Younger | 72.96 | 26.91 | ||
| Jordanian × Dark-skinned × Older | 66.56 | 24.89 | ||
| Sex × Race × Age | ||||
| Male × Light-skinned × Younger | 48.01 | 33.08 | 1.04 | 0.01 |
| Male × Light-skinned × Older | 62.83 | 28.72 | ||
| Male × Dark-skinned × Younger | 53.32 | 33.65 | ||
| Male × Dark-skinned × Older | 64.26 | 26.63 | ||
| Female × Light-skinned × Younger | 51.15 | 31.27 | ||
| Female × Light-skinned × Older | 69.26 | 25.19 | ||
| Female × Dark-skinned × Younger | 52.88 | 34.11 | ||
| Female × Dark-skinned × Older | 63.40 | 28.42 | ||
| Nationality × Sex × Race × Age | ||||
| American × Male × Light-skinned × Younger | 29.32 | 28.55 | 0.73 | 0.00 |
| American × Male × Light-skinned × Older | 50.92 | 28.18 | ||
| American × Male × Dark-skinned × Younger | 34.63 | 29.22 | ||
| American × Male × Dark-skinned × Older | 60.61 | 25.36 | ||
| American × Female × Light-skinned × Younger | 34.31 | 28.27 | ||
| American × Female × Light-skinned × Older | 60.27 | 25.15 | ||
| American × Female × Dark-skinned × Younger | 31.87 | 27.39 | ||
| American × Female × Dark-skinned × Older | 61.60 | 26.78 | ||
| Jordanian × Male × Light-skinned × Younger | 66.70 | 26.73 | ||
| Jordanian × Male × Light-skinned × Older | 74.74 | 24.80 | ||
| Jordanian × Male × Dark-skinned × Younger | 72.02 | 27.42 | ||
| Jordanian × Male × Dark-skinned × Older | 67.91 | 27.22 | ||
| Jordanian × Female × Light-skinned × Younger | 68.00 | 25.21 | ||
| Jordanian × Female × Light-skinned × Older | 78.25 | 22.48 | ||
| Jordanian × Female × Dark-skinned × Younger | 73.89 | 26.91 | ||
| Jordanian × Female × Dark-skinned × Older | 65.20 | 29.58 | ||
Notes:
P < 0.05. Degrees of freedom were 1, 177 for all main effects and interactions.
Abbreviations: M, mean; SD, standard deviation.
These effects were qualified by several significant interactions. Specifically, there was a significant nationality × race interaction for pain treatment recommendations, suggesting that the race difference (light-skinned , dark-skinned) was greater for American participants than Jordanians. There was also a significant nationality × age interaction, indicating that the difference in pain assessment by age (younger < older) was greater for American participants than Jordanian participants. A significant sex × race interaction was found, revealing that the difference in pain assessment by sex (males < females) was more pronounced for light-skinned than dark-skinned patients. A significant race × age interaction was also identified, indicating that the difference in pain assessment by age (younger < older) was greater for light-skinned patients than dark-skinned patients.
Lastly, there was a significant nationality × race × age interaction, indicating that, for American participants, the difference in pain assessment by age (younger < older) was greater for dark-skinned than light-skinned patients. However, within the Jordanian group, the difference in pain assessment by age (younger < older) was more pronounced for light-skinned than dark-skinned patients.
Discussion
The current study was designed to compare the pain assessment and treatment decisions of students from the United States and Jordan. To our knowledge, this was the first study to assess whether sex, race, and age affect pain decision-making in Jordan. Overall, our findings are consistent with the existing literature from studies that have been conducted in the United States and Europe demonstrating the impact that demographic biases have on pain management.2,6,23–25 Similar to previous VH studies, we found that females were perceived as experiencing higher pain intensity and were recommended for medical treatment significantly more often than males.8,9,12–15 This is consistent with extant literature indicating that women are generally perceived as experiencing higher pain levels, being more pain sensitive, and having less endurance to pain26–28 than men. Although speculative, these differences in pain assessment and treatment may be due to expectations that females are more likely to report higher levels of pain and pain-related conditions, and more frequently seek medical help than males.26,29 Furthermore, sociocultural beliefs about femininity and masculinity may also impact pain decisions as men are often viewed as being more pain-tolerative and having higher levels of stoicism than women,26 an effect that may alter perceived notions about pain expression and treatment.
Results were also consistent with previous VH studies from our laboratory where older patients were rated as having greater pain intensity and were more likely to be recommended medical treatment than younger patients.9,12,13 It is possible that these differences can be accounted for by the belief that aging leads to more pain complaints and is associated with comorbid medical conditions that increase suffering. Despite this possibility, pain in older adults is often under-recognized and inadequately managed in the health care system.30,31 A contributing factor to this issue may be that older adults are reticent or have difficulty communicating their pain, thereby reducing the probability of receiving adequate care. It has also been suggested that health care settings lack satisfactory training in pain management of older adults,32 which may impact the accurate assessment of pain in this population. Furthermore, although health care providers may initially be willing to prescribe pharmacological treatment to older adults for their pain, usage of medications in this population may be lower due to medical comorbidities that have the potential for complicating treatment. However, these inferences are speculative and warrant further investigation.
Interestingly, the main effect of race was not significant in the current sample. This is in direct contrast to previous studies that report the presence of overall racial biases in pain assessment and treatment8,9,12–14 and does not support the literature suggesting disparities among various ethnic and racial minorities.23,24 Nevertheless, racial biases were observed when combined with other demographic cues. Specifically, light-skinned female and younger dark-skinned patients were rated as having higher pain intensity and were more likely to be recommended medical treatment than light-skinned male and younger light-skinned patients, respectively. Although this merits further investigation, racial biases may have operated in a more subtle manner in our sample, an effect that could have been driven by socially desirable responding, but had more robust effects when associated with other cue combinations.
When comparing the pain assessment and treatment recommendations of Jordanians and Americans, the results indicated that both groups differed in their use of demographic cues when making treatment decisions. This is an interesting finding and suggests that culture, or nationality-related health care practices, may play an important role in how patients’ pain is perceived and managed. Furthermore, when presented with the same patient profile, Jordanian students rated pain intensity higher and were more likely to recommend medical help to all cue-combinations than were American students. Even though there may be less discussion on pain management in the Jordan community, recent efforts have been made to address existing inequalities in pain treatment. Of the existing research in the area, some studies have found that Jordanian patients are often reluctant to acknowledge pain33 due to beliefs that pain should be tolerated.34,35 As a result, our findings could reflect that Jordanian students may be more likely to identify pain expression as strong evidence of significant pain suffering; therefore, recommendations of medical treatment are only considered when the observer believes that patients are experiencing a significant degree of pain.
Study strengths and limitations
There are several strengths of the study that warrant acknowledgment. First, the current study adds to the limited body of research examining the existence of pain management disparities across countries,36 and is the first study to use VH technology to investigate the influence of demographic biases on pain assessment and treatment decisions in Jordan. This technology allowed for the standardization of pain across patients of varying demographics, therefore permitting the manipulation of physical appearance without altering pain expression. Furthermore, this study illustrates the advantages of investigations delivered via the internet in that they are relatively inexpensive and accessible, therefore increasing the ability to capture perspectives worldwide.37
Despite these strengths, there are some limitations that are worth noting. First, race is a multidimensional construct that is likely conceptualized in a different manner across various nations, cultures, and social groups. Although it is speculated that the American participants perceived the VH stimuli (light-skinned or dark-skinned) as African American/black and Caucasian/white, there may have been divergence in how this cue was interpreted by Jordanian participants. Although the results suggest that the Jordanian group did, in fact, use racial cues when making ratings of pain and treatment directives, it is unclear how these directly compare to biases in the American participants. Further, given global differences in how race is classified, the VH stimuli depicting this cue may not have been particularly representative of individuals residing in Jordan. Second, we recognize that our sample was relatively homogenous and limited to undergraduate students; thus, these results may not be demonstrative of how pain is generally managed in the health care field. While it is speculated that some of the students in the current study will go on to obtain positions in the health care field, long-term follow-up of participants and assessment of students’ current academic major was not conducted to address this issue. Although our findings are comparable to other research,9,12,13 suggesting that health care professionals and trainees use similar demographic cues as undergraduate students to guide their pain treatment decisions, it is important that future research assesses cross-national differences in pain management using samples more representative of health care professionals. It should be noted, however, that the significance of these findings need not be limited to direct health care delivery. It is very likely that all participants have experienced pain, will experience pain, and will seek treatment for it; therefore, their beliefs and stereotypes as consumers are important to know as they are likely to be relevant to their expectations for care. In addition, the general public frequently has a voice in public policy about health care, and each person also interacts with family members and other individuals in their social environment. Consequently, sex, race, and age expectations are important in indirect ways, regardless of health care training. An additional limitation to acknowledge is that the limited demographic information collected in our sample did not allow for investigation of whether specific characteristics of our groups contributed to differences in pain management decisions. And finally, our VHs were restricted to facial expressions of pain, which may not have provided a complete depiction of pain-related behavior; therefore, future studies examining cross-national differences in pain-related decisions may benefit from the utilization of full-body VHs for a more representative illustration of behavior associated with chronic pain.
Implications and future directions
The role of stereotypic biases on pain treatment has become an important area of study, especially given evidence documenting sex, race, and age disparities in pain management. While efforts have been made in the United States to assess the influences of demographic characteristics on provider biases in pain management decisions,9–14 there is little research in other countries examining this issue. One of the key findings of the study is that these biases are not simply an artifact of American culture, but also exist outside of the United States. Moreover, Americans and Jordanians appear to differ in their utilization of stereotypic-related biases, suggesting they are differentially influenced by patient demographics. Pain and its management have been recognized as significant challenges in the Jordanian health care system, and only recently have these issues been addressed in this country.38 Due to the limited pain management and demographic disparities research being conducted in Jordan,34,35,38–42 we believe that our findings may be an initial step towards eliminating potential inequities in pain management in this country.
The statistical effect sizes for our significant outcomes ranged from small to large for both pain assessment and pain treatment, with the largest effects observed for age-related biases (explaining 41% and 35% of the variance in pain assessment and pain treatment). Although some of the effects observed in our sample were relatively modest, it is worth mentioning that, from a public health perspective, the implications of these findings are quite substantial. Indeed, given the number of patients that health care providers treat over the course of their careers, any existing demographic biases in even one health care professional have the potential for negatively impacting pain management outcomes in thousands of patients. Therefore, the presence of these biases is noteworthy and merits further investigation in a health care population.
Findings from previous research have consistently demonstrated the advantage of VH technology in capturing pain assessment and treatment decisions in both community and health care populations.8–15,43 Although a verbal report is often one of the most effective ways of assessing pain, nonverbal facial expressions (eg, grimacing, brow lowering, nose wrinkling, eye closure, guarded movement, bracing, rubbing, touching painful areas, sighing, etc) also provide a quantifiable measure of pain-related behavior. Therefore, the use of VH technology allows for the development of “virtual” patients that can be standardized across multiple pain expressions and vary by demographic characteristics such as sex, race, and age to accurately capture stereotypical biases in pain management. Given that there has been a considerable body of research documenting the impact that provider behavior has on pain treatment,7 we argue that VH technology may be used as an informative tool to elucidate how health care providers across nations incorporate demographic cues in their decisions about pain. Although the quality of pain management is often dependent upon multiple factors, such as the knowledge and skills of the individual providing treatment, it can also be impacted by factors outside of conscious awareness. This may ultimately increase the difficulty of discerning when biases are guiding clinical decisions. This underscores the utilization of methods (such as VH technology) to uncover potential demographic biases that may be impacting pain management decisions.
A major issue that continues to be a challenge in pain management is that medical students and health care providers often receive limited education on pain, its treatment, and factors that can affect ways in which pain is approached in the medical setting. Patient characteristics can influence health care providers’ decisions regarding pain treatment and assessment; therefore, the development of educational training programs to increase awareness and knowledge regarding the impact of stereotypes on pain management is crucial in eliminating treatment disparities. We believe that the current study could potentially be a preliminary step towards informing future education and clinical practices in the field of pain management. For instance, we found that demographic biases were used to make pain management decisions; effects that differed across countries. If individuals who use various demographic cues when making pain management decisions can be identified, interventions could be developed to reduce these biases. Such interventions could attempt to increase awareness of when specific biases are used, with the ultimate aim of diminishing the influence of patient demographic cues so that health care decisions will not be adversely impacted. In order for this to be most effective, it may be essential for these interventions to be delivered during the period of medical training before trainees become practicing clinicians. Hence, future research is clearly warranted to target the development of interventions that can assist in reducing inequities in pain health care.
Conclusion
The current study suggests that sex, race, and age influence the pain assessment and treatment decisions of American and Jordanian undergraduate students; however, the usage of these demographic cues to make pain decisions varies across groups. Future research is needed to identify the underlying mechanisms contributing to international differences in cue usage and to replicate these findings using health care professionals across other countries. Continued research and education in pain management is warranted to better understand the influences of provider biases on pain treatment practices and to develop interventions that target the reduction of these biases.
Acknowledgments
This work was supported by a grant from the National Institute of Dental and Craniofacial Research (R01DE013208) awarded to Dr Michael Robinson.
Footnotes
Disclosure
The authors report no conflicts of interest in this work.
References
- 1.Tamayo-Sarver JH, Dawson NV, Hinze SW, et al. The effect of race/ethnicity and desirable social characteristics on physicians’ decisions to prescribe opioid analgesics. Acad Emerg Med. 2003;10(11):1239–1248. doi: 10.1111/j.1553-2712.2003.tb00608.x. [DOI] [PubMed] [Google Scholar]
- 2.Denny DL, Guido GW. Undertreatment of pain in older adults: an application of beneficence. Nurs Ethics. 2012;19(6):800–809. doi: 10.1177/0969733012447015. [DOI] [PubMed] [Google Scholar]
- 3.Hwang U, Richardson LD, Harris B, Morrison RS. The quality of emergency department pain care for older adult patients. J Am Geriatr Soc. 2010;58(11):2122–2128. doi: 10.1111/j.1532-5415.2010.03152.x. [DOI] [PMC free article] [PubMed] [Google Scholar]
- 4.Mossey JM. Defining racial and ethnic disparities in pain management. Clin Orthop Relat Res. 2011;469(7):1859–1870. doi: 10.1007/s11999-011-1770-9. [DOI] [PMC free article] [PubMed] [Google Scholar]
- 5.Meghani SH. Corporatization of pain medicine: implications for widening pain care disparities. Pain Med. 2011;12(4):634–644. doi: 10.1111/j.1526-4637.2011.01074.x. [DOI] [PubMed] [Google Scholar]
- 6.Leresche L. Defining gender disparities in pain management. Clin Orthop Relat Res. 2011;469(7):1871–1877. doi: 10.1007/s11999-010-1759-9. [DOI] [PMC free article] [PubMed] [Google Scholar]
- 7.Burgess DJ, van Ryn M, Crowley-Matoka M, Malat J. Understanding the provider contribution to race/ethnicity disparities in pain treatment: insights from dual process models of stereotyping. Pain Med. 2006;7(2):119–134. doi: 10.1111/j.1526-4637.2006.00105.x. [DOI] [PubMed] [Google Scholar]
- 8.Hirsh AT, Alqudah AF, Stutts LA, Robinson ME. Virtual human technology: capturing sex, race, and age influences in individual pain decision policies. Pain. 2008;140(1):231–238. doi: 10.1016/j.pain.2008.09.010. [DOI] [PMC free article] [PubMed] [Google Scholar]
- 9.Stutts LA, Hirsh AT, George SZ, Robinson ME. Investigating patient characteristics on pain assessment using virtual human technology. Eur J Pain. 2010;14(10):1040–1045. doi: 10.1016/j.ejpain.2010.04.003. [DOI] [PMC free article] [PubMed] [Google Scholar]
- 10.Hirsh AT, Callander SB, Robinson ME. Patient demographic characteristics and facial expressions influence nurses’ assessment of mood in the context of pain: a virtual human and lens model investigation. Int J Nurs Stud. 2011;48(11):1330–1338. doi: 10.1016/j.ijnurstu.2011.05.002. [DOI] [PMC free article] [PubMed] [Google Scholar]
- 11.Hirsh AT, Jensen MP, Robinson ME. Evaluation of nurses’ self-insight into their pain assessment and treatment decisions. J Pain. 2010;11(5):454–461. doi: 10.1016/j.jpain.2009.09.004. [DOI] [PMC free article] [PubMed] [Google Scholar]
- 12.Hirsh AT, George SZ, Robinson ME. Pain assessment and treatment disparities: a virtual human technology investigation. Pain. 2009;143(1–2):106–113. doi: 10.1016/j.pain.2009.02.005. [DOI] [PMC free article] [PubMed] [Google Scholar]
- 13.Wandner LD, Stutts LA, Alqudah AF, et al. Virtual human technology: patient demographics and healthcare training factors in pain observation and treatment recommendations. J Pain Res. 2010;3:241–247. doi: 10.2147/JPR.S14708. [DOI] [PMC free article] [PubMed] [Google Scholar]
- 14.Wandner LD, Hirsh AT, Torres CA, et al. Using virtual human technology to capture dentists’ decision policies about pain. J Dent Res. 2013;92(4):301–305. doi: 10.1177/0022034513480802. [DOI] [PMC free article] [PubMed] [Google Scholar]
- 15.Alqudah AF, Hirsh AT, Stutts LA, Scipio CD, Robinson ME. Sex and race differences in rating others’ pain, pain-related negative mood, pain coping, and recommending medical help. J Cyber Ther Rehabil. 2010;3(1):63–70. [PMC free article] [PubMed] [Google Scholar]
- 16.Ng B, Dimsdale JE, Shragg GP, Deutsch R. Ethnic differences in analgesic consumption for postoperative pain. Psychosom Med. 1996;58(2):125–129. doi: 10.1097/00006842-199603000-00005. [DOI] [PubMed] [Google Scholar]
- 17.Todd KH, Deaton C, D’Adamo AP, Goe L. Ethnicity and analgesic practice. Ann Emerg Med. 2000;35(1):11–16. doi: 10.1016/s0196-0644(00)70099-0. [DOI] [PubMed] [Google Scholar]
- 18.Anderson KO, Mendoza TR, Valero V, et al. Minority cancer patients and their providers: pain management attitudes and practice. Cancer. 2000;88(8):1929–1938. [PubMed] [Google Scholar]
- 19.Woolf A, Carr A, Frolich J, et al. Investigating the barriers to effective management of musculoskeletal pain: an international survey. Clin Rheumatol. 2008;27(12):1535–1542. doi: 10.1007/s10067-008-0965-2. [DOI] [PubMed] [Google Scholar]
- 20.Sherwood G, McNeill JA, Hernandez L, Penarrieta I, Petersen JM. A multinational study of pain management among Hispanics: an evidence-based approach. J Res Nurs. 2005;10(4):403–423. [Google Scholar]
- 21.Ekman P, Friesen WV. Facial action coding system: a technique for the measurement of facial movement. Palo Alto, CA: Consulting Psychologists Press; 1978. [Google Scholar]
- 22.Ekman P, Friesen WV, Hager JC. Facial action coding system. Salt Lake City, UT: A Human Face; 2002. [Google Scholar]
- 23.Bonham VL. Race, ethnicity, and pain treatment: striving to understand the causes and solutions to the disparities in pain treatment. J Law Med Ethics. 2001;29(1):52–68. doi: 10.1111/j.1748-720x.2001.tb00039.x. [DOI] [PubMed] [Google Scholar]
- 24.Green CR, Anderson KO, Baker TA, et al. The unequal burden of pain: confronting racial and ethnic disparities in pain. Pain Med. 2003;4(3):277–294. doi: 10.1046/j.1526-4637.2003.03034.x. [DOI] [PubMed] [Google Scholar]
- 25.Hoffmann DE, Tarzian AJ. The girl who cried pain: a bias against women in the treatment of pain. J Law Med Ethics. 2001;29(1):13–27. doi: 10.1111/j.1748-720x.2001.tb00037.x. [DOI] [PubMed] [Google Scholar]
- 26.Robinson ME, Riley JL, III, Myers CD, et al. Gender role expectations of pain: relationship to sex differences in pain. J Pain. 2001;2(5):251–257. doi: 10.1054/jpai.2001.24551. [DOI] [PubMed] [Google Scholar]
- 27.Fillingim RB, King CD, Ribeiro-Dasilva MC, Rahim-Williams B, Riley JL., III Sex, gender, and pain: a review of recent clinical and experimental findings. J Pain. 2009;10(5):447–485. doi: 10.1016/j.jpain.2008.12.001. [DOI] [PMC free article] [PubMed] [Google Scholar]
- 28.Mogil JS. Sex differences in pain and pain inhibition: multiple explanations of a controversial phenomenon. Nat Rev Neurosci. 2012;13(12):859–866. doi: 10.1038/nrn3360. [DOI] [PubMed] [Google Scholar]
- 29.Wandner LD, Scipio CD, Hirsh AT, Torres CA, Robinson ME. The perception of pain in others: how gender, race, and age influence pain expectations. J Pain. 2012;13(3):220–227. doi: 10.1016/j.jpain.2011.10.014. [DOI] [PMC free article] [PubMed] [Google Scholar]
- 30.Herman AD, Johnson TM, Ritchie CS, Parmelee PA. Pain management interventions in the nursing home: a structured review of the literature. J Am Geriatr Soc. 2009;57(7):1258–1267. doi: 10.1111/j.1532-5415.2009.02315.x. [DOI] [PubMed] [Google Scholar]
- 31.Horgas AL, Elliott AF. Pain assessment and management in persons with dementia. Nurs Clin North Am. 2004;39(3):593–606. doi: 10.1016/j.cnur.2004.02.013. [DOI] [PubMed] [Google Scholar]
- 32.Chodosh J, Solomon DH, Roth CP, et al. The quality of medical care provided to vulnerable older patients with chronic pain. J Am Geriatr Soc. 2004;52(5):756–761. doi: 10.1111/j.1532-5415.2004.52214.x. [DOI] [PubMed] [Google Scholar]
- 33.Gharaibeh M, Abu-Saad H. Cultural validation of pediatric pain assessment tools: Jordanian perspective. J Transcult Nurs. 2002;13(1):12–18. doi: 10.1177/104365960201300103. [DOI] [PubMed] [Google Scholar]
- 34.Al-Hassan M, Alkhalil MS, Al Ma’Aitah R. Jordanian nurses’ roles in the management of postoperative pain in the postanesthesia care unit. J PeriAnesth Nurs. 1999;14(6):384–389. doi: 10.1016/s1089-9472(99)80101-4. [DOI] [PubMed] [Google Scholar]
- 35.Forgeron PA, Finley GA, Arnaout M. Pediatric pain prevalence and parents’ attitudes at a cancer hospital in Jordan. J Pain Symptom Manage. 2006;31(5):440–448. doi: 10.1016/j.jpainsymman.2005.09.003. [DOI] [PubMed] [Google Scholar]
- 36.Soyannwo OA. Enhancing effective pain control: the role of education. Pain Manage. 2011;1(6):487–487. doi: 10.2217/pmt.11.57. [DOI] [PubMed] [Google Scholar]
- 37.Muñoz RF. Using evidence-based internet interventions to reduce health disparities worldwide. J Med Internet Res. 2010;12(5):e60. doi: 10.2196/jmir.1463. [DOI] [PMC free article] [PubMed] [Google Scholar]
- 38.Darawad MW, Al-Hussami M, Saleh AM, Al-Sutari M. Jordanian patients’ satisfaction with pain management. Pain Manage Nurs. doi: 10.1016/j.pmn.2012.07.005. [Epub December 27, 2012] [DOI] [PubMed] [Google Scholar]
- 39.Abdalrahim MS, Majali SA, Bergbom I. Documentation of postoperative pain by nurses in surgical wards. Acute Pain. 2008;10(2):73–81. [Google Scholar]
- 40.Abushaikha L, Oweis A. Labour pain experience and intensity: a Jordanian perspective. Int J Nurs Pract. 2005;11(1):33–38. doi: 10.1111/j.1440-172X.2005.00496.x. [DOI] [PubMed] [Google Scholar]
- 41.Finley GA, Forgeron P, Arnaout M. Action research: developing a pediatric cancer pain program in Jordan. J Pain Symptom Manage. 2008;35(4):447–454. doi: 10.1016/j.jpainsymman.2007.05.006. [DOI] [PubMed] [Google Scholar]
- 42.Hweidi IM. Jordanian patients’ perception of stressors in critical care units: a questionnaire survey. Int J Nurs Stud. 2007;44(2):227–235. doi: 10.1016/j.ijnurstu.2005.11.025. [DOI] [PubMed] [Google Scholar]
- 43.Wandner LD, George SZ, Lok BC, Torres CA, Hao J, Robinson ME. Pain assessment and treatment decisions for virtual human patients. Cyberpsychol Behav Soc Net. doi: 10.1089/cyber.2012.0707. Epub. [DOI] [PMC free article] [PubMed] [Google Scholar]