Abstract
We describe a compact scanning confocal fluorescence microscope capable of detecting particles concentrations less than 100 particles/ml in ∼15 min. The system mechanically moves a cuvette containing ∼3 ml of sample. A relatively large confocal volume is observed within the cuvette using a 1 mm pinhole in front of a detection PMT. Due to the motion of the sample, particles traverse the confocal volume quickly, and analysis by pattern recognition qualifies spikes in the emission intensity data and counts them as events. We show linearity of detection as a function of concentration and also characterize statistical behavior of the instrument. We calculate a detection sensitivity of the system using 3 μm fluorescent microspheres to be 5 particles/ml. Furthermore, to demonstrate biological application, we performed a dilution series to quantify stained E. coli and yeast cells. We counted E. coli cells at a concentration as low as 30 cells/ml in 10 min/sample.
INTRODUCTION
Detection of pathogens and infectious agents for medical diagnostics and quality testing of water, food, and manufactured products is of great importance. The standard practice of culture growth is both labor-intensive and can take days. Therefore, efforts have been made to exploit advances in optical, electronic, and biological technology to improve portability, ease of use, and lower cost. One approach has been complete automation of culture growth and detection to reduce labor.1 However, increasing the speed of detection, while maintaining high sensitivity, is also a significant technical challenge. In urgent medical cases, a technology will need to rapidly detect 1–100 cells/ml2 much faster than culture growth.3 In addition, more frequent testing could improve manufacturing of products intended for human or animal consumption. Therefore, technologies such as flow cytometry, PCR, and microfluidics are under investigation for rapid pathogen detection. Here, we introduce a new instrument, which combines principles of flow cytometry and fluorescence microscopy to address limitations of these technologies.
One of the mainstays in cellular and particle detection is flow cytometry, which can be used for measuring pathogens.4, 5, 6, 7 Flow cytometry combines fluid flow through a confined volume to characterize a large number of particles using fluorescence and light scattering. Hydrodynamic focusing before detection reduces background signal permitting high sensitivity. However, flow cytometers require regular maintenance and on-board reagent storage limiting instrument portability. Additionally, analyzed sample is not retained for further analysis.
Application of microfluidic technologies inherently addresses issues with portability.8 Miniaturization using microfluidics reduces sample sizes and may improve reaction kinetics necessary for detection. Methods under development include isolation of pathogen DNA for PCR,9, 10 direct optical detection,11 and the means to incorporate all sample processing steps into a single device.12 On the other hand, the small scale makes characterization of large sample volumes difficult, which limits sensitivity. Therefore, concentration of bacteria could be a requirement and a device specific to this task has been described.13
Laser scanning confocal microscopy (LSCM) is a fluorescence technology developed to reduce background signal within large, open volumes. LSCM permits high resolution imaging of a specific region within a given sample. Confocal microscopes create a small point spread function (PSF) (typically ∼ 1 fL) by overfilling the back aperture of a high numerical aperture (NA) objective. Coupled with fluctuation spectroscopy, LSCM can be used to obtain detailed measurement of particle properties.14, 15 However, the small PSF requires sample movement and long acquisition time to obtain data from a large volume. Alternatively, rotation of a cylindrical container allows measurement of fluctuations in many independent volumes within the sample. This method has previously been applied to examine DNA size and concentration.16
In this work, we combine the principles of LSCM with the automated, rapid sample measurement of flow cytometry. We describe and characterize a simple confocal fluorescence microscope capable of scanning a relatively large sample volume and detect particles at low concentration.17 In contrast to flow cytometry, the sample is contained in a closed cylindrical cuvette, which is rotated and translated vertically, and counting is based on pattern recognition rather than fluorescence intensity. Also, in contrast to LSCM, an under-filled, low NA objective results in a larger PSF. The instrument samples hundreds of microliters within minutes, which obviates the need for sample enrichment or amplification before measurement. The technology allows multiple measurements to quantify particle concentration with good precision without sample loss. Operation requires no specialized training and data is simply a count of detected particles. We detail the statistical reliability of the instrument under a number of conditions and show detection of stained E. Coli at 30 cells/ml in 10 min. We also show detection of yeast cells labeled with fluorescent antibody at a concentration of 300 cells/ml in 3 min.
INSTRUMENT DESIGN
Apparatus
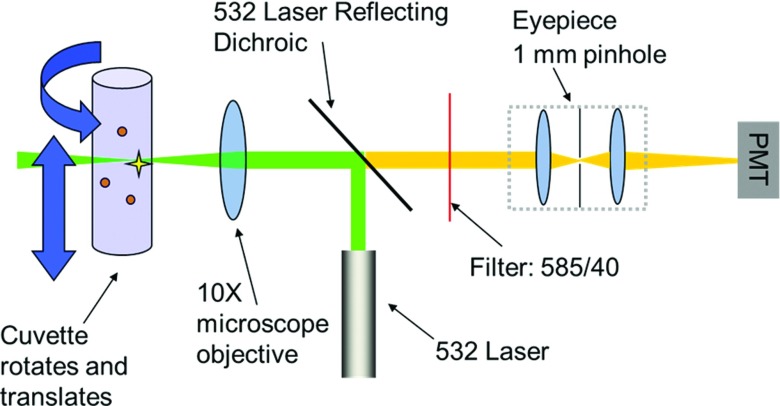
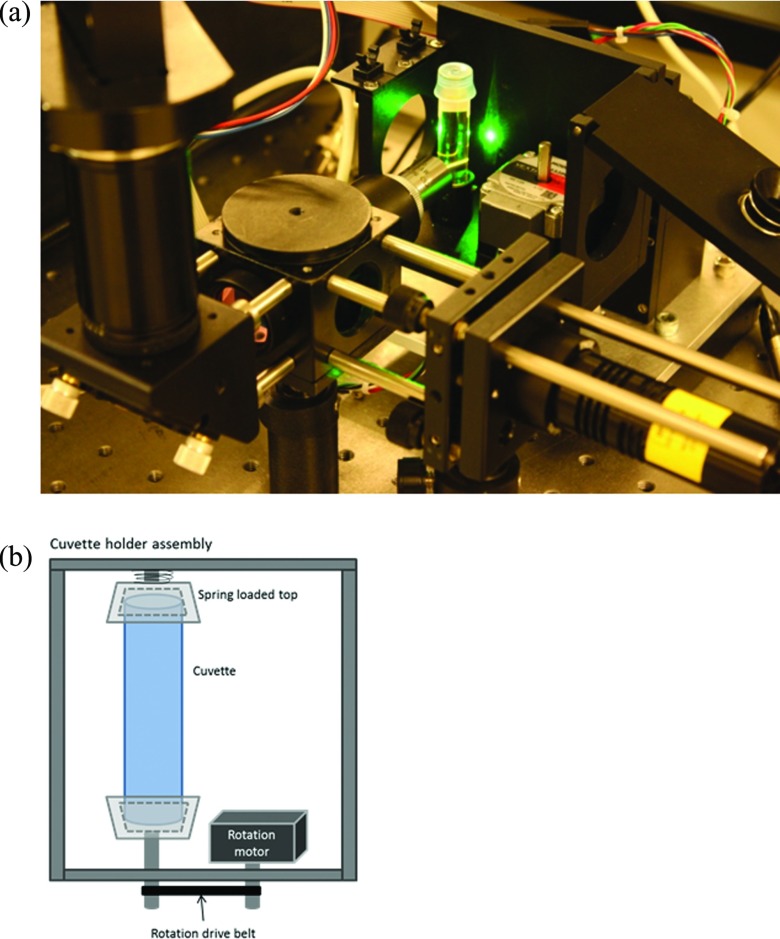
A schematic diagram of the optical setup is shown in Fig. 1, and a photograph of the implemented system is given in Fig. 2. A 20 mW 532 nm laser (World Start Tech, Toronto, CA), with 1/e2 beam diameter of 1.2 mm, is directed by a laser reflecting dichroic mirror (Chroma Technology Corp, Bellows Falls, VT) and focused into the solution by a 10X, 0.25NA objective lens (MV-10X; Newport Corp. Newport CA). Fluorescence emission collected by the same objective lens transmits through the dichroic mirror, and is selected by an emission bandpass filter (585 nm, 40 nm bandpass, Semrock). Emitted light is then focused by the back lens of a 10X Huygens eyepiece (Kyowa Optical Co, Ltd. Hashimoto, Japan) to a centered 1 mm pinhole, inserted between the lenses of the eyepiece, and detected by a PMT (H9305-04 Hamamatsu, Japan).
Figure 1.
Optical schematic diagram of the instrument.
Figure 2.
(a) Photographic image of the apparatus. Note: an earlier rendition is shown than that drawn in Fig. 1. In the above image the emission path to the PMT included a 90° turn. (b) A diagram of the cuvette holder assembly which rotates the cuvette. The entire assembly translates up and down during measurement.
Samples were held in round, cylindrical glass cuvettes with a 10 mm inner diameter (Abbott, Abbott Park IL). A mounted cuvette containing a high concentration of fluorescent dye is shown in the photo in Fig. 2a. Fluorescence excitation from the laser passing through the solution can also be observed in the picture. The mechanical assembly which holds the cuvette includes a stepper motor to drive vertical translation (Vexta, Oriental Motor USA Corp, Torrence CA) and stepper motor to control the cuvette rotation (Haydon Switch and Inst. Co., Waterbury CT). The diagram in Fig. 2b shows the cuvette holder assembly. The cuvette is held at the top and bottom by conical shaped caps with a similar inner diameter as the cuvette. The top cap is attached to an axel which is free to rotate inside a small bearing. A spring along the axel ensures that the cuvette is pressed to prevent slippage. The stepper motor controlling rotation is mounted on a platform with the cuvette and is linked to the bottom axel by a small belt controlling rotation. The top plate of the assembly is hinged to allow the user to add and remove cuvettes. The entire assembly holding both the rotation motor and the cuvette is translated up and down by the second stepper motor during the measurement.
Software (ISS Inc., Champaign IL) controls cuvette motion and digitizes the PMT signal for data storage. Essential parameters controlled by software are the PMT high voltage, A/D clock frequency, cuvette rotation speed, and vertical translation distance and speed. The cuvette rotation speed can be varied up to 300 rpm (5 Hz). The translation distance could be adjusted up to 20 mm with a max speed of 10 mm/s. Unless noted otherwise, our experiments were performed using 300 rpm rotation speed and 10 mm/s translation speed over a vertical distance 10 mm.
Principle of operation
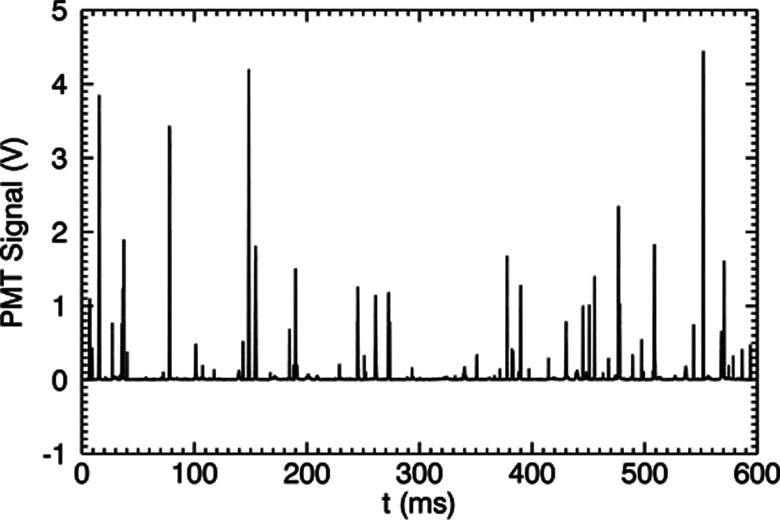
The stepper motor assembly spins and translates the cuvette containing test solution to rapidly probe a large volume. Suspended fluorescent particles move with the solvent and pass through the focused laser inside the cuvette. The emission intensity is measured continuously and recorded. A number of intensity spikes of different amplitudes can be seen in Fig. 3. Spikes from random noise and those resulting from sample scatter or very large aggregates of fluorescent entities can be distinguished from real events. Such qualification of the intensity spikes as valid events is done using a custom pattern recognition filter incorporated into SimFCS version 2.0 (SimFCS, Laboratory for Fluorescence Dynamics, University of California Irvine, Irvine, Calif.).
Figure 3.
Raw data: time trace of PMT signal for fluorescent particles passing through the confocal volume.
The individual trace of each intensity spike is fit to a Gaussian profile using a pattern recognition filter. The analysis software permits the user to vary the parameters of the Gaussian used in the filter. These include the minimum amplitude, standard deviation, and maximum reduced χ2 of a fitted intensity spike. Additional parameters are the expected noise level and an option to apply a smoothing algorithm. The software identifies a potential peak by selecting a number of data points and performing a correlation with a normalized Gaussian defined by
| (1) |
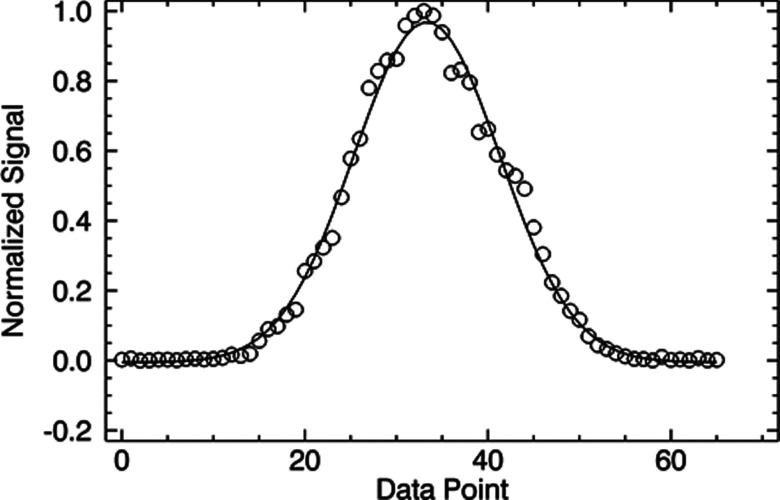
where p is a given point, p0 is the center of the selected data points, and σ is the standard deviation. When the correlation amplitude is greater than the minimum value selected by the user, data points are fit to the filter and a reduced χ2 is calculated. The reduced χ2 is calculated by summing the squared deviation of the Gaussian fit from the data and normalizing by the number of data points and correlation amplitude. In this way, more weight is given to the highly correlated events. If the reduced χ2 is below a user defined threshold, the spike is qualified as a valid hit or count. Example data and a fit are shown in Fig. 4. In this case the width of the Gaussian used (black line) matches the width of the intensity data (red line). Selection of the best threshold values for counting is described in Sec. 3, and the trade-off between sensitivity and selectivity is considered. In principle, the filter may be of any shape; however, the Gaussian function in Eq. 1 is used throughout this paper based on the profile expected for the confocal volume.
Figure 4.
Representative single intensity spike and the fit to a Gaussian profile.
INSTRUMENT CHARACTERIZATION
A number of experiments were performed in order to determine the effects of the adjustable parameters implemented in the analysis software. We used 3–3.4 μm fluorescent polystyrene beads (RFP-30-5; Spherotech, Lake Forest, IL) as representative particles. For experiments in solution, samples were prepared fresh from stock by diluting into phosphate buffered saline at pH 7.4. All samples were mixed by inversion before measurement or dilution. Furthermore, the concentration of stock solution was verified using a hemocytometer (Incyto C-chip, Digital Bio Technology Co., Ltd., Korea) imaged with an epifluorescence microscope (IX81, Olympus, Japan).
PSF determination and properties
Measure the PSF
The confocal volume is created by collecting fluorescence emission from the focused laser through the pinhole placed before the PMT. The PSF of the system is the functional form which quantifies the dimensions of the confocal volume. To measure the PSF, the cuvette holder and rotation assembly were mounted onto a micrometer driven translation stage (Thorlabs, Newton, NJ). Fluorescent beads immobilized in agar gel were placed into a cuvette, and a single bead inside the cuvette was visually isolated in the laser focus by looking through the eyepiece after removing the PMT. With the rotation and translation motors turned off, fluorescence intensity was recorded by mounting the PMT back onto the eyepiece and manually translating the sample through a range of x and z positions:
| (2) |
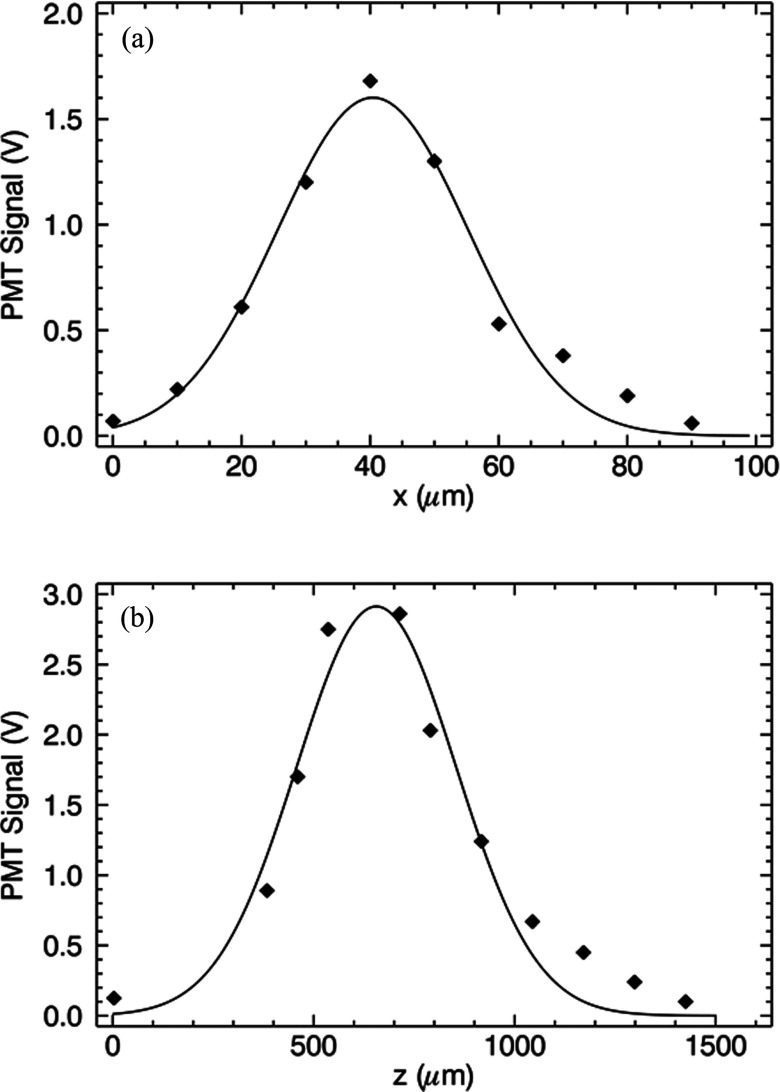
Figure 5 shows data (filled diamonds) and fits (solid lines) assuming a 3D Gaussian profile. In the equation above the horizontal beam waist is given by w0 and the beam waist along the optic axis (z) is z0. This definition of the Gaussian profile is used to separate it from the Gaussian filter f (p) defined above. Because of symmetry, the vertical waist in the y-direction is the same as that in the x-direction. As described below, the most important parameter in terms of the filter used for analysis is the beam waist w0 along the x-direction.
Figure 5.
Laser focus profile by scanning the position of a single fluorescent microparticle. Data were fit to a Gaussian profile. The profiles across the volume (a) and along the optic axis (b) are shown.
Figure 5a shows the fit to data obtained by horizontal translation of the bead through the PSF yielding a beam waist of w0 = 30 ± 4 μm. A fit to data from translation along the optic axis resulted in a standard deviation of z0 = 380 ± 20 μm, which is shown in Fig. 5b. We have fit our data to the Gaussian PSF described by Eq. 2; however, one can observe that the tails of the distribution are more broad than expected. We attribute this effect to the cylindrical shape of the cuvette which acts as a lens changing the optical properties of the system. Using these values for the beam waists in the 3D Gaussian PSF, we estimate a confocal volume of ∼0.7 nanoliter. In the text below we will refer to the confocal volume simply as the PSF.
Relation between PSF and filter standard deviation
The laser in the rare event detection system excites a fluorescent microparticle as it passes through the PSF. We expect solution in the cuvette to rapidly reach the rotation speed of the cuvette, and the microparticle velocity to be dictated by motion of the bulk solvent. Radial centrifugation and motion from diffusion is negligible on the time scale of a particle passing through the PSF (∼0.8 ms at 5 Hz). Therefore, particles pass through the PSF with a horizontal trajectory yielding an intensity profile proportional to the plot shown in Fig. 5a. The linear speed at which the particle passes through the PSF is determined by the rate of rotation and the radial position of the particle. The component of velocity due to vertical translation of the cuvette is negligible compared to the horizontal speed and is ignored for this calculation. Using the PSF width w0, rotation frequency fr, sampling frequency fDAQ, and radial position r of the particle, relative to the center of the cuvette, a standard deviation σ for the Gaussian filter in Eq. 1 can be estimated as
| (3) |
Equation 3 can be used to predict σ based on the instrument settings.
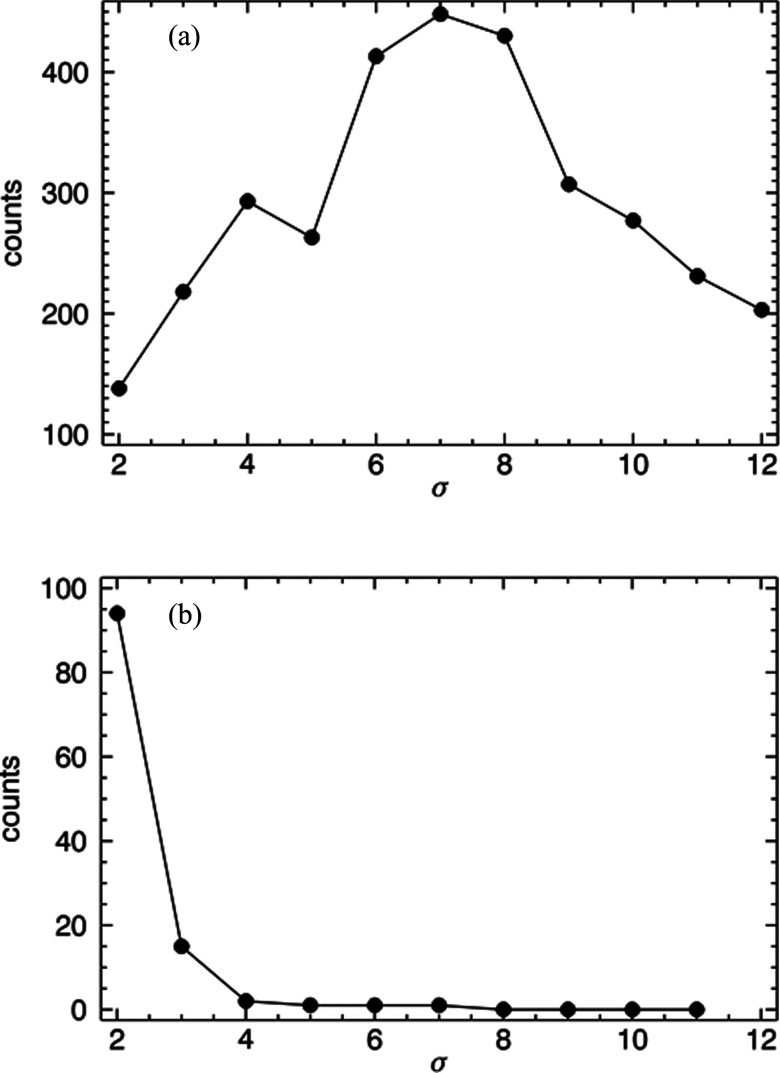
To verify Eq. 3, a sample of fluorescent beads was measured after positioning the laser focus at r = 3.6 mm. Data were acquired while rotating the cuvette at a frequency of 5 Hz using a sampling rate of 50 kHz. Figure 6a shows the results of analysis using filters with integer values of σ ranging 2 to 12. With w0 = 30 μm, Eq. 3 predicts σ = 6.6 as the maximum. The recovered maximum shown in Fig. 6a is 7, which is in good agreement with the predicted value of 6.6. The same analysis was applied to a sample without fluorescent particles and the results from a scan of σ values are shown in Fig. 6b. Hits can only be seen at low values with a maximum at 2. Using Eq. 3, one can calculate that σ = 2 corresponds to a radial position of r ∼ 12 mm, which is outside the physical limit of the cuvette (maximum r = 5 mm). This is likely due to the particle being well out of focus, which is an example of how the filter eliminates intensity spikes from sources not passing through the PSF.
Figure 6.
Hits counted as a function of Gaussian filter width σ. Data from a microparticle solution (a) and a buffer sample (b) are shown.
Sensitivity test with fluorescent microparticles
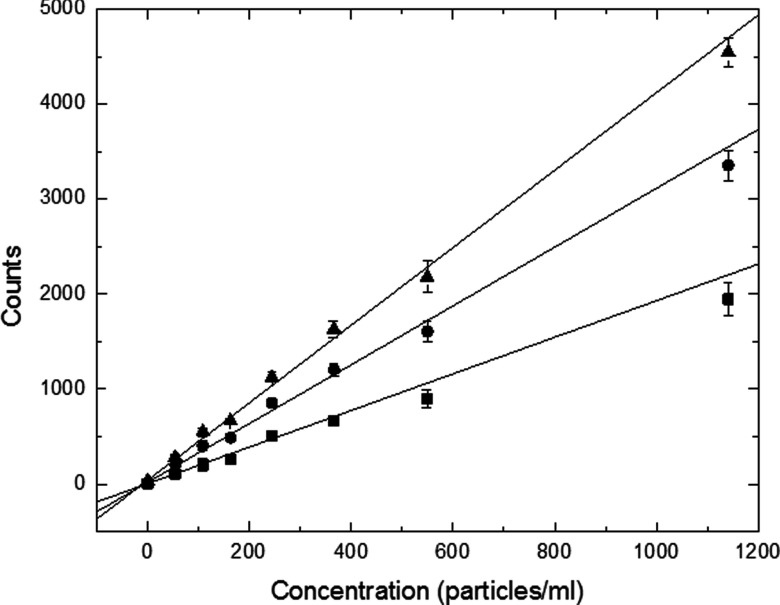
A titration was performed in which particles were diluted in the same cuvette from ∼1200 to 50 particles/ml. At each concentration, the sample was measured 3–4 times for 4 min. Analysis was performed using a peak count threshold of 300 and σ = 6. Three different values for the χ2 threshold were compared to examine the effect on the final results. Plots of data and linear fits are given in Fig. 7. The lowest value of χ2 (0.02) resulted in the smallest slope, while the highest value (χ2 = 0.1) resulted in the largest slope. To further compare the three analysis parameters a limit of detection for each curve was calculated by determining the standard deviation from three measurements of buffer alone and adding 3 times this value to the average number of counts from buffer alone. The concentration of particles corresponding to this minimum count threshold based on the linear fit was assigned as the limit of detection. The results, summarized in Table 1, indicate a limit of detection of 5–6 beads/ml, essentially independent of χ2.
Figure 7.
Fluorescent microparticle dilution series to determine limit of detection. Analysis using a χ2 threshold of 0.02 (squares), 0.05 (circles), and 0.1 (triangles) are shown. The slope of the fit increases with the reduced χ2 threshold. Error bars are calculated from the standard deviation of three measurements of the same sample.
Table 1.
Linear regression and limit of detection for a dilution series of Rainbow beads
| y-Intercept | Slope | Calculated | |
|---|---|---|---|
| χ2 threshold | (counts) | (beads/ml/count) | LOD (beads/ml) |
| 0.02 | 6 | 1.9 | 5 |
| 0.05 | 20 | 3.1 | 5 |
| 0.10 | 41 | 4.1 | 6 |
Statistical analysis
The detection system performs a counting experiment on a solution of fluorescent beads with a given concentration. During the measurement a sub-volume of the cuvette is scanned containing n ± σ particles, where σ = following Poisson statistics since the particles are randomly distributed throughout the cuvette. However, uncertainty in the number of counted particles also arises from the actual number of particles placed in the cuvette from sample to sample. For example, an aliquot of 3 ml from a sample containing 100 particles/ml will contain 300 ± 17. Beyond these statistical variations of the number particles probed in a given sample, there will be some uncertainty in detection using the instrument. To examine this overall behavior, we generated distributions and fits for three experimental cases: (1) A single measurement segmented into multiple time points, (2) a single sample measured multiple times, and (3) multiple aliquots of the same concentration measured individually.
Statistics within a single measurement
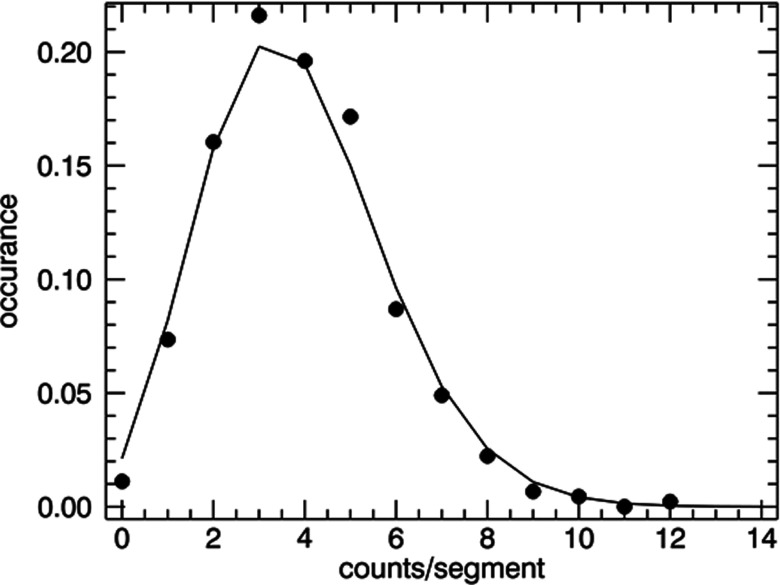
A single sample of fluorescent beads at a concentration 300 beads/ml was prepared in buffer. Data were acquired for 15 min. The 15 min data record was divided into 450 segments and a histogram of the counts per segment was determined. In this case, the uncertainty in the total concentration during the experiment is eliminated and only uncertainty in the total number of particles n in the sub-volume remains. The resulting histogram was fit to a Poisson distribution and the results are shown in Fig. 8. Good agreement between the calculated histogram and Poisson statistics is observed.
Figure 8.
Counting statistics within a single measurement using 300 beads/ml. The analysis yielded 3.9 counts/segment. The Poisson distribution, using an average of 3.9 (solid line), shows good agreement with the histogram (solid circles).
Statistics of data from replicate measurements of a single sample
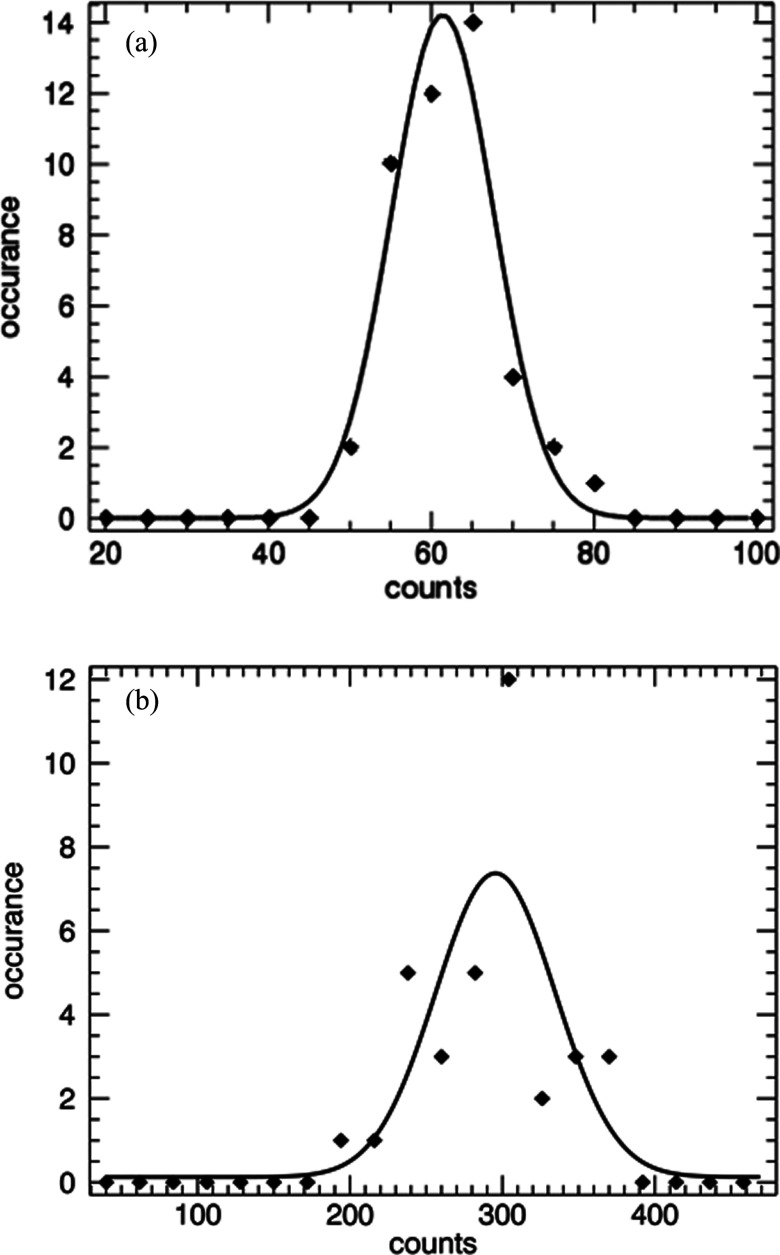
To assess the repeatability of the system, multiple 1 min measurements of a single low concentration sample of fluorescent beads were performed. For this sample, redistribution of the particles from measurement to measurement was avoided by immobilizing the particles in an acrylamide gel. The sample was removed and replaced each time before measurement. This is similar to the experiment above in that only different sub-volumes are measured, while the total concentration is the same. A histogram and fit to a Gaussian is shown in Fig. 9a. The average value from the fit is 64 counts with a standard deviation of 6.3. This indicates excellent reproducibility when measuring a fixed sample.
Figure 9.
Histogram of multiple measurements of a single sample of fluorescent beads (a) suspended in acrylamide and (b) in buffer. The Gaussian fit for (a) yields an average of 61.4 counts and standard deviation of 6.3. For (b) the average is 295 with a standard deviation of 39.
Another sample was prepared is PBS buffer and measured repeatedly after mixing and inverting the cuvette before each measurement. The histogram and fit to a Gaussian is shown in Fig. 9b. The average count is 295 with a standard deviation of 39. This value is approximately twice the width of 17 () based on a Poisson counting experiment. Although the sample contains the same number of particles, redistribution in the sub-volume from measurement to measurement has resulted in a broader distribution.
Statistics from multiple samples
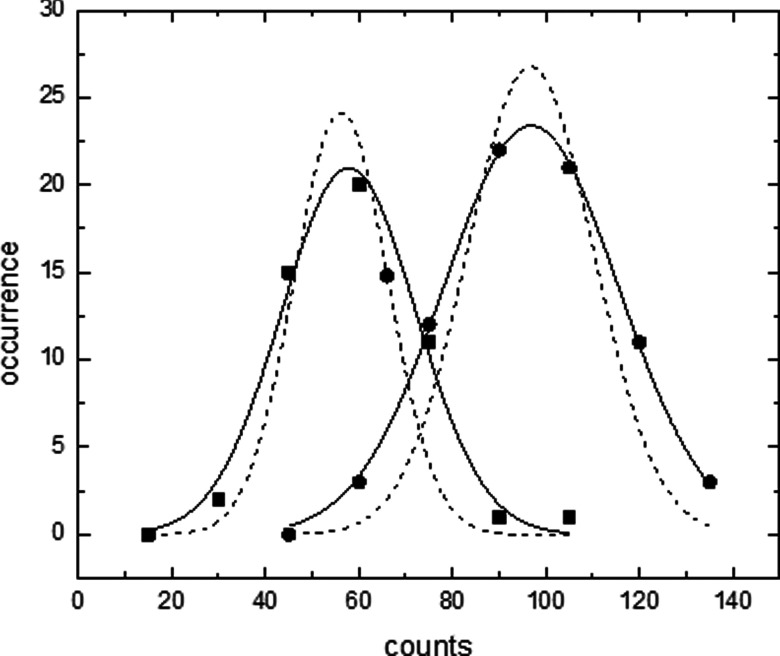
To complete the statistical characterization of the instrument, solutions at a concentration of 50 beads/ml and 100 beads/ml were measured multiple times. For each test, an aliquot of 2.5 ml was placed into a different cuvette, and data were collected for 1 min. Fifty or more aliquots of sample containing 50 beads/ml and 100 beads per/ml sample were measured. Using the same values for all filter parameters (σ = 6 and χ2 threshold = 0.05), data were analyzed and the counts binned into histograms. With these settings, measurements of buffer alone resulted in an average of three counts for a 1 min acquisition.
The plot in Fig. 10 shows the histograms along with fits to a Gaussian statistical distribution. The measured aliquots of 50 beads/ml and 100 beads/ml yield averages of 58 and 105 counts, respectively. The standard deviation for the fit to the 50 beads/ml is 14.5 and for the data from 100 beads/ml is 21.0. The significant overlap between the two distributions suggests difficulty in accurately resolving sample at these concentrations using only a single acquisition. However, one can easily discriminate between these two concentrations by performing the histogram and fitting analysis outlined here. Therefore, accurate determination at low concentration should be performed using such data acquisition and analysis methods. In this case, a total of ∼1 h of data was acquired for each histogram.
Figure 10.
Multiple measurements of samples at two concentrations. The distributions from 50 particles/ml (squares) and 100 particles/ml are shown (circles). Histograms are fit to a Gaussian distribution (solid lines). Estimations of the distribution solely from pipette sampling a finite number of particles are also shown for reference (dashed lines).
APPLICATION
As proof-of-principle applications, we used the instrument to perform titrations of stained cells in solution. Our first example is staining of E. Coli using a cell permeable dye with enhanced fluorescence upon interaction with DNA. A second example is shown in which yeast cells are stained using fluorescent labeled antibody specific to antigen expressed on the cell membrane. The two examples are presented to show linear response using two different staining procedures.
E. coli
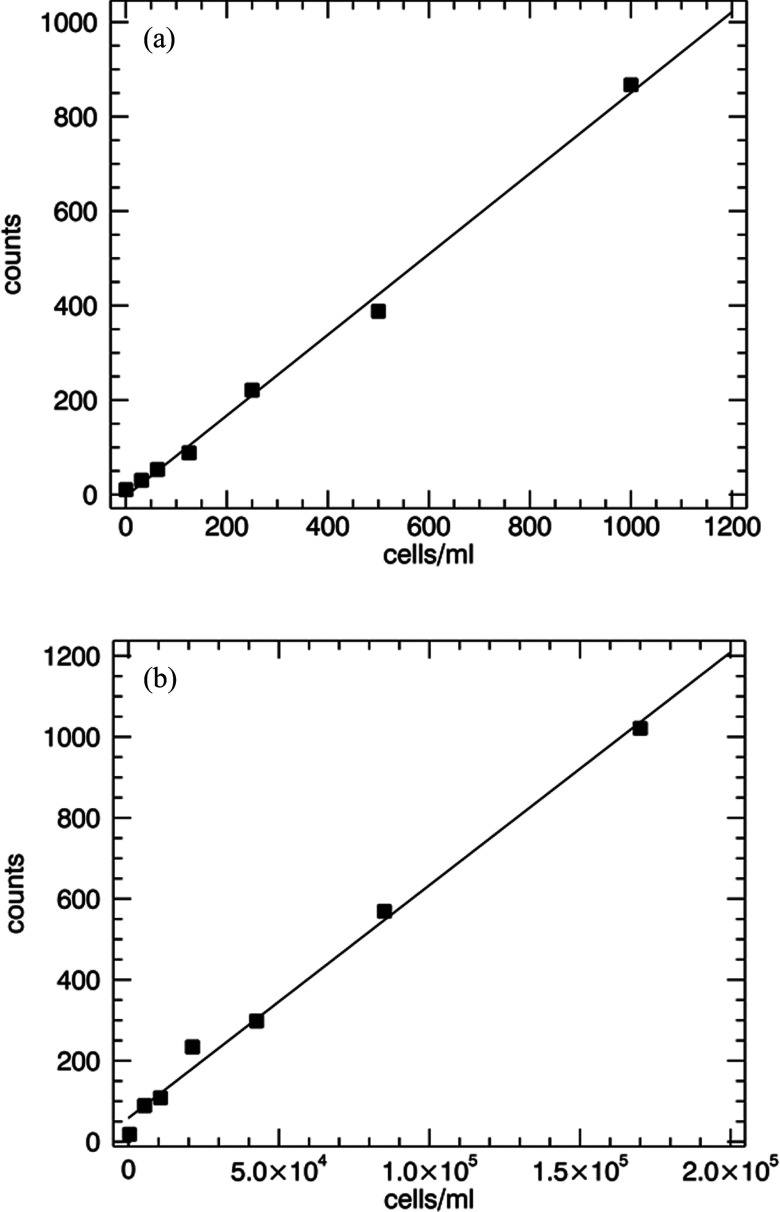
E. coli was cultured in LB broth to high density (8 × 10⁷ cells/ml). 30 μl of the cells were diluted into a solution containing 200 μl of PBS, 200 μl of methanol, and 2 μl of 0.1 mM Sytox Orange DNA binding stain (Life Technologies, Grand Island, NY). This labeled stock of cells was then diluted into 3 ml of PBS to a concentration of 1000 cells/ml and measured for 10 min. Continued titration was performed by diluting the sample a factor of two in the same cuvette for each subsequent measurement. Data were analyzed using a standard deviation of 6 and a peak amplitude threshold of 1000 with a χ2 threshold of 0.02. The resulting count data and linear fit are shown in Fig. 11a. The lowest measured concentration for this experiment was 30 cells/ml.
Figure 11.
Data and linear fits to dilutions performed with stained cells. (a) E. Coli cells stained with Styox Orange and measurement for 10 min/sample. (b) Yeast cells stained by labeled antibody and measured for 3 min each.
Yeast
Yeast expressing NGAL on the surface was shaken overnight in a growth medium at 30 °C. The optical density was measured and the sample was diluted to a final optical density of 1.4 at 600 nm. A 100 μl aliquot of the stock yeast was incubated for 20 min with 85 nM anti‑NGAL mAb 2322 labeled with Alexa Fluor 546 (Life Technologies, Grand Island, NY). This mixture was spun in a mini centrifuge for 30 s to pellet the cells. The supernatant was aspirated and the cells were re-suspended in PBS. This wash procedure was performed twice. The labeled sample was diluted ten-fold into PBS and the concentration was determined using a hemocytometer imaged using fluorescence microscopy. The stock concentration was 1.7 × 10⁷ cells/ml. Data were acquired by performing a dilution of the labeled sample in PBS beginning with concentration 1.7 × 10⁵ cells/ml. Dilutions were performed in the same cuvette following the procedure given for E. Coli above. A sample of PBS without cells was also measured as a control. Three minutes of data were acquired for each sample. Figure 11b shows the results after analysis of the data along with a linear fit.
CONCLUSIONS
We have described an instrument which permits rapid, quantitative detection of fluorescent particles in solution while interrogating sufficient volume to achieve high sensitivity. In the instrument described, only a single color is used. It is straightforward to introduce multicolor excitation and an additional detection path, which would permit multiple specie detection.18 Furthermore, by replacing the pinhole with multiple slits, it may be possible to introduce sensitivity to particle shape and size. These modifications would add another aspect of characterization to the current system and extend its application.
In our proof-of-principle examples, staining is first performed at high concentration of stain and cells, then either diluted or washed. Future biological applications will likely require a staining strategy applicable for low initial concentrations of target cells. Staining at low concentration remains a challenge within the field for pathogen detection and an area of current biochemical research for microscopy and flow cytometry applications.19 If this obstacle is overcome, the technology we describe will find numerous practical applications.
ACKNOWLEDGMENTS
Enrico Gratton acknowledges support from the National Institutes of Health Grant Nos. P41-RRO3155 and P50-GM076516.
References
- Bae E., Patsekin V., Rajwa B., Bhunia A. K., Holdman C., Davisson V. J., Hirleman E. D., and Robinson J. P., Rev. Sci. Instrum. 83, 044304 (2012). 10.1063/1.3697853 [DOI] [PMC free article] [PubMed] [Google Scholar]
- Yagupsky P. and Nolte F. S., Clin. Microbiol. Rev. 3(3), 269–279 (1990). 10.1128/CMR.3.3.269 [DOI] [PMC free article] [PubMed] [Google Scholar]
- Yousef A. E., in Principles of Bacterial Detection: Biosensors, Recognition Receptors and Microsystems, edited by Zourob M., Elwary S., and Turner A. (Springer, New York, 2008), pp. 31–46. [Google Scholar]
- Barbosa J., Costa-de-Oliveira S., Silva A. T., Rodrigues A. G., and Pina-Vaz C., Methods Mol. Biol. 968, 203–211 (2013). 10.1007/978-1-62703-257-5_16 [DOI] [PubMed] [Google Scholar]
- Khan M. M., Pyle B. H., and Camper A. K., Appl. Environ. Microbiol. 76(15), 5088–5096 (2010). 10.1128/AEM.02932-09 [DOI] [PMC free article] [PubMed] [Google Scholar]
- Wada A., Kono M., Kawauchi S., Takagi Y., Morikawa T., and Funakoshi K., PLoS One 7(10), e47093 (2012). 10.1371/journal.pone.0047093 [DOI] [PMC free article] [PubMed] [Google Scholar]
- Zahavy E., Ber R., Gur D., Abramovich H., Freeman E., Maoz S., and Yitzhaki S., Adv. Exp. Med. Biol. 733, 23–36 (2012). 10.1007/978-94-007-2555-3_3 [DOI] [PubMed] [Google Scholar]
- Foudeh A. M., Fatanat Didar T., Veres T., and Tabrizian M., Lab Chip 12(18), 3249–3266 (2012). 10.1039/c2lc40630f [DOI] [PubMed] [Google Scholar]
- Mahalanabis M., Al-Muayad H., Kulinski M. D., Altman D., and Klapperich C. M., Lab Chip 9(19), 2811–2817 (2009). 10.1039/b905065p [DOI] [PubMed] [Google Scholar]
- Oblath E. A., Henley W. H., Alarie J. P., and Ramsey J. M., Lab Chip 13, 1325–1332 (2013). 10.1039/c3lc40961a [DOI] [PMC free article] [PubMed] [Google Scholar]
- Walter A., Marz A., Schumacher W., Rosch P., and Popp J., Lab Chip 11(6), 1013–1021 (2011). 10.1039/c0lc00536c [DOI] [PubMed] [Google Scholar]
- Beyor N., Yi L., Seo T. S., and Mathies R. A., Anal. Chem. 81(9), 3523–3528 (2009). 10.1021/ac900060r [DOI] [PMC free article] [PubMed] [Google Scholar]
- Puchberger-Enengl D., Podszun S., Heinz H., Hermann C., Vulto P., and Urban G. A., Biomicrofluidics 5(4), 044111 (2011). 10.1063/1.3664691 [DOI] [PMC free article] [PubMed] [Google Scholar]
- Kolin D. L. and Wiseman P. W., Cell Biochem. Biophys. 49(3), 141–164 (2007). 10.1007/s12013-007-9000-5 [DOI] [PubMed] [Google Scholar]
- Moens P. D., Gratton E., and Salvemini I. L., Microsc. Res. Technique 74(4), 377–388 (2010). 10.1002/jemt.20919 [DOI] [PMC free article] [PubMed] [Google Scholar]
- Weissman M., Schindler H., and Feher G., Proc. Natl. Acad. Sci. U.S.A. 73(8), 2776–2780 (1976). 10.1073/pnas.73.8.2776 [DOI] [PMC free article] [PubMed] [Google Scholar]
- Gratton E., Motolese G., and Tahari A., “Methods and devices for characterizing particles in clear and turbid media,” U.S. patent 7,973,294 B2 (2011).
- Altamore I., Lanzano L., and Gratton E., Meas. Sci. Technol. 24, 065702 (2013). 10.1088/0957-0233/24/6/065702 [DOI] [PMC free article] [PubMed] [Google Scholar]
- Franzini R. M. and Kool E. T., Bioconjug. Chem. 22(9), 1869–1877 (2011). 10.1021/bc2003567 [DOI] [PMC free article] [PubMed] [Google Scholar]


