

Abstract
Analgesics targeting the δ-opioid receptor (DOR) may lead to fewer side effects than conventional opioid drugs, which mainly act on μ-opioid receptors (MOR), because of the less abundant expression of DOR in the CNS compared with MOR. Analgesic potential of DOR agonists increases after inflammation, an effect that may be mediated by DOR expressed in the peripheral sensory fibers. However, the expression of functional DOR at the plasma membrane of sensory neurons is controversial. Here we have used patch-clamp recordings and total internal reflection fluorescence microscopy to study the functional expression of DOR in sensory neurons from rat trigeminal (TG) and dorsal root ganglia (DRG). Real-time total internal reflection fluorescence microscopy revealed that treatment of TG and DRG cultures with the inflammatory mediator bradykinin (BK) caused robust trafficking of heterologously expressed GFP-tagged DOR to the plasma membrane. By contrast, treatment of neurons with the DOR agonist [d-Ala2, d-Leu5]-enkephalin (DADLE) caused a decrease in the membrane abundance of DOR, suggesting internalization of the receptor after agonist binding. Patch-clamp experiments revealed that DADLE inhibited voltage-gated Ca2+ channels (VGCCs) in 23% of small-diameter TG neurons. Pretreatment with BK resulted in more than twice as many DADLE responsive neurons (54%) but did not affect the efficacy of VGCC inhibition by DADLE. Our data suggest that inflammatory mediator-induced membrane insertion of DOR into the plasma membrane of peripheral sensory neurons may underlie increased DOR analgesia in inflamed tissue. Furthermore, the majority of BK-responsive TG neurons may have a potential to become responsive to DOR ligands in inflammatory conditions.
Introduction
Opioid drugs, such as morphine, are the current “gold standard” in pain relief, but their clinical applications are limited because of associated adverse side effects (Dickenson and Kieffer, 2006). Such side effects occur as a result of widespread expression of opioid receptors, particularly the μ-opioid receptor (MOR), which is the main target in opioid analgesia (Dickenson and Kieffer, 2006). Another opioid receptor subtype, the δ-opioid receptor (DOR), represents a potentially useful alternative target in the treatment of pain as it may result in fewer side effects and lower abuse potential resulting from less abundant CNS expression (Kieffer, 1999; Cahill et al., 2007). Interest in this receptor has grown in recent years. However, the expression, function, and signaling mechanisms of DOR in the peripheral somatosensory pathways remain highly controversial. It is generally thought that plasma membrane expression of DOR is low (Guan et al., 2005; Scherrer et al., 2009) and that DOR agonists are poor analgesics (Scherrer et al., 2004; Gallantine and Meert, 2005). One theory suggests that for DOR to function there must be “priming”; that is, the receptors must be induced in some way in order for them to become active at the plasma membrane. This priming may involve trafficking and insertion of intracellularly localized DOR, or “turning-on” of existing plasma membrane DOR (Patwardhan et al., 2005; Patwardhan et al., 2006), or a combination of both. This priming by external stimuli may account for the enhanced analgesic potential of DOR agonists under certain conditions, such as during inflammatory (Stewart and Hammond, 1994; Fraser et al., 2000; Hurley and Hammond, 2000; Qiu et al., 2000; Cahill et al., 2003; Gendron et al., 2007; Pradhan et al., 2013), neuropathic (Nichols et al., 1995; Mika et al., 2001; Kabli and Cahill, 2007), and cancer (Otis et al., 2011) pain conditions. However, regulated trafficking of DOR remains controversial; it has been suggested that DOR ligands can induce both membrane insertion of the receptor (Bao et al., 2003) and internalization (Scherrer et al., 2009). In a mutant mouse with dorsal root ganglia (DRG)-expressing DOReGFP, it was suggested that DOR is delivered to the membrane via the nonregulated (constitutive) pathway (Scherrer et al., 2009), whereas Patwardhan et al. (2005) suggested that DOR membrane insertion can be stimulated by the inflammatory mediator bradykinin (BK).
The analgesic effect of opioid analgesics is the result, in part, of the receptor-mediated inhibition of voltage-gated Ca2+ channels (VGCCs) (Stein and Zöllner, 2009). Therefore, in this study, we combined patch-clamp recordings of VGCC inhibition by a DOR ligand (as a measure of functional activity of DOR at the plasma membrane), with total internal reflection fluorescence (TIRF) microscopy for live imaging of DOR trafficking in sensory neurons to investigate the effect of BK on the functional expression of DOR in trigeminal ganglia (TG) and DRG of rats. We propose that the enhanced function of DOR under inflammatory conditions in vivo occurs because of an increase in pool size of sensory neurons expressing functional DOR.
Materials and Methods
Neuronal cultures and transfections.
TG and DRG neurons were cultured as described previously (Linley et al., 2008; Liu et al., 2010; Mucha et al., 2010). Briefly, 7-d-old Wistar rats of either sex were killed by overdose of isoflurane. For TG, the skull cap and brain were removed before dissecting out the ganglia by cutting the branches and the nerve root. For preparation of DRG, the spine was removed and bisected along the midline to expose the DRG, which were removed at all levels. All ganglia were transferred immediately to Hanks balanced salt solution (Sigma) at 4°C. Ganglia were then incubated at 37°C, in Hanks balanced salt solution supplemented with collagenase (1 mg/ml, Sigma) and dispase (10 mg/ml, Invitrogen) for ∼20 min. Ganglia were triturated gently 10–20 times using a 1 ml Gilson pipette. Cells were washed twice in 10 ml cold fresh growth media (DMEM with GlutaMAX I, Invitrogen), supplemented with 10% FCS, penicillin (50 U/ml), and streptomycin (50 μg/ml) but with no nerve growth factor added, and collected by centrifugation (800 × g at 4°C for 5 min). Finally, the cell pellet was resuspended in warmed growth media and plated onto glass coverslips (100 μl/10 mm coverslip) coated with poly-d-lysine and laminin. Neurons were cultured for 2–5 d in a humidified incubator (37°C, 5% CO2) in growth media added 3–5 h after plating. When required, transfections were performed on neuronal cell suspension before plating the culture onto coverslips, using the Nucleofection device (Lonza; O-03 program and according to the manufacturer's instructions). GFP-tagged DOR cDNA was a kind gift from Dr. Amol Patwardhan (University of Texas Health Science Center at San Antonio).
Electrophysiology.
Patch-clamp recordings were performed at room temperature. Patch pipettes (resistance 2–4 MΩ) were fabricated from borosilicate glass capillaries using a DMZ-universal horizontal puller (Carl Zeiss). The slow perforated patch configuration (with 0.2–0.4 mg/ml amphotericin B; Sigma) was used to help prevent run down and to maintain the integrity of the neuronal cytoplasm (Linley, 2013). The tip of the pipette was filled by dipping amphotericin-free intracellular solution to aid giga-seal formation, before back filling the rest of the pipette with intracellular solution containing amphotericin B. Pipette and membrane capacitances were compensated automatically using Patchmaster software (version 2.2, HEKA). Currents were amplified using an EPC-10 patch amplifier (HEKA Electronik), recorded using Patchmaster software, and sampled at a frequency of 5 kHz. For whole-cell macroscopic Ca2+ currents, neurons were held at −80 mV and depolarized to 0 mV for 25 ms, leaving an interval of 15 s to help minimize run-down. Neurons that showed >10% run-down over 10 min, or >100 pA current at a holding potential of −80 mV, were discarded. Standard intracellular solution contained the following (in mm): 155 CsCl, 10 HEPES, 1 EGTA, 4 MgCl2, pH 7.2, adjusted with CsOH. Standard bathing solution contained the following (in mm): 150 TEA-Cl, 2.5 CsCl, 2.5 CaCl2, 10 HEPES, 0.5 MgCl2, 10 glucose 10, pH 7.2, adjusted with CsOH. Cells were continuously superfused at ∼2 ml/min with standard bath solution, and drugs were applied via a gravity fed solenoid valve controlled perfusion system (Valvelink 8.2, Automate Scientific).
Ca2+ imaging.
Experiments were performed as described previously (Linley et al., 2008; Liu et al., 2010). Briefly, cells were loaded with fura-2 AM (2 μm; Invitrogen) in the presence of pluronic F-127 (0.04%, Sigma) for 30 min at 37°C in the dark, in a standard imaging solution containing the following (in mm): 160 NaCl, 2.5 KCl, 2 CaCl2, 1 MgCl2, 10 HEPES, 10 glucose, pH 7.4, adjusted with NaOH. Cells were then washed with standard solution and left for a further 10 min in the dark at room temperature to allow de-esterification of intracellular AM esters. Cells were viewed on an inverted TE-2000 microscope (Plan Fluor 10×/0.30 numerical aperture; Nikon) and imaged using a TILL Phototonics Ca2+ imaging system (Polychrome V monochromator and IMAGO CCD camera). Fluorescent images were taken alternately every 2 s with 340 and 380 nm excitation in combination with 510 nm emission filter with 200 ms exposure. Images were analyzed using TILLvisION 4.5.56. Cells that responded to a depolarizing solution containing 50 mm KCl (equimolar substitution of NaCl) were identified as neurons. Intracellular Ca2+ levels were analyzed as F340/F380 ratios (background corrected and normalized to initial value, R0).
TIRF imaging.
TIRF imaging was performed on an inverted microscope (TE-2000E, Nikon) through a 100× oil-immersion lens (Apo TIRF 100×/1.49 numerical aperture, working distance 0.12 mm; Nikon). Cells were maintained at 37°C and perfused with standard imaging solution. Healthy transfected neurons were identified by a combination of bright field imaging, and using a halogen lamp filtered through a GFP bandpass filter (450–480 nm excitation wavelength; Nikon). The plasma membrane was illuminated by TIRF using a 488 nm argon laser (Prairie Technologies), which was projected onto the specimen through the lens. Images were collected on an electron multiplying CCD camera (DQC-FS; Nikon) using NIS Elements imaging software version 3.2 (Nikon), which was also used for analysis. Fluorescence intensities were background-subtracted after acquisition and normalized to the initial intensity (F0). Average baseline intensity was compared with the peak response during drug application and a change of >5% was deemed as a response. TIRF illumination requires the cell under investigation to be in good contact with the glass coverslip. However, in DRG or TG cultures, neurons often reside on the top of the glial cells and so do not have such contact. This, in combination with relatively low efficiency of transfection of primary neuronal culture (∼10%), put significant constraints on the throughput of these experiments.
Calcitonin gene-related peptide (CGRP) release assay.
TG neurons were prepared and plated onto 24-well plates and cultured for 3 d. Cells were washed 3 times with growth media before being treated, and all treatments were made in growth media. To test the effect of the DOR agonist [d-Ala2, d-Leu5]-enkephalin (DADLE; Sigma), cells were pretreated for 5 min in DADLE alone or vehicle before adding capsaicin. After a 30 min incubation at 37°C, the supernatant was removed and stored at −20°C. The concentration of CGRP in supernatant samples was measured using a commercially available rat CGRP enzyme-linked immunosorbent assay (ELISA) kit (SPIBio) according to the manufacturer's instructions. The precoated 96-well plate was washed 5 times with wash buffer, inverted, and shaken to remove excess. The first column was left empty for blanking; three wells containing 100 μl enzyme immunoassay buffer were used to measure nonspecific binding. A total of 100 μl of each standard (8 in total, prepared in growth media) was added to the plate in duplicate, and 100 μl of each sample was added in triplicate; 100 μl of anti-CGRP AChE tracer was then added to all wells, excluding blanks, and the plate covered and incubated for 16–20 h at 4°C. Ellman's reagent was prepared just before plate washing and kept in the dark at 4°C. The plate was emptied and washed 6 times with wash buffer, with a 2 min incubation at room temperature on an orbital shaker between washes 3 and 4. Excess wash buffer and 200 μl Ellman's reagent were added to all wells, and the plate was incubated in the dark at room temperature on an orbital shaker. At 30–60 min after adding the Ellman's reagent, absorbance was measured at 405 nm on an automated microplate reader (BMG Labtech). Readings from blank wells were averaged and subtracted from all other wells. Averages of standard wells were used to produce an 8-point CGRP standard curve, which was then used to calculate CGRP concentration in the samples. To account for differing numbers of cells between wells, cells were lysed after removal of supernatant, and total protein was calculated. Cells were washed once in PBS to remove any media containing protein. For cell lysis, 250 μl of RIPA buffer (50 mm Tris, pH 7.4, 150 mm NaCl, 1 mm EDTA, 1% nadeoxydioate, 0.1% SDS, 1% Triton X), supplemented with a protease inhibitor tablet (1 tablet in 10 ml, Roche) and PMSF (50 μm), was added to each well. After 1 min, the buffer was removed and the samples vortexed thoroughly to ensure that cells were lysed. Samples were centrifuged (13,000 × g, 4°C, 5 min) to collect membrane debris, and the supernatant was removed. Samples were then run in triplicate, on a Micro BCA protein assay (Thermo Fisher Scientific) alongside five standard protein samples of known concentration, as per the manufacturer's instructions. A standard curve was constructed to calculate sample concentrations, which were then normalized by dividing by the average protein concentration. This value was then used to normalize CGRP levels as measured in the ELISA.
Statistics.
All data are given as mean ± SEM. Differences between groups were assessed by Student's t test. Differences between populations were measured using a Fisher's exact test. Comparisons between multiple groups were made using ANOVA. Differences were considered significant at p ≤ 0.05.
Results
BK, but not a DOR agonist, causes trafficking of DOR toward the plasma membrane in sensory neurons
Previous reports have resulted in certain debate regarding the regulation of plasma membrane abundance of DOR in sensory neurons. As such, both ligand-induced membrane insertion (Bao et al., 2003; Petäjä-Repo et al., 2006) and internalization of DOR (Gendron et al., 2006; Pradhan et al., 2009, 2010; Scherrer et al., 2009) have been suggested; it was also proposed that insertion of DOR into neuronal plasma membranes can be stimulated by BK (Patwardhan et al., 2005). However, in most of these studies, indirect methods were used (e.g., biochemical or immunohistochemical analysis of DOR in processed tissue samples). Here, using TIRF imaging, we have studied trafficking of DOR in real time, in neurons transfected with a mDOR-GFP fusion protein. To verify that the transfection was successful and the receptor functional, transfected DRG neurons were tested for responsiveness to a DOR agonist in perforated whole-cell patch-clamp experiments, using inhibition of high-voltage activated (HVA) Ca2+ currents as a functional readout. Only neurons exhibiting green fluorescence were recorded from. Application of the DOR agonist DADLE (200 nm) resulted in a rapid and reversible inhibition of HVA Ca2+ current in all but one of the fluorescent neurons tested (7 of 8). Peak inward currents were inhibited from a baseline value of 715.0 ± 145.7 pA to 461.3 ± 118.8 pA, equivalent to 33.0 ± 11.8% (n = 7, p < 0.01, paired t test; Fig. 1A,B). It is apparent from the current trace (Fig. 1A) that current activation was slowed during DADLE application, which is characteristic of Gi/o-mediated inhibition (Boland and Bean, 1993; Mintz and Bean, 1993). A second exposure to DADLE resulted in a similar level of inhibition suggesting lack of desensitization (Fig. 1C). The second inhibitory effect was abolished by application of the DOR antagonist naltrindole (1 μm; Fig. 1D); this suggests that the inhibition is mediated by DOR (see also DADLE is selective for DOR in Results, below). The proportion of DRG neurons previously reported to express DOR is relatively low, as measured by fluorescent labeling (∼40–50%) and an even lower proportion of neurons express functional DOR at the cell membrane (Gendron et al., 2006; Pradhan et al., 2013). The proportion of TG neurons expressing functional endogenous DOR is also low, amounting to 23% of small TG neurons (see below). Therefore, a high number of DOR-transfected DRG neurons responding to DADLE with VGCC inhibition (an effect that that can be blocked by naltrindole) suggests that transfection of neurons with DOR-GFP leads to overexpression of functional receptors at the plasma membrane.
Figure 1.

DOR agonist DADLE inhibits VGCC currents in DRG neurons overexpressing DOR-GFP. Dissociated DRG neurons were transfected with DOR-GFP. HVA VGCC currents were recorded in perforated-patch mode, and steady-state current was measured. A, Representative current traces show macroscopic VGCC currents elicited by the voltage protocol represented in the inset above. DADLE (200 nm) was applied by perfusion and was washed out on reaching a response plateau. Cadmium (Cd2+, 100 μm) was added at the end to confirm the current was mediated by VGCC. Zero current is indicated by the dashed line. B, Mean data of all experiments as in A. Bars represent mean ± SEM. *Significant difference. C, Time course of VGCC inhibition by a double application of DADLE. Both application of DADLE (D1 and D2) elicited a comparable response (n = 2). D, Similar to C, but DOR antagonist naltrindole (Nt, 1 μm) was applied before the second application of DADLE. Other labeling and abbreviations are as in C. C, D, Gray bars represent timing of drug application.
We next investigated trafficking of DOR in DRG and TG neurons using TIRF microscopy. Figure 2A represents transfected TG neurons imaged in bright-field, epifluorescence, and TIRF mode (as indicated); in the latter case, only the fluorescent “footprint” of the neuronal cell body is seen. In most cases, fluorescence at the plasma membrane was detected at basal conditions, which is consistent with patch-clamp data from neurons transfected with DOR-GFP. In this study, we restricted our observations to small-diameter (predominantly nociceptive) neurons with soma diameters ∼20 μm. In TIRF experiments, application of BK resulted in relatively rapid and robust trafficking of the DOR-GFP fusion protein to the cell membrane in DRG and TG neurons (Fig. 2B–D). The response to BK in most cases was not homogeneous; DOR-GFP fluorescence during BK treatment appeared as bright patches within the “footprint.” An example of such patterned trafficking is given in Figure 2B, C. In some cases, where neuronal projections had formed and were visible in TIRF mode, it was possible to see movement of fluorescent particles along the neurite (data not shown). However, for analysis purposes and quantification, average fluorescence was measured from the whole visible portion of the neuronal “footprint” over time. Overall, 4 of 8 TG and 4 of 7 DRG neurons (a total of 8 of 15 [53.3%] small sensory neurons tested) responded to BK with a significant increase in fluorescence, indicative of receptor trafficking toward the plasma membrane. Relative intensity increased by 18.4 ± 6.1% (n = 4, p < 0.05) in TG and by 12.9 ± 4.4% (n = 4, p < 0.05) in DRG. Fluorescence was often subject to bleaching, an effect that could not always be adequately subtracted from the trace because of its nonlinearity. This, in combination with the patterned nature of the BK-induced increase in fluorescence (Fig. 2B), suggests that the total “footprint” fluorescence intensity increases, as shown in Figure 2C, D, are likely to be an underestimation of the true effect.
Figure 2.
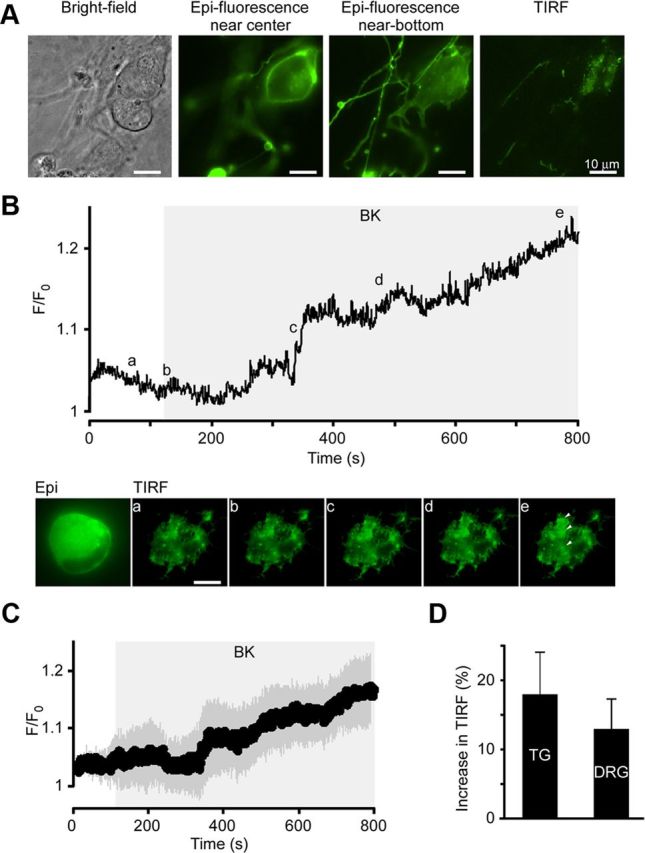
BK increases membrane TIRF intensity in sensory neurons transfected with DOR-GFP. Dissociated TG and DRG neurons were transfected with DOR-GFP and imaged using TIRF. A, Example of a typical DOR-GFP-transfected TG neuron under different illumination modes (as labeled): bright-field imaging (left), epifluorescence (middle left and middle right), and TIRF (right). In the middle right epifluorescence image, the plane of focus is closer to the coverslip. This predicts the shape of the cell “footprint.” In TIRF (right), fluorescence above the evanescent field is eliminated to reveal the actual “footprint” of the cell. B, Application of BK (200 nm) as shown by the gray area led to an increase in fluorescence in patches of membrane (e, arrows) as seen in TIRF mode. Top, Relative fluorescence of the cell footprint over time in neuron shown in the images below. Average fluorescence across the visible “footprint” was measured over time, background subtracted, and normalized to basal intensity (F/F0). Snapshot TIRF images were taken at the time points indicated by the letters. Scale bar, 10 μm. C, Mean relative intensities of the 4 of 8 neurons that responded to BK. Dark gray shading represents the SEM; light gray rectangle represents timing of the BK application. D, Average data for the maximal BK-induced increase in TIRF in TG (n = 4 of 8) and DRG (n = 4 of 7) neurons.
In contrast to BK, DADLE not only failed to induce increase in DOR-GFP TIRF signal but instead markedly reduced it (Fig. 3). At the end of a 600 s application period, 200 nm DADLE caused a robust decrease in plasma membrane fluorescence in all DRG and TG neurons tested by 27.7 ± 5.9% and 27.2 ± 3.0% (n = 6 and 5; p < 0.05), respectively; this suggests that endocytosis of the receptor occurred (Fig. 3). Previous studies have shown that 200 nm is a saturating concentration of DADLE (Morikawa et al., 1998) and that application of much lower concentrations of another DOR agonist peptide, deltorphin I (i.e., 1–10 nm), resulted in agonist-induced DOR insertion (Bao et al., 2003). Another study reported that 10 nm deltorphin II induced CGRP release (presumably from central terminals of nociceptive afferents) in a spinal cord slice preparation (Overland et al., 2009). The latter phenomenon suggests a DOR agonist-induced exocytosis of large dense-core vesicles in central terminals of DRG neurons. Therefore, we investigated whether different responses can be observed with a submaximal concentration of DADLE. In TIRF experiments, the effect of 10 nm DADLE on DOR-GFP fluorescence in DRG neurons was similar to that of 200 nm (Fig. 3B,C). However, there was higher variability in responses, with a trend toward slower decreases in fluorescence, compared with 200 nm DADLE, although the differences were not significant. By the end of a 600 s application, 10 nm DADLE induced a 27.82 ± 10.2% (n = 8; p < 0.05) reduction in fluorescence, which is indistinguishable from the reductions observed with 200 nm DADLE in TG and DRG at this time point. This contradicts the reports that DOR agonists cause insertion of the receptor but falls in line with the general concept that GPCRs (including DOR) are internalized after agonist binding (an effect that depends on agonist-induced phosphorylation of the receptor and β-arrestin recruitment), which has been reported for DOR agonists by others (Gendron et al., 2006; Pradhan et al., 2009, 2010; Scherrer et al., 2009; Audet et al., 2012).
Figure 3.
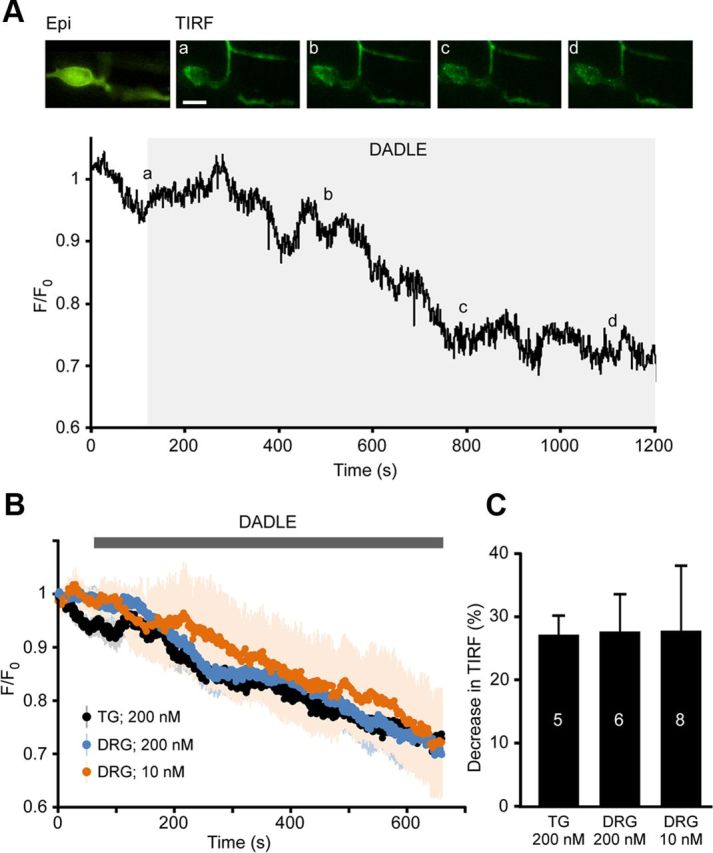
DOR agonist DADLE decreases membrane TIRF intensity in sensory neurons transfected with DOR-GFP. A, Application of DADLE (200 nm) led to the global decrease in fluorescence across the membrane as seen in TIRF mode. Relative fluorescence of the cell footprint over time in a neuron shown in the images above. Average fluorescence across the visible “footprint” was measured over time, background subtracted, and normalized to basal intensity. Snapshot TIRF images were taken at time points indicated by the letters. Scale bar, 15 μm. B, Mean relative TIRF intensities during the application of 200 nm DADLE in DRG (blue, n = 6) and TG (black, n = 5) neurons and of 10 nm DADLE in DRG neurons (orange, n = 8). Values were background subtracted and normalized to the first measurement. Matching color shading represents the SEM. C, Average data for the DADLE-induced decreases in TIRF at the end of the 600 s application period from experiments as in A and B.
It has been suggested previously that trafficking of DOR can be induced by, and is dependent on, increases in intracellular Ca2+ (Bao et al., 2003). The effects of BK signaling in DRG neurons have been investigated previously, and it is known that application of BK causes release of Ca2+ from intracellular stores and also influx of Ca2+ across the plasma membrane in ∼60% of DRG neurons (Liu et al., 2010; Linley et al., 2012). Fura-2 Ca2+ imaging was performed here to determine what percentage of TG neurons responded to BK. Transients similar to those observed in DRG were elicited in response to BK; 35 of 44 (79.5%) TG neurons responded to BK, suggesting that approximately three-fourths of the population of TG neurons (under culture conditions used here) express the BK receptor (Fig. 4A). In contrast, DADLE (200 nm) did not induce a Ca2+ response in TG neurons (Fig. 4B). Thus, in 96 of 97 neurons tested, no detectable Ca2+ responses to DADLE were seen and only one neuron responded with a small transient (data not shown); 75 of 97 neurons responded to capsaicin. This lack of DADLE-induced Ca2+ response in TG neurons is in agreement with the lack of DADLE-induced DOR insertion into the plasma membrane reported here (as the latter is supposedly a Ca2+-dependent process) (Bao et al., 2003).
Figure 4.
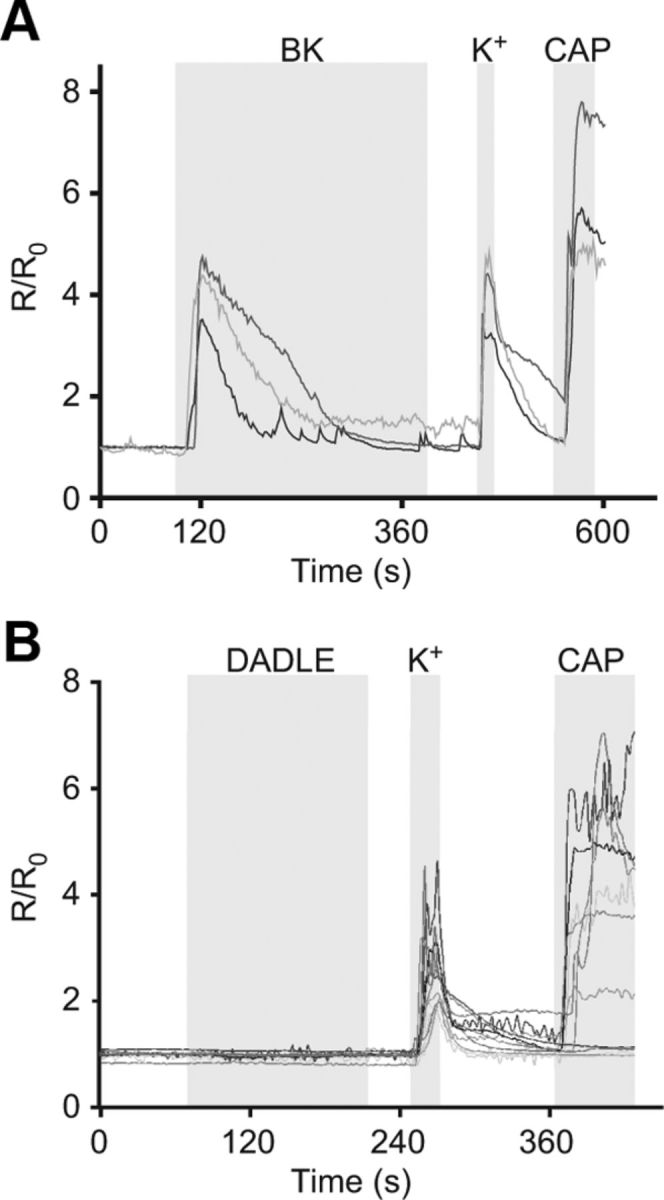
BK, but not DADLE, induces Ca2+ transients in TG neurons. Fura-2 AM Ca2+ imaging of TG neurons. Cells were loaded with fura-2 AM, and levels of intracellular Ca2+ were measured in response to (A) BK (200 nm) and (B) DADLE (200 nm). A total of 35 of 44 of TG neurons responded to BK with a rise in Ca2+, but only 1 of 97 responded to DADLE. Levels are presented as normalized ratios (R/R0) of fluorescence at 340 and 380 nm. Gray areas represent timing of the drug application. A bathing solution containing 50 mm KCl (K+) was applied to identify neurons, and capsaicin (CAP, 1 μm) was applied at the end to identify TRPV1-positive neurons.
BK affects the expression of functional DOR at the plasma membrane
Previously, it has been shown that BK pretreatment can enhance DOR agonist-induced inhibition of CGRP release from TG neurons (Patwardhan et al., 2005) and also that inflammatory conditions enhance the analgesic effects of DOR agonists in vivo (Stewart and Hammond, 1994; Fraser et al., 2000; Hurley and Hammond, 2000; Gendron et al., 2007; Pradhan et al., 2013). It seems likely that such changes may be mediated by altered VGCC modulation by DOR because these channels orchestrate neurotransmission and peptide release from neurons (Catterall, 2011). Our TIRF studies showed that BK causes movement of DOR to the membrane but cannot confirm that the receptors are being inserted. Thus, we studied inhibition of Ca2+ channels by DADLE in TG neurons (1) to use channel modulation as a functional read-out of membrane DOR; and (2) to investigate the effect of BK on DOR-mediated neuronal inhibition. In control TG neurons, DADLE, acting on native DOR, inhibited HVA currents in a rapid and reversible manner in 14 of 62 TG neurons (22.6%) (Fig. 5A,C). At a concentration of 200 nm DADLE inhibited HVA current by 159.3 ± 45.7 pA from a baseline value of 625.4 ± 105.5 pA (25.3 ± 5.0%; n = 10, p < 0.01, paired t test, Fig. 5A). To confirm the proportion of TG neurons endogenously expressing functional DOR with an independent technique, fura-2 Ca2+ imaging was implemented to evaluate the effect of DOR on Ca2+ influx in response to depolarization with a 50 mm K+ solution (depolarization to ∼−26 mV according to the Nernst equation). A 10 s stimulation of neurons with 50 mm K+ solution resulted in Ca2+ transients that could be elicited repeatedly and reliably. Three control Ca2+ transients were elicited before a fourth was obtained in the presence of DADLE (Fig. 5B). Responses were quantified by calculating the area under the curve for each transient. A change in the fourth transient of >10% in the presence of a test compound was considered to be a response (neurons in which the first three depolarization pulses produced variable responses were excluded; see Fig. 5B). In 26% of neurons (14 of 53), DADLE inhibited the Ca2+ transient significantly compared with control (the mean of 3 control transients, p < 0.05, paired t test, Fig. 5B,C). This experiment confirmed the pool size of TG neurons tonically expressing functional DOR.
Figure 5.

Inhibition of VGCC currents by DOR agonist DADLE. A, DADLE (200 nm) inhibited VGCC currents in small-diameter TG sensory neurons. Left, Time course of the exemplary experiment. Middle, Representative current traces. Currents were elicited by stepping to 0 mV for 25 ms every 15 s from a holding potential of −80 mV. Cd2+ (100 μm) was applied at the end of the experiment to confirm that the current was carried by VGCC. Gray bars represent timing of drug application. Bar chart on the right represents summary data for 10 of 43 responsive TG neurons. B, In fura-2 Ca2+ imaging experiments, Ca2+ transients induced by depolarization with 50 mm KCl (K+) were decreased by application of DADLE in 14 of 53 of neurons. A total of 50 mm KCl solution was applied for 10 s every 3 min to induce Ca2+ transients. Three control applications were followed by a fourth application in the presence of DADLE. Gray bars represent timing of drug application. Bar chart on the right represents summary data for 14 of 53 responsive TG neurons. Areas under the curve for each Ca2+ transient were averaged and are shown as mean ± SEM. *, p < 0.05 versus mean of three control transients. ns, Not significant. C, Pie charts represent proportions of DADLE-responsive TG neurons as identified with patch-clamp (left) and Ca2+ imaging (right).
Next, we investigated whether BK treatment affects coupling of DOR to VGCC using patch-clamp electrophysiology. In 15 of 28 BK-pretreated TG neurons (30 min at 37°C), application of 200 nm DADLE inhibited the HVA Ca2+ current in a rapid and reversible manner by 141.7 ± 29.6 pA from a baseline value of 884.1 ± 123.2 pA (18 ± 4%, p < 0.01, n = 15, paired t test, Fig. 6A,B). Importantly, BK pretreatment had a dramatic effect on the number of neurons that responded to DADLE as this population more than doubled, increasing from 23% (control) to 54% (BK-treated; p < 0.05, Fisher's exact test; Fig. 6C). The BK treatment did not change the proportion of TG neurons responding to capsaicin; that is, 65% (15 of 23) control neurons and 58% (11 of 19) of BK-treated neurons responded to 1 μm capsaicin with robust inward current (data not shown). Similarly, BK treatment did not change the proportion of TG neurons expressing T-type Ca2+ channels, judged by the presence of a low-voltage activated Ca2+ current component (activated by a voltage step to −40 mV). The percentage of neurons expressing this current was comparable between the control (16 of 40; or 40%) and BK-treated (11 of 26; or 42%) cultures, respectively. Thus, the effect of BK on the functional expression of DOR displays certain selectivity.
Figure 6.

DADLE inhibition of VGCC currents in TG neurons pretreated with BK. A, Inhibition of VGCC currents by DADLE in cultured TG neurons pretreated (30 min at 37°C) with BK (200 nm). B, Bar chart represents summary data for experiments as in A for 15 of 28 DADLE-responsive, BK-pretreated TG neurons. C, Pie charts represent proportions of DADLE-responsive TG neurons in untreated control cultures (Control) and in the BK-pretreated cultures (BK-treated). *Different from control (p < 0.05, Fisher's exact test). D, Concentration dependency of inhibition of VGCC current by DADLE (3–200 nm; as indicated) in control TG neurons (light gray bars) and BK-pretreated TG neurons (black bars). Number of responsive neurons out of total neurons tested is indicated for each bar. Dark gray bars on the left represent (as labeled) the effect of 200 nm DADLE in DOR-GFP-transfected DRG neurons (DOR-transfected) and the effect of 1 μm DAMGO in control TG neurons. E, Transient inhibition of VGCC currents by BK. Recording conditions and labeling are similar to those in experiments shown in Figures 1 and 5A.
Surprisingly, the magnitude of current inhibition by 200 nm DADLE in neurons treated with BK did not differ significantly from that seen in control neurons (25 ± 5%; p > 0.05, one-way ANOVA; Fig. 6D), suggesting that BK treatment does not significantly affect efficacy of DADLE. At 200 nm, DADLE induces maximal inhibition of VGCC (the IC50 of DADLE for inhibition of neuronal VGCC was reported at 3.75 nm) (Morikawa et al., 1998). To investigate the effects of BK on the potency of DADLE, we measured VGCC inhibition in response to submaximal (3 and 10 nm) concentrations of DADLE in control and BK-pretreated neurons. Interestingly, there was no obvious difference in DADLE-induced inhibition at either 3 or 10 nm DADLE between two groups, as the inhibitory effect of the agonist was not statistically different between control and BK-treated neurons (Fig. 6D). Nevertheless, a significant increase in the proportion of DADLE-responsive neurons upon BK treatment was also apparent at these lower concentrations of DADLE (54.5% in BK-treated culture vs 21% in control culture; Fig. 6D). These data suggest that BK treatment changes neither efficacy nor potency of DADLE dramatically. Interestingly, inhibition of VGCC induced by 200 nm DADLE in neurons overexpressing DOR-GFP (33 ± 12%; Fig. 6D) was also not significantly different from that in control or BK-treated neurons (p > 0.05, one-way ANOVA). Moreover, VGCC inhibition by the MOR agonist DAMGO (1 μm) was within the same range (22 ± 6%, n = 6; Fig. 6D), suggesting that 20–30% inhibition of VGCC is the maximal level produced by either class of opioid receptors in TG neurons. These numbers are in accord with those seen by others in sensory neurons (Acosta and Lopez, 1999; Wu et al., 2008).
BK pretreatment alone did not affect the VGCC current density in TG neurons (−46.6 ± 4.4 pA/pF in control neurons and −47.3 ± 4.3 pA/pF in BK-pretreated neurons). However, it was necessary to rule out the possible contribution of acute inhibition of VGCC by BK (as this has been reported previously) (Vaughn and Gold, 2010) to the effect of DADLE. Thus, short-term effects of BK on HVA currents were also investigated here; in 3 of 7 TG neurons, BK inhibited HVA currents rapidly from an amplitude of −876.9 ± 369.0 pA to −617.1 ± 348.9 pA, equivalent to 46 ± 20% inhibition (n = 3, p < 0.05, paired t test). This effect desensitized slowly, returning to baseline within ∼6 min (Fig. 6E). Thus, we conclude that the BK treatment period (30 min) was long enough to ensure desensitization of any acute inhibitory effects but not long enough to result in long-term changes in HVA Ca2+ current density.
Functional TRPV1 and DOR coexpress in sensory neurons
Current literature debates coexpression of TRPV1 and DOR in sensory neurons (Scherrer et al., 2009; Wang et al., 2010); therefore, we used functional tests to assay for such coexpression. In Ca2+ imaging recordings, application of capsaicin (1 μm) at the end of each experiment revealed that 26 of 53 (49%) neurons were TRPV1-positive; and of the 14 DADLE responsive neurons (Fig. 5B), 7 were TRPV1-positive. In patch-clamp experiments, 3 of 10 DADLE-responsive neurons responded to capsaicin, whereas among total TG neurons tested in this way, 23 of 43 responded to capsaicin. This indicates coexpression of DOR and TRPV1 in 30–50% of TG neurons expressing functional DOR under basal conditions. To investigate the possible functional outcome of coexpression of TRPV1 and DOR in TG neurons, capsaicin-induced CGRP release was measured by ELISA. Capsaicin causes release of CGRP by selectively activating TRPV1-positive neurons (Holzer, 1991), therefore allowing assessment of the inhibitory effects of DADLE in TRPV1-positive neurons. TRPV1 activation induces both Ca2+ influx and depolarization. The latter, in turn, can cause VGCC activation and further Ca2+ influx. Thus, we hypothesized that DADLE-induced inhibition of VGCC could reduce capsaicin-induced CGRP release. Indeed, 1 μm capsaicin caused strong release of CGRP (Fig. 7A) compared with control (untreated cells), where levels of CGRP were often too low to detect (Fig. 7A). Treatment with DADLE before and during capsaicin stimulation resulted in attenuation of the capsaicin effect on CGRP release (n = 6; p < 0.05; repeated-measures ANOVA with Tukey post test), suggesting that activation of DOR decreased the effects of capsaicin and again confirming coexpression of TRPV1 and DOR in a subset of neurons.
Figure 7.
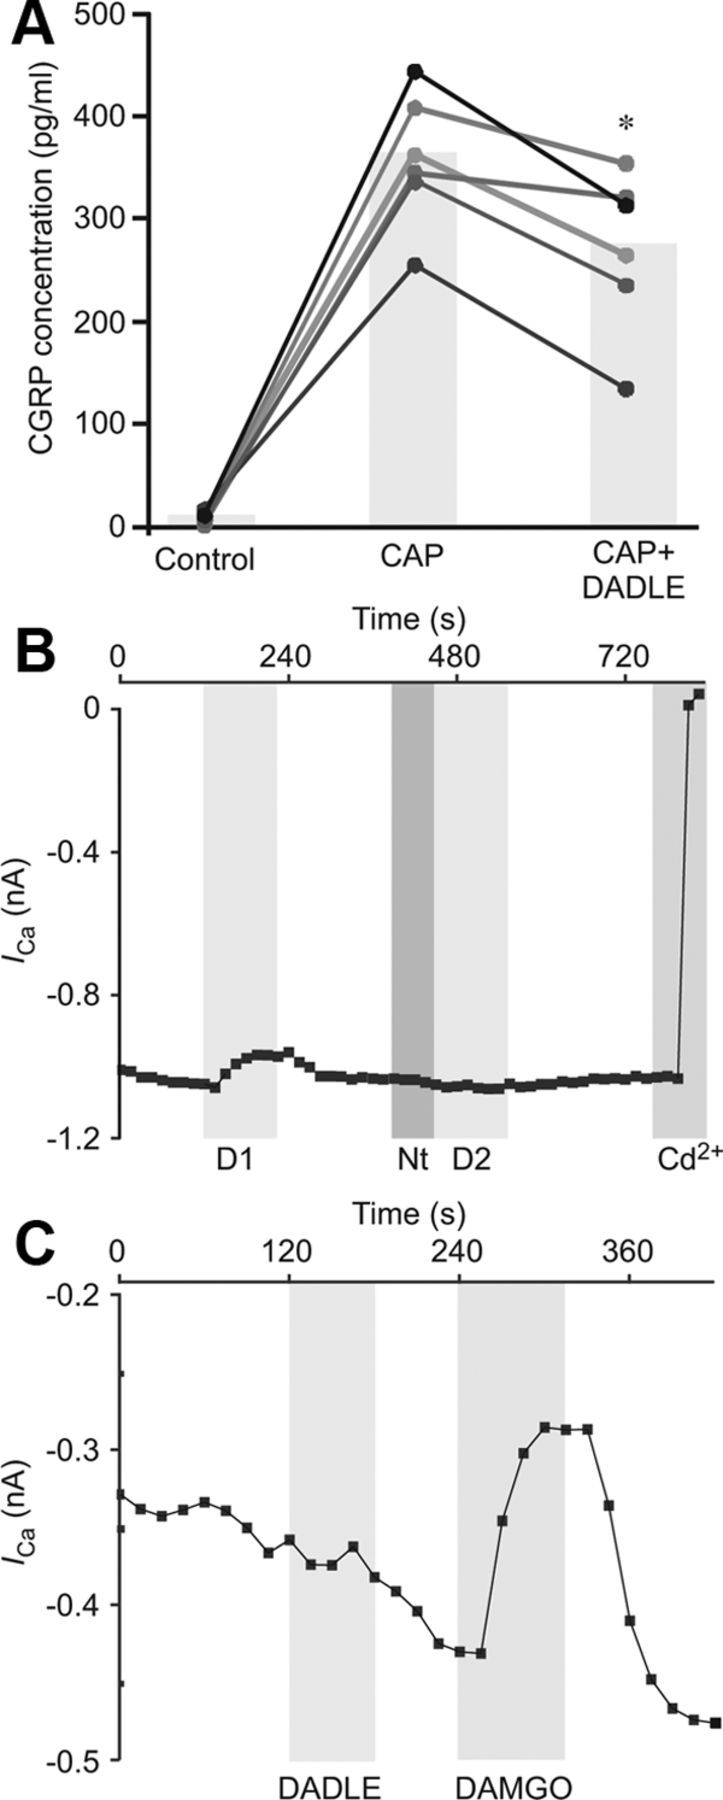
A, Capsaicin-induced CGRP release is attenuated by DADLE. TG cultures were pretreated with DADLE or vehicle for 5 min before incubating with 1 μm capsaicin for 30 min. The supernatant was collected, and levels of CGRP protein were measured by ELISA. All CGRP concentrations were normalized to total protein concentration per well. Data are presented as values for each well (scatter plot) and the mean for each treatment group (bar). Lines connect data from the same experiment. *p < 0.05 versus CAP alone (repeated-measures ANOVA with Tukey post test). B, C, DADLE is selective for DOR. B, Application of DOR antagonist naltrindole (1 μm) abolished second response to DADLE (n = 3). C, MOR agonist DAMGO inhibited VGCC in a subset of TG neurons, signifying functional MOR expression. In three MOR-positive cells, the DOR agonist DADLE had no effect on the VGCC current. B, C, Gray bars represent timing of drug application.
DADLE is selective for DOR
Previous studies using 1 μm DADLE have yielded contradictory results regarding specificity of this agonist for DOR over MOR (Acosta and Lopez, 1999; Walwyn et al., 2005). Thus, it was necessary to verify selectivity of DADLE (at the concentrations used in this study, up to 200 nm) for DOR. Because tonic expression of functional DOR in TG is low but BK strongly increased the proportion of DOR-positive neurons (without much effect on the efficacy of DOR-induced VGCC inhibition), the effects of DOR antagonist naltrindole were tested in BK-pretreated neurons. Natrindole (1 μm) had a negligible effect on VGCC currents but blocked almost all of the inhibition by DADLE (Fig. 7B). Inhibition was decreased from 19.4 ± 7% to 3.9 ± 3.6% (n = 3). In three neurons that responded to the MOR agonist DAMGO with significant HVA Ca2+ channel inhibition (17 ± 5.3% inhibition, n = 3, p < 0.05, paired t test), 200 nm DADLE had no effect, which further confirmed that 200 nm DADLE does not activate MOR in TG neurons.
Discussion
The enhanced analgesic effect of DOR agonists during inflammation is well documented (Stewart and Hammond, 1994; Fraser et al., 2000; Hurley and Hammond, 2000; Gendron et al., 2006, 2007; Pradhan et al., 2013). This, along with evidence for functional “priming” of DOR by the inflammatory mediator BK (Patwardhan et al., 2005), suggests that crosstalk between different proinflammatory GPCRs is important in opioid analgesia. Because CGRP release is a Ca2+-dependent process that can be driven by the depolarization-induced activation of VGCC (Sakaguchi et al., 1991), it is plausible that increased inhibition of VGCC by Gi/o-coupled DOR may underlie the observed increase in efficacy of DOR-mediated antinociceptive action triggered by inflammation (Pradhan et al., 2013) or BK specifically. In this study, it has been shown that BK pretreatment did not affect VGCC current density (apart from transient inhibition, which recovered completely within 6 min of BK treatment), and it did not increase the amplitude of VGCC inhibition by the DOR agonist DADLE. However, it did result in a large increase in the number of neurons that exhibited DOR-mediated inhibition of VGCC. This could lead to an overall enhancement of the effects of DOR agonists observed across the population of neurons, which is in keeping with previous findings. Notably, after BK treatment, the population of DOR-responsive TG neurons exceeded 50%. Taking into account reports suggesting that 50–80% of small-diameter TG and DRG neurons express bradykinin B2 receptor (Patwardhan et al., 2005; Liu et al., 2010; present study), it can be concluded that the majority of sensory neurons that express B2 receptors are capable of expressing DOR upon stimulation. It suggests that inflammation renders the population of neurons more susceptible to the effects of DOR agonists and that the enhanced effects are a result of more neurons responding in an inhibitory manner, rather than higher levels of inhibition in individual neurons. It has to be pointed out that the above consideration, although conceivable for the DOR-induced inhibition of VGCC, may not necessarily be true for other effects of DOR. Indeed, the BK-induced enhancement of DOR-mediated adenylyl cyclase inhibition (Patwardhan et al., 2005) may be more graded and may, in addition to trafficking, also require potentiation of existing DOR, as originally suggested. Nevertheless, our findings put forward a prominent role of BK-induced DOR trafficking as a putative mechanism for the enhanced analgesic effects of DOR agonists in animal models of injury and inflammation.
Exactly how BK exerts this effect is not clear. Possible explanations include the following: (1) BK increases the levels of membrane DOR in a population of neurons that previously did not express sufficient levels to inhibit VGCC; (2) BK increases coupling of already present membrane DOR to VGCC; or (3) BK causes modifications in VGCCs, rendering them more prone to inhibition by DOR. It is also possible that several mechanisms occur together to produce this effect. However, the TIRF data here specifically support the first explanation.
If BK induces general insertion of DOR into the plasma membrane of sensory neurons, why is there no increase in efficacy or potency of DADLE in individual neurons? If anything, a trend toward decreased efficacy in BK-treated neurons is observed (see Fig. 6D). In regards to efficacy, one possible explanation may be related to the mechanism of inhibition. Gi/o-mediated inhibition of VGCC is usually brought about by binding of the Gβγ subunit, which does not simply block the channel but instead causes a rightward shift in the voltage dependence of activation to more depolarized potentials, pushing the channels from a “willing” to “reluctant” state (Herlitze et al., 1996; Ikeda, 1996). In a fully executed reluctant state, the channel can still be opened by voltage but with a more positive V0.5. Before BK treatment, a small subpopulation of sensory neurons expresses functional DOR at the membrane, which are already fully coupled to VGCC. In these neurons, DADLE induces a maximal shift in channel voltage dependence; therefore, although VGCC current inhibition by DADLE is not complete, it is the maximal value. Therefore, any further BK-induced receptor insertion will not increase the amplitude of maximal VGCC inhibition in these neurons. Those neurons that do not normally express functional DOR at the membrane may have a stock of intracellularly stored receptors, and BK treatment may promote their insertion into plasma membrane making these neurons “de novo DOR-competent.” However, the plasma membrane DOR abundance in these neurons can actually be even lower than that of “tonically DOR-competent” neurons. This could explain a trend toward decreased efficacy of DADLE in BK-treated neurons and a lack of expected increase in DADLE potency, as in BK-treated culture there will be a mixture of de novo- and tonically DOR-competent neurons. In other words, BK treatment is likely to enhance action of DADLE in individual neurons, but this effect may be lost when evaluating a population of BK-treated neurons. This hypothesis also implies that relatively low abundance of DOR at the plasma membrane is sufficient to produce a saturating effect. In support of this idea, the overexpression of DOR-GFP did not result in significant increase in DADLE efficacy; it only maximized the number of DADLE-responsive neurons, an effect that is qualitatively very similar to that of BK treatment. Moreover, an agonist of the much more ubiquitous opioid receptor, MOR (DAMGO), also inhibited VGCC by only 22% suggesting that this is indeed a systemic level of VGCC inhibition by an opioid receptor in small TG neurons.
Previous studies of DOR expression and function have resulted in several controversial issues, some of which have been addressed here. One such issue is coexpression of DOR with TRPV1. The level of coexpression of the two receptors was reported to be very low in DOReGFP reporter mice (Scherrer et al., 2009) but was found to be high by Wang et al. (2010). It was suggested, in the latter study, that the trafficking of DOR may have been hindered in DOReGFP reporter mice. Here, functional coexpression of native DOR and TRPV1 was shown in patch-clamp experiments (although overlap is not >50%) and in CGRP release assay. Inhibition of CGRP release suggests that DOR agonists can inhibit release of a pronociceptive peptide, thus strengthening the case for DOR as an analgesic target.
Another issue addressed here is internalization of DOR after receptor binding. It has been suggested that DOR agonists themselves can cause receptor insertion via activation of Ca2+ release from IP3-sensitive stores (Bao et al., 2003). Another study reported that DOR ligand, deltorphin, induced CGRP release in the spinal cord (Overland et al., 2009), an observation compatible with DOR ligand-induced exocytosis of large dense-core vesicles. This goes somewhat against the general consensus that GPCRs, including DOR (Gendron et al., 2006; Pradhan et al., 2009, 2010; Scherrer et al., 2009) are internalized after agonist binding. In this study, Ca2+ imaging and TIRF microscopy were used to investigate ligand-induced trafficking of DOR in TG and DRG neurons. In contrast to the study by Bao et al. (2003), it was shown here that: (1) changes in intracellular Ca2+ induced by DOR are minimal; and (2) application of DADLE at 10–200 nm causes a decrease of DOR abundance at the membrane. The reasons for these conflicting results are yet to be established but may include the following: (1) Differential ability of DOR ligands to induce internalization; indeed, different DOR agonists were used in the present study (DADLE) and in others (Bao et al., 2003; Overland et al., 2009) (deltorphins). As clearly shown previously (Pradhan et al., 2009, 2010), DOR agonists can differ dramatically in their ability to induce receptor internalization. (2) Methodological differences, e.g., CGRP release (Overland et al., 2009) or changes in membrane capacitance (Bao et al., 2003) report exocytosis but do not confirm insertion of DOR; on the other hand, internalization of GFP-labeled and overexpressed receptors, as used in the current study, may not faithfully report behavior of endogenous receptors. Thus, it is conceivable that DOR activation may produce a combination of exocytosis and endocytosis and, thus, simultaneous internalization of activated/phosphorylated receptors and some insertion of new ones. Different ligands may push this balance in different directions, and different experimental approaches may preferentially detect either receptor insertion or internalization. Thus, further research is needed to comprehensively characterize ligand-induced DOR trafficking.
In conclusion, here we have shown in real-time that acute treatment with the inflammatory mediator BK can induce rapid trafficking of DOR to the plasma membrane in sensory neurons. Patch-clamp data have shown that this increased plasma membrane expression yields a larger population of neurons that respond to a DOR agonist in an inhibitory manner; therefore, it can be suggested that BK controls the pool size of DOR-expressing nociceptors. We also suggest that a larger proportion of sensory neurons may have the potential to express DOR at the plasma membrane than was previously thought.
Footnotes
This work was supported by Biotechnology and Biological Sciences Research Council, Medical Research Council, Wellcome Trust, and Pfizer. We thank Katarzyna Marszalek for expert technical assistance and Dr. Lezanne Ooi for helpful advice.
The authors declare no competing financial interests.
References
- Acosta CG, López HS. δ Opioid receptor modulation of several voltage-dependent Ca2+ currents in rat sensory neurons. J Neurosci. 1999;19:8337–8348. doi: 10.1523/JNEUROSCI.19-19-08337.1999. [DOI] [PMC free article] [PubMed] [Google Scholar]
- Audet N, Charfi I, Mnie-Filali O, Amraei M, Chabot-Doré AJ, Millecamps M, Stone LS, Pineyro G. Differential association of receptor-Gβγ complexes with β-arrestin2 determines recycling bias and potential for tolerance of δ opioid receptor agonists. J Neurosci. 2012;32:4827–4840. doi: 10.1523/JNEUROSCI.3734-11.2012. [DOI] [PMC free article] [PubMed] [Google Scholar]
- Bao L, Jin SX, Zhang C, Wang LH, Xu ZZ, Zhang FX, Wang LC, Ning FS, Cai HJ, Guan JS, Xiao HS, Xu ZQ, He C, Hökfelt T, Zhou Z, Zhang X. Activation of δ opioid receptors induces receptor insertion and neuropeptide secretion. Neuron. 2003;37:121–133. doi: 10.1016/S0896-6273(02)01103-0. [DOI] [PubMed] [Google Scholar]
- Boland LM, Bean BP. Modulation of N-type calcium channels in bullfrog sympathetic neurons by luteinizing hormone-releasing hormone: kinetics and voltage dependence. J Neurosci. 1993;13:516–533. doi: 10.1523/JNEUROSCI.13-02-00516.1993. [DOI] [PMC free article] [PubMed] [Google Scholar]
- Cahill CM, Morinville A, Hoffert C, O'Donnell D, Beaudet A. Up-regulation and trafficking of δ opioid receptor in a model of chronic inflammation: implications for pain control. Pain. 2003;101:199–208. doi: 10.1016/S0304-3959(02)00333-0. [DOI] [PubMed] [Google Scholar]
- Cahill CM, Holdridge SV, Morinville A. Trafficking of δ-opioid receptors and other G-protein-coupled receptors: implications for pain and analgesia. Trends Pharmacol Sci. 2007;28:23–31. doi: 10.1016/j.tips.2006.11.003. [DOI] [PubMed] [Google Scholar]
- Catterall WA. Voltage-gated calcium channels. Cold Spring Harb Perspect Biol. 2011;3:a003947. doi: 10.1101/cshperspect.a003947. [DOI] [PMC free article] [PubMed] [Google Scholar]
- Dickenson A, Kieffer B. Opiates: basic mechanisms. In: McMahon SB, Koltzenburg M, editors. Wall and Melzack's textbook of pain. Edinburgh: Elsevier Churchill Livingstone; 2006. pp. 427–442. [Google Scholar]
- Fraser GL, Gaudreau GA, Clarke PB, Ménard DP, Perkins MN. Antihyperalgesic effects of δ opioid agonists in a rat model of chronic inflammation. Br J Pharmacol. 2000;129:1668–1672. doi: 10.1038/sj.bjp.0703248. [DOI] [PMC free article] [PubMed] [Google Scholar]
- Gallantine EL, Meert TF. A comparison of the antinociceptive and adverse effects of the μ-opioid agonist morphine and the δ-opioid agonist SNC80. Basic Clin Pharmacol Toxicol. 2005;97:39–51. doi: 10.1111/j.1742-7843.2005.pto_97107.x. [DOI] [PubMed] [Google Scholar]
- Gendron L, Lucido AL, Mennicken F, O'Donnell D, Vincent JP, Stroh T, Beaudet A. Morphine and pain-related stimuli enhance cell surface availability of somatic δ-opioid receptors in rat dorsal root ganglia. J Neurosci. 2006;26:953–962. doi: 10.1523/JNEUROSCI.3598-05.2006. [DOI] [PMC free article] [PubMed] [Google Scholar]
- Gendron L, Esdaile MJ, Mennicken F, Pan H, O'Donnell D, Vincent JP, Devi LA, Cahill CM, Stroh T, Beaudet A. Morphine priming in rats with chronic inflammation reveals a dichotomy between antihyperalgesic and antinociceptive properties of deltorphin. Neuroscience. 2007;144:263–274. doi: 10.1016/j.neuroscience.2006.08.077. [DOI] [PubMed] [Google Scholar]
- Guan JS, Xu ZZ, Gao H, He SQ, Ma GQ, Sun T, Wang LH, Zhang ZN, Lena I, Kitchen I, Elde R, Zimmer A, He C, Pei G, Bao L, Zhang X. Interaction with vesicle luminal protachykinin regulates surface expression of δ-opioid receptors and opioid analgesia. Cell. 2005;122:619–631. doi: 10.1016/j.cell.2005.06.010. [DOI] [PubMed] [Google Scholar]
- Herlitze S, Garcia DE, Mackie K, Hille B, Scheuer T, Catterall WA. Modulation of Ca2+ channels by G protein betagamma subunits. Nature. 1996;380:258–262. doi: 10.1038/380258a0. [DOI] [PubMed] [Google Scholar]
- Holzer P. Capsaicin: cellular targets, mechanisms of action, and selectivity for thin sensory neurons. Pharmacol Rev. 1991;43:143–201. [PubMed] [Google Scholar]
- Hurley RW, Hammond DL. The analgesic effects of supraspinal μ and δ opioid receptor agonists are potentiated during persistent inflammation. J Neurosci. 2000;20:1249–1259. doi: 10.1523/JNEUROSCI.20-03-01249.2000. [DOI] [PMC free article] [PubMed] [Google Scholar]
- Ikeda SR. Voltage-dependent modulation of N-type calcium channels by G-protein β γ subunits. Nature. 1996;380:255–258. doi: 10.1038/380255a0. [DOI] [PubMed] [Google Scholar]
- Kabli N, Cahill CM. Anti-allodynic effects of peripheral δ opioid receptors in neuropathic pain. Pain. 2007;127:84–93. doi: 10.1016/j.pain.2006.08.003. [DOI] [PubMed] [Google Scholar]
- Kieffer BL. Opioids: first lessons from knockout mice. Trends Pharmacol Sci. 1999;20:19–26. doi: 10.1016/S0165-6147(98)01279-6. [DOI] [PubMed] [Google Scholar]
- Linley JE. Perforated whole-cell patch-clamp recording. Methods Mol Biol. 2013;998:149–157. doi: 10.1007/978-1-62703-351-0_11. [DOI] [PubMed] [Google Scholar]
- Linley JE, Rose K, Patil M, Robertson B, Akopian AN, Gamper N. Inhibition of M current in sensory neurons by exogenous proteases: a signaling pathway mediating inflammatory nociception. J Neurosci. 2008;28:11240–11249. doi: 10.1523/JNEUROSCI.2297-08.2008. [DOI] [PMC free article] [PubMed] [Google Scholar]
- Linley JE, Ooi L, Pettinger L, Kirton H, Boyle JP, Peers C, Gamper N. Reactive oxygen species are second messengers of neurokinin signaling in peripheral sensory neurons. Proc Natl Acad Sci U S A. 2012;109:E1578–E1586. doi: 10.1073/pnas.1201544109. [DOI] [PMC free article] [PubMed] [Google Scholar]
- Liu B, Linley JE, Du X, Zhang X, Ooi L, Zhang H, Gamper N. The acute nociceptive signals induced by bradykinin in rat sensory neurons are mediated by inhibition of M-type K+ channels and activation of Ca2+-activated Cl− channels. J Clin Invest. 2010;120:1240–1252. doi: 10.1172/JCI41084. [DOI] [PMC free article] [PubMed] [Google Scholar]
- Mika J, Przewlocki R, Przewlocka B. The role of δ-opioid receptor subtypes in neuropathic pain. Eur J Pharmacol. 2001;415:31–37. doi: 10.1016/S0014-2999(01)00814-7. [DOI] [PubMed] [Google Scholar]
- Mintz IM, Bean BP. GABAB receptor inhibition of P-type Ca2+ channels in central neurons. Neuron. 1993;10:889–898. doi: 10.1016/0896-6273(93)90204-5. [DOI] [PubMed] [Google Scholar]
- Morikawa H, Fukuda K, Mima H, Shoda T, Kato S, Mori K. Desensitization and resensitization of δ-opioid receptor-mediated Ca2+ channel inhibition in NG108–15 cells. Br J Pharmacol. 1998;123:1111–1118. doi: 10.1038/sj.bjp.0701733. [DOI] [PMC free article] [PubMed] [Google Scholar]
- Mucha M, Ooi L, Linley JE, Mordaka P, Dalle C, Robertson B, Gamper N, Wood IC. Transcriptional control of KCNQ channel genes and the regulation of neuronal excitability. J Neurosci. 2010;30:13235–13245. doi: 10.1523/JNEUROSCI.1981-10.2010. [DOI] [PMC free article] [PubMed] [Google Scholar]
- Nichols ML, Bian D, Ossipov MH, Lai J, Porreca F. Regulation of morphine antiallodynic efficacy by cholecystokinin in a model of neuropathic pain in rats. J Pharmacol Exp Ther. 1995;275:1339–1345. [PubMed] [Google Scholar]
- Otis V, Sarret P, Gendron L. Spinal activation of δ opioid receptors alleviates cancer-related bone pain. Neuroscience. 2011;183:221–229. doi: 10.1016/j.neuroscience.2011.03.052. [DOI] [PMC free article] [PubMed] [Google Scholar]
- Overland AC, Kitto KF, Chabot-Doré AJ, Rothwell PE, Fairbanks CA, Stone LS, Wilcox GL. Protein kinase C mediates the synergistic interaction between agonists acting at α2-adrenergic and δ-opioid receptors in spinal cord. J Neurosci. 2009;29:13264–13273. doi: 10.1523/JNEUROSCI.1907-09.2009. [DOI] [PMC free article] [PubMed] [Google Scholar]
- Patwardhan AM, Berg KA, Akopain AN, Jeske NA, Gamper N, Clarke WP, Hargreaves KM. Bradykinin-induced functional competence and trafficking of the δ-opioid receptor in trigeminal nociceptors. J Neurosci. 2005;25:8825–8832. doi: 10.1523/JNEUROSCI.0160-05.2005. [DOI] [PMC free article] [PubMed] [Google Scholar]
- Patwardhan AM, Diogenes A, Berg KA, Fehrenbacher JC, Clarke WP, Akopian AN, Hargreaves KM. PAR-2 agonists activate trigeminal nociceptors and induce functional competence in the δ opioid receptor. Pain. 2006;125:114–124. doi: 10.1016/j.pain.2006.05.007. [DOI] [PubMed] [Google Scholar]
- Petäjä-Repo UE, Hogue M, Leskelä TT, Markkanen PM, Tuusa JT, Bouvier M. Distinct subcellular localization for constitutive and agonist-modulated palmitoylation of the human δ opioid receptor. J Biol Chem. 2006;281:15780–15789. doi: 10.1074/jbc.M602267200. [DOI] [PubMed] [Google Scholar]
- Pradhan AA, Becker JA, Scherrer G, Tryoen-Toth P, Filliol D, Matifas A, Massotte D, Gavériaux-Ruff C, Kieffer BL. In vivo δ opioid receptor internalization controls behavioral effects of agonists. PLoS One. 2009;4:e5425. doi: 10.1371/journal.pone.0005425. [DOI] [PMC free article] [PubMed] [Google Scholar]
- Pradhan AA, Walwyn W, Nozaki C, Filliol D, Erbs E, Matifas A, Evans C, Kieffer BL. Ligand-directed trafficking of the δ-opioid receptor in vivo: two paths toward analgesic tolerance. J Neurosci. 2010;30:16459–16468. doi: 10.1523/JNEUROSCI.3748-10.2010. [DOI] [PMC free article] [PubMed] [Google Scholar]
- Pradhan A, Smith M, McGuire B, Evans C, Walwyn W. Chronic inflammatory injury results in increased coupling of δ opioid receptors to voltage-gated Ca2+ channels. Mol Pain. 2013;9:8. doi: 10.1186/1744-8069-9-8. [DOI] [PMC free article] [PubMed] [Google Scholar]
- Qiu C, Sora I, Ren K, Uhl G, Dubner R. Enhanced δ-opioid receptor-mediated antinociception in μ-opioid receptor-deficient mice. Eur J Pharmacol. 2000;387:163–169. doi: 10.1016/S0014-2999(99)00813-4. [DOI] [PubMed] [Google Scholar]
- Sakaguchi M, Inaishi Y, Kashihara Y, Kuno M. Release of calcitonin gene-related peptide from nerve terminals in rat skeletal muscle. J Physiol. 1991;434:257–270. doi: 10.1113/jphysiol.1991.sp018468. [DOI] [PMC free article] [PubMed] [Google Scholar]
- Scherrer G, Befort K, Contet C, Becker J, Matifas A, Kieffer BL. The δ agonists DPDPE and deltorphin II recruit predominantly μ receptors to produce thermal analgesia: a parallel study of μ, δ and combinatorial opioid receptor knockout mice. Eur J Neurosci. 2004;19:2239–2248. doi: 10.1111/j.0953-816X.2004.03339.x. [DOI] [PubMed] [Google Scholar]
- Scherrer G, Imamachi N, Cao YQ, Contet C, Mennicken F, O'Donnell D, Kieffer BL, Basbaum AI. Dissociation of the opioid receptor mechanisms that control mechanical and heat pain. Cell. 2009;137:1148–1159. doi: 10.1016/j.cell.2009.04.019. [DOI] [PMC free article] [PubMed] [Google Scholar]
- Stein C, Zöllner C. Opioids and sensory nerves. In: Canning BJ, Spina D, editors. Sensory nerves. Berlin: Springer; 2009. pp. 495–518. [Google Scholar]
- Stewart PE, Hammond DL. Activation of spinal δ-1 or δ-2 opioid receptors reduces carrageenan-induced hyperalgesia in the rat. J Pharmacol Exp Ther. 1994;268:701–708. [PubMed] [Google Scholar]
- Vaughn AH, Gold MS. Ionic mechanisms underlying inflammatory mediator-induced sensitization of dural afferents. J Neurosci. 2010;30:7878–7888. doi: 10.1523/JNEUROSCI.6053-09.2010. [DOI] [PMC free article] [PubMed] [Google Scholar]
- Walwyn W, Maidment NT, Sanders M, Evans CJ, Kieffer BL, Hales TG. Induction of δ opioid receptor function by up-regulation of membrane receptors in mouse primary afferent neurons. Mol Pharmacol. 2005;68:1688–1698. doi: 10.1124/mol.105.014829. [DOI] [PubMed] [Google Scholar]
- Wang HB, Zhao B, Zhong YQ, Li KC, Li ZY, Wang Q, Lu YJ, Zhang ZN, He SQ, Zheng HC, Wu SX, Hökfelt TG, Bao L, Zhang X. Coexpression of δ- and μ-opioid receptors in nociceptive sensory neurons. Proc Natl Acad Sci U S A. 2010;107:13117–13122. doi: 10.1073/pnas.1008382107. [DOI] [PMC free article] [PubMed] [Google Scholar]
- Wu ZZ, Chen SR, Pan HL. Distinct inhibition of voltage-activated Ca2+ channels by δ-opioid agonists in dorsal root ganglion neurons devoid of functional T-type Ca2+ currents. Neuroscience. 2008;153:1256–1267. doi: 10.1016/j.neuroscience.2008.03.031. [DOI] [PubMed] [Google Scholar]