Abstract
The putative liquid–liquid phase transition in supercooled water has been used to explain many anomalous behaviors of water. However, no direct experimental verification of such a phase transition has been accomplished, and theoretical studies from different simulations contradict each other. We investigated the putative liquid–liquid phase transition using the Water potential from Adaptive Force Matching for Ice and Liquid (WAIL). The simulation reveals a first-order phase transition in the supercooled regime with the critical point at ∼207 K and 50 MPa. Normal water is high-density liquid (HDL). Low-density liquid (LDL) emerges at lower temperatures. The LDL phase has a density only slightly larger than that of the ice-Ih and shows more long-range order than HDL. However, the transformation from LDL to HDL is spontaneous across the first-order phase transition line, suggesting the LDL configuration is not poorly formed nanocrystalline ice. It has been demonstrated in the past that the WAIL potential provides reliable predictions of water properties such as melting temperature and temperature of maximum density. Compared with other simple water potentials, WAIL is not biased by fitting to experimental properties, and simulation with this potential reflects the prediction of a high-quality first-principle potential energy surface.
Many substances possess a phase transition between a gas and a liquid. The possibility of a second fluid–fluid phase transition between two liquids is less known. Experimental evidences have revealed several examples of liquid–liquid phase transitions (LLPTs), such as a pressure-induced phase transition between two forms of liquid phosphorus (1) and a similar phase transition in molten carbon (2). Sulfur is believed to have two LLPTs, the λ transition at low pressure (3) and a metal to nonmetal transition at high pressure (4). For these substances, the LLPTs occur above the melting temperature, Tm. For silicon, an amorphous–amorphous transition occurs below the glass transition temperature Tg, between two metastable phases. Although this transition has characteristics of a LLPT, it can also be argued that this is a transition between two metastable forms of the same phase. LLPTs have also been reported in other pure liquids or mixtures (5).
One of the most intriguing and controversial LLPTs is the putative LLPT in water (6). The critical point of this phase transition is believed to be above the Tg but below the Tm. Experiments performed below Tg support a first-order phase transition between two amorphous forms of supercooled water (7–9). Investigating the transition experimentally above Tg is very challenging; ultrafast experiments have to be performed to compete with homogenous nucleation to gain insight into this regime of the phase space (6). Although experimental studies do support LLPT in confined water (10, 11), some evidences have indicated strong influence of water properties as a result of confinements (12).
Mixed conclusions have been made from theoretical studies of the putative LLPT in water. A two-state thermodynamic model (13) and several simulations using atomistic water models, such as TIP4P/2005 (14), TIP5P (15), and ST2 (16, 17), support the existence of a LLPT; on the other hand, other models such as the coarse-grained mW potential do not support a LLPT (18). The conclusion from any atomistic simulation depends on the underlying model potential. These potentials, also referred to as force fields, were typically created by training to reproduce certain experimental properties. By training to experimental properties, it is hard to determine if cancelations of errors are responsible for reproducing the properties being fit. The predicting power for such models can be problematic. In addition, none of the atomistic models used previously correctly predict the phase diagram around the ice-Ih melting temperature. TIP4P/2005 gives a Tm too low by 20 K (19), ST2 overestimates Tm by almost 30 K (20), and TIP5P predicts ice-Ih to be metastable (21). It has been argued that simultaneous prediction of good Tm and liquid state properties is impossible with a simple point charge model (19).
Rather than fitting to experimental properties, the Water potential from Adaptive Force Matching (22) for Ice and Liquid (WAIL) was created by fitting to a coupled-cluster quality potential energy surface (PES) of water (23) obtained through quantum mechanics and molecular mechanics (QM/MM) calculations. Both the parameters (24) and the energy expressions (25) of this model were optimized to best reproduce the first principle PES. At the same time, the WAIL potential only uses pair-wise point-charge–based energy expressions; this allows very long simulations to be performed on modern computers.
The WAIL potential predicts the Tm of ice-Ih to be 270 K and a temperature of maximum density of 9 °C (24). When quantum nuclear effect is accounted for with path-integral simulations (26), the WAIL model also predicts the radial distribution functions (RDFs) and the heat of vaporization for both ice and liquid in good agreement with experiments. Not only is the performance of the WAIL potential significantly better than any other existing water models for simulation of ice–liquid mixtures, the WAIL model is not biased by fitting to experimental data; thus, simulation results from the WAIL model can be regarded as a true prediction based on the underlying electronic structure PES.
Results
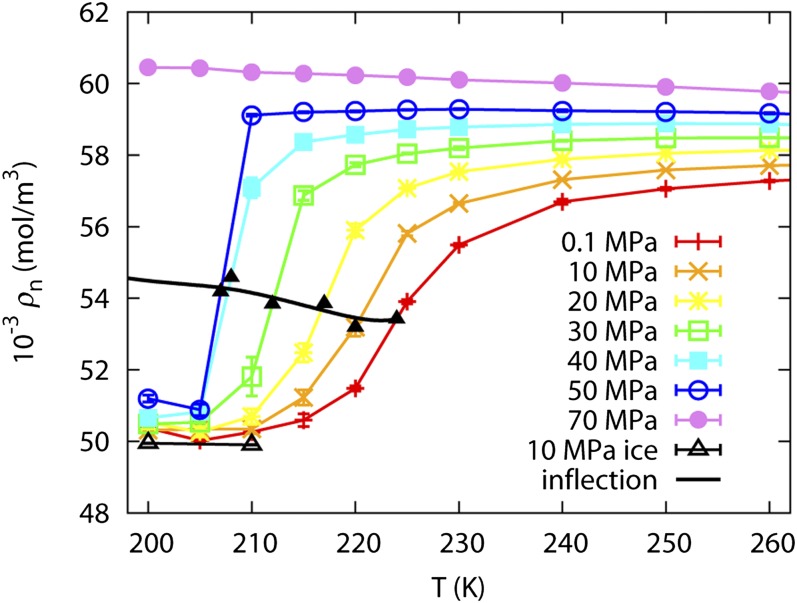
The putative LLPT in supercooled water is investigated using the WAIL potential in the temperature range from 200 to 270 K. Fig. 1 shows the number density isobar of water as a function of temperature. At lower temperatures, a new phase emerges that has a density about 10% lower than that of the ordinary water. The ordinary water is thus high-density liquid (HDL), and the new phase is low-density liquid (LDL). The LDL phase has a density slightly larger than that of the ice-Ih. The best estimates to the inflection points are marked in Fig. 1. The inflection line should coincide with the phase transition line at a temperature below the liquid–liquid critical point (LLCP) and should follow the Widom line above the critical point.
Fig. 1.
Number density isobar of supercooled water from 200 to 260 K and 0.1–70 MPa; the densities of WAIL ice-Ih at 10 MPa at 200 and 210 K is plotted as reference.
At temperatures above the LLCP, below the Widom line in Fig. 1, the density of the LDL form is influenced by two factors. One is the mole fraction of the HDL form; the other is the thermal expansion of the LDL form. Adjacent to the Widom line, water density decreases when temperature decreases due to the increased molar fraction of LDL at lower temperatures. Further away from the Widom line, the LDL density increases when temperature decreases due to a positive thermal expansion coefficient of the LDL form. This explains the existence of density minimum below the Widom line at lower pressures. At a temperature below LLCP, a phase transition occurs. LDL will be the only phase below the LLPT line. Due to the positive thermal expansion coefficient of LDL, the density should increase monotonically when temperature decreases.
Close inspection of the density isobars in Fig. 1 reveals a first-order phase transition at 50 MPa or above. At 70 MPa, the phase transition temperature is below 200 K. The temperature dependence of density above the inflection line is consistent with the picture presented above. At 0.1–40 MPa, above the Widom line, the density drops due to the finite molar fraction of LDL. At 70 MPa, the density increases when temperature decreases, consistent with a single HDL phase having a positive thermal expansion coefficient. At 50 MPa, it is hard to determine if the density increases or decreases with temperature within the error bar. We thus estimate the LLCP to be around 50 MPa and between 205 and 210 K.
Similar to the existence of a density minimum below the Widom line, there should be a density maximum above the Widom line. This is the well-known density maximum of liquid water. For WAIL water, the temperature of maximum density is 282 K at 0.1 MPa (24) and is not shown in Fig. 1.
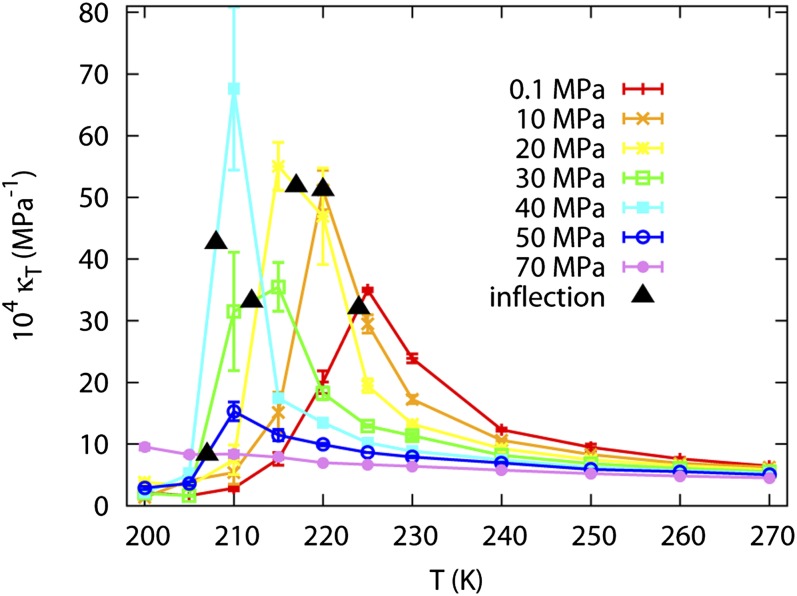
The isothermal compressibility, κT, is reported in Fig. 2 with the density inflection points marked. The density inflection points coincide with the maximum of the response function within statistical noise. At 50 MPa, although the inflection point in density is between 205 and 210 K, neither κT at 205 or 210 K is particularly large. This is consistent with a first-order phase transition. Although κT should reach infinity for infinite system at the LLPT point, the response function is sharply peaked at the transition point. The finite spacing between sampling points causes the peak to be missed.
Fig. 2.
κT as a function of temperature from 200 to 270 K and pressure from 0.1 to 70 MPa; the inflection point of the number density isobar is marked as a black triangle for each pressure.
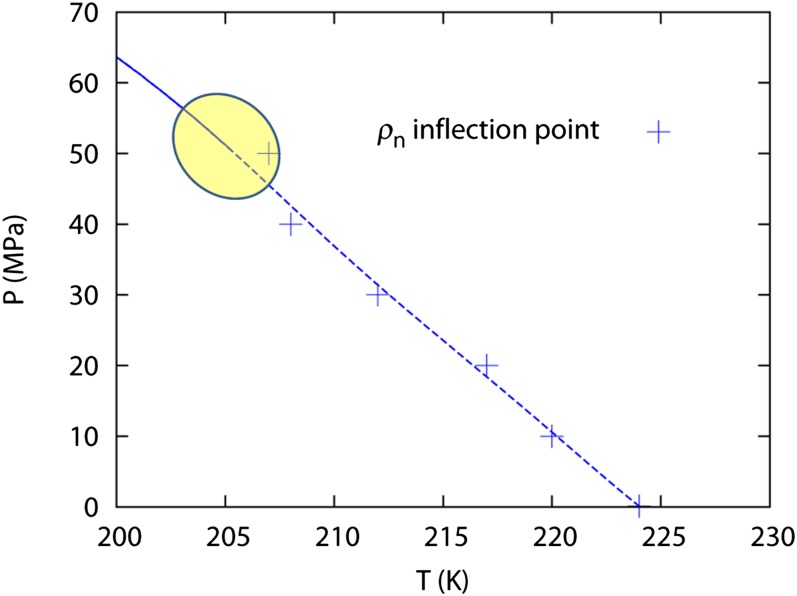
Fig. 3 reports a best estimate for the LLPT line and the Widom line in the temperature–pressure plane. Due to statistical errors in the simulation, a shaded region is drawn showing a possible range of the LLCP. Another factor that may influence the location of the LLCP is the finite size of our simulation box. For more precise determination of the critical point, a finite-size scaling study should be performed (27).
Fig. 3.
The LLPT line (solid) and the Widom line (dashed) in the pressure–temperature diagram. Because of the statistical noise in volume determinations and the finite set of simulation conditions, the shaded region signifies the uncertainty in the determination of the critical point.
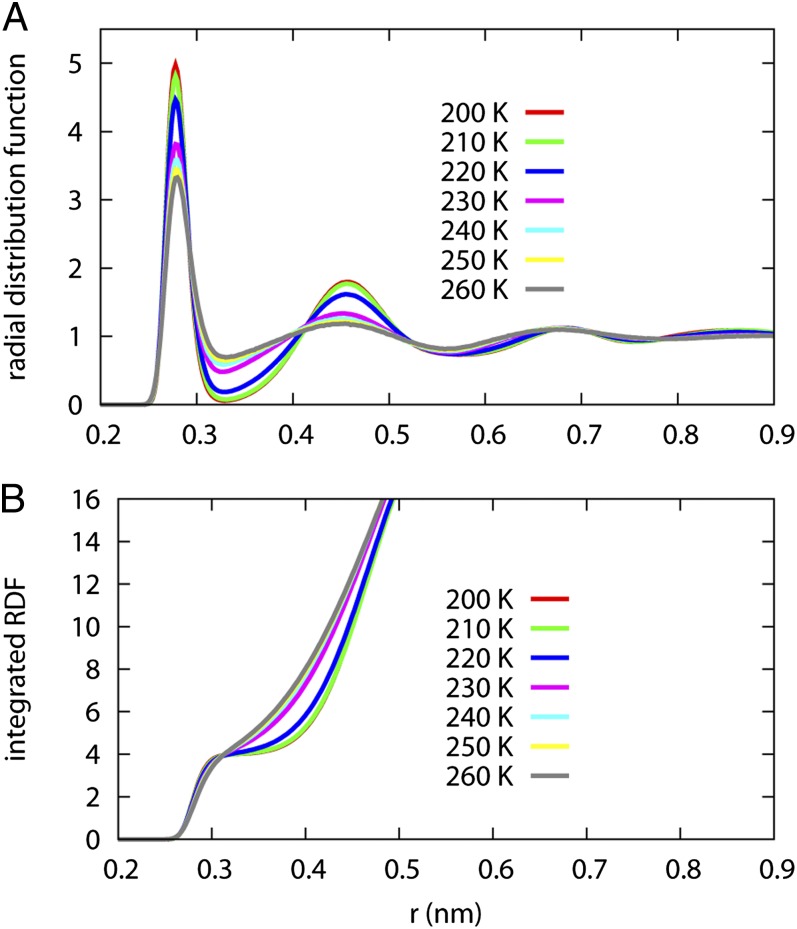
Fig. 4 reports the oxygen–oxygen RDF and the integrated RDF of water at 0.1 MPa. As revealed by the RDF, the LDL phase has its second solvation shell pushed out and demonstrates more long-range order in a fashion similar to ice-Ih compared with the HDL phase. Although the first solvation shell becomes more structured as temperature drops, the peak location does not change. The HDL to LDL transition is likely caused by a reorientation of the second solvation shell water molecules. In ice-Ih, the first solvation shell has four neighbors, and the second solvation shell has 12 neighbors. The integrated RDF with up to 16 neighbors is shown in Fig. 4B. Clearly, the first solvation shell is much better defined in LDL. If we assume the second solvation shell in water also has 12 molecules, the second solvation shell is completed at a greater distance in the LDL form.
Fig. 4.
The oxygen–oxygen RDF (A) and integrated RDF (B) for supercooled water at 0.1 MPa. The LDL phase shows more long-range order compared with the HDL phase. The HDL phase completes the second solvation shell at a slightly shorter distance than the LDL phase.
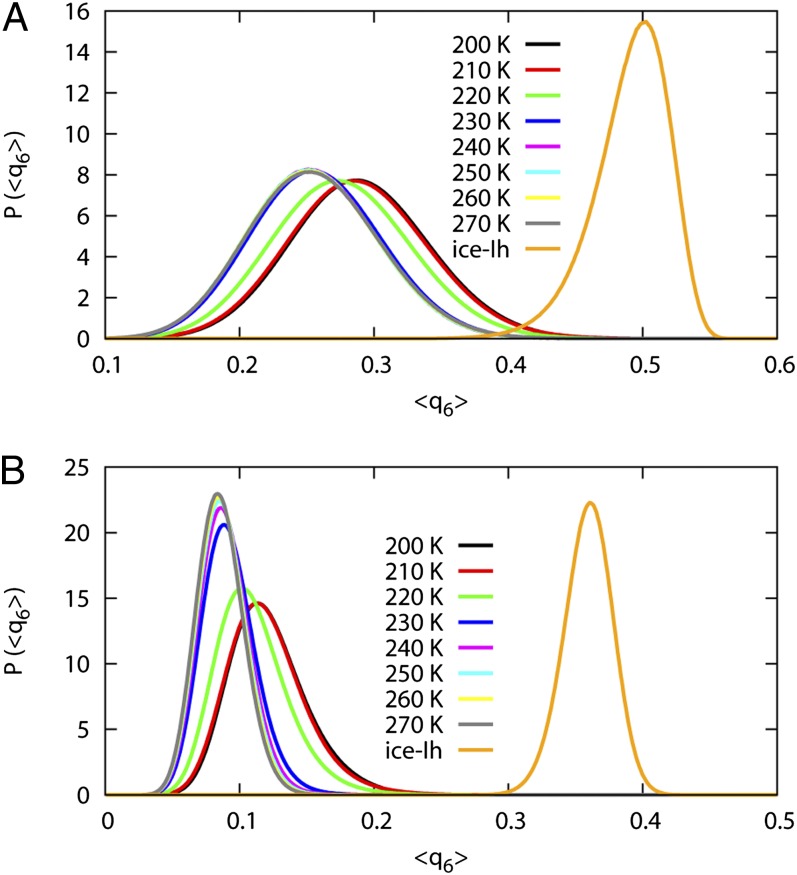
The neighbor-averaged <q6> is reported in Fig. 5. Fig. 5A shows the <q6> calculated for the nearest four neighbors of each water. The <q6> for the nearest four water only shows a small shift upon the transition from LDL to HDL and is very different from that of ice-Ih. Fig. 5B reports the <q6> for the 12 second solvation shell water molecules. The second shell <q6> for the LDL has a relatively larger shift but is still very different from that of ice-Ih.
Fig. 5.
Neighbor-averaged <q6> order parameter for supercooled water at 0.1 MPa. The <q6> for ice-Ih at 270 K is plotted for comparison. A is calculated based on the positions of the first solvation shell water molecules, and B is calculated based on the positions of the second solvation shell water molecules.
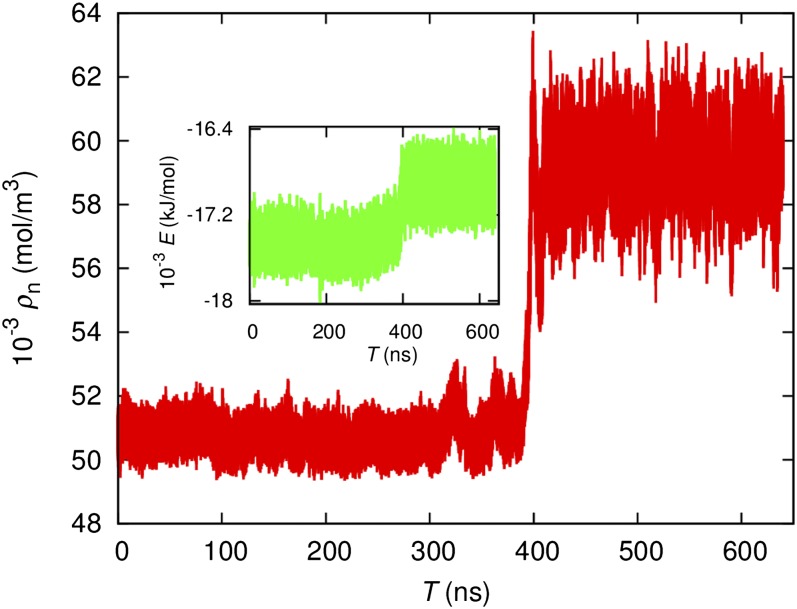
To rule out the possibility that the new phase is actually some poorly formed nanocrystalline ice, a simulation is performed at 210 K 50 MPa starting from the LDL configuration at 205 K 50 MPa. The volume and energy time traces are reported in Fig. 6. For this trajectory, the system remained in the metastable LDL phase for ∼400 ns before transforming spontaneously into the HDL phase in 10 ns. This fast transition causes a 15% volume reduction and a sharp increase in configuration energy. Because the HDL phase has a higher configuration energy, the spontaneous transformation indicates that the HDL phase has larger entropy. Similar spontaneous transformations were observed at 70 MPa at 200, 205, and 210 K using LDL initial configurations. After the transformation, the system stays at the HDL phase indefinitely over the μs simulation length of our trajectories. Nucleating supercooled water at 210 K with poorly formed ice will cause the ice-Ih phase to grow. The spontaneous transformation indicates that the LDL phase is not badly formed ice-Ih.
Fig. 6.
Time trace of temperature and energy (Inset) at 210 K 50 MPa obtained using a LDL snapshot at 205 K 50 MPa as the initial configuration.
When an ice–water interface is simulated at 50 MPa and 245 K with the WAIL potential, ice quickly grows and the entire box almost freezes over after 10 ns. An interface stability study indicates the WAIL model freezes at about 259 K at 50 MPa. This is 10 K lower than the Tm of WAIL ice when the same protocol was used to calculate Tm at 0.1 MPa (24). Experimentally, the same increase in pressure reduces Tm by 5 K (28). The lack of quantitative agreement indicates a limitation of the WAIL model at higher pressures when the model was parameterized only with lower pressure configurations.
Discussion
A gas and liquid phase transition can be viewed as a transition between two fluids with different length scales. The WAIL simulations suggest a new metastable form of water can emerge at lower temperatures with a length scale different from that of the normal liquid. The new LDL form has a lower density, more structured RDF, and a lower configuration energy. The new phase spontaneously transforms into HDL under conditions where ice-Ih is more stable. The sharp transitions between the two forms at pressure above 50 MPa are consistent with a first-order LLPT. Although these phases are metastable with respect to ice-Ih, the spontaneous transformation suggests the HDL and LDL phases are thermodynamically stable with respect to each other in the supercooled region.
Above the LLCP, the coexistence of both phases explains the appearance of a temperature of maximum density above the Widom line. The temperature of maximum density for the WAIL potential at 0.1 MPa has been established to be 282 K (24), close to the experimental value at 277 K. Our simulation also predicts the existence of a temperature of minimum density below the Widom line.
The lower configuration energy of the LDL phase indicates more hydrogen bonds are formed between water molecules. It is believed many of the LLPTs in other materials such as phosphorous and sulfur are accompanied by a change in covalent bond arrangements giving rise to different allotropes. Our simulation indicates a first-order phase transition between liquids can occur in water where only changes in hydrogen bonds are possible.
Compared with other atomistic scale simulations, the WAIL potential used in this work was designed to best reproduce the coupled-cluster quality PES of water. Thus, the prediction by this potential can be regarded as a prediction based on the first principle PES without being biased by fitting to related experimental properties. However, due to limitations of the simplistic energy expression, the WAIL potential cannot produce a perfect fit. In addition, the training set for the WAIL potential does not include high-pressure configurations. Future work should be performed with more sophisticated energy expressions and high-pressure configurations with adaptive force matching to refine the location of the LLCP.
Methods
Molecular dynamics calculations on supercooled water were performed with the WAIL potential (24) in a cubic simulation box containing 343 water molecules. Simulations were performed with the GROMACS package (29). Long-range electrostatics was treated with the particle mesh Ewald method. During the simulations, the temperature and pressure were maintained using the Nosé–Hoover thermostat with a relaxation constant of 5 ps and the Parrinello–Rahman barostat with a relaxation constant of 10 ps. To afford a 1 fs time step, the hydrogen atoms in the simulations were replaced by deuterium (30). Within classical statistical mechanics, the isotope substitution has no effect on any of the properties measured in our simulation.
A total of 94 μs of trajectory were run to reduce the error bars to an acceptable value. Most of the time was spent simulating at temperatures below 230 K. Longer simulations were performed at temperatures and pressures close to the loci of maximum κT. The longest trajectory is about 3.3 μs and is performed at 210 K 40 MPa. The average simulation length for a trajectory below 230 K is 2 μs.
To put our simulation time in perspective, the average time required for the mean squared displacement (MSD) of water to reach 0.09 nm2 is 850 ns at 0.1 MPa at 200 K. This time reduces to 200 ns at 50 MPa at the same temperature. In the HDL phase, time for structural diffusion is significantly faster. It only takes around 2 ns for water at 200 K 70 MPa to have a MSD of 0.09 nm2. The two orders of magnitude change in this characteristic time across the LLPT line at 200 K suggests the possibility of a dynamic crossover that is worth further investigation. Nonetheless, it is safe to conclude that our simulation is long enough for proper sampling of the configuration space.
The neighbor-averaged <q6> order parameter was measured as it provides a good distinction between water and ice configurations (31, 32). The <q6> is defined according to equation 6 of the Vega work (31):
 |
and
 |
where i and j are indices for the oxygen atoms,  is the sixth-order spherical harmonics, and Nn is number of neighbors, and the sum in the second equation above is over the neighbors and the central molecule.
Acknowledgments
This work was supported by National Science Foundation (NSF) Faculty Early Career Development Award CHE0748628 and by a startup grant from the University of Arkansas. The computer resource for this study was provided by the Arkansas High Performance Computational Center through Grant MRI-R2 0959124 provided by the NSF.
Footnotes
The authors declare no conflict of interest.
This article is a PNAS Direct Submission.
References
- 1.Katayama Y, et al. A first-order liquid-liquid phase transition in phosphorus. Nature. 2000;403(6766):170–173. doi: 10.1038/35003143. [DOI] [PubMed] [Google Scholar]
- 2.Togaya M. Pressure dependences of the melting temperature of graphite and the electrical resistivity of liquid carbon. Phys Rev Lett. 1997;79(13):2474–2477. [Google Scholar]
- 3.Winter R, et al. The structural properties of liquid sulphur. J Phys Condens Matter. 1990;2(42):8427–8437. [Google Scholar]
- 4.Brazhkin VV, Voloshin RN, Popova SV, Umnov AG. Nonmetal-metal transition in sulphur melt under high pressure. Phys Lett A. 1991;154(7–8):413–415. [Google Scholar]
- 5.Makov G, Yahel E. Liquid-liquid phase transformations and the shape of the melting curve. J Chem Phys. 2011;134(20):204507. doi: 10.1063/1.3593441. [DOI] [PubMed] [Google Scholar]
- 6.Mishima O, Stanley HE. The relationship between liquid, supercooled and glassy water. Nature. 1998;396(6709):329–335. [Google Scholar]
- 7.Mishima O, Calvert LD, Whalley E. ‘Melting ice/’ I at 77 K and 10 kbar: A new method of making amorphous solids. Nature. 1984;310(5976):393–395. [Google Scholar]
- 8.Mishima O, Calvert LD, Whalley E. An apparently first-order transition between two amorphous phases of ice induced by pressure. Nature. 1985;314(6006):76–78. [Google Scholar]
- 9.Mishima O, Suzuki Y. Propagation of the polyamorphic transition of ice and the liquid-liquid critical point. Nature. 2002;419(6907):599–603. doi: 10.1038/nature01106. [DOI] [PubMed] [Google Scholar]
- 10.Liu L, Chen S-H, Faraone A, Yen C-W, Mou C-Y. Pressure dependence of fragile-to-strong transition and a possible second critical point in supercooled confined water. Phys Rev Lett. 2005;95(11):117802. doi: 10.1103/PhysRevLett.95.117802. [DOI] [PubMed] [Google Scholar]
- 11.Liu D, et al. Observation of the density minimum in deeply supercooled confined water. Proc Natl Acad Sci USA. 2007;104(23):9570–9574. [Google Scholar]
- 12.Mancinelli R, et al. Multiscale approach to the structural study of water confined in MCM 41. J Phys Chem B. 2009;113(50):16169–16177. doi: 10.1021/jp9062109. [DOI] [PubMed] [Google Scholar]
- 13.Holten V, Anisimov MA. Entropy-driven liquid-liquid separation in supercooled water. Sci Rep. 2012;2:713. doi: 10.1038/srep00713. [DOI] [PMC free article] [PubMed] [Google Scholar]
- 14.Abascal JLF, Vega C. Widom line and the liquid-liquid critical point for the TIP4P/2005 water model. J Chem Phys. 2010;133(23):234502. doi: 10.1063/1.3506860. [DOI] [PubMed] [Google Scholar]
- 15.Yamada M, Mossa S, Stanley HE, Sciortino F. Interplay between time-temperature transformation and the liquid-liquid phase transition in water. Phys Rev Lett. 2002;88(19):195701. doi: 10.1103/PhysRevLett.88.195701. [DOI] [PubMed] [Google Scholar]
- 16.Sciortino F, Poole PH, Essmann U, Stanley HE. Line of compressibility maxima in the phase diagram of supercooled water. Phys Rev E Stat Phys Plasmas Fluids Relat Interdiscip Topics. 1997;55(1):727–737. [Google Scholar]
- 17.Liu Y, Palmer JC, Panagiotopoulos AZ, Debenedetti PG. Liquid-liquid transition in ST2 water. J Chem Phys. 2012;137(21):214505. doi: 10.1063/1.4769126. [DOI] [PubMed] [Google Scholar]
- 18.Limmer DT, Chandler D. The putative liquid-liquid transition is a liquid-solid transition in atomistic models of water. J Chem Phys. 2011;135(13):134503–134510. doi: 10.1063/1.3643333. [DOI] [PubMed] [Google Scholar]
- 19.Abascal JLF, Vega C. A general purpose model for the condensed phases of water: TIP4P/2005. J Chem Phys. 2005;123(23):234505. doi: 10.1063/1.2121687. [DOI] [PubMed] [Google Scholar]
- 20.Weber TA, Stillinger FH. Molecular dynamics study of ice crystallite melting. J Phys Chem. 1983;87(21):4277–4281. [Google Scholar]
- 21.Vega C, Sanz E, Abascal JLF. The melting temperature of the most common models of water. J Chem Phys. 2005;122(11):114507. doi: 10.1063/1.1862245. [DOI] [PubMed] [Google Scholar]
- 22.Akin-Ojo O, Song Y, Wang F. Developing ab initio quality force fields from condensed phase quantum-mechanics/molecular-mechanics calculations through the adaptive force matching method. J Chem Phys. 2008;129(6):064108. doi: 10.1063/1.2965882. [DOI] [PubMed] [Google Scholar]
- 23.Song Y, Akin-Ojo O, Wang F. Correcting for dispersion interaction and beyond in density functional theory through force matching. J Chem Phys. 2010;133(17):174115. doi: 10.1063/1.3503656. [DOI] [PubMed] [Google Scholar]
- 24.Pinnick ER, Erramilli S, Wang F. Predicting the melting temperature of ice-Ih with only electronic structure information as input. J Chem Phys. 2012;137(1):014510. doi: 10.1063/1.4731693. [DOI] [PubMed] [Google Scholar]
- 25.Akin-Ojo O, Wang F. The quest for the best nonpolarizable water model from the adaptive force matching method. J Comput Chem. 2011;32(3):453–462. doi: 10.1002/jcc.21634. [DOI] [PubMed] [Google Scholar]
- 26.Chandler D, Wolynes PG. Exploiting the isomorphism between quantum theory and classical statistical mechanics of polyatomic fluids. J Chem Phys. 1981;74(7):4078–4095. [Google Scholar]
- 27.Gallo P, Sciortino F. Ising universality class for the liquid-liquid critical point of a one component fluid: A finite-size scaling test. Phys Rev Lett. 2012;109(17):177801. doi: 10.1103/PhysRevLett.109.177801. [DOI] [PubMed] [Google Scholar]
- 28.Bridgman PW. Water, in the liquid and five solid forms, under pressure. Proc Am Acad Arts Sci. 1912;47(13):441–558. [Google Scholar]
- 29.Van Der Spoel D, et al. GROMACS: Fast, flexible, and free. J Comput Chem. 2005;26(16):1701–1718. doi: 10.1002/jcc.20291. [DOI] [PubMed] [Google Scholar]
- 30.Leach AR. Molecular Modelling: Principles and Applications. England: Prentice Hall, Harlow; 2001. 2nd Ed. [Google Scholar]
- 31.Reinhardt A, Doye JPK, Noya EG, Vega C. Local order parameters for use in driving homogeneous ice nucleation with all-atom models of water. J Chem Phys. 2012;137(19):194504–194509. doi: 10.1063/1.4766362. [DOI] [PubMed] [Google Scholar]
- 32.Lechner W, Dellago C. Accurate determination of crystal structures based on averaged local bond order parameters. J Chem Phys. 2008;129(11):114707. doi: 10.1063/1.2977970. [DOI] [PubMed] [Google Scholar]


