

Significance
Synaptic vesicle fusion is catalyzed by multiprotein complexes that bring two lipid bilayers into close opposition. Several assembly mechanisms have been proposed for the synaptic vesicle fusion machinery, but exactly how these proteins interact in vivo remains unclear. We developed two-color fluorescence nanoscopy to directly visualize molecular interactions in situ and discovered that syntaxin-1, SNAP-25, and Munc18-1 (mammalian uncoordinated-18), three essential components for neurotransmission, closely colocalize on the plasma membrane, suggesting possible pathways for SNARE-mediated membrane fusion. Our superresolution method provides a framework for delineating the molecular underpinnings of the synaptic vesicle fusion machinery.
Keywords: neurotransmission, exocytosis, single-molecule, colocalization, active stabilization
Abstract
Membrane fusion is mediated by complexes formed by SNAP-receptor (SNARE) and Secretory 1 (Sec1)/mammalian uncoordinated-18 (Munc18)-like (SM) proteins, but it is unclear when and how these complexes assemble. Here we describe an improved two-color fluorescence nanoscopy technique that can achieve effective resolutions of up to 7.5-nm full width at half maximum (3.2-nm localization precision), limited only by stochastic photon emission from single molecules. We use this technique to dissect the spatial relationships between the neuronal SM protein Munc18-1 and SNARE proteins syntaxin-1 and SNAP-25 (25 kDa synaptosome-associated protein). Strikingly, we observed nanoscale clusters consisting of syntaxin-1 and SNAP-25 that contained associated Munc18-1. Rescue experiments with syntaxin-1 mutants revealed that Munc18-1 recruitment to the plasma membrane depends on the Munc18-1 binding to the N-terminal peptide of syntaxin-1. Our results suggest that in a primary neuron, SNARE/SM protein complexes containing syntaxin-1, SNAP-25, and Munc18-1 are preassembled in microdomains on the presynaptic plasma membrane. Our superresolution imaging method provides a framework for investigating interactions between the synaptic vesicle fusion machinery and other subcellular systems in situ.
Intracellular trafficking as well as transmission of signals across cell membranes, such as release of neurotransmitters at neuronal synapses, is mediated by fusion of vesicles with target membranes. The energy required for membrane juxtaposition and fusion is provided by folding of cognate vesicular- and target-membrane SNAP (soluble NSF attachment protein) receptors (SNAREs) into tight helical bundles that bring the two lipid bilayers into close apposition (1). However, in vitro and in vivo neuronal SNAREs do not efficiently overcome transition barriers to proceed to full fusion, requiring the action of Secretory 1 (Sec1)/mammalian uncoordinated-18 (Munc18)-like (SM) proteins (2), as deletion of SM protein genes results in severe fusion defects in yeast (3), flies (4), worms (5, 6), and mice (7). Moreover, at a synapse the SNARE/SM protein fusion machinery is regulated by the Ca2+ sensor synaptotagmin-1 (8) in coordination with complexin (9) to efficiently trigger neurotransmitter release (10, 11). Despite their central role, the exact mechanisms by which SM and SNARE proteins mediate fusion in vivo have been the subject of considerable debate.
At least four modes of interactions between SM proteins and SNAREs have been reported: (i) Many SM proteins bind to their cognate syntaxins via a conserved N-terminal peptide that is exposed in the SNARE complex, resulting in SM protein/SNARE complex assemblies (12–14); note that this interaction plays an important role when syntaxin is in either binary or ternary SNARE complexes. (ii) In addition to engaging in the first mode, SM proteins involved in exocytosis (Munc18-1, -2, and -3) also bind to their cognate syntaxins in a closed conformation that kinetically impedes binary or ternary SNARE complex formation (15, 16) and that is largely independent of the interaction with the syntaxin N-peptide; note that this interaction also occurs for the L165A, E166A LE mutant of syntaxin that is predominantly open in solution (15). (iii) Munc18-1 binds to the neuronal ternary SNARE four-helix bundle, although the interaction with the syntaxin-1 N-peptide is essential for tight binding (17, 18), whereas Sec1p in yeast (but not the corresponding SM proteins in other organisms) also binds to assembled SNARE complexes, but independent of the syntaxin N terminus (19). (iv) The homotypic fusion and vacuole protein sorting (HOPS) complex containing the SM protein vacuolar protein sorting-associated protein 33 (VPS33) binds to its cognate SNARE complexes by an unknown mechanism that may involve interactions of other components of the HOPS complex with the SNARE. Of these interactions, only (i) is shared among several diverse fusion reactions, and all SM proteins are known to bind to assembled SNARE complexes.
Although these interactions are well characterized in vitro and are likely to occur in vivo, it is unknown especially for synaptic exocytosis when during fusion Munc18-1 associates with SNARE complexes and when and how the initial association with the closed syntaxin-1 conformation allows SNARE complex formation. Results from coimmunoprecipitation or biochemical fractionation assays, often used to characterize protein–protein interactions, can be skewed due to formation of inappropriate complexes after detergent solubilization, dissociation of unstable complexes, and other artifacts, whereas electron-microscopic analysis of immunogold particle distributions is cumbersome and not always easy to interpret.
Modern subdiffraction fluorescence imaging techniques (20) could overcome such caveats to gain insights into the native organization of SM and SNARE proteins in situ. Measurements of relative positions of fluorescent probes used for labeling the sample (21) can provide structural information accurate down to the molecular scale, achieving subnanometer precision and accuracy, significantly below the few-nanometer size of a protein molecule. Imaging extended structures by localizing multiple closely spaced fluorophores typically can achieve a remarkable ∼10-fold improvement over conventional microscopy—with an effective full-width at half-maximum (FWHM) resolution of d ∼ 20–40 nm in the focal plane of a single lens (22–24) and d ∼ 10–20 nm for the combined focal plane of two opposed objective lenses (25–27). Despite these notable advances, however, the ultimate potential of such techniques in deciphering molecular structures and interactions inside a cell has yet to be fully realized.
Although single photoswitchable dyes are bright enough to be theoretically localized to a few nanometers, systematic effects such as apparatus drift (22–24) often result in a significantly worse experimentally obtainable resolution. Additionally, several multicolor proof-of-concept experiments have been described in systems with well-defined spatial organization (28–33), in which interpreting images of a priori known structures has been straightforward. However, due to experimental inaccuracies in registering multicolor single-molecule localizations and the lack of an analytical framework to extract biologically meaningful information from such data, colocalizing two irregularly distributed protein species on length scales below ∼100 nm, down to the length scales associated with formation of distinct molecular complexes, has proved technically challenging.
Here we extend a previously reported (21) dual-color superresolution imaging approach and demonstrate two-color subdiffraction imaging based on photoswitchable probes with photon-noise–limited d ∼ 7.5-nm FWHM resolution and with ∼3-nm registration accuracy extended over cellular length scales (∼15 μm). With these unique capabilities we assay nanometer-scale correlations between two endogenous intracellular proteins. We observe that SNAP-25 and syntaxin-1 are partially colocalized in <100-nm clusters on the plasma membrane. A fraction of soluble Munc18-1 is also associated with such SNAP-25 and syntaxin-1 clusters. Our data provide unexpected insights into the spatial organization and association of Munc18-1, SNAP-25 and syntaxin-1 on the neuronal plasma membrane and suggest that recruitment of an SM protein to an on-pathway tripartite SM–syntaxin-1–SNAP-25 association could be a general mechanism for setting the stage for SNARE-mediated membrane fusion reactions.
Results
Actively Stabilized Superresolution Fluorescence Imaging at the Photon-Noise Limit.
We used active feedback systems that stabilize the position of the microscope stage in 3D during superresolution data acquisition (21), thus eliminating systematic localization errors due to long-term drift (Fig. S1). Microspheres (0.5 μm) attached on the coverslip or approximately circular submicrometer features of cellular structures were used to obtain an accurate position of the sample by real-time processing their bright-field images on a sensitive CCD camera (Fig. S1). Such high-contrast fiduciary marks were tracked to a few nanometers rms at 5 Hz (Fig. S1) whereas a digital feedback loop implemented in the software controlled a three-axis piezoelectric stage to lock the xyz coordinates at the desired set point. Using a 0.5-μm bead as reference, we demonstrated (21) subnanometer localization precisions for Cyanine-5 (Cy5)/Alexa 647 attached to dsDNA and E-cadherin dimers. For cellular imaging, the long-term stability achieved, as evidenced by tracking an out-of-loop fiducial as reference, is 1.5 nm in xy and <4.0 nm in z (rms) over >1 h (Fig. S1). Notably, fluorescent spheres or gold nanoparticles that are imaged on the same CCD used for single-molecule detection can also serve as fiducials (Fig. S1), achieving similar long-term stability (1.5 nm in xy and 8 nm in z, rms) while allowing flexible feedback stabilization strategies.
Two popular subdiffraction imaging benchmarks demonstrate the improved resolution afforded by our actively stabilized system. To characterize the effective point-spread function we imaged short (20-bp) DNA duplexes containing a Cy5 fluorescent probe at the 3′ end of one strand, whereas the other end of the duplex was attached to a coverslip through biotin–streptavidin interactions. Under stochastic switching conditions, each Cy5 created a Lorentzian distribution of xy points of FWHM 2√2σ0 ∼ 2.828σ0 = 9 nm (Fig. 1A), as expected from the total signal and background counts (SI Methods and Fig. S2), demonstrating that our active stabilization approach successfully eliminates systematic errors due to drift. For standard photoactivated localization microscopy (PALM)/stochastic optical reconstruction microscopy experiments without feedback stabilization, the achieved resolution is significantly worse (23, 29, 34) than with our stabilization system (see also Fig. S1, showing how Cy5-DNA positions cannot be corrected as well if the microscope is allowed to drift).
Fig. 1.

Superresolution imaging of point-like (20 bp dsDNA) and one-dimensional (actin filaments) objects. (A) xy clusters of localization points for individual Cy5 molecules attached to the surface-tethered DNA. The clusters for each dye molecule were aligned by their respective center of mass and superimposed. Lorentzian fits through the distributions show 2√2σ0 = 8.8 nm and 9.3 nm FWHM resolution in x and y, respectively. (B) Refinement of the xy distribution by selecting progressively better-localized molecules increases the effective resolution down to ≤d = 2.35s ∼ 7.5-nm FWHM (s ∼ 3.2 nm). Selecting random subsets of the localization points does not result in increased resolution (gray curve). (C) (Top) Diffraction-limited image of an Alexa 647-phalloidin decorated filament. (Scale bar: 1 μm.) (Middle) Localization points (centers of observed spots) for the filament in Top (note different scales in x and y). (Bottom) Close-up of red rectangle in Top. The red line is a fifth-order polynomial fit. (D) Refinement of xy distributions by keeping progressively better-localized dye molecules decreases the measured filament width down to d = 2.35s ∼ 11-nm FWHM (s ∼ 4.5 nm).
We note that because each Cy5 molecule undergoes multiple switching cycles, further improvement in the resolution is possible by taking into account only those cycles during which a dye emitted enough photons to be localized better than a certain error cutoff (SI Methods), improving the precision to s = 3.2 nm [corresponding to d = 2 √(2ln 2) s = 7.5-nm FWHM resolution for a Gaussian peak, Fig. 1B]. Although decreasing the precision cutoff yields more accurate localization of the dye molecules, there is a trade-off because some dye molecules and hence some features of the reconstructed image may be missed with a too stringent precision cutoff (Fig. S3).
As a further test, we imaged 8-nm-thick actin filaments that were decorated by Alexa 647-labeled phalloidin. At length scales of 50–500 nm, each actin filament appeared slightly curved (Fig. 1C), consistent with an expected persistence length of ∼10–20 μm (35). We fitted the localization points for contiguous 1- to 2-μm-long segments to a low-degree polynomial. The apparent rms width of each such segment (deviation of points from the fitted curve) was σ0 ∼ 6 nm, due to the smaller photon count in each on cycle for Alexa 647-phalloidin vs. DNA-attached Cy5. However, the elimination of systematic errors in our apparatus allows us to obtain a measurement of the filament width down to s = 4.6-nm rms (d ∼ 11-nm FWHM, Gaussian peak) by refining the distributions on the basis of 20% of the points that were localized better than 3 nm (Fig. 1D).
SNAP-25 and Syntaxin-1 Form Clusters of <100 nm on the Plasma Membrane.
The ∼10-nm FWHM focal-plane optical resolution afforded by our technique can be extended to imaging of cellular ultrastructure in situ. We imaged the distribution of the endogenous SNARE proteins SNAP-25 and syntaxin-1 in cultured neurons by direct immunofluorescence (Figs. 2 and 3). In our measurements, individual primary antibodies labeled with Alexa 647 appeared as distinct clusters of localization points with rms widths of σ0 = 4.5 nm (13-nm FWHM).
Fig. 2.

Superresolution imaging of SNAP-25 organization along neuronal axons. (A) Localization points of Alexa 647-labeled SNAP-25 antibodies. We imaged a thin region of the culture, slightly above the coverslip, to minimize spurious signal from antibodies nonspecifically bound to the glass as well as out-of-focus fluorescence background. The diffraction-limited summed-TIR reconstruction (Inset) discerns individual ∼300-nm-diameter axons, but fails to reveal the high-resolution information present in the xy localization data. (Scale-bar: 3 μm.) (B) Effective superresolved Point Spread Function (PSF), determined by aligning the localization clusters from n = 439 individual (well-resolved, in dilute staining conditions) SNAP-25 antibodies, showing 2√2σ0 =13-nm FWHM resolution. (C) Molecular probability density surface ρ(x, y) determined from the localization data in the region enclosed by the red square in A. Distinct clusters of localization points (black dots) corresponding to individual SNAP-25 antibodies can be resolved to d ∼ 13-nm FWHM resolution (Fig. S4). The red circles indicate the estimated locations of individual SNAP-25 antibodies (Methods), which are not distributed uniformly along the axons. Instead, individual antibodies are spaced in close proximity, consistent with the organization of multiple SNAP-25 molecules in 50- to 100-nm nanodomains.
Fig. 3.

Colocalization of SNAP-25, syntaxin-1, and Munc18-1 in clusters. (A) Overlaid confocal images of syntaxin-1 (red) and SNAP-25 (green) show almost complete overlap. (B) xy-scatter plots of the syntaxin-1 (red dots) and SNAP-25 (green dots) superresolution localizations. (C and D) The localizations of syntaxin-1 and SNAP-25 are correlated at nanometer scales, shown by the cross-correlation map g(x, y) (C) and the radial pair distribution function g(r) (D). The red line is an exponential fit with ξ = 98 nm. (E) Overlaid confocal images of Munc18-1 (red) and SNAP-25 (green) show almost complete overlap. (F) xy-scatter plots of the Munc18-1 (red dots) and SNAP-25 (green dots) superresolution localizations. (G and H) The localizations of Munc18-1 and SNAP-25 are correlated at nanometer scales, shown by the cross-correlation map g(x, y) (G) and the radial pair distribution function g(r) (H). The red line is an exponential fit with ξ = 87 nm. [Scale bars: 32 μm (A and E), 1 μm (B and F), and 100 nm (C and G and Insets in B and F).]
Strikingly, the distribution of antibodies along axons was not uniform; often we observed clusters of antibodies in close proximity (Fig. 2C and Fig. S4), suggestive of organization of SNAREs in discrete ≤100-nm–sized domains. We verified that the clustered pattern of localization points was not due to incomplete data acquisition by repeatedly imaging the same region of interest and comparing successive datasets (Fig. S4). Also, saturation of available epitopes rules out incomplete staining (Fig. S4). Finally, in our experiments syntaxin-1 and SNAP-25 appeared clustered irrespective of the exact fixation protocols used (formaldehyde vs. −20 °C methanol).
Previous subdiffraction optical studies in neurons (31, 36) and rat adrenal gland phaeochromocytoma (PC12) cells (37, 38), using stimulated emission depletion (STED) imaging in both fixed and live specimens, have also indicated the presence of nanometer-sized clusters for a variety of membrane or membrane-associated proteins, including syntaxin-1 and SNAP-25. Notably, although sequestration of such proteins seems to be a general paradigm, the resolution (30- to 80-nm FWHM) of those experiments was inadequate to directly resolve multiple copies of a protein in each nanodomain or to directly reveal details of the architecture of such domains. Rather, clustering was exclusively inferred by the apparent increase (less than twofold vs. isolated antibodies) in the size (37) and/or intensity (36) of resolution-limited spots in the STED images. In contrast, our observations at fivefold higher spatial resolution, akin to electron microscopy of direct or silver-enhanced immunogold staining (39), resolve individual antigens in close proximity. A recent localization-based imaging approach (40) also provided evidence for syntaxin-1 and SNAP-25 clustering in PC12 cells; however, the effects of multiple fluorophore localizations, the use of secondary vs. primary antibodies, and the actual experimentally obtainable resolution were not quantitatively characterized. Thus, the positions of individual molecules could not be unambiguously resolved.
We determined the SNAP-25 and syntaxin-1 distributions in cultured neurons, using our superresolution approach. The pair-distribution function 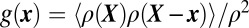 , where
  and
and  , reports the density profile of the localization points centered on each point x = (x, y). For a random distribution of points, g(x) = 1, whereas g(x) > 1 if clustering occurs (41, 42). For both SNAP-25 and syntaxin-1, the radial profile g(r), based of the estimated (x, y) coordinates of each single antibody, decays over a short distance from the origin, indicating a characteristic cluster size of radius <100 nm (Fig. S5). We note that the ability to localize individual molecules within clusters could enable a more thorough analysis of the physicochemical forces that drive membrane protein inhomogeneities. Here we focus on the development of two-color imaging capabilities and the characterization of the associations of distinct molecular species.
A Fraction of Munc18-1 Is Associated with SNAP-25/Syntaxin-1 Membrane Clusters.
We probed interactions between two intracellular proteins at nanometer scales, using simultaneous two-color superresolution imaging of Alexa 647 and Atto 532. Using two spectrally distinct fluorescent probes ensures negligible crosstalk between detection channels, enabling unambiguous identification of each detected molecule. We extended our previous two-color registration method (21) to calibrate the whole field of view of the CCD with an accuracy of ∼3 nm (Fig. S6). Achieving accurate registration between the two detection channels was essential to measure the relative distribution of Munc18-1 and t-SNAREs at nanometer scales.
In conventional diffraction-limited confocal images, both SNAP-25 and syntaxin-1 as well as Munc18-1 appeared along the length of axons, following almost identical distributions (Fig. 3 A and E). In two-color superresolution images, the two proteins form small clusters, with a fraction of the clusters containing localization points from both species (Fig. 3 B and F). We performed a statistical analysis to measure the degree of overlap between SNAP-25 and syntaxin-1. Similarly to g(x) for a single species, the cross-species pair-distribution function  reports the density profile of species i centered on molecules of species j. For two completely randomly intermixed species we expect gij(x) = 1, whereas if the two species associate at short scales, gij(x) > 1 toward the origin.
The cross-correlation function for pairwise combinations of Munc18-1, SNAP-25, and syntaxin-1 showed a peak at the origin, indicating that these three proteins are associated at length scales <100 nm (Fig. 3 C and G). The radial profile gij(r) has a roughly exponential decay gij(r) ∼ exp(−r/ξ), with ξ ∼ 80–100 nm for the various combinations (Fig. 3 D and H).
The pair-distribution analysis provides only a statistical measure of correlations averaged over the whole dataset. Inspection of the two-color superresolution images suggests that the syntaxin-1, Munc18-1, and SNAP-25 clusters overlap. We performed a local-density–based analysis (43, 44), calculating for each SNAP-25 localization point i the radii (core distances) cdistiGG and cdistiGR of neighborhoods centered on i that contain SNAP-25 or syntaxin-1 clusters of size Minpts (minimum number of points required forming a cluster). An ordered plot of cdistiGG and cdistiGR reveals very similar density-based underlying clustering structures. Also, cdistiGG and cdistiGR are significantly correlated for a range of cluster sizes Minpts ∈ [2, 19] (Pearson’s r ∼ 0.3–0.5, P value negligible) (Fig. S5).
The density-based analysis allows further quantification of the degree of clustering and colocalization between syntaxin-1, SNAP-25, and Munc18-1. The majority (67–75%) of syntaxin-1, SNAP-25, or Munc18-1 is assigned to clusters that contain on average N ∼10 detected molecules within an area of less than 100 nm, whereas 49% of syntaxin-1 and 37% of Munc18-1 molecules overlap with the nearest SNAP-25 cluster, and 62% and 34% of SNAP-25 overlap with the nearest syntaxin-1 and Munc18-1 cluster, respectively (Fig. S7). The observed cross-correlation originates from spatial overlap of clusters that contain multiple copies of syntaxin-1, Munc18-1, and SNAP-25. Munc18-1 is thus likely recruited to plasma membrane SNAP-25 clusters through interactions with syntaxin-1.
The ability to measure spatial correlations between two proteins at nanometer scales allows further analysis of the Munc18-1–syntaxin-1–SNAP-25 interactions, using mutagenesis. Syntaxin-1, thought to be the main binding partner of Munc18-1, exists in two isoforms, syntaxin-1A and -1B. In neurons from syntaxin-1A knockout mice (45), the level of Munc18-1 immunostaining was slightly reduced (approximately twofold), but the overall distribution and the relationship to SNAP-25 remained similar to the WT case (Fig. 4A). Observed with two-color superresolution imaging, the cross-correlation between Munc18-1 and SNAP-25 persisted (Fig. 4 D and E), indicating a redundant role for the two syntaxin-1 isoforms.
Fig. 4.

Loss of Munc18-1–SNAP-25 colocalization upon deletion of both syntaxin-1 isoforms. (A and B) Overlaid confocal images of Munc18-1 (red) and SNAP-25 (green) from syntaxin-1A-null neurons infected with control (A) and syntaxin-1B shRNA (B) viruses. Significant Munc18–SNAP-25 overlap remains in the control (A) but is lost upon syntaxin-1B knockdown (B). (C) xy-scatter plots of the Munc18-1 (red dots) and SNAP-25 (green dots) superresolution localizations show that upon deletion of both syntaxin-1 isoforms, SNAP-25 remains localized on the membrane whereas Munc18-1 is mostly distributed in the cytoplasm. The Munc18-1–SNAP-25 correlation persists in the syntaxin-1A-null neurons (D and E; control shRNA), but is lost upon additional knockdown of syntaxin-1B (F and G), as shown in the cross-correlation maps g(x, y) (D and F) and the radial pair distribution functions g(r) (E and G). The red line is an exponential fit with ξ = 99 nm. (H) Relative Munc18-1–SNAP-25 correlation amplitude g(r = 0) for measurements from syntaxin-1A-null neurons obtained from n = 2 independent mouse litters (n = 19 and n = 18 regions of interest for control and knockdown, respectively). Boxes, SE; whiskers, 10th–90th percentile; crosses, min–max. The correlation is significantly reduced upon additional syntaxin-1B knockdown (P = 0.006, one-way ANOVA). [Scale bars: 32 μm (A and B), 1 μm (C), and 100 nm (D and F).]
Because direct interactions between Munc18-1 and SNAP-25 do not occur in vitro (46), we used the observed nanometer correlation between Munc18-1 and SNAP-25 as a reference for dissecting the finer details of the tripartite Munc18-1, syntaxin-1, and SNAP-25 association. Knockdown of syntaxin-1B on the syntaxin-1A knockout background (47) resulted in a cross-correlation function for Munc18-1–SNAP-25 that showed no peak at the origin, indicating a complete loss of association (Fig. 4 F and G). Additionally, the overall pattern of Munc18-1 in confocal images as well as in superresolution images often showed reduced overlap with SNAP-25 staining and proportionally higher cell-body vs. axonal Munc18-1 localization (Fig. 4 B and C) (note that the diffraction-limited confocal images cannot provide any detailed information on thinner structures where Munc-18 is still present and only the superresolution images can accurately measure whether Munc18-1 is correlated with SNAP-25 at nanometer scales). This striking loss of the Munc18-1–SNAP-25 correlation upon genetic ablation of syntaxin-1 suggests that Munc18-1 is normally associated with both SNAP-25 and syntaxin-1.
The loss of the Munc18-1–SNAP-25 correlation upon ablation of syntaxin-1A/-1B provides a means to dissect the interactions between Munc18-1 and t-SNAREs by rescue experiments. Expression of wild-type rat syntaxin-1A restored the Munc18-1–SNAP-25 correlation (Fig. 5 A–C), confirming that Munc18-1 associates with SNAP-25 via interaction with syntaxin-1.
Fig. 5.

Rescue of Munc18-1–SNAP-25 cross-correlation by syntaxin-1A overexpression. (A) xy-scatter plots of superresolution localization of Munc18-1 (red) and SNAP-25 (green) in syntaxin-1A-null neurons that were infected with a virus encoding shRNA for mouse syntaxin-1 and overexpressing a rat syntaxin-1A. Overexpression of rat syntaxin-1A rescues the Munc18-1–SNAP-25 cross-correlation at nanometer scales, as shown in the cross-correlation map g(x, y) (B) and pair-distribution function g(r) (C). The red line is an exponential fit with ξ = 56 nm. (D) The syntaxin-1 N-peptide is important for recovering Munc18-1–SNAP-25 cross-correlation. Shown is the relative Munc18-1–SNAP-25 correlation amplitude g(r = 0) for measurements from syntaxin-1A-null neurons obtained from n = 2 independent mouse litters (n = 28, 14, 18, and 21 regions of interest for N-terminal deletion rescue, wild-type rescue, LE rescue, and knockdown respectively). Boxes, SE; whiskers, 10th–90th percentile; crosses, min–max. The correlation is significantly higher for WT rescue compared with the knockdown and the NTD rescue and for LE rescue compared with the knockdown (P = 0.018, P = 0.044, and P = 0.022, respectively, one-way ANOVA). [Scale bars: 1 μm (A) and 100 nm (B).] (E) A dynamic equilibrium model for Munc18-1, SNAP-25, and syntaxin-1 associations on the plasma membrane. Wild-type syntaxin-1 (yellow) can interconvert between (Top Left) an open conformation that can associate with SNAP-25 (green) and can bind Munc18-1 (gray) in an N-peptide-dependent interaction and (Top Right) a closed conformation that displaces SNAP-25 and binds tightly to Munc18-1. Our results indicate that the closed-syntaxin-1/Munc18-1 complex is not the only major configuration outside the sites of fusion but rather that the N-peptide-dependent tripartite open-syntaxin-1/SNAP-25/Munc18-1 state is significantly populated. After Munc18-1 recruitment, a fusion-competent complex can be formed with the addition of synaptobrevin-2 (red). Munc18-1 can participate in fusion pore opening by interacting with the ternary SNARE complex.
The N-terminal peptide of syntaxin-1 is essential for tight binding of Munc18-1 to syntaxin-1 when in the open conformation in SNARE complexes or when in complex with SNAP-25 and synaptobrevin (17, 18), but not for Munc18 binding to the closed conformation of monomeric syntaxin-1 (14, 48). Expression of a syntaxin-1A mutant lacking the N-terminal 8 aa did not fully restore the original phenotype (cross-correlation amplitude approximately twofold smaller than WT rescue, Fig. 5D), pointing to a direct role of the N-peptide in recruiting Munc18-1 to associate with SNAP-25 and further consistent with the notion that 50% (or more) of membrane-associated Munc18 may not be recruited to monomeric syntaxin in these experiments, but to either binary syntaxin-1/SNAP-25 or to ternary syntaxin-1/SNAP-25/synaptobrevin complexes.
Experiments with the syntaxin-1A (“LE”) mutant (15) provide additional evidence that Munc18-1 is recruited to the plasma membrane through interactions with syntaxin-1 in an open conformation that allows SNARE assembly (rather than the closed form of syntaxin-1 that kinetically impedes SNARE complex assembly). The LE mutation shifts the open/closed equilibrium of syntaxin-1 to the open state in solution and results in a somewhat weaker affinity in forming 1:1 complexes with Munc18-1 (15) [binding affinity reduced between ∼10-fold (48) and ∼100-fold (49)]. Expression of the predominantly open LE syntaxin-1A restored the Munc18-1–SNAP-25 correlation to a similar level to that of expression of WT syntaxin-1A (Fig. 5D). Thus, the conformational change from closed to open syntaxin-1 appears to have already occurred for many of the observed tripartite Munc18-1, syntaxin-1, and SNAP-25 associations, likely upstream of the full SNARE bundle formation in the neuronal membrane fusion reaction.
Biochemical assays further corroborate our nanometer-scale imaging results on the associations of Munc18-1, syntaxin-1, and SNAP-25 (Fig. S8). Munc18-1 can be pulled down from WT mouse brain lysate together with the SNARE protein SNAP-25 but not with monomeric SNAP-25. Also, in cortical neurons cultured from syntaxin-1A KO mice, the syntaxin-1B knock-down inhibits coimmunoprecipitation of Munc18-1 and SNAP-25. This loss of coimmunoprecipitation is rescued by reexpression of WT rat syntaxin-1A but not of mutant syntaxin-1A lacking the N-terminal peptide. Consistent with the notion that the observed tripartite associations involve mostly the open syntaxin conformation, expression of LE syntaxin-1A results in enhanced pull-down of both Munc-18 and SNAP-25.
Discussion
Fluorescence Nanoscopy with Photon-Limited Spatial Resolution.
Dissecting the complex molecular assemblies and interactions that regulate neurotransmitter release has been hindered by the unavailability of high-resolution/high-sensitivity in situ imaging tools. Here we demonstrate fluorescence nanoscopy of biological specimens at ambient conditions down to the photon-noise limit of d ∼ 7.5-nm FWHM resolution (3-nm localization precision). The performance achieved is an approximately two- to threefold improvement compared with conventional single-marker switching approaches (22) that demonstrated ∼20-nm FWHM resolution benchmarks using similar fluorophores, photoswitching schemes, and photon efficiencies to those used here (23, 29) and that represent a widely adopted opto-mechanical platform for superresolution microscopy implementations. Our results are a unique example of using superresolution cross-correlation analysis and mutagenesis to characterize details of protein–protein interactions in vivo.
Higher resolution requires minimizing systematic effects while maximizing the photon budget. Three recent implementations that collect twice as many photons by imaging the sample using two opposed objective lenses have shown focal plane FWHM resolutions ∼10 nm (27) and ∼20 nm (25, 26), respectively. Faster acquisition reduces the effect of long-term instabilities and ref. 26 reports an ∼2-nm short-term stability; however, the faster on–off dye cycling might have limited the photon budget and thus the obtainable resolution. Brighter fluorophores enable higher resolution but require correspondingly longer acquisition times, thus resulting in correspondingly higher susceptibility to instrument drift, and although the extra improvement in ref. 27 is noteworthy, this performance is significantly worse than the theoretical limit. Our active stabilization scheme is simpler and more efficient than these alternative approaches, while, more importantly, minimizing systematic errors due to long-term drift and achieving a currently unique to our knowledge performance very close to the theoretic resolution limit (Table S1).
In addition to our active feedback system, further increase in the raw resolution is possible. We note that with additional optimization of fluorescent probes (50) and/or switching kinetics (51), for ∼105 collected photons in each on cycle, localization accuracy down to s ∼ 0.5 nm (d ∼ 1-nm FWHM resolution) is possible in our experimental apparatus (21), although statistical errors of ∼0.2 nm in the interprobe distances could be achieved by repetitive measurements over multiple (e.g., ∼10) successive on cycles. Further refinement of the sample preparation procedures to achieve dense labeling, possibly via genetically encoded (50), enzymatically incorporated (52), or chemically attached (53) fluorescent tags, would further use the potential of our approach to reveal the exact molecular-scale architecture of subcellular structures.
We also developed optimized calibration standards and algorithms for two-color subdiffraction imaging, using spectrally separable fluorescent probes. Featuring negligible crosstalk and ∼3-nm spatial registration accuracy over the size of a cell (∼15 µm), our approach enables measuring the relative intracellular distributions of two distinct protein species. This result establishes a methodological framework to analyze, in situ, interactions between protein components that form macromolecular assemblies. Our work significantly extends the scope of the early proof-of-principle demonstrations of well-characterized and spatially defined structures, like the cytoskeleton or clathrin cages, and discerns the unknown organization of irregularly distributed intracellular molecules.
Due to the demonstrated enhanced imaging performance, we foresee that refined approaches to carefully eliminate extraneous errors, such as the active feedback-stabilization and the two-color mapping calibration procedures we report here, will be used to improve the resolution of fluorescence “nanoscopes”. Importantly, deciphering molecular interactions on the basis of diffraction-limited imaging is often not possible as proteins that appear colocalized with a conventional microscope can be well separated on the nanoscale. The improved spatial resolution and multicolor registration accuracy afforded by our approach opens up the possibility for further applications to characterize intracellular protein–protein interactions and formation of defined molecular complexes in situ.
Association of Syntaxin-1, SNAP-25, and Munc18 at the Plasma Membrane.
Here we show at 13-nm FWHM resolution that syntaxin-1, SNAP-25, and Munc18-1 are present in clusters on the plasma membrane, and we demonstrate in pairwise double-labeling experiments that these three proteins colocalize. This is to the best of our knowledge a unique two-color experiment demonstrating that syntaxin-1, SNAP-25, and SM proteins can be found in the same nanometer-sized clusters. The clusters have a size of 50–100 nm and contain up to ∼10 detected copies of each molecule (note that the actual number of molecules present may be higher, because steric hindrance can preclude efficient binding of multiple antibodies on closely packed complexes). We observed a striking colocalization of syntaxin-1, SNAP-25, and Munc18-1.
Assembly of the neurotransmitter release machinery during membrane fusion reactions is thought to proceed in several steps. Often, subsets of SNARE proteins can bind to each other in kinetically trapped, “dead-end” configurations, vivid examples being the 2:1 syntaxin-1–SNAP-25 (54, 55) complexes. Munc18-1 binds to closed syntaxin-1 in a binary complex that is thought to control the beginning of SNARE-complex assembly (45). Reconstitution experiments with Munc18-1, neuronal SNAREs, NSF, SNAP, and Munc13 suggest that the binary syntaxin-1/SNAP-25 complex is readily dissociated by NSF and SNAP, allowing Munc18-1 to capture the closed state of syntaxin, kinetically blocking assembly of binary or ternary SNARE complex (56). Upon action of Munc13 (57), presumably in conjunction with an approaching synaptic vesicle, binary or ternary SNARE complex formation is enabled, setting the stage for Ca2+-triggered fusion. Specifically, when syntaxin opens up, the mode of Munc18 binding to syntaxin is dependent on the syntaxin-1 N terminus for tight binding but does not require the autonomously folded three-helix “abc” bundle (Habc) domain anymore (14). Of these two binding modes, the first is observed only for SM proteins in exocytosis, whereas the second is generally present in many SM-protein/SNARE interactions. The second binding mode also involves a direct interaction of Munc18 with the four-helix bundle of the SNARE complex (17, 18). Munc18’s most important role, however, is probably in fusion directly by an as yet unknown mechanism because Munc18 and other SM proteins are generally essential for the fusion reactions in which they participate, more so often than synaptobrevin and SNAP-25 (7, 58), suggesting that their function is not that of a chaperone or SNARE booster, but truly intrinsic to the fusion process.
Because we observe a tripartite association of syntaxin-1, SNAP-25, and Munc18-1 in neurons, in principle, this suggests three possibilities: a close association of the closed syntaxin–Munc18-1 complex with SNAP-25, a complex involving the open conformation of syntaxin with both Munc18-1 and SNAP-25, or a dynamic equilibrium between these states. In either case, the Munc18-1 interaction with the N terminus of syntaxin would play a role: This interaction is essential for tight binding between Munc18 and the ternary SNARE complex (17, 48), whereas it strengthens the interaction between the closed conformation of Munc18 and syntaxin (48). This conclusion is further supported by our finding that deletion of the N terminus of syntaxin-1 largely abrogates the colocalization of Munc18-1 with SNAP-25 (Fig. 5D).
The observation that the Habc domain of syntaxin is not essential for exocytosis but that the N terminus is essential for both spontaneous and evoked release (47) does not directly rule out either state (Munc18–closed syntaxin-1 complex with SNAP-25 nearby or Munc18-1/syntaxin/SNAP-25 complex). However, our finding that rescue with the N-terminal peptide deletion (NTD) mutant of syntaxin, which prevents tight binding of Munc18-1 to syntaxin-1 in a binary or ternary SNARE complex but not to closed monomeric syntaxin-1 (14), does not fully recover the Munc18/SNAP-25 cross-correlation (Fig. 5D), suggests that the observed tripartite Munc18, syntaxin-1, SNAP-25 associations involve binary or ternary SNARE complexes or a dynamic equilibrium involving these states.
Our results support the notion that in neurons, SNARE proteins are normally arranged in membrane patches, consistent with the overall subcellular organization of the neuronal plasma membrane, where channels and receptors are arranged into particular subdomains. This notion is surprising given that SNAREs effectively primarily function in presynaptic active zones, which coincide only with a tiny percentage if any of the patches containing SNAREs. Even though a single SNARE complex is sufficient to dock liposomes to membranes and promote spontaneous lipid and content mixing in vitro (59), conferring fast exocytosis in combination with the Ca2+ sensor synaptotagmin requires more than one synaptobrevin molecule (60) and more than three SNAP-25 molecules (61). The organization of SNAREs in ≤100-nm membrane domains, similar to the size corresponding to individual presynaptic active zones, may enhance the efficiency and speed of synaptic vesicle fusion reaction.
A certain fraction of the clusters of Munc18-1, syntaxin-1, and SNAP-25 observed here likely contain binary (syntaxin-1/SNAP-25) or ternary (syntaxin-1/SNAP-25/synaptobrevin) SNARE complexes or they represent averages over dynamic states involving these complexes. It has been known for some time that SNARE and SM proteins involved in synaptic vesicle exocytosis are not actually enriched at sites of exocytosis (62), but the existence of structured clusters of SM/SNARE protein complexes throughout neurons is nevertheless surprising. It suggests that these complexes may operate in other fusion reactions, but more importantly indicates that the specificity and regulation of synaptic vesicle fusion operate at a level different from that of SNARE and SM proteins. How these clusters are formed and why SNARE and SM protein complexes are not randomly distributed in membranes remain unknown. A plausible hypothesis is that the biophysical properties of the phospholipid membrane with lipid subdomains containing enrichment of cholesterol may contribute to the formation of these clusters, but it seems unlikely that these clusters are only a consequence of such physicochemical forces and more likely that they represent the result of organizing proteins that are generally involved in controlling membrane fusion.
Given these previous observations, our finding that syntaxin-1 and SNAP-25 are abundantly present in a tripartite association with Munc18-1 is unexpected and raises a number of questions. It is unexpected because—as mentioned above—Munc18-1 also binds to syntaxin-1 in a different, independent mode, namely the closed conformation of syntaxin-1 before it assembles into any complex with another SNARE protein. Thus, it is surprising that our observations suggest that this complex might not be the only predominant complex outside of the sites of synaptic fusion—instead, we detected recruitment of Munc18-1 through a tripartite association with SNAP-25 and syntaxin that is N-peptide dependent (Fig. 5E). At the same time, our results independently validate the notion that Munc18-1 binding to the N-peptide of syntaxin-1 plays a central role in fusion as proposed previously (14, 17, 47, 49, 63–65).
Methods
Actively Stabilized Microscope.
The two-color superresolution imaging setup is shown in Fig. S1. A feedback loop that tracked the bright-field image of a fiduciary in real time actuated a three-axis nanopositioning stage (Physik Instrumente; 561-3DD, E-710 controller) and locked the sample at a fixed x, y, z set point during data acquisition. For cellular imaging, in cases where no fiducials of high-enough contrast for z tracking existed in the field of view, we used an alternative focus-stabilization scheme (21), based on a dedicated stabilized near-infrared (NIR) laser beam that undergoes total internal reflection (TIR) on the sample and is projected on a position-sensitive detector (Quadrant Photo-Detector, QPD).
Stochastic Single-Molecule Switching Imaging.
We used ∼5-kW/cm2 and ∼20-kW/cm2 continuous-wave (CW) ∼640-nm and 532-nm laser illumination for Cy5/Alexa 647 and Atto 532, respectively. We found that simultaneous illumination with both lasers resulted in irreversible bleaching of the Alexa 647, as well as higher autofluorescence background in the red channel. Therefore, during cellular imaging, Alexa 647 was measured first for ∼30 min, followed by ∼40–50 min for Atto 532. The presence of an enzymatic oxygen scavenging system and a millimolar concentration of thiol enabled photoswitching (23, 66), each molecule undergoing a rapid transition to a dark state upon emitting a distribution of N0 mean collected photons (Fig. S2). To achieve the highest possible contrast ratio (molecules on:molecules off) we imaged Cy5/Alexa 647 without the presence of an activator dye (23, 29) or a high-power shorter-wavelength laser (34), allowing slow, spontaneous recovery of each molecule from the dark state (rate ∼10−2 s−1). This cycle could be repeated several times, providing a cluster of localization points (centers of observed spots) from each on state for each molecule. Aligning such localization clusters from multiple molecules created a Lorentzian distribution of xy points with FWHM 2√2σ0 ∼ 2.828σ0 (Figs. 1 and 2), as expected from the total signal and background counts (67, 68) (SI Methods), demonstrating that our active stabilization approach successfully eliminates systematic errors due to drift. (Note that σ0 is used only to parameterize the FWHM, as the SD for a Lorentzian distribution is infinite.)
Resolution Refinement.
To determine the increased resolution afforded by keeping progressively more precisely localized molecules, only points in Fig. 1 A and C were kept for which the calculated precision σ was better than a certain cutoff σcutoff. The xy distributions (Fig. 1A) or the deviations from the fitted line (Fig. 1C) for the subset of points were fitted to a Gaussian peak. The refined resolution vs. σcutoff was determined from the fitted peak widths as d = 2.35s. We note that in previous refinement attempts (22, 69) similar fractions of the data were kept (∼1–10%); however, the accuracy for the refined set of points was not quantitatively validated against a known structure. Practically, this procedure is expected to improve the resolution by approximately two- to threefold (SI Methods and Fig. S3) whereas in contrast, selecting a random subset of the original data does not improve the resolution.
Identification of Individual SNAP-25 Antibodies.
To independently determine the superresolution image of individual Alexa 647-labeled SNAP-25 antibodies, we imaged a neuronal sample at dilute staining conditions, ensuring well-spaced antibodies. Because a single Alexa 647 dye can undergo multiple switching cycles, each SNAP-25 antibody appears as a cluster of xy localization points (approximately five points per hour of acquisition time). The FWHM of the distribution of points in each cluster is d = 13 nm, determined by aligning individual clusters by their center of mass (Fig. 2B).
Individual antibodies could also be identified as distinct clusters of Alexa 647 xy localization points in densely stained specimens (Fig. 2A). Neighbor antibodies could be readily resolved from the xy scatter plots, at minimum separations of ∼30–50 nm, with <15-nm FWHM resolution (Fig. S4). To estimate a molecular probability density function ρ(x, y) we rendered each xy Alexa 647 localization point (Fig. 2C) as a normalized 2D Gaussian (22) of rms size σ given by Eq. S1a. Individual SNAP-25 antibodies were identified as local maxima of the resulting 2D ρ(x, y) surface (Fig. 2C), using a peak search algorithm. The xy coordinates of each SNAP-25 antibody were then determined from the centroid of ρ(x, y) around each peak.
Two-Color Registration over Extended Field of View.
Two types of reference objects were used to register the coordinates between the two CCD channels: (i) 20-bp Cy3-Cy5 DNA duplexes, randomly distributed in the field of view, and (ii) a regular nanofabricated pattern of subwavelength holes on an Al-coated quartz wafer (SI Methods and Fig. S6). A set of reference coordinates obtained from multiple such objects and from sampling the whole field of view was used to obtain a mapping transformation (21), using a low-order polynomial or spline interpolation (SI Methods and Fig. S6).
Sample Preparation and Imaging Conditions.
The preparations of DNA constructs, F-actin, dye-labeled antibodies, and neuronal cultures, as well as procedures and conditions for confocal immunofluorescence imaging, are detailed in SI Methods.
Quantitative Colocalization and Clustering Structure Analysis.
We used the OPTICS algorithm (44) to perform a hierarchical ordering of the antibody localization points. For each point i we calculated core-distances (43) cdistiGG and cdistiGR with respect to points of the same and opposite colors, respectively (Fig. S5). Clusters were identified using the DBSCAN algorithm(43), with Minpts = 3 and ε ∼ 30–40 nm. The selected values for ε correspond to roughly the average core distances for the particular dataset; approximately twofold smaller ε values failed to identify all but the densest clusters whereas approximately twofold larger ε values resulted in merging all of the points into just a few large ones.
Supplementary Material
Acknowledgments
A.P. wishes to thank James W. Conway for sharing expertise in Electron Beam Lithography. Work was performed in part at the Stanford Nanofabrication Facility which is supported by National Science Foundation through the National Nanotechnology Infrastructure Network under Grant ECS- 9731293. This work was supported by the National Institutes of Health (NIH), the National Science Foundation, the National Aeronautics and Space Administration, and the Defense Advanced Research Projects Agency through awards to S.C. and by NIH Grant R37-MH63105 (to A.T.B.).
Footnotes
The authors declare no conflict of interest.
This article contains supporting information online at www.pnas.org/lookup/suppl/doi:10.1073/pnas.1310654110/-/DCSupplemental.
References
- 1.Gao Y, et al. Single reconstituted neuronal SNARE complexes zipper in three distinct stages. Science. 2012;337(6100):1340–1343. doi: 10.1126/science.1224492. [DOI] [PMC free article] [PubMed] [Google Scholar]
- 2.Hata Y, Slaughter CA, Südhof TC. Synaptic vesicle fusion complex contains unc-18 homologue bound to syntaxin. Nature. 1993;366(6453):347–351. doi: 10.1038/366347a0. [DOI] [PubMed] [Google Scholar]
- 3.Novick P, Schekman R. Secretion and cell-surface growth are blocked in a temperature-sensitive mutant of Saccharomyces cerevisiae. Proc Natl Acad Sci USA. 1979;76(4):1858–1862. doi: 10.1073/pnas.76.4.1858. [DOI] [PMC free article] [PubMed] [Google Scholar]
- 4.Harrison SD, Broadie K, van de Goor J, Rubin GM. Mutations in the Drosophila Rop gene suggest a function in general secretion and synaptic transmission. Neuron. 1994;13(3):555–566. doi: 10.1016/0896-6273(94)90025-6. [DOI] [PubMed] [Google Scholar]
- 5.Brenner S. The genetics of Caenorhabditis elegans. Genetics. 1974;77(1):71–94. doi: 10.1093/genetics/77.1.71. [DOI] [PMC free article] [PubMed] [Google Scholar]
- 6.Gengyo-Ando K, et al. The C. elegans unc-18 gene encodes a protein expressed in motor neurons. Neuron. 1993;11(4):703–711. doi: 10.1016/0896-6273(93)90080-b. [DOI] [PubMed] [Google Scholar]
- 7.Verhage M, et al. Synaptic assembly of the brain in the absence of neurotransmitter secretion. Science. 2000;287(5454):864–869. doi: 10.1126/science.287.5454.864. [DOI] [PubMed] [Google Scholar]
- 8.Perin MS, Fried VA, Mignery GA, Jahn R, Südhof TC. Phospholipid binding by a synaptic vesicle protein homologous to the regulatory region of protein kinase C. Nature. 1990;345(6272):260–263. doi: 10.1038/345260a0. [DOI] [PubMed] [Google Scholar]
- 9.McMahon HT, Missler M, Li C, Südhof TC. Complexins: Cytosolic proteins that regulate SNAP receptor function. Cell. 1995;83(1):111–119. doi: 10.1016/0092-8674(95)90239-2. [DOI] [PubMed] [Google Scholar]
- 10. Diao J, et al. (2012) Synaptic proteins promote calcium-triggered fast transition from point contact to full fusion. eLife 1:e00109. [DOI] [PMC free article] [PubMed]
- 11.Kyoung M, et al. In vitro system capable of differentiating fast Ca2+-triggered content mixing from lipid exchange for mechanistic studies of neurotransmitter release. Proc Natl Acad Sci USA. 2011;108(29):E304–E313. doi: 10.1073/pnas.1107900108. [DOI] [PMC free article] [PubMed] [Google Scholar]
- 12.Yamaguchi T, et al. Sly1 binds to Golgi and ER syntaxins via a conserved N-terminal peptide motif. Dev Cell. 2002;2(3):295–305. doi: 10.1016/s1534-5807(02)00125-9. [DOI] [PubMed] [Google Scholar]
- 13.Dulubova I, et al. How Tlg2p/syntaxin 16 ‘snares’ Vps45. EMBO J. 2002;21(14):3620–3631. doi: 10.1093/emboj/cdf381. [DOI] [PMC free article] [PubMed] [Google Scholar]
- 14.Dulubova I, et al. Munc18-1 binds directly to the neuronal SNARE complex. Proc Natl Acad Sci USA. 2007;104(8):2697–2702. doi: 10.1073/pnas.0611318104. [DOI] [PMC free article] [PubMed] [Google Scholar]
- 15.Dulubova I, et al. A conformational switch in syntaxin during exocytosis: Role of munc18. EMBO J. 1999;18(16):4372–4382. doi: 10.1093/emboj/18.16.4372. [DOI] [PMC free article] [PubMed] [Google Scholar]
- 16.Misura KM, Scheller RH, Weis WI. Three-dimensional structure of the neuronal-Sec1-syntaxin 1a complex. Nature. 2000;404(6776):355–362. doi: 10.1038/35006120. [DOI] [PubMed] [Google Scholar]
- 17.Shen J, Tareste DC, Paumet F, Rothman JE, Melia TJ. Selective activation of cognate SNAREpins by Sec1/Munc18 proteins. Cell. 2007;128(1):183–195. doi: 10.1016/j.cell.2006.12.016. [DOI] [PubMed] [Google Scholar]
- 18.Xu Y, Su L, Rizo J. Binding of Munc18-1 to synaptobrevin and to the SNARE four-helix bundle. Biochemistry. 2010;49(8):1568–1576. doi: 10.1021/bi9021878. [DOI] [PMC free article] [PubMed] [Google Scholar]
- 19.Carr CM, Grote E, Munson M, Hughson FM, Novick PJ. Sec1p binds to SNARE complexes and concentrates at sites of secretion. J Cell Biol. 1999;146(2):333–344. doi: 10.1083/jcb.146.2.333. [DOI] [PMC free article] [PubMed] [Google Scholar]
- 20.Hell SW. Far-field optical nanoscopy. Science. 2007;316(5828):1153–1158. doi: 10.1126/science.1137395. [DOI] [PubMed] [Google Scholar]
- 21.Pertsinidis A, Zhang Y, Chu S. Subnanometre single-molecule localization, registration and distance measurements. Nature. 2010;466(7306):647–651. doi: 10.1038/nature09163. [DOI] [PubMed] [Google Scholar]
- 22.Betzig E, et al. Imaging intracellular fluorescent proteins at nanometer resolution. Science. 2006;313(5793):1642–1645. doi: 10.1126/science.1127344. [DOI] [PubMed] [Google Scholar]
- 23.Rust MJ, Bates M, Zhuang X. Sub-diffraction-limit imaging by stochastic optical reconstruction microscopy (STORM) Nat Methods. 2006;3(10):793–795. doi: 10.1038/nmeth929. [DOI] [PMC free article] [PubMed] [Google Scholar]
- 24.Hess ST, Girirajan TP, Mason MD. Ultra-high resolution imaging by fluorescence photoactivation localization microscopy. Biophys J. 2006;91(11):4258–4272. doi: 10.1529/biophysj.106.091116. [DOI] [PMC free article] [PubMed] [Google Scholar]
- 25.Shtengel G, et al. Interferometric fluorescent super-resolution microscopy resolves 3D cellular ultrastructure. Proc Natl Acad Sci USA. 2009;106(9):3125–3130. doi: 10.1073/pnas.0813131106. [DOI] [PMC free article] [PubMed] [Google Scholar]
- 26.Aquino D, et al. Two-color nanoscopy of three-dimensional volumes by 4Pi detection of stochastically switched fluorophores. Nat Methods. 2011;8(4):353–359. doi: 10.1038/nmeth.1583. [DOI] [PubMed] [Google Scholar]
- 27.Xu K, Babcock HP, Zhuang X. Dual-objective STORM reveals three-dimensional filament organization in the actin cytoskeleton. Nat Methods. 2012;9(2):185–188. doi: 10.1038/nmeth.1841. [DOI] [PMC free article] [PubMed] [Google Scholar]
- 28.Subach FV, et al. Photoactivatable mCherry for high-resolution two-color fluorescence microscopy. Nat Methods. 2009;6(2):153–159. doi: 10.1038/nmeth.1298. [DOI] [PMC free article] [PubMed] [Google Scholar]
- 29.Bates M, Huang B, Dempsey GT, Zhuang X. Multicolor super-resolution imaging with photo-switchable fluorescent probes. Science. 2007;317(5845):1749–1753. doi: 10.1126/science.1146598. [DOI] [PMC free article] [PubMed] [Google Scholar]
- 30.Shroff H, et al. Dual-color superresolution imaging of genetically expressed probes within individual adhesion complexes. Proc Natl Acad Sci USA. 2007;104(51):20308–20313. doi: 10.1073/pnas.0710517105. [DOI] [PMC free article] [PubMed] [Google Scholar]
- 31.Punge A, et al. 3D reconstruction of high-resolution STED microscope images. Microsc Res Tech. 2008;71(9):644–650. doi: 10.1002/jemt.20602. [DOI] [PubMed] [Google Scholar]
- 32.Dani A, Huang B, Bergan J, Dulac C, Zhuang X. Superresolution imaging of chemical synapses in the brain. Neuron. 2010;68(5):843–856. doi: 10.1016/j.neuron.2010.11.021. [DOI] [PMC free article] [PubMed] [Google Scholar]
- 33.Denker A, Kröhnert K, Bückers J, Neher E, Rizzoli SO. The reserve pool of synaptic vesicles acts as a buffer for proteins involved in synaptic vesicle recycling. Proc Natl Acad Sci USA. 2011;108(41):17183–17188. doi: 10.1073/pnas.1112690108. [DOI] [PMC free article] [PubMed] [Google Scholar]
- 34.Heilemann M, et al. Subdiffraction-resolution fluorescence imaging with conventional fluorescent probes. Angew Chem Int Ed Engl. 2008;47(33):6172–6176. doi: 10.1002/anie.200802376. [DOI] [PubMed] [Google Scholar]
- 35.Gittes F, Mickey B, Nettleton J, Howard J. Flexural rigidity of microtubules and actin filaments measured from thermal fluctuations in shape. J Cell Biol. 1993;120(4):923–934. doi: 10.1083/jcb.120.4.923. [DOI] [PMC free article] [PubMed] [Google Scholar]
- 36.Willig KI, Rizzoli SO, Westphal V, Jahn R, Hell SW. STED microscopy reveals that synaptotagmin remains clustered after synaptic vesicle exocytosis. Nature. 2006;440(7086):935–939. doi: 10.1038/nature04592. [DOI] [PubMed] [Google Scholar]
- 37.Sieber JJ, et al. Anatomy and dynamics of a supramolecular membrane protein cluster. Science. 2007;317(5841):1072–1076. doi: 10.1126/science.1141727. [DOI] [PubMed] [Google Scholar]
- 38.van den Bogaart G, et al. Membrane protein sequestering by ionic protein-lipid interactions. Nature. 2011;479(7374):552–555. doi: 10.1038/nature10545. [DOI] [PMC free article] [PubMed] [Google Scholar]
- 39.Garcia EP, McPherson PS, Chilcote TJ, Takei K, De Camilli P. rbSec1A and B colocalize with syntaxin 1 and SNAP-25 throughout the axon, but are not in a stable complex with syntaxin. J Cell Biol. 1995;129(1):105–120. doi: 10.1083/jcb.129.1.105. [DOI] [PMC free article] [PubMed] [Google Scholar]
- 40.Bar-On D, et al. Super-resolution imaging reveals the internal architecture of nano-sized syntaxin clusters. J Biol Chem. 2012;287(32):27158–27167. doi: 10.1074/jbc.M112.353250. [DOI] [PMC free article] [PubMed] [Google Scholar]
- 41.Hansen J-P, McDonald IR. Theory of Simple Liquids. 3rd edition. London, UK: Academic Press; 2006. P 29–30. [Google Scholar]
- 42.Sengupta P, et al. Probing protein heterogeneity in the plasma membrane using PALM and pair correlation analysis. Nat Methods. 2011;8(11):969–975. doi: 10.1038/nmeth.1704. [DOI] [PMC free article] [PubMed] [Google Scholar]
- 43. Ester MKH-P, Sander J, Xu X (1996) A density based algorithm for discovering clusters in large spatial databases with noise. Proceedings of the Second International Conference on Knowledge Discovery and Data Mining, eds Simoudis E, Han J, Fayyad U (Association for the Advancement of Artificial Intelligence, Menlo Park, CA), pp 226–231.
- 44. Ankerst M, Breunig M, Kreigel H-P, Sander J (1999) OPTICS: Ordering points to identify clustering structure. Proceedings of the 1999 ACM SIGMOD International Conference on Management of Data ACM Press New York, NY, USA Alex Delis, Christos Faloutsos, Shahram Ghandeharizadeh (Eds.) pp 49–60.
- 45.Gerber SH, et al. Conformational switch of syntaxin-1 controls synaptic vesicle fusion. Science. 2008;321(5895):1507–1510. doi: 10.1126/science.1163174. [DOI] [PMC free article] [PubMed] [Google Scholar]
- 46.Hata Y, Südhof TC. A novel ubiquitous form of Munc-18 interacts with multiple syntaxins. Use of the yeast two-hybrid system to study interactions between proteins involved in membrane traffic. J Biol Chem. 1995;270(22):13022–13028. doi: 10.1074/jbc.270.22.13022. [DOI] [PubMed] [Google Scholar]
- 47.Zhou P, et al. Syntaxin-1 N-peptide and Habc-domain perform distinct essential functions in synaptic vesicle fusion. EMBO J. 2013;32(1):159–171. doi: 10.1038/emboj.2012.307. [DOI] [PMC free article] [PubMed] [Google Scholar]
- 48.Burkhardt P, Hattendorf DA, Weis WI, Fasshauer D. Munc18a controls SNARE assembly through its interaction with the syntaxin N-peptide. EMBO J. 2008;27(7):923–933. doi: 10.1038/emboj.2008.37. [DOI] [PMC free article] [PubMed] [Google Scholar]
- 49.Khvotchev M, et al. Dual modes of Munc18-1/SNARE interactions are coupled by functionally critical binding to syntaxin-1 N terminus. J Neurosci. 2007;27(45):12147–12155. doi: 10.1523/JNEUROSCI.3655-07.2007. [DOI] [PMC free article] [PubMed] [Google Scholar]
- 50.Shaner NC, et al. Improving the photostability of bright monomeric orange and red fluorescent proteins. Nat Methods. 2008;5(6):545–551. doi: 10.1038/nmeth.1209. [DOI] [PMC free article] [PubMed] [Google Scholar]
- 51.Vogelsang J, Cordes T, Forthmann C, Steinhauer C, Tinnefeld P. Controlling the fluorescence of ordinary oxazine dyes for single-molecule switching and superresolution microscopy. Proc Natl Acad Sci USA. 2009;106(20):8107–8112. doi: 10.1073/pnas.0811875106. [DOI] [PMC free article] [PubMed] [Google Scholar]
- 52.Hein B, et al. Stimulated emission depletion nanoscopy of living cells using SNAP-tag fusion proteins. Biophys J. 2010;98(1):158–163. doi: 10.1016/j.bpj.2009.09.053. [DOI] [PMC free article] [PubMed] [Google Scholar]
- 53.Keppler A, Pick H, Arrivoli C, Vogel H, Johnsson K. Labeling of fusion proteins with synthetic fluorophores in live cells. Proc Natl Acad Sci USA. 2004;101(27):9955–9959. doi: 10.1073/pnas.0401923101. [DOI] [PMC free article] [PubMed] [Google Scholar]
- 54.Fasshauer D, Bruns D, Shen B, Jahn R, Brünger AT. A structural change occurs upon binding of syntaxin to SNAP-25. J Biol Chem. 1997;272(7):4582–4590. doi: 10.1074/jbc.272.7.4582. [DOI] [PubMed] [Google Scholar]
- 55.Xiao W, Poirier MA, Bennett MK, Shin YK. The neuronal t-SNARE complex is a parallel four-helix bundle. Nat Struct Biol. 2001;8(4):308–311. doi: 10.1038/86174. [DOI] [PubMed] [Google Scholar]
- 56.Ma C, Su L, Seven AB, Xu Y, Rizo J. Reconstitution of the vital functions of Munc18 and Munc13 in neurotransmitter release. Science. 2013;339(6118):421–425. doi: 10.1126/science.1230473. [DOI] [PMC free article] [PubMed] [Google Scholar]
- 57.Ma C, Li W, Xu Y, Rizo J. Munc13 mediates the transition from the closed syntaxin-Munc18 complex to the SNARE complex. Nat Struct Mol Biol. 2011;18(5):542–549. doi: 10.1038/nsmb.2047. [DOI] [PMC free article] [PubMed] [Google Scholar]
- 58.Schoch S, et al. SNARE function analyzed in synaptobrevin/VAMP knockout mice. Science. 2001;294(5544):1117–1122. doi: 10.1126/science.1064335. [DOI] [PubMed] [Google Scholar]
- 59.van den Bogaart G, et al. One SNARE complex is sufficient for membrane fusion. Nat Struct Mol Biol. 2010;17(3):358–364. doi: 10.1038/nsmb.1748. [DOI] [PMC free article] [PubMed] [Google Scholar]
- 60.Sinha R, Ahmed S, Jahn R, Klingauf J. Two synaptobrevin molecules are sufficient for vesicle fusion in central nervous system synapses. Proc Natl Acad Sci USA. 2011;108(34):14318–14323. doi: 10.1073/pnas.1101818108. [DOI] [PMC free article] [PubMed] [Google Scholar]
- 61.Mohrmann R, de Wit H, Verhage M, Neher E, Sørensen JB. Fast vesicle fusion in living cells requires at least three SNARE complexes. Science. 2010;330(6003):502–505. doi: 10.1126/science.1193134. [DOI] [PubMed] [Google Scholar]
- 62.Südhof TC. Calcium control of neurotransmitter release. Cold Spring Harb Perspect Biol. 2012;4(1):a011353. doi: 10.1101/cshperspect.a011353. [DOI] [PMC free article] [PubMed] [Google Scholar]
- 63.Deák F, et al. Munc18-1 binding to the neuronal SNARE complex controls synaptic vesicle priming. J Cell Biol. 2009;184(5):751–764. doi: 10.1083/jcb.200812026. [DOI] [PMC free article] [PubMed] [Google Scholar]
- 64.Rathore SS, et al. Syntaxin N-terminal peptide motif is an initiation factor for the assembly of the SNARE-Sec1/Munc18 membrane fusion complex. Proc Natl Acad Sci USA. 2010;107(52):22399–22406. doi: 10.1073/pnas.1012997108. [DOI] [PMC free article] [PubMed] [Google Scholar]
- 65.Johnson JR, et al. Binding of UNC-18 to the N-terminus of syntaxin is essential for neurotransmission in Caenorhabditis elegans. Biochem J. 2009;418(1):73–80. doi: 10.1042/BJ20081956. [DOI] [PubMed] [Google Scholar]
- 66.Fölling J, et al. Fluorescence nanoscopy by ground-state depletion and single-molecule return. Nat Methods. 2008;5(11):943–945. doi: 10.1038/nmeth.1257. [DOI] [PubMed] [Google Scholar]
- 67.Thompson RE, Larson DR, Webb WW. Precise nanometer localization analysis for individual fluorescent probes. Biophys J. 2002;82(5):2775–2783. doi: 10.1016/S0006-3495(02)75618-X. [DOI] [PMC free article] [PubMed] [Google Scholar]
- 68.Mortensen KI, Churchman LS, Spudich JA, Flyvbjerg H. Optimized localization analysis for single-molecule tracking and super-resolution microscopy. Nat Methods. 2010;7(5):377–381. doi: 10.1038/nmeth.1447. [DOI] [PMC free article] [PubMed] [Google Scholar]
- 69.Cronin B, de Wet B, Wallace MI. Lucky imaging: Improved localization accuracy for single molecule imaging. Biophys J. 2009;96(7):2912–2917. doi: 10.1016/j.bpj.2008.12.3945. [DOI] [PMC free article] [PubMed] [Google Scholar]
Associated Data
This section collects any data citations, data availability statements, or supplementary materials included in this article.