Abstract
Regulation of cell growth and proliferation has a fundamental role in tissue development, organogenesis, and disease progression. Conserved distribution of the number of sides of cells with a mean value of six was found in a variety of proliferating epithelia. Previous studies have shown that clones of proliferating cells bounded by quiescent cells have fewer sides than normal epithelia. However, the mechanisms for mediating such localized topological change remain poorly understood. In this study, we use a two-dimensional vertex model with consideration of mechanical forces to investigate how differential proliferation and forces can influence cell shape and tissue morphogenesis, and how they may lead to distorted topological change. We find that differential proliferation alone is insufficient to affect the topology of boundary proliferating cells. Rather, increased surface tension on the boundary, in addition to differential proliferation, can significantly decrease the average number of cell sides. Our results are consistent with experimental observations. We conclude that mechanical forces in addition to localized differential proliferation are required to produce the distorted topological change which significantly impacts the overall cell shape and tissue morphogenesis.
I. INTRODUCTION
Epithelia are sheets of cells that tightly adhere to each other on both internal and external surfaces in many metazoans and plant epidermis. Epithelial morphogenesis is a fundamental component of development, organogenesis, and disease progression [1]. Within the plane of an epithelial sheet, regulated cell shape (respected as polygons with different number of sides) is critical to the formation of tissues [2].
A. Mechanism for Distorted Topological Change
The observation that proliferating epithelia have a constant distribution of polygonal types was first made by Lewis in the cucumber cells[3]. Since then, the distributions of cellular polygons have been measured in a wide range of divergent organisms, both in animals and plants [4][5]. Almost identical distributions with a mean value of six sides have been observed for epithelial cells from different organisms.
However, Gibson et al. showed that a clone of rapidly proliferating cells bounded by quiescent cells of zero growth rate presented a significant shift in the distribution of polygonal types at the periphery, which had fewer sides than controls of normal proliferating cells (an average of 5.42 ± 0.14 sides compared with 5.94 ± 0.15)[4]. Does the reduced mean value of sides result from differential proliferation alone, or might other factors influence this topological change?
B. Previous Theoretical Studies
Gibson et al. [4][6] used a simple Markov model to test the distribution of polygonal types in epithelia. They predicted that localized deviations in the rate of cell proliferation led to distortion of local topology. It was found that within a tissue, homogeneous division rates will result in equilibrium between sides lost and gained. If a small region of cells proliferate faster than their neighbors, fast-dividing cells will lose more sides through division without gaining sides through the effect of neighboring divisions.
There are unresolved issues with such theoretical analysis, as there was no quantitative analysis on the effects of differential local proliferation employed in this Markov model, as the effects of inhomogeneous growth with localized disturbance were not implemented in this model. Furthermore, this model did not consider other biological and physical properties such as pressure and tension existing in a cell.
Aegerter-Wilmsen et al hypothesized that growth was also regulated by mechanical forces and developed a model incorporating mechanics for control of tissue size [7]. Hufnagel et al proposed a mechanical vertex model for size determination in which mechanical forces played a central role [8]. Aegerter-Wilmsen et al showed that mechanical feedback could help to release the mechanical stress and lead to all cells of the same type with similar growth rates [9].
C. Our Study
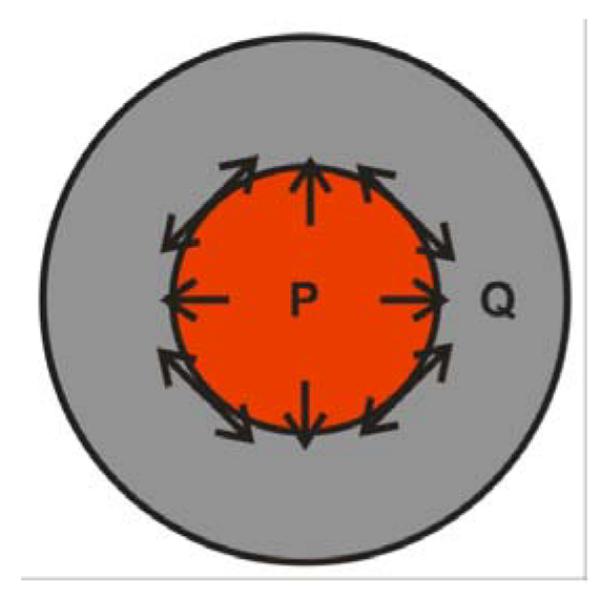
However, how mechanical forces affect the localized topological change in cells with differential proliferation is not known. Intuitively, internal proliferating cells grow outward, exerting pressure on the outside quiescent cells. On the other hand, outside quiescent cells tend to stay at their original positions, compressing the inner proliferating cells (Fig. 1). The surface tension on the boundary between the proliferating cells and the quiescent cells therefore increases.
Fig. 1.

Illustration of our model. Internal proliferating cells (red) grow outward, exerting pressure on the outside quiescent cells (gray). Outside quiescent cells tend to stay at their original positions, compressing the inner proliferating cells.
Here, we use a mechanical vertex model to study the distorted topological change. Unlike earlier studies, our model can generate inhomogeneous growth rates locally, enabling quantitative assessment of the change in cell topology. In addition, we have incorporated mechanical properties in our model, allowing more realistic studies of cell pattern formation. Our new model and simulation technique lead to new findings. We find that localized differential proliferation alone is insufficient to produce the distorted topological change. In contrast, increased surface tension on the boundary in conjunction with differential proliferation can significantly decrease the average number of sides, which is consistent with experiments. Our results suggest that the mechanical forces have a significant impact on the cell shape and tissue morphogenesis.
II. METHODS
A. Vertex Model
Epithelial monolayer can be represented as a two-dimensional sheet composed of contiguous, interacting cells. Here, we use a mechanical vertex model (previously developed in [10]) to investigate the impact of mechanical forces on localized topological changes. This model can represent the geometric properties of a single cell as well as topological properties of cells in a tissue. There are three geometric elements involved in the model: cell, edge, and vertex. Cell is a spatial region representing the volume of a biological cell. It is a disk in isolation, and a disk segment when at the boundary. When buried in the tissue interior, it is a polygon connected to neighboring cells. Cells may have different polygonal shapes and sizes. Edge is the cell boundary, modeled as a line segment when inside the tissue or an arc when on the boundary of the tissue. Vertex is the junction point of three edges, at which three cells intersect.
B. Mechanical Forces
Cell movement and rearrangement within an epithelial sheet depend on the mechanical forces existing in a cell. This corresponds to the ability of a cell to adhere to and exert forces on neighboring cells. The cellular cytoskeleton is responsible for providing these forces and maintaining the cell shape. The cytoskeleton generates two types of force in our model, tension and pressure.
-
1)
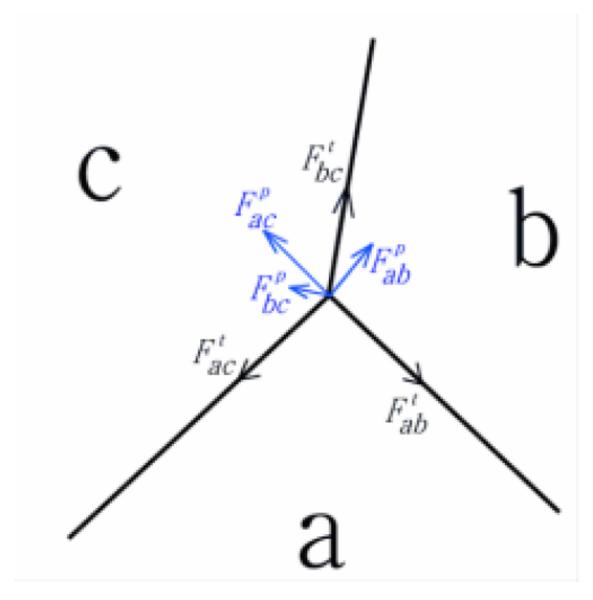
Tension:: Tension models the compressional forces acting on a cell. These forces arise from cytoskeletal microfilaments, intermediate filaments, and cell membrane. For an edge between cell a and b, tension in our model is always tangential to the edge ab (Fig. 2).
-
2)
Pressure:: Pressure represents the forces resisting compression. These forces arise mainly from microtubules and extracellular matrix. Pressure is proportional to the difference in pressure in cell a and b and the length of edge ab. Pressure in our model is normal to the edge ab (Fig. 2).
Fig. 2.

The forces at the junction vertex of three cells a, b and c. Tension is tangential to the edge (black). Pressure is normal to the edge (blue). The net force on the junction vertex is obtained by summing tension and pressure acting on the vertex.
C. Cell Growth Depends on the Balance of Tension and Pressure
The net force on a vertex is obtained by summing all the forces due to tension and pressure acting on the vertex (Fig. 2). This net force represents the amount of stress on a vertex at a specific time point. The net force over all vertices sums to zero. During the growth process, the forces acting on a vertex change due to the increase in area of the cell, resulting in a change in stress at the vertex. Non-zero net force drives a vertex to a new location. The cell shape changes with the vertex movements. Local rearrangements of vertices result in reduction of the stress, which lead the system to a lower stress state.
D. Cell Division
Cell division occurs when the size of the cell is doubled after certain steps of cell growth. The largest cleavage plane is selected based on the previous study [10]. A new edge is added that passes through the center of the mother cell, so the two daughter cells have half the size of the mother cell. Two new vertices are added at the two ending points of the new edge.
E. Simulation
We simulate the growing process of epithelial tissue based on our model following the procedure described below. We start with the tissue in equilibrium state with about 4000 cells (from [10]). We mutate inner part of the tissue so that the cells are rapidly proliferating. Peripheral cells are quiescent with the zero growth rate. The cells at the interface of proliferating cells and quiescent cells are named boundary cells (boundary proliferating cells, BP cells; boundary quiescent cells, BQ cells). At each time step, the system is relaxed to a state with minimized surface energy. After relaxation, we examine the geometric properties of the boundary cells. Different tensions were employed in the simulation to study the effect of mechanical forces. For each choice of tension, we run the simulation for 5 times and take the average as our results. C++ is used to implement our model.
III. RESULTS AND DISCUSSION
A. Differential Proliferation alone Does Not Affect the Topology of BP Cells Significantly
To investigate the effect of differential proliferation, we first only mutate inner part of the tissue so that the cells are rapidly proliferating. Peripheral cells are modeled as quiescent with zero growth rate. Effect of mechanical force is not incorporated at this stage. We set the tension on all boundaries as a constant θ.
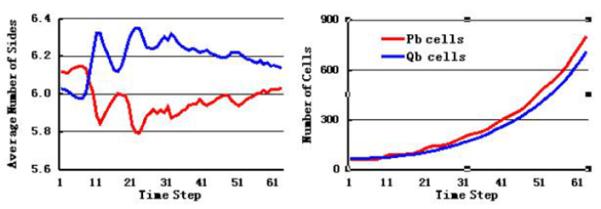
At the starting time of mutation, the number of BP cells is less than that of BQ cells. During the growth and division process, however, the number of BP cells increases beyond that of the BQ cells (Fig. 3, right). At the same time, the average number of sides of BP cells decreased, with a maximum change of −0.32, and average number of sides of BQ cells increases, with a maximum change of +0.32 (Fig. 3, left).
Fig. 3.

Simulation results of shapes and number of cells located on the boundary between quiescent cells and proliferating cells. Left, average number of sides of BP cells decreases (red), and the average number of sides of BQ cells increases (blue). Right, the number of BP cells increases beyond that of the BQ cells during the process of growth and division.
Our results obtained in a short time interval at the beginning of the simulation is consistent with the theoretical explanations of Gibson et al. [4][6]. That is, cells in a small region proliferate faster than their neighbors, and these fast-dividing cells lose more sides through division, as they will not gain sufficient new sides because their neighbors have slower division rate.
However, this effect is not significant after the simulation is allowed to run for a longer time interval when cells go through more realistic number of divisions. The maximum reduction in sidedness changes from 0.32 to about 0.08 after 3 or 4 generations of cell division (Fig. 3, left).
These results demonstrate that differential proliferation alone does not have a significant influence on the topology of BP cells and cannot produce the distorted topological change observed in experimental studies.
B. Increased Tension Produces Much Fewer Sides of BP Cells
There are other factors that may contribute to the significant distorted topological change of cell shape. It is likely that mechanical forces can influence the cell shape by decreasing the average number of cell sides. During growth and division in the interior of the tissue, proliferating cells grow outward, exerting pressure on the outside quiescent cells. Outside quiescent cells tend to stay at their original positions and compress the inner proliferating cells (Fig. 1). As a result, the surface tension on the boundary increases. We therefore explore the influence of mechanical forces during differential proliferation.
We introduce mechanical forces by setting the tension between the same type of cells to θ. We find that different θ values between the same type of cells do not change the local topology (data not shown). The tension on the boundary is set to 0.5θ, θ, 1.5θ, and 2θ, respectively.
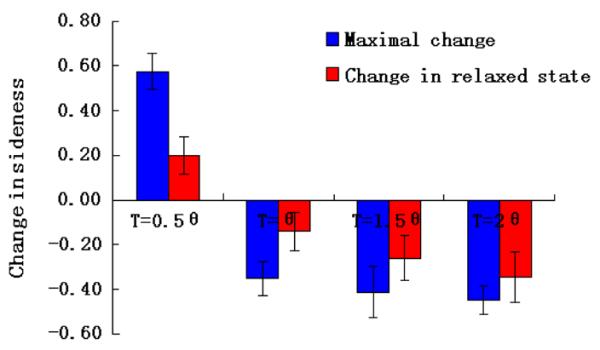
We find that when the tension on the boundary increases, the average number of sides of BP cells decreases more. For T = 1.5θ, the maximal reduction in the averaged number of sides is 0.41. For T = 2θ, this reduction further increases to 0.45 (Fig. 4).
Fig. 4.

Change in the average number of sides with different boundary tensions. Increased boundary tensions lead to further reduced average number of sides in BP cells (T = 1.5θ, 2θ). The extent of decrease of average number of sides is more stable with increased boundary tension. Decreasing boundary tension to 0.5θ results in increased average number of sides in BP cells.
Furthermore, at higher boundary tensions, the decreases in sidedness fluctuate much less with the time (or the number of cell divisions). After 3 or 4 cell divisions, the decrease in sidedness is 0.26 for T = 1.5θ. For T = 2θ, the final decrease is 0.34, which is larger than the maximal decrease (0.32) for cells with lower surface tension of T = θ. These results show that increased boundary tension can significantly affect topological change in BP cells.
Conversely, when we decrease the tension on the boundary to 0.5θ, even though the inner proliferating cells are growing and dividing as before, the average number of sides of BP cells increases with a maximal of 0.57 (Fig. 4). This result is opposite to the decreased average number of sides of BP cells which is observed in experiments. This demonstrates that, differential proliferation alone cannot lead to overall decrease in the average number of sides of BP cells. Rather, mechnical forces leading to increased boundary tension are likely to at play.
C. Comparison to Experimental Results
The results obtained from increased boundary tension is consistent with the experimental data from Gibson et al [4], where the decrease in the average number of sides was about 0.52. The difference between our simulation results (0.45) and experiments is probably partly due to small sample variation in the experimental study, in which the number of cells was small (295 cells in 24 clones), whereas simulation results are obtained from a starting population of about 4,000 cells.
The consistency between experimental data and simulation results indicates that models studying tissue morphogenesis should incorporate sufficient biological and physical properties and their impact on mechanical forces in the cell.
IV. CONCLUSION
We have used a mechanical vertex model to study the factors responsible for distorted topological change. Biologically, this model can generate differential proliferation locally, which is not possible with the previous model. In addition, it can quantitatively calculate the geometric and topological properties among cells. Physically, this model includes mechanical properties of a cell, which play an important role in cell shape and tissue morphogenesis. With this model, we find that localized differential proliferation alone is not sufficient to produce distorted topological change. Increased surface tension on the boundary with differential proliferation can significantly decrease the average number of sides, which is consistent with the experiments. This indicates that mechanical forces have a significant impact on the cell shape and tissue morphogenesis. Tissue morphogenesis should be studied with more detailed mechanical models rather than mathematical models, because mathematical models can only include limited biological and physical properties.
ACKNOWLEDGMENTS
We thank Drs. Kun Huang and Qing Nie for helpful discussions. Y.L. was supported by the China Scholarship Council. H.N. was supported by the Fulbright Fellowship and the Higher Education Commission of Pakistan.
This work was supported by National Institutes of Health Grants GM079804, GM081682, and GM086145; National Science Foundation grant DMS-0800257; and 985 phase II grant of Shanghai Jiao Tong University T226208001.
REFERENCES
- [1].Gibson WT, Gibson MC. “Cell Topology, Geometry, and Morphogenesis in Proliferating Epithelia”. Curr. Top. Dev. Biol. 2009;89:87–114. doi: 10.1016/S0070-2153(09)89004-2. [DOI] [PubMed] [Google Scholar]
- [2].Axelrod JD. “Cell Shape in Proliferating Epithelia: A Multifaceted Problem”. Cell. 2006;126:643–645. doi: 10.1016/j.cell.2006.07.018. [DOI] [PubMed] [Google Scholar]
- [3].Lewis FT. “The Correlation between Cell Division and the Shapes ad Sizes of Prismatic Cells in the Epidermis of Cucumis”. Anat. Rec. 1928;38:341–376. [Google Scholar]
- [4].Gibson MC, Patel AB, Nagpal R, Perrimon N. “The Emergence of Geometric Order in Proliferating Metazoan Epithelia”. Nature. 2006;442:1038–1041. doi: 10.1038/nature05014. [DOI] [PubMed] [Google Scholar]
- [5].Kron RW, Spalding RM. “The Geometry of Plant epidermal cells”. New Phytol. 1973;72:1357–1365. [Google Scholar]
- [6].Nagpal R, Patel A, Gibson MC. “Epithelial Topology”. BioEssays. 2008;30:260–266. doi: 10.1002/bies.20722. [DOI] [PubMed] [Google Scholar]
- [7].Aegerter-Wilmsen T, Aegerter CM, Hafen E, Basler K. “Model for the Regulation of Size in the Wing Imaginal Disc of Drosophila “. Mech. Dev. 2007;124:318–326. doi: 10.1016/j.mod.2006.12.005. [DOI] [PubMed] [Google Scholar]
- [8].Hufnagel L, Rouault AA, Cohen SM, Shraiman BI. “On the Mechanism of Wing Size Determination in Fly Development”. Proc. Nati. Acad. Sci. 2007;104:3835–3840. doi: 10.1073/pnas.0607134104. [DOI] [PMC free article] [PubMed] [Google Scholar]
- [9].Aegerter-Wilmsen, Smith AC, Christen AJ, Aegerter CM, Hafen E, Basler K. “Exploring the Effects of Mechanical Feedback on Epithelial Topology”. Development. 2010;137:499–506. doi: 10.1242/dev.041731. [DOI] [PubMed] [Google Scholar]
- [10].Naveed H, Li Y, Kachalo S, Liang J. “Geometric Order in Proliferating Epithelia: Impact of Rearrangements and Cleavage Plane Orientation”. Conf Proc IEEE Eng. Med. Biol. Soc. 2010:3808–3811. doi: 10.1109/IEMBS.2010.5627601. [DOI] [PMC free article] [PubMed] [Google Scholar]


