Abstract
Objective
To evaluate the value of apparent diffusion coefficient (ADC) histogram analysis for predicting tumor recurrence in patients with uterine cervical cancer treated with chemoradiation therapy (CRT).
Materials and Methods
Our institutional review board approved this retrospective study and waived informed consent from each patient. Forty-two patients (mean age, 56 ± 14 years) with biopsy-proven uterine cervical squamous cell carcinoma who underwent both pre-treatment pelvic magnetic resonance imaging with a 3.0 T magnetic resonance scanner and concurrent CRT were included. All patients were followed-up for more than 6 months (mean, 36.4 ± 11.9 months; range 9.0-52.8 months) after completion of CRT. Baseline ADC parameters (mean ADC, 25th percentile, 50th percentile, and 75th percentile ADC values) of tumors were calculated and compared between the recurrence and no recurrence groups.
Results
In the recurrence group, the mean ADC and 75th percentile ADC values of tumors were significantly higher than those of the no recurrence group (p = 0.043 and p = 0.008, respectively). In multivariate analysis, the 75th percentile ADC value of tumors was a significant predictor for tumor recurrence (p = 0.009; hazard ratio, 1.319). When the cut-off value of the 75th percentile ADC (0.936 × 10⁻³ mm2/sec) was used, the overall recurrence free survival rate above the cut-off value was significantly lower than that below the cut-off value (51.9% vs. 91.7%, p = 0.003, log-rank test).
Conclusion
Pre-CRT ADC histogram analysis may serve as a biomarker for predicting tumor recurrence in patients with uterine cervical cancer treated with CRT.
Keywords: Apparent diffusion coefficient, Diffusion-weighted magnetic resonance imaging, Tumor recurrence, Cervical cancer, Uterus
INTRODUCTION
Cervical cancer remains the second most prevalent female malignancy and the third most common cause of cancer-related deaths in women worldwide (1). With respect to the primary treatment for advanced cervical cancer, concurrent radiation therapy with cisplatin-based chemotherapy (CRT) has been widely accepted (2, 3). However, once treatment fails further treatment options become limited and result in poor outcome (4). If poor treatment response to CRT can be reliably predicted, this information could be effectively used in changing therapeutic strategies to avoid toxicity or negative side effects of ineffective therapy. Furthermore, if pretreatment imaging was able to identify patients at high risk for disease recurrence before CRT, better treatment could be accomplished by conducting more intensive follow-ups or considering a choice of clinical trials (5).
Diffusion-weighted magnetic resonance imaging (DWI) enables the noninvasive characterization of biological tissues based on the properties of water diffusion, which can provide microstructural information on the cellular level (6, 7). DWI has been applied to detect and characterize tumors using an apparent diffusion coefficient (ADC) value. The ADC value decreases with increasing cell density because water molecules are restricted in their movement, whereas it tends to increase in necrotic regions (8). In addition, ADC values have been used to quantify treatment-induced changes of tumors, which may occur before conventional morphologic alterations (5, 9). Along with the use of mean ADC, a histogram-based approach reported to have prognostic and predictive implications may be used to reflect the biologic heterogeneity of tumors by classifying portions with different diffusivities (10).
In uterine cervical cancer, DWI has been applied with a focus mainly on predicting and monitoring early response to CRT (11-17), although recent two studies have investigated the association between pre-treatment DWI and survival (18, 19). To our knowledge, the value of ADC histogram analysis for predicting tumor recurrence in uterine cervical cancer has not been fully addressed. The purpose of this study was to evaluate the value of pre-CRT ADC histogram analysis for predicting tumor recurrence in patients with uterine cervical cancer treated with CRT.
MATERIALS AND METHODS
Patients
Our institutional review board approved this retrospective study and waived informed consent from each patient. From June 2008 to December 2009, 168 consecutive women with uterine cervical cancer diagnosed by biopsy underwent pre-treatment baseline pelvic MRI. Of these, 126 patients were excluded from the study due to the following reasons: 63 patients had not received or completed CRT, pre-treatment DWI was not available for 38 patients, 22 patients were diagnosed as non-squamous cell carcinoma (SCC), two patients were confirmed to have para-aortic lymph node (LN) metastasis by surgical biopsy (n = 1) or 18F-fluorodeoxyglucose-positron emission tomography-computed tomography (FDG-PET-CT) (n = 1), and one Cancerpatient had a history of previous lymphoma. As a result, 42 consecutive patients (mean age ± SD, 56 ± 14 years; range, 28-82 years) were finally enrolled. Pre-treatment evaluation protocol for uterine cervical cancer in our institution followed the International Federation of Gynecology and Obstetrics (FIGO) guidelines and involved cross-sectional imaging studies including pelvic MRI and 18F-FDG-PET-CT. Patient characteristics are summarized in Table 1. FIGO stage of each patient was IB1 (n = 6), IB2 (n = 4), IIA (n = 2), IIB (n = 29), and IVA (n = 1). Six patients with FIGO stage IB1 underwent CRT instead of radical hysterectomy; three patients were over 80-years-of-age, two patients refused surgery, and one patient was confirmed to have pelvic LN metastasis by surgical biopsy. Maximal diameter of the tumor (MTD) and the status of pelvic LN were analyzed by one radiologist with more than 5 years of experience in body MRI. MTD was measured using an electronic caliper on axial and sagittal T2-weighted images where the cervical cancer was identifiable as a mass with high-signal intensity. The mean value of MTD was 4.7 cm (range, 2-9.3 cm). The radiologic criteria for pelvic LN metastasis was a short-axis diameter greater than 8 mm on pelvic MRI that was accompanied by focal FDG uptake higher than that of the surrounding tissue on 18F-FDG-PET-CT. As a result, 10 patients had pelvic LN metastasis, which was radiologically (n = 8) or pathologically (n = 2) confirmed.
Table 1.
Characteristics of Patients
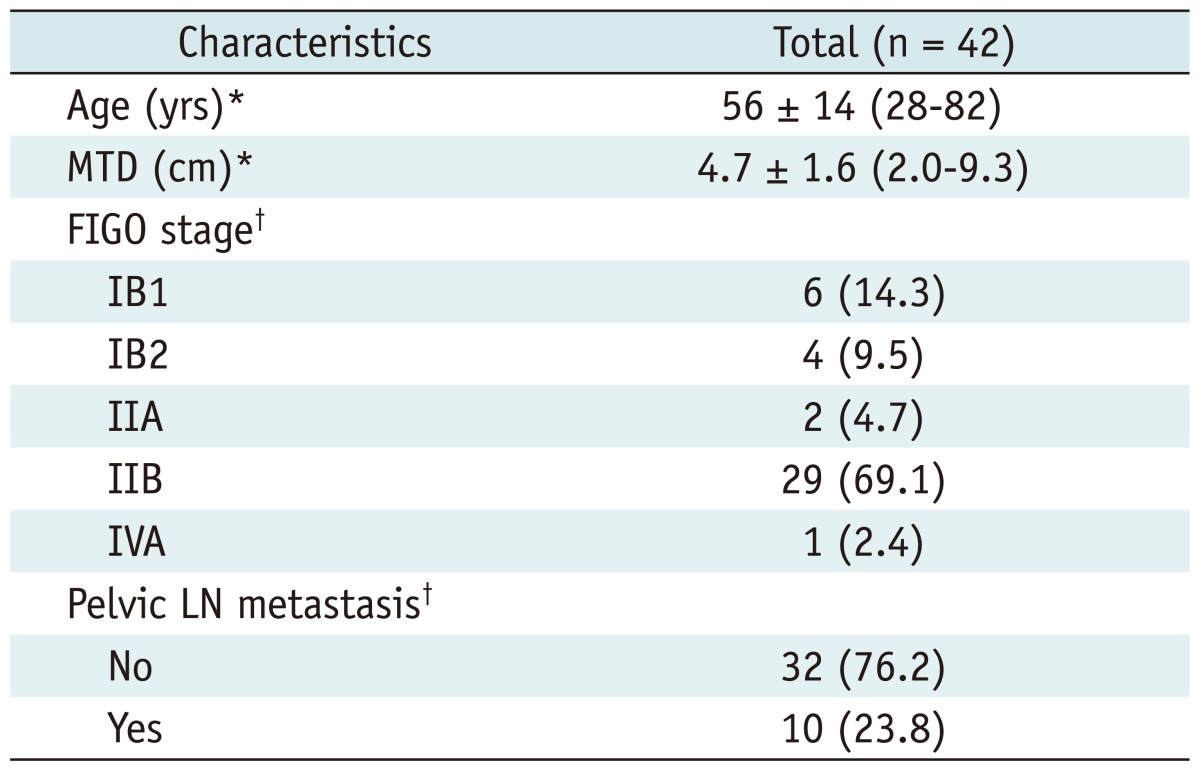
Note.- *Numbers outside parenthesis are average ± standard deviation. Numbers in parenthesis are range, †Numbers outside parenthesis are patients numbers. Numbers in parenthesis are percentage. FIGO = International Federation of Gynecology and Obstetrics, LN = lymph node, MTD = maximal tumor diameter
Concurrent CRT
Therapy comprised of standard radiotherapy (RT) in combination with concurrent weekly cisplatin-containing chemotherapy. RT consisted of external beam RT and intracavitary brachytherapy. External pelvic irradiation was delivered using a 10-MV linear accelerator in a daily fraction of 1.8 grays (Gy), 5 days a week, with a total dose of 45-54 Gy. Patients with pelvic LN metastasis routinely received a total radiation dose of 59.4 Gy or 63 Gy, with a booster dose of 5.4-9.0 Gy to the lateral pelvic wall. Brachytherapy was given using Ir 192 (Gamma-med I2i) with a total dose of 30 Gy to point A (2 cm above the distal end of the lowest cervix and 2 cm lateral to the midline) for 3 weeks with a fraction size of 5 Gy. The total time between the start and end of radiotherapy did not exceed 10 weeks. All patients received six courses of cisplatin-based chemotherapy (40 mg/m2) combined with radiotherapy.
MRI
All pre-CRT pelvic MRI was performed on a Magnetom TrioTim 3.0-T MR scanner (Siemens Medical Solution, Erlangen, Germany) within 2 weeks before CRT. The time interval between pelvic MRI and CRT ranged between 1 and 14 days (mean, 10 days). We used an axial T1-weighted spin-echo sequence (TR/TE, 0-671/10 msec; flip angle, 150°; section thickness, 5 mm; intersection gap, 0.5 mm; matrix, 448 × 252; field of view, 24 × 18-20 cm; number of excitation, 2) and axial and sagittal T2-weighted turbo spin-echo sequences (TR/TE, 3000-5000/80 msec; flip angle, 150°; section thickness, 5 mm; intersection gap, 0.5 mm; matrix, 448 × 252; field of view, 24 × 18-20 cm; number of excitation, 2-3). Gadolinium-enhanced T1-weighted volume interpolated gradient-echo (VIBE) with fat saturation was obtained in the axial, sagittal and coronal planes after the administration of 0.1 mmol/kg gadopentetate dimeglumine (Magnevist; Berlex Laboratories, Wayne, NJ, USA) with the following parameters: TR/TE, 3.5-5/1.4 msec; flip angle, 12.9°; section thickness, 3 mm; no intersection gap; matrix, 320 × 256; field of view, 24 × 24 cm; and number of excitation, 2.
Baseline DWI was obtained in the axial plane using a single-shot, spin-echo echo-planar with the chemical-shift selective fat-suppression technique, with the following parameters: TR/TE, 3000-3500/70-85 msec; section thickness, 5 mm; intersection gap, 1 mm; matrix, 192 × 128; field of view, 25 × 25 cm; number of excitation, 6; b values, 0, 500 and 1000 sec/mm2. Diffusion-weighting gradients were applied in all three orthogonal directions. The examination time for the acquisition of DWI was 3 min under normal respiration.
ADC Histogram Analysis
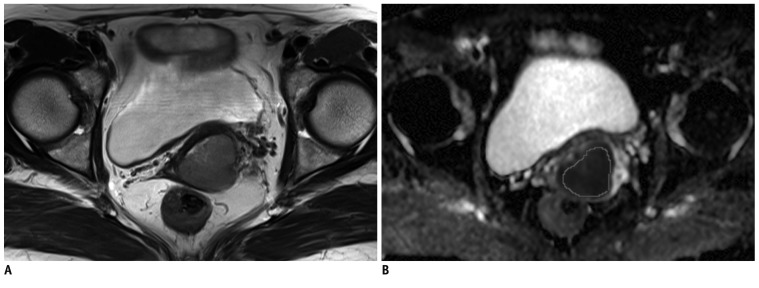
The ADC map was reconstructed on a pixel-by-pixel basis using the standard software on the console (Syngo, Siemens, Erlangen, Germany). ADC values were measured by one radiologist with more than 5 years of experience in pelvic MRI, who was blinded to clinical data. The observer evaluated both axial T2-weighted image and ADC map side-by-side and used a spatial cursor key to match the section level between axial T2-weighted image and ADC map. The tumor border was identified by visual evaluation on axial T2-weighted images. Regions of interest (ROIs) were manually drawn to include tumor as much as possible in all the slices of the ADC map that showed the tumor (Fig. 1). The mean size of ROIs was 650 mm2 (range, 104-3929 mm2). After the summation of pixel ADCs from all the slices that showed the tumor, several parameters were calculated through histogram analysis with commercially available software (NeuRoi, http://www.nottingham.ac.uk/scs/divisions/clinicalneurology/software/neuroi.aspx), which included mean ADC values (mADC), 25th percentile ADC (ADC25), 50th percentile ADC (ADC50) and 75th percentile ADC (ADC75) values.
Fig. 1.
Method of measurement of ADC values in uterine cervical cancer.
Tumor border is identified by visual evaluation on axial T2-weighted image (A). ROI is manually drawn to include tumor as much as possible on ADC map (B) at level corresponding to A. ADC = apparent diffusion coefficient, ROI = region of interest
Treatment Outcome Evaluation
Post-treatment surveillance consisted of follow-up visits every 3 months for the first 2 years and every 6 months after 2 years. General physical and pelvic examinations, Pap smear and serum tumor markers were performed at each visit. At 3 months after completion of CRT, follow-up pelvic MRI was routinely performed. Abdominopelvic CT or pelvic MRI or PET-CT scans were performed yearly. Clinical outcomes were classified into two groups (recurrence and no recurrence). Tumor recurrence was considered to be present in biopsy-proven or clinically diagnosed cases with an elevation of serum SCC antigen (normal range, 0-4.7 ng/mL) or serum carcinoembryonic antigen level (normal range, 0-1.5 ng/mL), accompanied by an increase in lesion size on the basis of Response Evaluation Criteria in Solid Tumors criteria (20). Any lesion that was newly detected on serial imaging studies was also considered as tumor recurrence. Recurrence patterns were divided into three types: 1) local relapse in the pelvic cavity within the radiation field, 2) distant metastasis outside the pelvis, and 3) local relapse combined with distant metastasis. Any patient who showed negative physical examination, negative tissue biopsy or negative imaging findings within the normal range of tumor markers after completion of CRT was classified into the no recurrence group.
Recurrence-free survival (RFS) was defined as the interval between the date of CRT completion and the date of tumor recurrence. RFS rate estimated the proportion of patients who were alive without any evidence of recurrence at a given time.
Statistical Analyses
The clinical variables and ADC values were compared between the tumor recurrence and no recurrence groups using Student's t test or chi-square test. Univariate and multivariate analyses of potential prognostic factors were performed using the Cox proportional hazards regression model. Variables that showed statistical significance (p < 0.1) in the univariate analysis were included in the multivariate analysis. A receiver operating characteristic (ROC) curve was used to determine the most clinically useful cut-off value of variables in predicting tumor recurrence. The differences in RFS rate according to the cut-off ADC value were evaluated using the Kaplan-Meier method with a log-rank test. All statistical analyses were performed using SPSS software version 20.0 (SPSS, Inc, Chicago, IL, USA). All reported p values were two-sided, and p values < 0.05 were considered statistically significant.
RESULTS
Clinical Characteristics
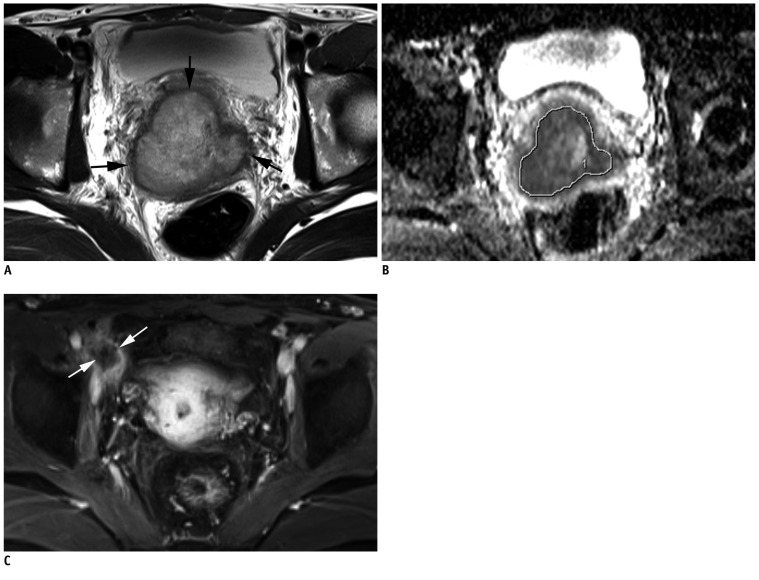
All patients were followed-up for more than 6 months after CRT completion, and the mean follow-up duration was 36.4 ± 11.9 months (range, 9.0-52.8 months). At the end of the follow-up period, tumor recurrence was observed in nine (21.4%) of 42 patients; six in the first year, one in the second year, and two in the third year after CRT. Of the nine patients with tumor recurrence, five (55.7%) patients showed local relapse in the pelvic cavity (Fig. 2). Distant metastasis was detected in three (33.3%) and both local relapse and distant metastasis in one (11.1%) patient. The 1-year, 2-year, 3-year, and 4-year RFS rates were 85.6%, 82.7%, 77.0%, and 77.0%, respectively.
Fig. 2.
Thirty-six-year-old woman with tumor recurrence after CRT for advanced uterine cervical cancer.
A. Pre-CRT axial T2-weighted image shows uterine cervical cancer (arrows) with left parametrial invasion (FIGO stage IIB). B. Pre-CRT ADC map depicts manually drawn ROI to include tumor as much as possible. ADC75 value of tumor was 1.078 × 10⁻³ mm2/sec. C. Gd-enhanced axial T1-weighted image obtained at 10 months after CRT completion demonstrates about 2 cm metastatic lymphadenopathy (arrows) in right external iliac chain (arrows). ADC = apparent diffusion coefficient, CRT = chemoradiation therapy, FIGO = International Federation of Gynecology and Obstetrics, ROI = region of interest
Table 2 shows patient characteristics in the recurrence and no recurrence groups. In the recurrence group, MTD were significantly higher than that of the no recurrence group (p = 0.034). Pelvic LN status was significantly different between the two groups (p = 0.023). Age and FIGO stage were not different between the two groups (p = 0.384 and p = 0.215, respectively).
Table 2.
Characteristics of Patients in Recurrence and No Recurrence Groups
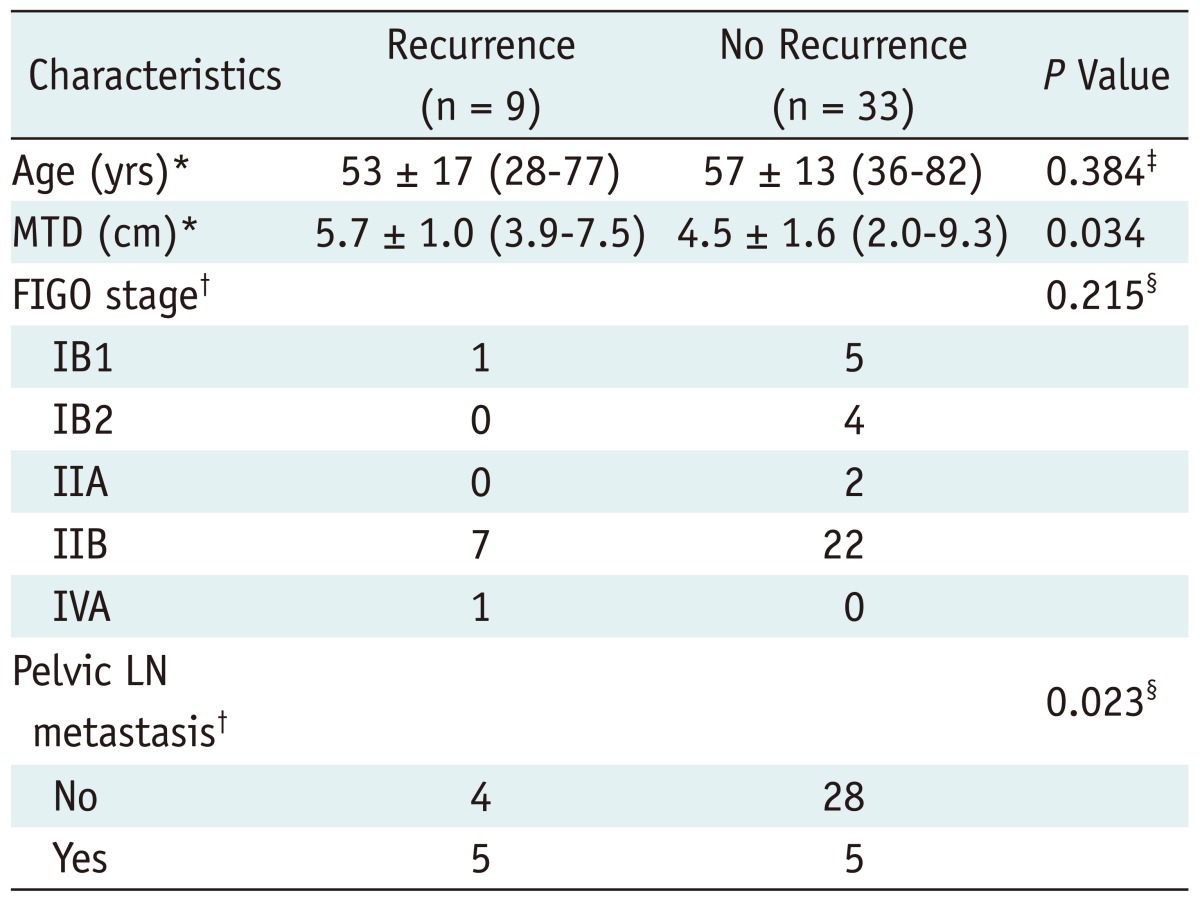
Note.- *Numbers outside parenthesis are average ± standard deviation. Numbers in parenthesis are range, †Numbers are patient numbers, ‡p value was derived using Student's t test, §p value was derived from chi-square test. FIGO = International Federation of Gynecology and Obstetrics, LN = lymph node, MTD = maximal tumor diameter
ADC Parameters
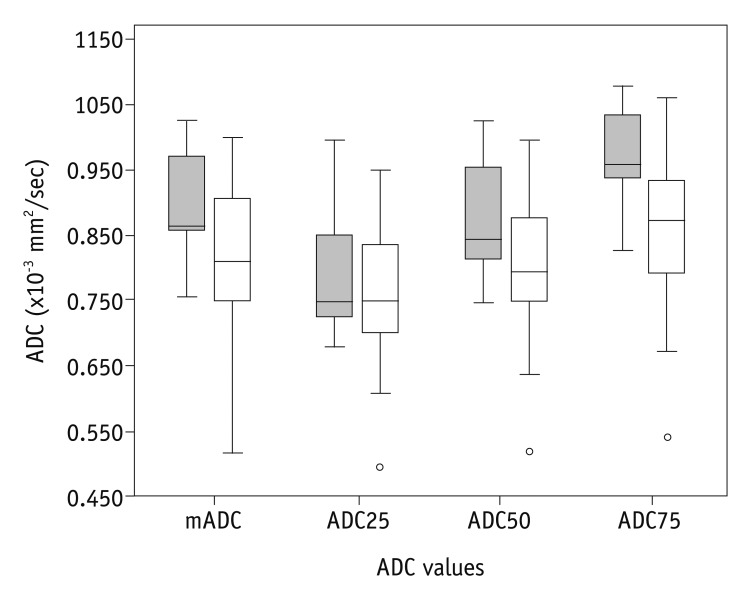
Table 3 and Figure 3 show the results of pre-CRT ADC parameters between the recurrence and no recurrence groups. Pre-CRT mADC values were 0.892 ± 0.090 × 10⁻³ mm2/sec (range 0.755-1.025 × 10⁻³ mm2/sec) and 0.811 ± 0.101 × 10⁻³ mm2/sec (range 0.517-0.999 × 10⁻³ mm2/sec) in the tumor recurrence and no recurrence groups, respectively. ADC75 values of the recurrence and no recurrence groups were 0.969 ± 0.100 × 10⁻³ mm2/sec (range 0.825-1.078 × 10⁻³ mm2/sec) and 0.859 ± 0.103 × 10⁻³ mm2/sec (range 0.541-1.061 × 10⁻³ mm2/sec), respectively. The values of mADC and ADC75 were significantly higher in the recurrence group as compared to the no recurrence group (p = 0.043 and p = 0.008, respectively).
Table 3.
ADC Parameters in Recurrence and No Recurrence Groups
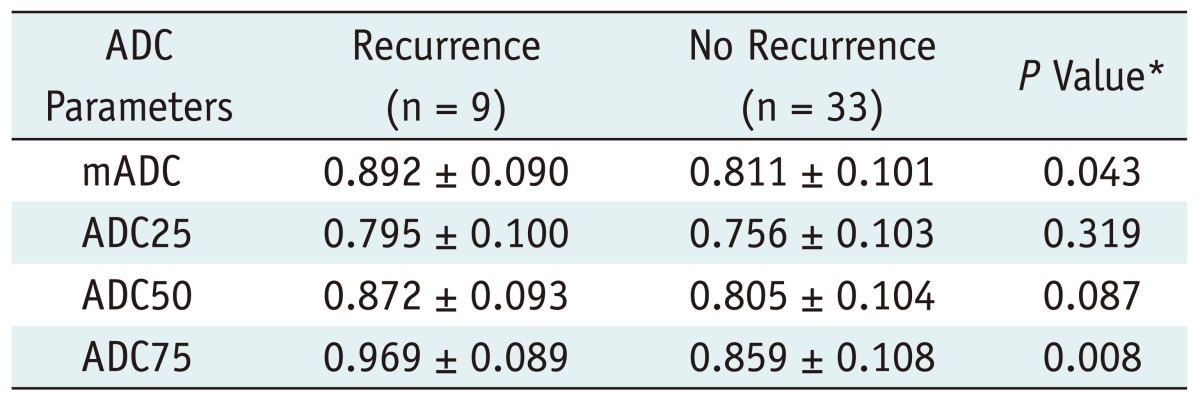
Note.- ADC indicates apparent diffusion coefficient (× 10-3 mm2/sec). Numbers are average ± standard deviation of ADC values. *P value was derived using Student's t test. ADC = apparent diffusion coefficient
Fig. 3.
Boxplots of ADC values of recurrence (shaded box) and no recurrence (open bar) group.
Despite substantial overlap between two groups, mADC and ADC75 in recurrence group are significantly higher than those of no recurrence group (p = 0.043 and p = 0.008, respectively). However, ADC25 and ADC50 are not significantly different between two groups (p = 0.087 and p = 0.319, respectively). ADC = apparent diffusion coefficient
However, the values of ADC25 and ADC50 were not significantly different between the recurrence and no recurrence groups, with 0.795 ± 0.100 and 0.756 ± 0.103 × 10⁻³ mm2/sec (p = 0.319), and 0.872 ± 0.093 and 0.805 ± 0.104 × 10⁻³ mm2/sec (p = 0.087), respectively.
Prognostic Significance of Variables for Predicting Tumor Recurrence
Clinical and ADC parameters were investigated with respect to tumor recurrence (Table 4). Univariate Cox regression analyses indicated that LN status and ADC75 of the tumor were significantly associated with tumor recurrence (p = 0.024 and p = 0.012; hazard ratio [HR], 4.543 and 1.099, respectively), whereas MTD, mADC, and ADC50 showed borderline significance (p = 0.055, p = 0.051 and p = 0.095, respectively). In the multivariate Cox analysis, ADC75 of the tumor was the most significant predictor for tumor recurrence (p = 0.009; HR, 1.319).
Table 4.
Significance of Variables for Predicting Tumor Recurrence
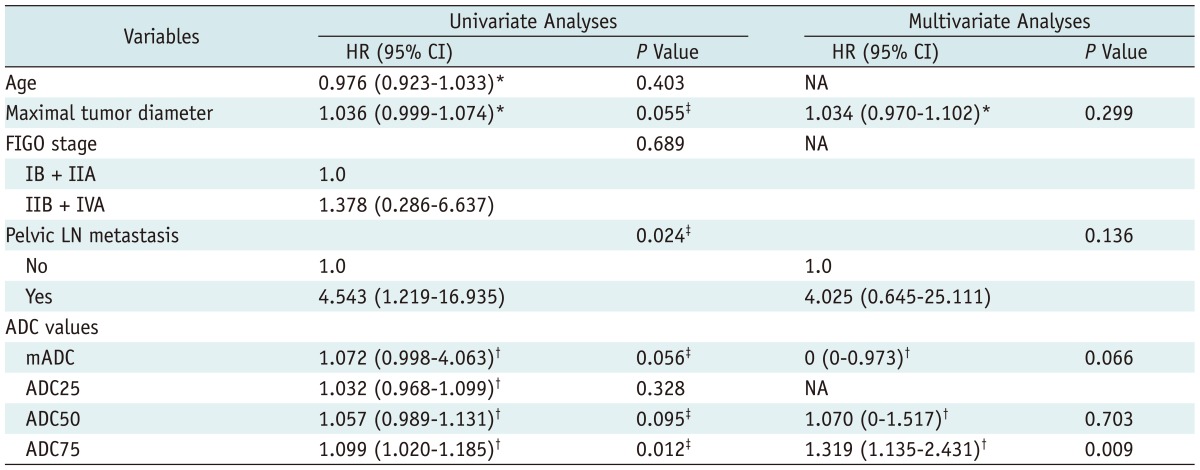
Note.- *For increase of 1 standard deviation, †For increase of 0.01 standard deviation, ‡Factors that showed statistical significance (p < 0.1) in univariate analyses were included in multivariate analyses. ADC = apparent diffusion coefficient, CI = confidence interval, FIGO = International Federation of Obstetrics and Gynecology, HR = hazard ratio, LN = lymph node, NA = not applicable
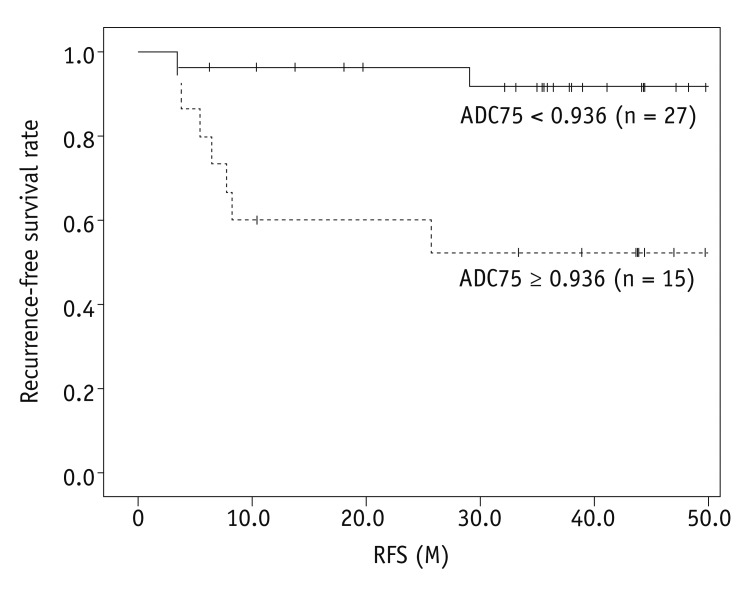
Receiver operating characteristic analysis revealed a high area under the curve for ADC75 (Az = 0.796; 95% CI, 0.636-0.958; p = 0.007). The cut-off value of ADC75 of 0.936 × 10⁻³ mm2/sec enabled differentiation between the recurrence and no recurrence groups with a sensitivity of 77.8%, a specificity of 75.8%, and an accuracy of 71.1% (Fig. 4). Of the nine patients with recurrence, seven patients showed ADC75 ≥ 0.936 × 10⁻³ mm2/sec and two patients showed ADC75 < 0.936 × 10⁻³ mm2/sec. Among 33 patients without recurrence, eight patients showed ADC75 ≥ 0.936 × 10⁻³ mm2/sec and the remaining 25 patients showed ADC75 < 0.936 × 10⁻³ mm2/sec. The overall RFS rate for patients with ADC75 ≥ 0.936 × 10⁻³ mm2/sec was significantly lower than that of patients with ADC75 < 0.936 × 10⁻³ mm2/sec (51.9% vs. 91.7%, p = 0.003, log-rank test) (Fig. 5).
Fig. 4.
ROC curve of ADC75 value for predicting tumor recurrence.
When cut-off value of ADC75 was 0.936 × 10⁻³ mm2/sec, sensitivity, specificity, and accuracy were 77.8%, 75.8% and 71.1%, respectively. Area under ROC curve (Az) is 0.796 (p = 0.007, 95% CI, 0.636-0.958). ADC = apparent diffusion coefficient, CI = confidence interval, ROC = receiver operating characteristic
Fig. 5.
Recurrence-free survival rate according to ADC75 value.
There is statistically significant difference in recurrence-free survival rate between patients with ADC75 ≥ 0.936 × 10⁻³ mm2/sec and ADC75 < 0.936 × 10⁻³ mm2/sec (51.9% vs. 91.7%, p = 0.003, log-rank test). ADC = apparent diffusion coefficient, RFS = recurrence-free survival
DISCUSSION
If the prediction of treatment response or outcome can be achieved before or during treatment, patients with cervical cancer may receive tailored management by, for example, adjusting treatment regimens or applying clinical trials. Tumor stage, LN status, bulky tumor size and histology are prognostic factors for cervical cancer (4). In our study, both MTD and the presence of pelvic LN metastasis were significantly different between the recurrence and no recurrence groups. While pelvic LN metastasis was determined as a significant factor in the univariate analysis, it was not associated with tumor recurrence in the multivariate analysis. Likewise, the predictive ability of various clinical factors seems to be limited because the efficacy of CRT and the pattern of disease progression generally rely on the biologic heterogeneity of the tumor.
Recently, various functional MR imaging techniques have been investigated for the purpose of assessing and monitoring tumor response before treatment (9). DWI is sensitive to the microscopic motion of water molecules. It allows for noninvasive characterization of biological tissues at the cellular or physiological level. DWI can provide information regarding the micro-environment, including cellularity and integrity of cellular membranes, and can be used to distinguish necrosis from solid portions as well as tumors from surrounding normal tissue by quantifying ADC values (8). In fact, it is assumed that the mean ADC value of tumor tissue may averagely reflect the morphologic heterogeneity including portions with increased cell density and necrotic portions of the tumor.
In uterine cervical cancer, DWI has been initially used to differentiate cervical cancer from normal cervical tissues. The mean ADC value of cervical cancer is significantly lower than that of normal cervix, possibly reflecting the increased cellular density of the cancerous lesion (11, 16, 17, 21). DWI combined with ADC mapping has been also investigated as a useful biomarker for assessing and monitoring early treatment response to CRT (5, 11-17, 21). However, whether the pre-CRT mean ADC value of cervical cancer could be a reliable predictor of tumor response to CRT has remained controversial. Liu et al. (14) reported that the pre-CRT mean ADC value of tumors with partial response was significantly higher than that of tumors with complete response in uterine cervical cancer. Similarly, the correlation between high pretreatment mean ADC values and unfavorable response was observed in other tumors such as metastatic hepatic tumor (22), breast (23), and rectal cancers (24). In contrast, although the pre-CRT mean ADC value of a tumor did not significantly correlate with tumor response, the mid-CRT ADC value or change of the ADC value during CRT, compared with pre-CRT, has been reported to be significantly correlated with treatment response (12, 13, 16, 25). Although the reason for this discrepancy remains unclear, one possible explanation is that the mean ADC value of the tumor tissue is likely to be mainly determined by cell density, not by its necrotic fraction (7, 26). Therefore, the necessity of ADC parameters other than mean ADC has been emphasized for more precise prediction of treatment response. Indeed, histogram-based analysis has been suggested to evaluate early therapeutic response and predict survival mostly in patients with brain tumors (27-30).
Cellular characteristics and hypoxia of tumors influence the tumor response to CRT and treatment outcome. Necrotic tumors are frequently hypoxic and poorly perfused, leading to diminished sensitivity and poor local control to CRT. Thus, necrotic tumors are prone to tumor progression and recurrence after CRT (31, 32). On DWI, although the mean ADC value of the tumor increases as tumoral necrosis progresses, it tends to be influenced more by the tumor portion with the highest cellularity. From this perspective, it was postulated that high percentile ADC values through histogram analysis could represent the regions with high necrotic fraction within the heterogeneous tumor and, in turn, be associated with poor clinical outcome in patients with uterine cervical cancer treated with CRT. In our study, both pre-CRT mean ADC and ADC75 values were significantly higher in the recurrence group than the no recurrence group. However, ADC75 of the tumor was the only significant predictor for tumor recurrence. In addition, higher ADC75 value (more than 0.936 × 10⁻³ mm2/sec) was associated with lower RFS rate. These results are comparable to previous studies (16, 33). Overall, in our study, the mean ADC values were lower than previous studies (16, 19, 25), which might be attributable to the differences in MR scanner used (1.5 T vs. 3 T), scan parameters for DWI and patient cohort with respect to the histological type.
Meanwhile, in uterine cervical cancer, the disease-free survival of patients with the lower mean or minimal ADC values was reported to be significantly shorter than the higher mean or minimal ADC values; maximal ADC values were not associated with disease-free survival (18). A recent prospective study of 20 patients with uterine cervical cancer treated with CRT (19) showed that there was no evidence of an association between survival and pre-treatment mean ADC. Although the reasons for this discrepancy or divergence of the relevance of various ADC parameters are uncertain, it could be partly explained by the following reasons: 1) the methods used to measure ADC values were different among studies. In our study, we used the largest ROI encompassing the entire tumor to reflect the morphologic heterogeneity of the tumor, whereas other studies measured ADC values using several small ROIs and/or a large ROI placed only on the solid portion of the tumor, while excluding necrotic areas. 2) Our study included only uterine cervical cancer, which was histologically diagnosed with SCC. Adenocarcinoma of the uterine cervix reportedly has less cellular density and/or more cystic components (16, 19). Thus, to exclude the effect on ADC values according to the histological type, only SCCs were included in our study.
This study has several limitations. First, the study population in our study was small. Second, the overall survival rate was not calculated and compared between the two groups because only two patients died during the follow-up period. Third, there may be an inherent selection bias due to the inclusion of only squamous cell carcinomas in our study. Fourth, six (14.3%) patients with FIGO stage IB1 were included in our study. Given that surgery is a widespread clinical practice for these patients, it could have affected the clinical outcome at endpoint. Fifth, we did not assess inter-observer variability or reproducibility of ADC parameters. However this could be justified based on a report that ADC measurements of the whole tumor volume before CRT showed excellent reproducible results (34). Sixth, we did not evaluate skew, kurtosis, and more percentile ADC parameters (e.g., 10th percentile or 90th percentile). Finally, although ADC values may be useful to determine cellularity and necrosis of tumors, many other factors may have an impact on water diffusion in biological tissues including integrity of the cell membrane, macromolecules, physicochemical properties (viscosity and temperature), and perfusion (35). However, the precise relationship between ADC parameters and the corresponding tumor architecture remains unclear. Therefore, further validation studies with a large cohort, long-term follow-up, and histopathological correlation are warranted.
In conclusion, our results reveal that ADC75 of the tumor is the most significant predictor for tumor recurrence. Therefore, pre-CRT ADC histogram analysis may provide effective information for predicting tumor recurrence, and could be used to identify high risk patients with uterine cervical cancer treated with CRT requiring more intensive follow-up.
Footnotes
This study was supported by a grant (CRI 11069-1) of the Chonnam National University Hospital Research Institute of Clinical Medicine.
References
- 1.Waggoner SE. Cervical cancer. Lancet. 2003;361:2217–2225. doi: 10.1016/S0140-6736(03)13778-6. [DOI] [PubMed] [Google Scholar]
- 2.Peters WA, 3rd, Liu PY, Barrett RJ, 2nd, Stock RJ, Monk BJ, Berek JS, et al. Concurrent chemotherapy and pelvic radiation therapy compared with pelvic radiation therapy alone as adjuvant therapy after radical surgery in high-risk early-stage cancer of the cervix. J Clin Oncol. 2000;18:1606–1613. doi: 10.1200/JCO.2000.18.8.1606. [DOI] [PubMed] [Google Scholar]
- 3.Thomas GM. Improved treatment for cervical cancer--concurrent chemotherapy and radiotherapy. N Engl J Med. 1999;340:1198–1200. doi: 10.1056/NEJM199904153401509. [DOI] [PubMed] [Google Scholar]
- 4.Kastritis E, Bamias A, Efstathiou E, Gika D, Bozas G, Zorzou P, et al. The outcome of advanced or recurrent non-squamous carcinoma of the uterine cervix after platinum-based combination chemotherapy. Gynecol Oncol. 2005;99:376–382. doi: 10.1016/j.ygyno.2005.06.024. [DOI] [PubMed] [Google Scholar]
- 5.Thoeny HC, Ross BD. Predicting and monitoring cancer treatment response with diffusion-weighted MRI. J Magn Reson Imaging. 2010;32:2–16. doi: 10.1002/jmri.22167. [DOI] [PMC free article] [PubMed] [Google Scholar]
- 6.Heo SH, Jeong YY, Shin SS, Kim JW, Lim HS, Lee JH, et al. Apparent diffusion coefficient value of diffusion-weighted imaging for hepatocellular carcinoma: correlation with the histologic differentiation and the expression of vascular endothelial growth factor. Korean J Radiol. 2010;11:295–303. doi: 10.3348/kjr.2010.11.3.295. [DOI] [PMC free article] [PubMed] [Google Scholar]
- 7.Lyng H, Haraldseth O, Rofstad EK. Measurement of cell density and necrotic fraction in human melanoma xenografts by diffusion weighted magnetic resonance imaging. Magn Reson Med. 2000;43:828–836. doi: 10.1002/1522-2594(200006)43:6<828::aid-mrm8>3.0.co;2-p. [DOI] [PubMed] [Google Scholar]
- 8.Koh DM, Collins DJ. Diffusion-weighted MRI in the body: applications and challenges in oncology. AJR Am J Roentgenol. 2007;188:1622–1635. doi: 10.2214/AJR.06.1403. [DOI] [PubMed] [Google Scholar]
- 9.Harry VN, Semple SI, Parkin DE, Gilbert FJ. Use of new imaging techniques to predict tumour response to therapy. Lancet Oncol. 2010;11:92–102. doi: 10.1016/S1470-2045(09)70190-1. [DOI] [PubMed] [Google Scholar]
- 10.Kyriazi S, Collins DJ, Messiou C, Pennert K, Davidson RL, Giles SL, et al. Metastatic ovarian and primary peritoneal cancer: assessing chemotherapy response with diffusion-weighted MR imaging--value of histogram analysis of apparent diffusion coefficients. Radiology. 2011;261:182–192. doi: 10.1148/radiol.11110577. [DOI] [PubMed] [Google Scholar]
- 11.Charles-Edwards EM, Messiou C, Morgan VA, De Silva SS, McWhinney NA, Katesmark M, et al. Diffusion-weighted imaging in cervical cancer with an endovaginal technique: potential value for improving tumor detection in stage Ia and Ib1 disease. Radiology. 2008;249:541–550. doi: 10.1148/radiol.2491072165. [DOI] [PubMed] [Google Scholar]
- 12.Harry VN, Semple SI, Gilbert FJ, Parkin DE. Diffusion-weighted magnetic resonance imaging in the early detection of response to chemoradiation in cervical cancer. Gynecol Oncol. 2008;111:213–220. doi: 10.1016/j.ygyno.2008.07.048. [DOI] [PubMed] [Google Scholar]
- 13.Kim HS, Kim CK, Park BK, Huh SJ, Kim B. Evaluation of therapeutic response to concurrent chemoradiotherapy in patients with cervical cancer using diffusion-weighted MR imaging. J Magn Reson Imaging. 2013;37:187–193. doi: 10.1002/jmri.23804. [DOI] [PubMed] [Google Scholar]
- 14.Liu Y, Bai R, Sun H, Liu H, Wang D. Diffusion-weighted magnetic resonance imaging of uterine cervical cancer. J Comput Assist Tomogr. 2009;33:858–862. doi: 10.1097/RCT.0b013e31819e93af. [DOI] [PubMed] [Google Scholar]
- 15.Liu Y, Bai R, Sun H, Liu H, Zhao X, Li Y. Diffusion-weighted imaging in predicting and monitoring the response of uterine cervical cancer to combined chemoradiation. Clin Radiol. 2009;64:1067–1074. doi: 10.1016/j.crad.2009.07.010. [DOI] [PubMed] [Google Scholar]
- 16.McVeigh PZ, Syed AM, Milosevic M, Fyles A, Haider MA. Diffusion-weighted MRI in cervical cancer. Eur Radiol. 2008;18:1058–1064. doi: 10.1007/s00330-007-0843-3. [DOI] [PubMed] [Google Scholar]
- 17.Naganawa S, Sato C, Kumada H, Ishigaki T, Miura S, Takizawa O. Apparent diffusion coefficient in cervical cancer of the uterus: comparison with the normal uterine cervix. Eur Radiol. 2005;15:71–78. doi: 10.1007/s00330-004-2529-4. [DOI] [PubMed] [Google Scholar]
- 18.Nakamura K, Joja I, Nagasaka T, Fukushima C, Kusumoto T, Seki N, et al. The mean apparent diffusion coefficient value (ADCmean) on primary cervical cancer is a predictive marker for disease recurrence. Gynecol Oncol. 2012;127:478–483. doi: 10.1016/j.ygyno.2012.07.123. [DOI] [PubMed] [Google Scholar]
- 19.Somoye G, Harry V, Semple S, Plataniotis G, Scott N, Gilbert FJ, et al. Early diffusion weighted magnetic resonance imaging can predict survival in women with locally advanced cancer of the cervix treated with combined chemo-radiation. Eur Radiol. 2012;22:2319–2327. doi: 10.1007/s00330-012-2496-0. [DOI] [PubMed] [Google Scholar]
- 20.Kang H, Lee HY, Lee KS, Kim JH. Imaging-based tumor treatment response evaluation: review of conventional, new, and emerging concepts. Korean J Radiol. 2012;13:371–390. doi: 10.3348/kjr.2012.13.4.371. [DOI] [PMC free article] [PubMed] [Google Scholar]
- 21.Payne GS, Schmidt M, Morgan VA, Giles S, Bridges J, Ind T, et al. Evaluation of magnetic resonance diffusion and spectroscopy measurements as predictive biomarkers in stage 1 cervical cancer. Gynecol Oncol. 2010;116:246–252. doi: 10.1016/j.ygyno.2009.09.044. [DOI] [PubMed] [Google Scholar]
- 22.Koh DM, Scurr E, Collins D, Kanber B, Norman A, Leach MO, et al. Predicting response of colorectal hepatic metastasis: value of pretreatment apparent diffusion coefficients. AJR Am J Roentgenol. 2007;188:1001–1008. doi: 10.2214/AJR.06.0601. [DOI] [PubMed] [Google Scholar]
- 23.Park SH, Moon WK, Cho N, Song IC, Chang JM, Park IA, et al. Diffusion-weighted MR imaging: pretreatment prediction of response to neoadjuvant chemotherapy in patients with breast cancer. Radiology. 2010;257:56–63. doi: 10.1148/radiol.10092021. [DOI] [PubMed] [Google Scholar]
- 24.Dzik-Jurasz A, Domenig C, George M, Wolber J, Padhani A, Brown G, et al. Diffusion MRI for prediction of response of rectal cancer to chemoradiation. Lancet. 2002;360:307–308. doi: 10.1016/S0140-6736(02)09520-X. [DOI] [PubMed] [Google Scholar]
- 25.Zhang Y, Chen JY, Xie CM, Mo YX, Liu XW, Liu Y, et al. Diffusion-weighted magnetic resonance imaging for prediction of response of advanced cervical cancer to chemoradiation. J Comput Assist Tomogr. 2011;35:102–107. doi: 10.1097/RCT.0b013e3181f6528b. [DOI] [PubMed] [Google Scholar]
- 26.Sugahara T, Korogi Y, Kochi M, Ikushima I, Shigematu Y, Hirai T, et al. Usefulness of diffusion-weighted MRI with echo-planar technique in the evaluation of cellularity in gliomas. J Magn Reson Imaging. 1999;9:53–60. doi: 10.1002/(sici)1522-2586(199901)9:1<53::aid-jmri7>3.0.co;2-2. [DOI] [PubMed] [Google Scholar]
- 27.Higano S, Yun X, Kumabe T, Watanabe M, Mugikura S, Umetsu A, et al. Malignant astrocytic tumors: clinical importance of apparent diffusion coefficient in prediction of grade and prognosis. Radiology. 2006;241:839–846. doi: 10.1148/radiol.2413051276. [DOI] [PubMed] [Google Scholar]
- 28.Murakami R, Hirai T, Sugahara T, Fukuoka H, Toya R, Nishimura S, et al. Grading astrocytic tumors by using apparent diffusion coefficient parameters: superiority of a one-versus two-parameter pilot method. Radiology. 2009;251:838–845. doi: 10.1148/radiol.2513080899. [DOI] [PubMed] [Google Scholar]
- 29.Pope WB, Kim HJ, Huo J, Alger J, Brown MS, Gjertson D, et al. Recurrent glioblastoma multiforme: ADC histogram analysis predicts response to bevacizumab treatment. Radiology. 2009;252:182–189. doi: 10.1148/radiol.2521081534. [DOI] [PubMed] [Google Scholar]
- 30.Barajas RF, Jr, Rubenstein JL, Chang JS, Hwang J, Cha S. Diffusion-weighted MR imaging derived apparent diffusion coefficient is predictive of clinical outcome in primary central nervous system lymphoma. AJNR Am J Neuroradiol. 2010;31:60–66. doi: 10.3174/ajnr.A1750. [DOI] [PMC free article] [PubMed] [Google Scholar]
- 31.Harrison LB, Chadha M, Hill RJ, Hu K, Shasha D. Impact of tumor hypoxia and anemia on radiation therapy outcomes. Oncologist. 2002;7:492–508. doi: 10.1634/theoncologist.7-6-492. [DOI] [PubMed] [Google Scholar]
- 32.Vaupel P, Mayer A. Hypoxia in cancer: significance and impact on clinical outcome. Cancer Metastasis Rev. 2007;26:225–239. doi: 10.1007/s10555-007-9055-1. [DOI] [PubMed] [Google Scholar]
- 33.DeVries AF, Kremser C, Hein PA, Griebel J, Krezcy A, Ofner D, et al. Tumor microcirculation and diffusion predict therapy outcome for primary rectal carcinoma. Int J Radiat Oncol Biol Phys. 2003;56:958–965. doi: 10.1016/s0360-3016(03)00208-6. [DOI] [PubMed] [Google Scholar]
- 34.Lambregts DM, Beets GL, Maas M, Curvo-Semedo L, Kessels AG, Thywissen T, et al. Tumour ADC measurements in rectal cancer: effect of ROI methods on ADC values and interobserver variability. Eur Radiol. 2011;21:2567–2574. doi: 10.1007/s00330-011-2220-5. [DOI] [PMC free article] [PubMed] [Google Scholar]
- 35.Schaefer PW, Grant PE, Gonzalez RG. Diffusion-weighted MR imaging of the brain. Radiology. 2000;217:331–345. doi: 10.1148/radiology.217.2.r00nv24331. [DOI] [PubMed] [Google Scholar]


