

Abstract
Whole genome sequencing of 616 asymptomatically carried pneumococci was used to study the impact of the 7-valent pneumococcal conjugate vaccine. Comparison of closely related isolates revealed the role of transformation in facilitating capsule switching to non-vaccine serotypes and the emergence of drug resistance. However, such recombination was found to occur at significantly different rates across the species, and the evolution of the population was primarily driven by changes in the frequency of distinct genotypes extant pre-vaccine. These alterations resulted in little overall effect on accessory genome composition at the population level, contrasting with the fall in pneumococcal disease rates after the vaccine’s introduction.
Streptococcus pneumoniae is a human nasopharyngeal commensal and respiratory pathogen that represents a major cause of pneumonia, bacteraemia and meningitis. The bacterium’s best-characterised virulence factor is its polysaccharide capsule, of which there are more than ninety serologically distinct variants (serotypes) that are associated with markedly different characteristics1. These may be categorized into serogroups, defined as sets of serotypes that cross-react with common antisera: for instance, serogroup 23 comprises serotypes 23F, 23A and 23B. Such serology forms the basis of much pneumococcal epidemiology, and the capsule is also the target of all licensed vaccine formulations.
In 2000, the polysaccharide-protein conjugate vaccine (PCV7) was introduced for routine immunization of children in the USA. This contained antigens designed to protect against seven pneumococcal serotypes (vaccine types, VTs): 4, 6B, 9V, 14, 18C, 19F and 23F. It was anticipated that this would also provide some cross protection against the vaccine related serotypes (VRTs) within the same serogroups as these seven targets. Since PCV7’s introduction, invasive pneumococcal disease (IPD) caused by VTs has declined significantly across the USA2, accompanied by a smaller rise in disease caused by non-VT, including VRT, pneumococci3–6. Surveillance in Massachusetts has monitored the contemporaneous changes in the asymptomatically carried population. Surveys of over 600 children in each of the winters of 2000–2001, 2003–2004 and 2006–2007 found that between 23% and 30% of children carried pneumococci, with no evidence of a decline in carriage prevalence following the introduction of PCV77–9. This reflected an increase in the prevalence of non-VT pneumococci as the VT strains were gradually eliminated. Nevertheless, by 2003 the rate of IPD in children under five in the state declined by 69% relative to the pre-vaccine incidence10, with VRT 19A and non-VT 7F emerging as the dominant IPD serotypes post-PCV711,12. This reduction in disease incidence, while carriage remained nearly unchanged, suggests that the NVT that dominated carriage post-PCV7 were, on average, less invasive than those VT that they replaced11,12. Patterns of antibiotic resistance were also observed to change13,14; for instance, several of the epidemic multidrug-resistant clones identified by the Pneumococcal Molecular Epidemiology Network15 (PMEN) predominately express VT and have consequently declined in frequency since in the introduction of the vaccine.
These substantial alterations to the pneumococcal population resulting from the selective pressure of PCV7 might be expected to impact genetic diversity across the chromosome, akin to the ‘periodic selection’ expected in a genetically monomorphic bacterium16. However, the ability of the pneumococcus to recombine by natural transformation suggests successful lineages that were mainly VT before PCV7 may persist through variants that have acquired non-VT capsules, a process called serotype or capsule switching17 that has been observed throughout the history of the pneumococcus18,19. To better understand the interplay of clonal replacement and adaptation through recombination in the population’s response to vaccination, whole genome sequencing was performed on carriage isolates obtained from Massachusetts children between 2000 and 2007.
Results
Population structure of isolates
A total of 616 isolates were used in this analysis: 133 from 2001, 203 from 2004 and 280 from 2007 (Supplementary Table 1). In terms of their serotype distribution, these populations represent the pneumococcal community at the point at which PCV7 was introduced, a community with increased diversity following the introduction of the vaccine, and a return to equilibrium, respectively20. De novo genome assembly produced sequences ranging in length from 1.98 Mb to 2.19 Mb (Supplementary Figure 1). The 1,231,516 putative protein coding sequences (CDSs) extracted from these assemblies were grouped into 5,442 clusters of orthologous genes (COGs). The prevalence of these COGs within the population followed a U-shaped distribution (Supplementary Figure 2), similar to that calculated using a smaller set of pneumococcal genomes generated using older technologies19.
A total of 1,194 COGs were present in a single copy in all genomes, and therefore defined as ‘core’. These were used to generate a 1.14 Mb codon alignment, containing 106,196 polymorphic sites, upon which phylogenetic and population clustering analyses were based (Figure 1). This approach identified fifteen sequence clusters (SCs) corresponding to clades within the tree, ranging in size from 10 to 98 isolates, with a sixteenth group constituting a polyphyletic cluster of the remaining low frequency genotypes. All of the monophyletic sequence clusters showed a high level of consistency with previous genotyping (multilocus sequence typing, MLST; Supplementary Figure 3)14,21. The tree was rooted on the longest branch, separating a diverse lineage of unencapsulated strains (SC12) from the rest of the population. The genotypes in this outgroup, previously associated with outbreaks of conjunctivitis using MLST data22, are clearly distinct from both the other sequence clusters and S. pseudopneumoniae when placed in the context of other mitis group streptococci (Supplementary Figure 4). In contrast, other unencapsulated strains in the collection appear to reflect sporadic loss of capsule (Supplementary Table 2).
Figure 1.
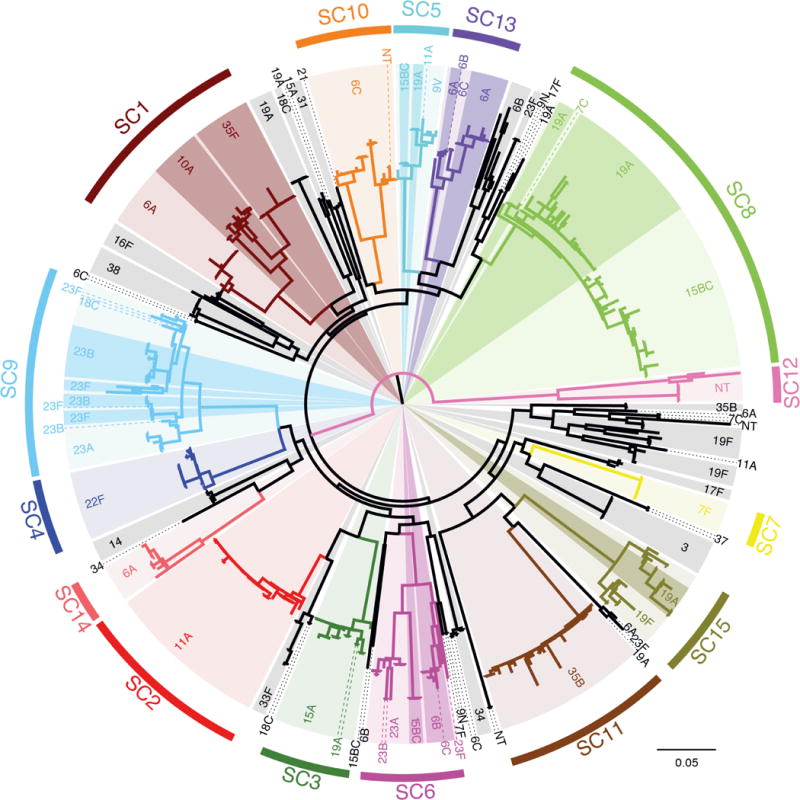
Structure of the pneumococcal population. The maximum likelihood phylogeny was generated using 106,196 polymorphic sites within a 1.14 Mb codon alignment of 1,194 ‘core’ COGs. The coloring of this phylogeny represents the sequence clusters (SCs) defined using the same alignment: fifteen monophyletic sequence clusters are labeled, with the terminal branches of the tree colored black indicating taxa that constitute a sixteenth polyphyletic group. Within the monophyletic sequence clusters, light background shading indicates one particular serotype, with darker shading and dashed lines used to indicate groups of isolates of alternative serotypes.
Diversification within sequence clusters
To reconstruct the recent evolutionary history of the population, whole genome alignments were generated for each sequence cluster through mapping sequence reads for each isolate against a common reference assembly. Horizontally acquired variation was then identified using previously described methods23 (Supplementary Figure 5–Supplementary Figure 19). This approach allows the calculation of the net rate at which polymorphisms are accumulated through import of sequence from other lineages via transformation relative to the mutation rate (r/m) for each SC. The estimates for this r/m parameter range from 0.06 (SC7, comprising serotype 7F isolates) to 34.06 (SC15, the multidrug-resistant PMEN14 lineage15). When representing the behavior of each sequence cluster by the distribution of statistics derived from each branch of the relevant phylogeny, the differences between sequence clusters are found to be significant whether comparing per site r/m (Kruskal-Wallis test, χ2 = 45.71, df = 14, p = 3.97×10⁻⁵) or the ratio of homologous recombination events relative to point mutations (χ2 = 54.6, p = 9.96 × 10⁻⁷). Correspondingly, the distributions of detected transformation event lengths are consistent between sequence clusters (Supplementary Figure 20).
The range of isolation dates was used to establish a molecular clock. Fitting an evolutionary model to four sequence clusters that showed evidence of genetic divergence over time (Supplementary Figure 21) yielded independent estimates of the point mutation rate (Supplementary Figure 22). The consensus rate of 1.0×10⁻⁶–1.5×10⁻⁶ mutations per base per year is similar to that calculated using a global collection of strains23. This indicates there is little variation in the substitution rate across the species, with isolates accumulating two or three polymorphisms each year. Given the number of observed transformation events and point mutations within each SC, this implies a variable net rate of sequence import into the sequence clusters: around one transformation event every six to nine years for SC2 isolates, compared with every one to two years for SC15 isolates.
Serotype switching and replacement
Transformation plays an important role in facilitating the process of serotype switching (Figure 2). SC15 provides a simple example of switching leading to vaccine escape, previously inferred from MLST24, with a single transformation event at the capsule biosynthesis (cps) locus leading to the emergence of 19A variants (Supplementary Figure 19). These are absent in the 2001 sample, but comprise 80% of the SC15 isolates in 2007. The most recent common ancestor of these 19A strains is predicted to have existed in 1997 (95% credibility interval 1984–2001). As the acquisition of a 19A capsule by SC15 must have preceded this most recent common ancestor, it seems likely the emergence of SC15-serotype 19A represents an increase in frequency of a variant already extant pre-PCV7.
Figure 2.
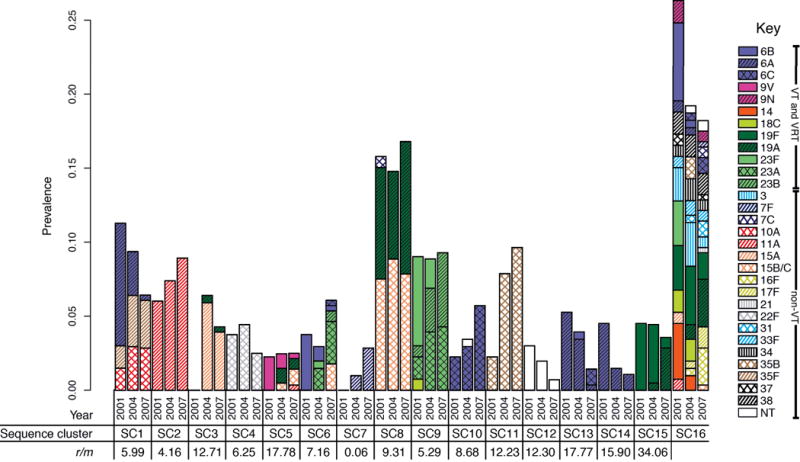
Dynamics of the carried pneumococcal population. The proportion of the population constituted by each of the sequence clusters in the three collection periods is plotted as adjacent bars. Each bar is split according to the serotype composition of the sequence cluster in each year; VT capsule types are represented by solid fill, VRT are represented by solid fill (of the color of the VT of the same serogroup) overlaid with black hatching and non-VT are represented by colored hatched patterns on a white background. Underneath the chart, the per site r/m statistic for the fifteen monophyletic clades is displayed, as calculated from the analyses displayed in Supplementary Figure 5–Supplementary Figure 19.
The emergence of 19A variants within SC15 represents the smallest genetic distance between isolates with different capsule types within a monophyletic sequence cluster; all other cases of ‘switching’ involve more distinct genotypes that, by implication of the observed molecular clock, share a common ancestor more distantly in the past. Hence there is no evidence for serotype switching events occurring post-PCV7. Instead, selection from variation in the pre-vaccine population by PCV7 appears to be more common: a clear example can be observed within SC9 (Figure 3). Two-thirds of the group expressed the VT 23F capsule in 2001, declining to an undetectable level in 2007. Instead, all representatives of the sequence cluster were VRT serotypes 23A and 23B, which have lower odds ratios for causing IPD than 23F in Massachusetts11, thereby likely contributing to the fall in IPD rates. However, the original serotype of SC9 is reconstructed as being 23A; in the pre-PCV7 era the 23F variants, generated through three independent transformations, appear to have been the most successful. PCV7 reverses this trend as the 23A isolates, in parallel with the 23B strains formed by a further three separate switches within the phylogeny, appear to fill the niche vacated by the eliminated 23F isolates. Hence the vaccine caused no change in the prevalence of SC9, nor did it reduce the diversity of the SC. Apparent serotype switching that actually reflects the emergence of deep-branching sister taxa is also observed in SC1 and SC6 (Figure 1). By contrast, in the multidrug-resistant SC5 (Supplementary Figure 9) and SC15 (Supplementary Figure 19) genotypes, the emergence of serotype 19A variants involves a recent bottleneck constraining post-PCV7 diversity, mirroring what was observed in PMEN123.
Figure 3.
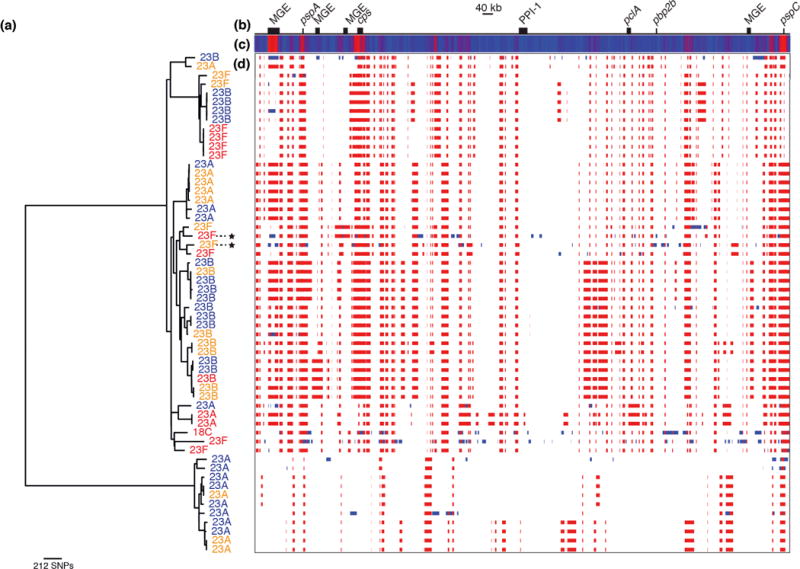
Serotype dynamics of SC9. (a) Maximum likelihood phylogeny of SC9 based on point mutations, excluding polymorphisms introduced through the horizontal import of sequence. Taxa are labeled with their serotype: all have a serogroup 23 capsule, with the exception of a single serotype 18C isolate. The taxa are colored according to their year of isolation: red taxa are from 2001, orange taxa were isolated in 2004, and blue indicates isolates from 2007. Two taxa that developed high-level beta lactam resistance are marked with stars. The right side of the figure shows the putative recombination events detected acrss the genome alignment. (b) A simplified annotation of the SC9 reference genome. (c) A heatmap showing the density of recombination events across the genome, with blue indicating regions undergoing few, or no, recombinations, while red indicates loci undergoing high rates of recombination. The highest levels are observed at a putative mobile genetic element (MGE), in the regions encoding the protein antigens PspA and PspC, and at the capsule biosynthesis cluster (cps). (d) This panel displays the position of the putative recombination events relative to the genome annotation, with a row for each taxon in the tree. Each detected recombination event is indicated by a red block, if reconstructed as occurring on an internal branch and therefore shared by multiple taxa through common descent, or blue block, if occurring on a terminal branch and therefore unique to a single taxon.
Notwithstanding the substantial turnover of lineages within the population, the effect of vaccination on the frequencies of individual COGs was modest (Figure 4; Supplementary Figure 23). The composition of the accessory genome is generally stable throughout the sampling period. The exceptions are four COGs involved in the synthesis of serogroup 6 capsules: one represents the wciN gene characteristic of serotypes 6A and 6B, both affected by immunity induced by PCV725. The other three are COGs found in serotype 6C, as well as type 6A and 6B, and therefore do not drop in frequency to the same extent. As the biosynthetic genes for the VT capsules 14, 19F and 23F all fall into COGs also required for the production of the non-VT capsules 15B/C, 19A and 23B, respectively (with the exception of lrp, unique to the capsule locus of serotype 1426, of which only six representatives were assembled), PCV7 has little impact even on the prevalence of COGs involved in capsule synthesis. However, an effect can be detected by quantifying the diversity within each COG: four COGs found in both the serotype 14 and serogroup 15 biosynthetic loci drop in diversity in 2007, as serotype 14 is eliminated (Supplementary Figure 24). By contrast, three COGs shared between serogroups 15 and 23 increase in diversity as 23F is replaced by 23A and 23B, and 15A rises in prevalence post-PCV7. Once more, the impact of the vaccine on most other COGs is small.
Figure 4.
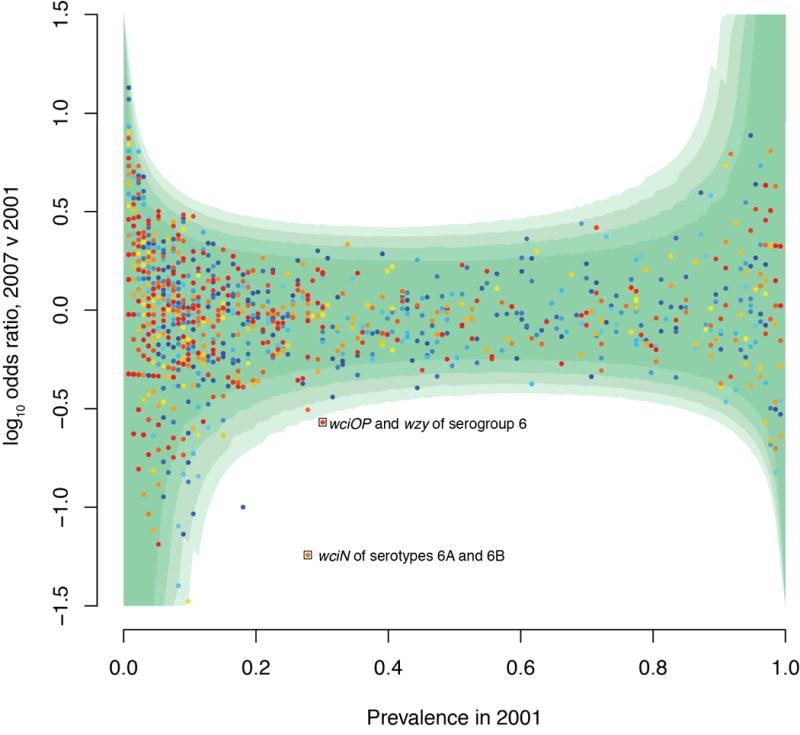
Alteration in COG frequency between 2001 and 2007. The logarithm of the odds ratio indicating the proportion of isolates carrying each COG in 2007 relative to 2001 is displayed relative to the prevalence of the COG in 2001. Points are colored according to the mean length of the member proteins, ranging from red (for longer sequences) to blue (for shorter sequences). The four contours of green shading indicate the positions of the critical values for significance at confidence intervals of 99.999%, 99.99%, 99.9% and 99% with increasing intensity. The two labelled points lying outside all these confidence intervals are involved in synthesis of the serogroup 6 capsules; the other, blue, point is a false positive that appears to have been introduced through differences in the assembly of data from 2001 (75 nt reads) and 2007 (100 nt reads).
Alterations in antibiotic resistance
Another set of COGs persisting at an intermediate frequency are antibiotic resistance determinants. Levels of susceptibility to many antibiotics remained stable in Massachusetts after the introduction of PCV77,9, despite VT serotypes being strongly associated with multidrug resistance in the USA pre-PCV727,28 and a decline in the dispensing of antibiotics to children in Massachusetts over the sampled period29. For instance, tetracycline resistance is typically caused by the tetM gene carried on the Tn916 transposon30 in S. pneumoniae (Figure 5A). The persistence of this gene can be partially attributed to its association with SC15, which changes little in frequency over time. Additionally, the loss of the tetracycline-resistant PMEN1 and PMEN15 lineages by 2007 is offset by the emergence of SC3, which also carries this transposon, from 2004 onwards.
Figure 5.
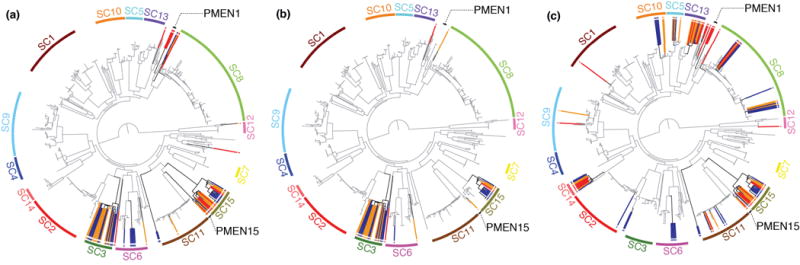
Distribution of antibiotic resistance genes. The maximum likelihood phylogeny, annotated as displayed in Figure 1, is emboldened where resistance genes are present and lightly shaded where they are absent. Taxa containing the resistance genes are linked to a colored point at the edge of the tree by a radiating line that is red for isolates from 2001, orange for isolates from 2004, and blue for isolates from 2007. In addition to the sequence clusters, the multidrug-resistant PMEN1 and PMEN15 lineages are labeled. (a) shows the distribution of the tetM tetracycline resistance gene. (b) shows the distribution of the ermB macrolide resistance gene. (c) shows the distribution of the mef gene.
Macrolide resistance is similarly stable, although the causative mechanisms shift over time. The two resistance determinants common in pneumococci are the ermB rRNA methylase gene and the mel/mef efflux pump. The former is carried either by Tn917 or Omega resistance cassettes23,31, both of which are only found inserted into Tn916 in this population. This means the population of ermB-carrying isolates are a subset of those that are tetracycline resistant (with the exception of isolate R34–3037, in which the tetM gene is disrupted by a frameshift mutation); this mechanism also causes cross-resistance to streptogramin and lincosamide antibiotics. By contrast, the macrolide-specific mel/mef pump is carried by the Mega element that can insert into Tn916, or be acquired elsewhere in the chromosome through transformation32. As a consequence of the distribution of Tn916, ermB shows a more stable association with clades, rising in prevalence as it is carried by SC3 and the serotype 19A isolates of SC15 (Figure 5B; Supplementary Figure 25). The Mega cassette falls in prevalence owing to its stable association with SC13 and SC14, which drop in frequency post-PCV, and SC15 (Figure 5C). However, it also appears in other monophyletic sequence clusters: five acquisitions are detected within SC11 and seven within SC8. Such a dispersed distribution ensures it will be difficult to eliminate such a resistance element using partial coverage vaccines targeting the capsule.
The sequences determining beta lactam resistance also alter post-PCV7. In S. pneumoniae, beta lactam susceptibility is determined by the sequences of three penicillin binding protein genes: pbp2x and pbp1a, found either side of the cps locus, and pbp2b, at an unlinked position in the genome33. Based on pre-2008 resistance breakpoints34, post-PCV7 penicillin non-susceptibility in Massachusetts was found to be stable, while ceftriaxone resistance fell significantly8,9. MICs to both drugs are correlated across the sample, with a strain’s ceftriaxone MIC typically lower than that for benzylpenicillin (Supplementary Figure 26). Hence this apparent differential response to these antibiotics reflects an underlying trend in which the most nonsusceptible strains are replaced by those displaying a lower level of resistance, and therefore meet the threshold MIC for penicillin, but not ceftriaxone, resistance. To understand these changes, COGs corresponding to pbp1a, pbp2x and pbp2b were extracted from all taxa and the sequences clustered into alleles, some of which appear to be mosaic (Figure 6).
Figure 6.
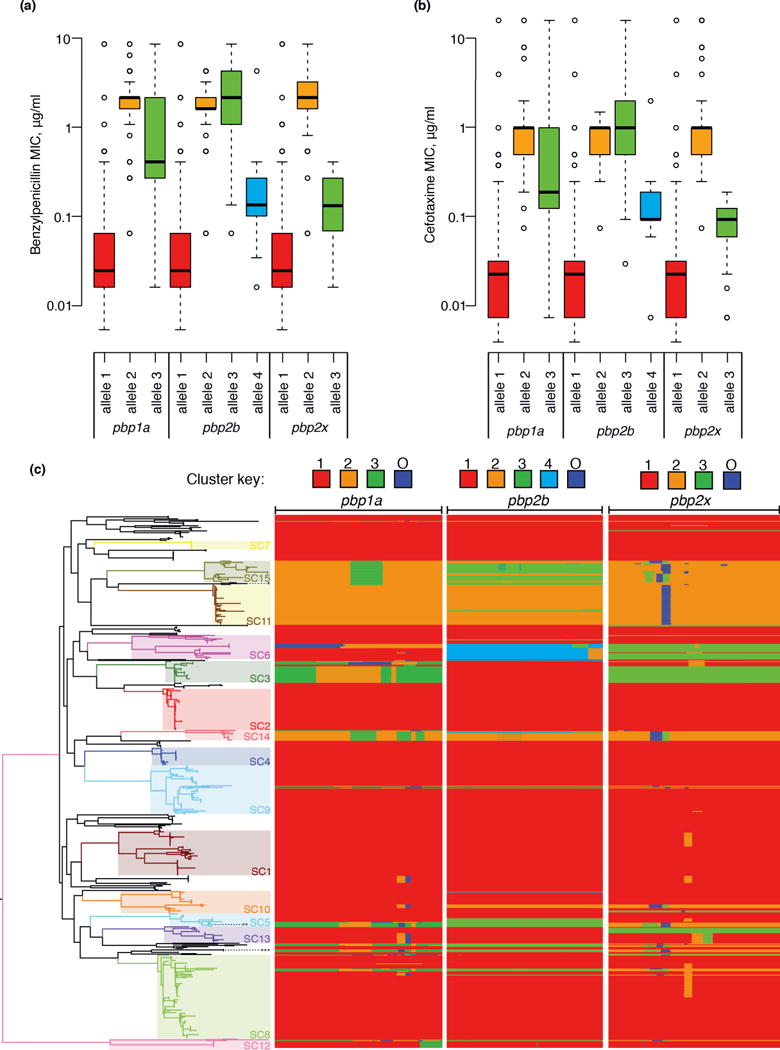
Changes in beta lactam resistance. (a) Resistance to benzylpenicillin. Each of the three penicillin binding protein genes involved in resistance was independently clustered on the basis of sequence similarity using nextgenBRAT; this identified three alleles for pbp1a and pbp2x and four alleles for pbp2b. Box and whisker plots display the distribution of benzylpenicillin MICs associated with strains possessing each of these alleles. (b) Box and whisker plot equivalent to panel (a), but showing MICs to the cephalosporin cefotaxime. (c) Distribution of pbp alleles throughout the pneumococcal population. The phylogeny displayed in Figure 1 is shown on the left, with the multidrug-resistant lineages PMEN1 (***), PMEN3 (**) and PMEN15 (*) labeled with asterisks. The three columns on the right represent the independent analyses for the three pbp genes involved in beta lactam resistance. These are comprised of one row for each taxon in the tree, with the width of the column representing the length of the gene. Blocks are colored according to the group to which the sequence belongs, as indicated by the key at the top of the column; changes of color indicate recombination breakpoints characteristic of mosaic genes. The ‘O’ group represents sequence that comes from an ‘outgroup’; that is, from a strain or species not represented within the collection.
Across the sampling period, the dominant allele for each pbp gene was the ancestral, sensitive form, which altered little in frequency. However, changes in the types of resistant allele were evident, with the forms of both pbp2b and pbp2x associated with highly beta lactam resistant isolates falling in frequency (Supplementary Figure 25). Allele 3 of pbp2b, strongly associated with the multidrug-resistant lineages PMEN1, PMEN3 and PMEN1515, was partially displaced by alleles 2 and 4, rising due to the increase in prevalence of SC11 and a shift towards resistant isolates within SC6, respectively. Allele 2 of pbp2x, again associated with the PMEN lineages, was replaced by allele 3, largely as a consequence of the emergence of SC3 alongside the change within SC6. The analogous analysis of the genes encoding dihydrofolate reductase and dihydropteroate synthase, certain alleles of which can cause resistance to sulfa drugs, found a decline in the prevalence of resistant alleles (Supplementary Figure 27), in line with the observed fall in levels of resistance9. This is largely the consequence of a shift in the composition of SC1 and the replacement of the PMEN lineages with SC3 and SC11, which are predominantly sensitive to sulfa drugs.
Although the major changes in beta lactam resistance are associated with shifts in the frequency of different clades of isolates, the emergence of resistant genotypes through recombinations affecting penicillin-binding protein genes is also observed. This can be rapid, as demonstrated when transformation events affecting pbp1a, pbp2x and pbp2b occur on the same branch of the tree (e.g. starred isolates in Figure 3). One example, albeit on a long branch, is associated with the emergence of ST3280 isolates within SC6 (Supplementary Figure 10), which are also distinguished from their sister taxa through the acquisition of a Tn916 element carrying a Mega cassette. However, a frameshift mutation disrupts the mel gene, which appears to be reflected in an intermediate level of resistance to erythromycin (between 0.25 and 0.5 μg ml−1; Supplementary Table 1). This phenotype is also observed in an SC8 isolate with a Mega element in which the mef gene is disrupted by a frameshift mutation. The persistence of these distinctive genetic traits in the five closely related ST3280 isolates was of particular interest as they were all isolated from a single location in 2007, implying there may be evidence of transmission chains within the dataset.
Population substructuring
To test whether this represented a general phenomenon, and transmission within locations could be detected from the genomic data, the pairwise distances (in point mutations; Supplementary Figure 5–Supplementary Figure 19) between all of the taxa within monophyletic sequence clusters were compared with the locations from which the bacteria were recovered (listed in Supplementary Table 1). More closely related isolates were much more likely to have been recovered from the same location than expected by chance (Figure 7). The probability that the members of the pair would come from the same location decreased approximately exponentially with the point mutation distance between them. The rate constant calculated from these data implied once two isolates were distinguished by approximately 18 point mutations, it would be equally likely they would be isolated from the same, or different, communities in the dataset. Given the mutation rate of 2–3 mutations per year, this represents around four years of divergence between two strains. Such evidence of transmission chains indicates that the spread of bacteria within communities is significantly faster than dissemination of bacteria between them, which occurs sufficiently slowly to be detectable via point mutations.
Figure 7.
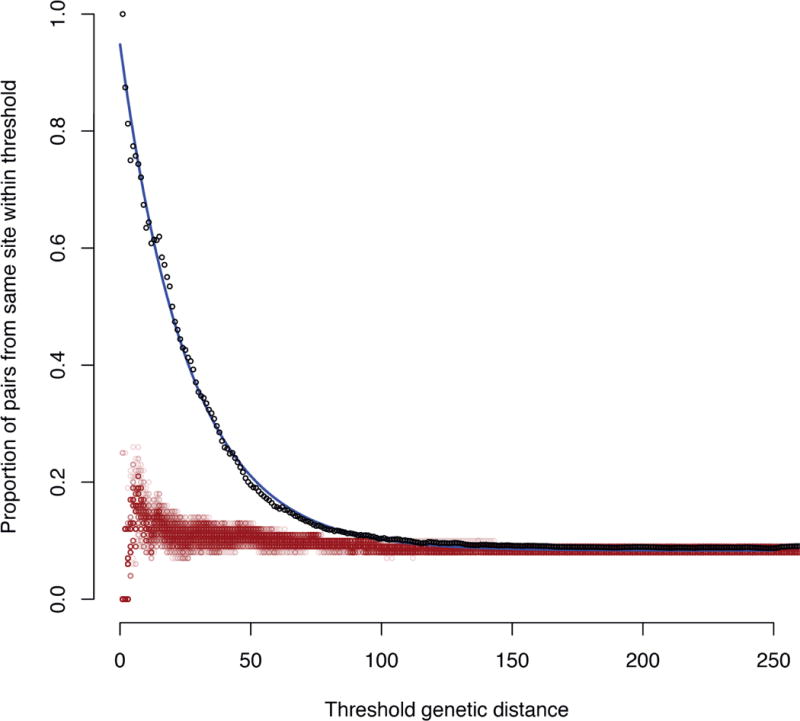
Geographic structure within the population. The pairwise genetic distance, equating to a separation in terms of point mutations, between all strains within the same monophyletic sequence cluster were calculated and combined into a single dataset. For a series of maximum genetic distance thresholds, the proportion of all pairwise comparisons meeting the condition that both isolates originated within the same location was calculated. These are plotted as the black points, which appear to fit an approximately exponential decay, indicated by the blue line. The red points represent the outcome of one hundred permutations whereby the same statistic was calculated when the locations of the isolates were randomized.
Population substructuring may also be produced by the immune status of the host, which changes with age following successive carriage episodes. Previous work found strains carrying the type 1 (rlr) pneumococcal pilus, hypothesized to be involved in adhesion to the nasopharyngeal surface35, were most prevalent in children under five years of age36. This was attributed to the development of an adaptive immune response to this surface structure, which precludes bacteria with this antigen from colonizing older children while still providing a functional benefit in naïve hosts. The resulting niche differentiation will result in strains adapted to transmission between hosts of different ages. In order to identify antigens generating a similar signal, a logistic regression against host age (excluding those aged under 6 months that may be influenced by maternal immunity) was performed for COGs present at a range of intermediate frequencies. Aside from three rare short COGs, the function of which is difficult to interpret, the rlr pilus was found to have one of the strongest relationships with host age, confirming this previous finding (Figure 8). Showing an association of a similar magnitude is the pclAR gene cluster37, encoding a large protein antigen present in about half of the sampled bacterial population, and two linked alleles of the immunoglobulin A protease zmpA and paralogous zinc metalloprotease zmpD, both of which are large surface-displayed proteins; by contrast, two alternative alleles of zmpAD show an association with older children. As these antigen COGs are stably associated with particular genotypes, sequence clusters show varying patterns of association with different host ages (Supplementary Figure 28). The effect of antigens frequently affected by recombinations, such as pspA and pspC (Supplementary Figure 5–Supplementary Figure 19), is unclear, as these genes are difficult to assemble and fall into multiple COGs owing to their extensive sequence diversity. The apparently weaker age-association of the mel/mef efflux pump is, in fact, most pronounced in infants younger than six months, in agreement with an independent sample38 (Supplementary Figure 29).
Figure 8.
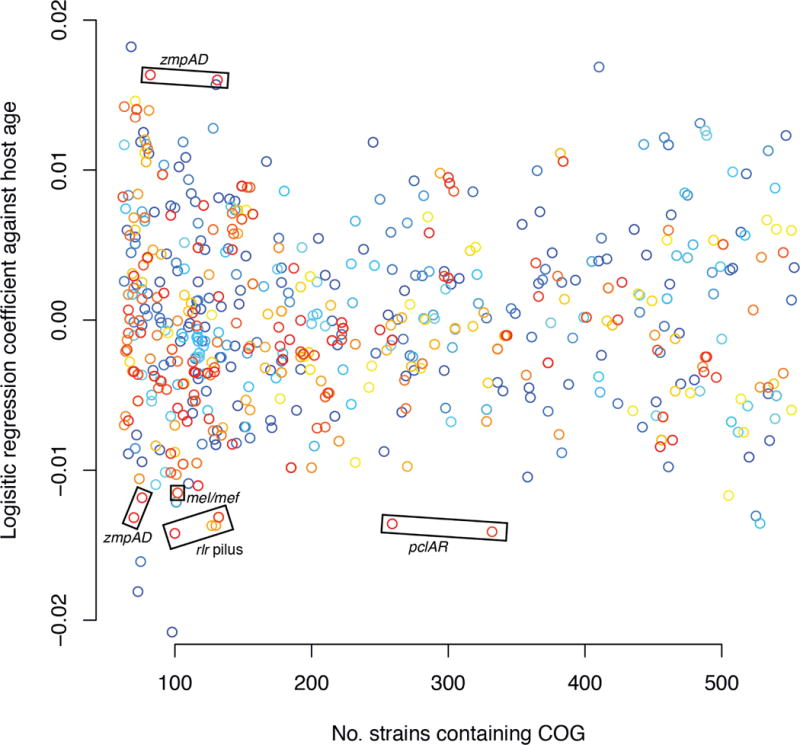
Effect of host age on pneumococcal genotype. A logistic regression coefficient of each COG against the host child’s age, in months, was calculated. Terms relating to year of isolation were included in the regression to account for differences in age distributions between samples, and children under six months of age were excluded to avoid the confounding effects of maternal immunity. The coefficient relating to host age is plotted against the prevalence of the COG within the bacterial population; only those present in between 10% and 90% of the population, suggesting they may be under balancing selection, are displayed. Points are colored according to the mean length of the member proteins, ranging from red (for longer sequences) to blue (for shorter sequences).
Discussion
The pneumococcal population was significantly disrupted by PCV7, with the almost complete loss of the seven vaccine serotypes and their rapid replacement with non-VT strains. Whole genome sequencing provides a more detailed view of this process, both revealing distant relationships between VT and non-VT pneumococci that are difficult to establish using MLST in many cases, while also indicating ‘capsule switching’ events between closely related taxa are likely to be old relative to PCV7’s introduction. Hence, aside from the rise of lineages such as SC3 and SC7, examples of novel genotypes distantly related to previously observed isolates, the population dynamics are largely the consequence of VT isolates being replaced by non-VT relatives present at a low frequency before the vaccine. The clearest example is SC9, where the serotype 23F isolates predominate pre-PCV7 and are replaced post-vaccination by 23A and 23B isolates. Nevertheless, the sequence cluster does not fall in prevalence, suggesting its average fitness has not declined, especially in the context of stable pneumococcal carriage rates. As it seems unlikely the pre-PCV7 distribution resulted from drift, the data indicate this sequence cluster may occupy a specific niche that was vacated by 23F post-PCV7. This might be defined by cross-immunity against serogroup 23 acting as the major constraint on the prevalence of strains within this group, or by the functional implications of other components of the accessory genome. Relating the such considerations to the pneumococcus’ population structure will be important for understanding the impact of partial coverage vaccines.
Replacement of VT strains with non-VT relatives partially explains the stable prevalence of most accessory loci. Comparison of the pooled data from 2001 and 2007 indicates a detectable vaccine effect on only a few genes associated with one of the vaccine serotypes (Figure 4), demonstrating the importance of assigning genomic data to specific taxa rather than using pooled shotgun reads for studying strain dynamics. That both populations are composed of distinct strains, themselves representing different combinations of similar loci, while the IPD rate falls indicates subtle differences within COGs, or consequences of interactions between them, are crucial in determining the rate at which pneumococci cause disease within a carrier. As the detectable alterations generally concern the cps locus, changes in serotype are implicated as the most important factor underlying the decline in IPD in Massachusetts.
The details of bacterial population restructuring following the introduction of PCV7 may well differ in locations where the initial bacterial populations, or host characteristics, are dissimilar from those in this study. Nor are the observed dynamics necessarily representative of the response over all timescales. While levels of resistance to some antibiotics appear to have been stable in the samples of this study, based on the surveillance of IPD isolates from young children across the USA it seems levels of resistance fell immediately after PCV7’s introduction before rebounding by 200439. This delayed response may be a consequence of how quickly non-VT resistant pneumococcal lineages could rise in prevalence or, based on the geographic structuring observed in this study, the speed at which they could spread from sources where they were present pre-PCV7. Whether the 2007 sample represents a final equilibrium is unclear. There is little evidence of beneficial post-PCV7 transformation events in this sample, which may partially relate to the slow rate at which recombinations are observed to accumulate in lineages. Therefore it seems likely that the bacterial population’s response to vaccine introduction will continue through adaptation to the post-PCV7 environment via horizontal sequence exchange. On this point, it may be instructive to note that SC15, associated with the highest r/m, recently appears to have been successful through rapidly adapting to the post-PCV7 environment13. Hence, while the serotype distribution may have reached equilibrium by 200717, the response of the pneumococcal population to the conjugate vaccines is likely to continue.
Methods
DNA sequencing
Samples were sequenced as multiplexed libraries on the Illumina HiSeq platform to produce paired end reads either 75 nt (for samples from 2001 or 2004) or 100 nt (for samples from 2007) in length. Samples were only used where more than 60 Mb of data (equating to approximately thirty fold coverage of a pneumococcal genome) were available. Serotypes and sequence types were extracted as described previously23 and compared to those recorded in earlier studies to check the integrity of sample handling.
Genome assembly and annotation
Genomes were assembled de novo using Velvet40 through optimizing the kmer and expected coverage values as described previously23. Short contigs less than twice the length of the kmer value used in the final assembly were discarded. Both Glimmer341 and Prodigal42 were trained on the complete reference sequence of S. pneumoniae ATCC 70066943, and these models applied to each draft assembly, modified through the addition of a three frame stop codon sequence to each end of the genome. A consensus of these two methods was then derived through only using putative protein coding sequences (CDSs) where the central halves of the Glimmer3 and Prodigal gene models overlapped on the same strand of the assembly. Finally, CDSs were trimmed wherever they overlapped breaks in the assembly, such that they did not span multiple contigs.
Clustering and analysis of orthologous proteins
All putative CDSs were translated and an all-against-all comparison performed using BLAT44 with default settings. An initial clustering based on these alignments was then produced using COGtriangles45. COGnitor46 was then used to extract a unique best hit cluster for each CDS. As COGtriangles requires the presence of at least three orthologues in the dataset to produce a cluster of orthologues (COG), this left simple sequences, singletons and pairs of orthologues unclustered. To resolve this, a BLAT E value threshold corresponding to a p value of 0.05 Bonferroni corrected for the number of reported BLAT comparisons was established. Unclustered proteins with reciprocal best BLAT hits surpassing this threshold were paired into COGs with two members. Remaining proteins were either deemed insufficiently complex to cluster, if their self-BLAT E value was greater than the threshold, or assigned as singleton COGs.
Each COG was characterized through alignment of the protein sequences with MUSCLE47, followed by backtranslation into a codon alignment using the DNA sequences. Based on this alignment, diversity was quantified as the mean pairwise Kimura distance between members. The codon alignments of the COGs associated with beta lactam and sulfa drug resistance were analyzed using nextgenBRAT48 with a window size of 100 bp. Recombinant segments were identified using a p value of 0.05, as calculated through 100 replicates of ten iterations. Where minimum inhibitory concentrations were specified as ‘less than’ a given value, the value was halved for the purposes of associating alleles with different levels of resistance; correspondingly, where ‘greater than’ a specified value was used, the value was doubled.
Analysis of population structure
The codon alignments of each ‘core’ COG (i.e. those with a single representative in each genome assembly) were concatenated to give a single ‘core’ alignment. A maximum likelihood phylogeny was then produced with RAxML49 using a general time reversible model with four gamma categories for rate heterogeneity. This alignment was also analysed using BAPS50. Three runs, starting from a maximum cluster number of 20, 40 or 60, each converged on the 15 monophyletic sequence clusters described, with the exception that one run added serotype 3 strains to SC7.
Analysis of individual lineages
Fifteen BAPS clusters were monophyletic within the maximum likelihood tree, and therefore appeared to constitute groups of isolates where not all phylogenetic information had been abrogated by recombination (i.e. a ‘clonal frame’ remained). One isolate within each of these groups was selected for reassembly with both SGA51 and Velvet40; these contigs were merged using Zorro52, then arranged into scaffolds using SSPACE53. These reference assemblies were then manually curated using ACT54. Illumina read pairs from all members of the clade were then mapped against this reference using SMALT (http://www.sanger.ac.uk/resources/software/smalt/), the output of which was processed as described previously55,56 to produce a whole genome alignment. This was analysed using an algorithm that iteratively generates a maximum likelihood phylogeny based on point mutations while identifying recombination events23. When comparing r/m values for sequence clusters, and comparing the level of recombination observed in each one, branches on which a total of 5,000 substitutions or more occurred were excluded from the dataset, as the accuracy of recombination detection was liable to drop on these branches. The difference in r/m values was still significant, as calculcated by a Kruskal-Walis test, when all branches were included, as well as at all length cutoff values between 1,000 and 10,000 SNPs at 500 SNP intervals. Recombinations occurring in regions annotated as MGEs in Supplementary Figure 5–Supplementary Figure 19 were also excluded, as these may represent the transfer of autonomously mobile elements rather than homologous recombinations. Exponential distributions were fitted to the lengths of homologous recombinations as described previously56.
Identification of spatiotemporal signals
Path-O-Gen (http://tree.bio.ed.ac.uk/software/pathogen) was used to examine these lineage phylogenies for signs of a temporal signal. Where there was a significant positive correlation between the dates of isolation and root-to-tip distance, the alignment of polymorphisms caused by point mutations was analysed using BEAST57. The tree topology was fixed, to maintain consistency with the prediction of recombinations, while a general time reversible substitution model was allowed to occur with a relaxed lognormal mutation rate58. A skyline plot was used as the population size prior59.
When analyzing the geographical distribution of isolates, pairwise distances were extracted from the phylogenies displayed in Supplementary Figure 5–Supplementary Figure 19 using Bioperl60. When plotted as displayed in Figure 7, an exponential relationship was fitted of the form:
Where y represents the proportion of strain pairs originating from the same location and x is the threshold maximum genetic distance, in terms of point mutations, between a pair. C represents the probability of two strains originating from the same location by chance (estimated as 0.083, 95% confidence interval 0.083–0.084). The sum of A and C represents the probability that two identical strains come from the same location; A was estimated as 0.86 (95% confidence interval 0.86–0.87). B is the rate at which pairs become discordant for location per point mutation; this was estimated as 0.038 per mutation (95% confidence interval 0.038–0.039 per mutation).
Logistic regressions
Logistic regressions were performed using R61. When identifying COGs associated with different ages, the binary-encoded presence/absence pattern for each COG was regressed against the age of the host child, in months, and the year of isolation, as categories. These latter confounding variables were included to guard against different structures to the age population of sampled children in different years. Children under six months of age were excluded from the analysis to avoid the confounding effects of maternal immunity.
Supplementary Material
Acknowledgments
NJC is funded by an AXA postdoctoral fellow award. Research reported in this publication was supported by the National Institute of Allergy and Infectious Diseases of the NIH under award number R01AI066304 and by Wellcome Trust grant number 098051. We acknowledge the support of the Sanger Institute core sequencing and informatics teams and productive discussions at PERMAFROST workshops. The content is solely the responsibility of the authors and does not necessarily represent the official views of the NIH.
Footnotes
Accession codes
Sequence data have been deposited in the ENA under project ERP000809 as listed in Supplementary Table 1.
Author contributions
ML and WPH conceived the project. ML, WPH, SDB, JP and JF supervised the project. NJC and PKM analyzed the data. All authors contributed to writing the manuscript.
Potential competing financial interests
SIP has investigator-initiated grants from Merck and Pfizer, and has consulted for Glaxosmithkline, Merck, Pfizer and Novartis. WPH has consulted for Glaxosmithkline. ML has consulted for Pfizer and Novartis.
References
- 1.Weinberger DM, et al. Pneumococcal capsular polysaccharide structure predicts serotype prevalence. PLoS Pathog. 2009;5:e1000476. doi: 10.1371/journal.ppat.1000476. [DOI] [PMC free article] [PubMed] [Google Scholar]
- 2.Whitney CG, et al. Decline in invasive pneumococcal disease after the introduction of protein-polysaccharide conjugate vaccine. N Engl J Med. 2003;348:1737–46. doi: 10.1056/NEJMoa022823. [DOI] [PubMed] [Google Scholar]
- 3.Steenhoff AP, Shah SS, Ratner AJ, Patil SM, McGowan KL. Emergence of vaccine-related pneumococcal serotypes as a cause of bacteremia. Clin Infect Dis. 2006;42:907–14. doi: 10.1086/500941. [DOI] [PubMed] [Google Scholar]
- 4.Hicks LA, et al. Incidence of pneumococcal disease due to non-pneumococcal conjugate vaccine (PCV7) serotypes in the United States during the era of widespread PCV7 vaccination, 1998–2004. J Infect Dis. 2007;196:1346–54. doi: 10.1086/521626. [DOI] [PubMed] [Google Scholar]
- 5.Pai R, et al. Postvaccine genetic structure of Streptococcus pneumoniae serotype 19A from children in the United States. J Infect Dis. 2005;192:1988–95. doi: 10.1086/498043. [DOI] [PubMed] [Google Scholar]
- 6.Pelton SI, et al. Emergence of 19A as virulent and multidrug resistant Pneumococcus in Massachusetts following universal immunization of infants with pneumococcal conjugate vaccine. Pediatr Infect Dis J. 2007;26:468–72. doi: 10.1097/INF.0b013e31803df9ca. [DOI] [PubMed] [Google Scholar]
- 7.Finkelstein JA, et al. Antibiotic-resistant Streptococcus pneumoniae in the heptavalent pneumococcal conjugate vaccine era: predictors of carriage in a multicommunity sample. Pediatrics. 2003;112:862–9. doi: 10.1542/peds.112.4.862. [DOI] [PubMed] [Google Scholar]
- 8.Huang SS, et al. Post-PCV7 changes in colonizing pneumococcal serotypes in 16 Massachusetts communities, 2001 and 2004. Pediatrics. 2005;116:e408–13. doi: 10.1542/peds.2004-2338. [DOI] [PubMed] [Google Scholar]
- 9.Huang SS, et al. Continued impact of pneumococcal conjugate vaccine on carriage in young children. Pediatrics. 2009;124:e1–11. doi: 10.1542/peds.2008-3099. [DOI] [PMC free article] [PubMed] [Google Scholar]
- 10.Hsu K, Pelton S, Karumuri S, Heisey-Grove D, Klein J. Population-based surveillance for childhood invasive pneumococcal disease in the era of conjugate vaccine. Pediatr Infect Dis J. 2005;24:17–23. doi: 10.1097/01.inf.0000148891.32134.36. [DOI] [PubMed] [Google Scholar]
- 11.Yildirim I, et al. Serotype specific invasive capacity and persistent reduction in invasive pneumococcal disease. Vaccine. 2010;29:283–8. doi: 10.1016/j.vaccine.2010.10.032. [DOI] [PMC free article] [PubMed] [Google Scholar]
- 12.Yildirim I, Stevenson A, Hsu KK, Pelton SI. Evolving Picture of Invasive Pneumococcal Disease in Massachusetts Children: A Comparison of Disease in 2007–2009 with Earlier Periods. Pediatr Infect Dis J. 2012 doi: 10.1097/INF.0b013e3182615615. [DOI] [PubMed] [Google Scholar]
- 13.Hanage WP, et al. Clonal replacement among 19A Streptococcus pneumoniae in Massachusetts, prior to 13 valent conjugate vaccination. Vaccine. 2011;29:8877–81. doi: 10.1016/j.vaccine.2011.09.075. [DOI] [PMC free article] [PubMed] [Google Scholar]
- 14.Hanage WP, et al. Diversity and antibiotic resistance among nonvaccine serotypes of Streptococcus pneumoniae carriage isolates in the post-heptavalent conjugate vaccine era. J Infect Dis. 2007;195:347–52. doi: 10.1086/510249. [DOI] [PubMed] [Google Scholar]
- 15.McGee L, et al. Nomenclature of major antimicrobial-resistant clones of Streptococcus pneumoniae defined by the pneumococcal molecular epidemiology network. J Clin Microbiol. 2001;39:2565–71. doi: 10.1128/JCM.39.7.2565-2571.2001. [DOI] [PMC free article] [PubMed] [Google Scholar]
- 16.Atwood KC, Schneider LK, Ryan FJ. Periodic selection in Escherichia coli. Proc Natl Acad Sci U S A. 1951;37:146–55. doi: 10.1073/pnas.37.3.146. [DOI] [PMC free article] [PubMed] [Google Scholar]
- 17.Moore MR, et al. Population snapshot of emergent Streptococcus pneumoniae serotype 19A in the United States, 2005. J Infect Dis. 2008;197:1016–27. doi: 10.1086/528996. [DOI] [PubMed] [Google Scholar]
- 18.Wyres KL, et al. Pneumococcal Capsular Switching: A Historical Perspective. J Infect Dis. 2012 doi: 10.1093/infdis/jis703. [DOI] [PMC free article] [PubMed] [Google Scholar]
- 19.Donati C, et al. Structure and dynamics of the pan-genome of Streptococcus pneumoniae and closely related species. Genome Biol. 2010;11:R107. doi: 10.1186/gb-2010-11-10-r107. [DOI] [PMC free article] [PubMed] [Google Scholar]
- 20.Hanage WP, et al. Evidence that pneumococcal serotype replacement in Massachusetts following conjugate vaccination is now complete. Epidemics. 2010;2:80–4. doi: 10.1016/j.epidem.2010.03.005. [DOI] [PMC free article] [PubMed] [Google Scholar]
- 21.Hanage WP, et al. Carried pneumococci in Massachusetts children: the contribution of clonal expansion and serotype switching. Pediatr Infect Dis J. 2011;30:302–8. doi: 10.1097/INF.0b013e318201a154. [DOI] [PMC free article] [PubMed] [Google Scholar]
- 22.Hanage WP, Kaijalainen T, Saukkoriipi A, Rickcord JL, Spratt BG. A successful, diverse disease-associated lineage of nontypeable pneumococci that has lost the capsular biosynthesis locus. J Clin Microbiol. 2006;44:743–9. doi: 10.1128/JCM.44.3.743-749.2006. [DOI] [PMC free article] [PubMed] [Google Scholar]
- 23.Croucher NJ, et al. Rapid pneumococcal evolution in response to clinical interventions. Science. 2011;331:430–4. doi: 10.1126/science.1198545. [DOI] [PMC free article] [PubMed] [Google Scholar]
- 24.Moore MR, et al. Population snapshot of emergent Streptococcus pneumoniae serotype 19A in the United States, 2005. J Infect Dis. 2008;197:1016–1027. doi: 10.1086/528996. [DOI] [PubMed] [Google Scholar]
- 25.Park IH, et al. Differential effects of pneumococcal vaccines against serotypes 6A and 6C. J Infect Dis. 2008;198:1818–22. doi: 10.1086/593339. [DOI] [PMC free article] [PubMed] [Google Scholar]
- 26.Bentley SD, et al. Genetic analysis of the capsular biosynthetic locus from all 90 pneumococcal serotypes. PLoS Genet. 2006;2:e31. doi: 10.1371/journal.pgen.0020031. [DOI] [PMC free article] [PubMed] [Google Scholar]
- 27.Gherardi G, Whitney CG, Facklam RR, Beall B. Major related sets of antibiotic-resistant Pneumococci in the United States as determined by pulsed-field gel electrophoresis and pbp1a-pbp2b-pbp2x-dhf restriction profiles. J Infect Dis. 2000;181:216–29. doi: 10.1086/315194. [DOI] [PubMed] [Google Scholar]
- 28.Whitney CG, et al. Increasing prevalence of multidrug-resistant Streptococcus pneumoniae in the United States. N Engl J Med. 2000;343:1917–24. doi: 10.1056/NEJM200012283432603. [DOI] [PubMed] [Google Scholar]
- 29.Greene SK, et al. Trends in antibiotic use in Massachusetts children, 2000–2009. Pediatrics. 2012;130:15–22. doi: 10.1542/peds.2011-3137. [DOI] [PMC free article] [PubMed] [Google Scholar]
- 30.Franke AE, Clewell DB. Evidence for conjugal transfer of a Streptococcus faecalis transposon (Tn916) from a chromosomal site in the absence of plasmid DNA. Cold Spring Harb Symp Quant Biol. 1981;45(Pt 1):77–80. doi: 10.1101/sqb.1981.045.01.014. [DOI] [PubMed] [Google Scholar]
- 31.Shaw JH, Clewell DB. Complete nucleotide sequence of macrolide-lincosamide-streptogramin B-resistance transposon Tn917 in Streptococcus faecalis. J Bacteriol. 1985;164:782–96. doi: 10.1128/jb.164.2.782-796.1985. [DOI] [PMC free article] [PubMed] [Google Scholar]
- 32.Del Grosso M, Camilli R, Iannelli F, Pozzi G, Pantosti A. The mef(E)-carrying genetic element (mega) of Streptococcus pneumoniae: insertion sites and association with other genetic elements. Antimicrob Agents Chemother. 2006;50:3361–6. doi: 10.1128/AAC.00277-06. [DOI] [PMC free article] [PubMed] [Google Scholar]
- 33.Hakenbeck R, Tarpay M, Tomasz A. Multiple changes of penicillin-binding proteins in penicillin-resistant clinical isolates of Streptococcus pneumoniae. Antimicrob Agents Chemother. 1980;17:364–71. doi: 10.1128/aac.17.3.364. [DOI] [PMC free article] [PubMed] [Google Scholar]
- 34.Cavalieri S. Manual of antimicrobial susceptibility testing. American Society for Microbiology; 2005. [Google Scholar]
- 35.Barocchi MA, et al. A pneumococcal pilus influences virulence and host inflammatory responses. Proc Natl Acad Sci U S A. 2006;103:2857–62. doi: 10.1073/pnas.0511017103. [DOI] [PMC free article] [PubMed] [Google Scholar]
- 36.Regev-Yochay G, et al. Re-emergence of the type 1 pilus among Streptococcus pneumoniae isolates in Massachusetts, USA. Vaccine. 2010;28:4842–6. doi: 10.1016/j.vaccine.2010.04.042. [DOI] [PMC free article] [PubMed] [Google Scholar]
- 37.Paterson GK, Nieminen L, Jefferies JM, Mitchell TJ. PclA, a pneumococcal collagen-like protein with selected strain distribution, contributes to adherence and invasion of host cells. FEMS Microbiol Lett. 2008;285:170–6. doi: 10.1111/j.1574-6968.2008.01217.x. [DOI] [PubMed] [Google Scholar]
- 38.Hyde TB, et al. Macrolide resistance among invasive Streptococcus pneumoniae isolates. JAMA. 2001;286:1857–62. doi: 10.1001/jama.286.15.1857. [DOI] [PubMed] [Google Scholar]
- 39.Kyaw MH, et al. Effect of introduction of the pneumococcal conjugate vaccine on drug-resistant Streptococcus pneumoniae. N Engl J Med. 2006;354:1455–63. doi: 10.1056/NEJMoa051642. [DOI] [PubMed] [Google Scholar]
- 40.Zerbino DR, Birney E. Velvet: algorithms for de novo short read assembly using de Bruijn graphs. Genome Res. 2008;18:821–9. doi: 10.1101/gr.074492.107. [DOI] [PMC free article] [PubMed] [Google Scholar]
- 41.Delcher AL, Bratke KA, Powers EC, Salzberg SL. Identifying bacterial genes and endosymbiont DNA with Glimmer. Bioinformatics. 2007;23:673–9. doi: 10.1093/bioinformatics/btm009. [DOI] [PMC free article] [PubMed] [Google Scholar]
- 42.Hyatt D, et al. Prodigal: prokaryotic gene recognition and translation initiation site identification. BMC Bioinformatics. 2010;11:119. doi: 10.1186/1471-2105-11-119. [DOI] [PMC free article] [PubMed] [Google Scholar]
- 43.Croucher NJ, et al. Role of conjugative elements in the evolution of the multidrug-resistant pandemic clone Streptococcus pneumoniaeSpain23F ST81. J Bacteriol. 2009;191:1480–9. doi: 10.1128/JB.01343-08. [DOI] [PMC free article] [PubMed] [Google Scholar]
- 44.Kent WJ. BLAT–the BLAST-like alignment tool. Genome Res. 2002;12:656–64. doi: 10.1101/gr.229202. [DOI] [PMC free article] [PubMed] [Google Scholar]
- 45.Kristensen DM, et al. A low-polynomial algorithm for assembling clusters of orthologous groups from intergenomic symmetric best matches. Bioinformatics. 2010;26:1481–7. doi: 10.1093/bioinformatics/btq229. [DOI] [PMC free article] [PubMed] [Google Scholar]
- 46.Tatusov RL, Galperin MY, Natale DA, Koonin EV. The COG database: a tool for genome-scale analysis of protein functions and evolution. Nucleic Acids Res. 2000;28:33–6. doi: 10.1093/nar/28.1.33. [DOI] [PMC free article] [PubMed] [Google Scholar]
- 47.Edgar RC. MUSCLE: multiple sequence alignment with high accuracy and high throughput. Nucleic Acids Res. 2004;32:1792–7. doi: 10.1093/nar/gkh340. [DOI] [PMC free article] [PubMed] [Google Scholar]
- 48.Marttinen P, et al. Detection of recombination events in bacterial genomes from large population samples. Nucleic Acids Res. 2012;40:e6. doi: 10.1093/nar/gkr928. [DOI] [PMC free article] [PubMed] [Google Scholar]
- 49.Stamatakis A, Ludwig T, Meier H. RAxML-III: a fast program for maximum likelihood-based inference of large phylogenetic trees. Bioinformatics. 2005;21:456–63. doi: 10.1093/bioinformatics/bti191. [DOI] [PubMed] [Google Scholar]
- 50.Tang J, Hanage WP, Fraser C, Corander J. Identifying currents in the gene pool for bacterial populations using an integrative approach. PLoS Comput Biol. 2009;5:e1000455. doi: 10.1371/journal.pcbi.1000455. [DOI] [PMC free article] [PubMed] [Google Scholar]
- 51.Simpson JT, Durbin R. Efficient construction of an assembly string graph using the FM-index. Bioinformatics. 2010;26:i367–73. doi: 10.1093/bioinformatics/btq217. [DOI] [PMC free article] [PubMed] [Google Scholar]
- 52.Argueso JL, et al. Genome structure of a Saccharomyces cerevisiae strain widely used in bioethanol production. Genome Res. 2009;19:2258–70. doi: 10.1101/gr.091777.109. [DOI] [PMC free article] [PubMed] [Google Scholar]
- 53.Boetzer M, Henkel CV, Jansen HJ, Butler D, Pirovano W. Scaffolding pre-assembled contigs using SSPACE. Bioinformatics. 2011;27:578–9. doi: 10.1093/bioinformatics/btq683. [DOI] [PubMed] [Google Scholar]
- 54.Carver T, et al. Artemis and ACT: viewing, annotating and comparing sequences stored in a relational database. Bioinformatics. 2008;24:2672–6. doi: 10.1093/bioinformatics/btn529. [DOI] [PMC free article] [PubMed] [Google Scholar]
- 55.Harris SR, et al. Evolution of MRSA during hospital transmission and intercontinental spread. Science. 2010;327:469–74. doi: 10.1126/science.1182395. [DOI] [PMC free article] [PubMed] [Google Scholar]
- 56.Croucher NJ, Harris SR, Barquist L, Parkhill J, Bentley SD. A high-resolution view of genome-wide pneumococcal transformation. PLoS Pathog. 2012;8:e1002745. doi: 10.1371/journal.ppat.1002745. [DOI] [PMC free article] [PubMed] [Google Scholar]
- 57.Drummond AJ, Suchard MA, Xie D, Rambaut A. Bayesian phylogenetics with BEAUti and the BEAST 1.7. Mol Biol Evol. 2012 doi: 10.1093/molbev/mss075. [DOI] [PMC free article] [PubMed] [Google Scholar]
- 58.Drummond AJ, Ho SY, Phillips MJ, Rambaut A. Relaxed phylogenetics and dating with confidence. PLoS Biol. 2006;4:e88. doi: 10.1371/journal.pbio.0040088. [DOI] [PMC free article] [PubMed] [Google Scholar]
- 59.Drummond AJ, Rambaut A, Shapiro B, Pybus OG. Bayesian coalescent inference of past population dynamics from molecular sequences. Mol Biol Evol. 2005;22:1185–92. doi: 10.1093/molbev/msi103. [DOI] [PubMed] [Google Scholar]
- 60.Stajich JE, et al. The Bioperl toolkit: Perl modules for the life sciences. Genome Res. 2002;12:1611–8. doi: 10.1101/gr.361602. [DOI] [PMC free article] [PubMed] [Google Scholar]
- 61.R Development Core Team . R: A language and environment for statistical computing. R Foundation for Statistical Computing; Vienna: 2011. [Google Scholar]
Associated Data
This section collects any data citations, data availability statements, or supplementary materials included in this article.