Abstract
Previous studies have shown that prostate cancer may be detected by a combined transrectal ultrasound and electrical impedance tomography imaging system. However, the sensitivity of the imaging system is limited due to very little current established in the far field distant from the probe surface. Consequently, biopsy needles are introduced to the imaging system to provide current paths in the distal regions. This study demonstrates that image sensitivity can be improved by incorporating the needle electrodes. A phantom experiment is presented to show that contrast to the background is enhanced by 17.4% when imaging with needle electrodes. Simulated reconstructions and some preliminary clinical data also suggest the sensitivity improvement. In summary, TREIT with needle electrodes in the tissue may have great potential in future clinical prostate cancer detection.
I. Introduction
Detecting prostate cancer non-invasively is clinically challenging. Currently, positive findings of elevated prostate specific antigen (PSA) levels in serum and anomalous digital rectal exams (DRE) may lead to transrectal ultrasound (TRUS) guided biopsy, which is the standard protocol for diagnosing and staging prostate cancer. Unfortunately, in addition to low sensitivity (<30%) of PSA testing and DRE [1], [2], TRUS guided biopsy procedure may still miss malignant tissue due to limited sensitivity and specificity of ultrasound imaging to tumors in the prostate gland [2], [3]. As a result, accurately detecting prostate cancer remains a challenge.
A number of ex vivo studies have shown that cancerous tissue has a significantly lower conductivity than benign tissue (p < 0.05) at frequencies ranging from 0.1 kHz to 100 kHz, and a significantly larger permittivity at 100 kHz (p < 0.0001) in the prostate gland [4], [5]. The significant tissue electrical property differences have led to an in vivo study where the prostate was imaged using transrectal electrical impedance tomography (TREIT) prior to radical prostatectomy. Contrary to the ex vivo reports, cancer regions assessed in this in vivo study were found to be more conductive than benign tissue at frequencies below than 25.6 kHz (p < 0.03) [6]. It was suggested that blood-concentrated vascularization in the cancerous regions results in enhanced conductivity in the in vivo tissues, whereas tissue structures primarily effect the electrical properties in the ex vivo prostate [5], [6].
Prostate imaging with electrical impedance endotomography was initially proposed by Jossinet et al [7, 8] as a transurethral device. The TREIT imaging system [9] first used here in the in vivo study has 30 electrodes plated on a commercial transrectal US probe shaft. An additional ventral electrode was placed on patient's lower abdomen to drive electrical current across the prostate or sense passive voltage. The imaging system was demonstrated to have limited sensitivity in the distant region from the probe shaft [9]. In order to enhance the distal sensitivity, we replace the ventral electrode with a modified needle to provide an internal electrode in the prostate during the imaging session. This needle electrode can be potentially combined with a routine biopsy needle to collect EIT data during prostate biopsy procedure. In this study we will demonstrate that with the needle electrode inside the tissue, the distal sensitivity away from the probe shaft will be greatly improved.
II. Methods
A. TREIT System Description
The TREIT system consists primarily of a TRUS biopsy system and electrical impedance tomography (EIT) data acquisition module [10]. The commercial TRUS system [11] provides 3D anatomic information of the prostate to guide EIT reconstruction. The TRUS probe has a single ultrasound transducer, which can move longitudinally or rotate around the center of the probe shaft. As a result, a 71 mm long acoustic window spanning 180° on the probe surface is established. In addition, a biopsy needle guide, a collar and a translation stage can be interfaced to the TRUS imaging system for biopsy needle positioning (Fig. 1). The biopsy needle can go through tubes on either side of the guide (Fig. 2) and enter human rectum to reach the prostate. The translation stage adjusts the depth of the guide into the rectum (step size of 2.5 mm) and the collar determines the penetration angle of the biopsy needle (step size of 5°). The needle position can be recorded with the readings on the collar and translation stage.
Fig. 1.
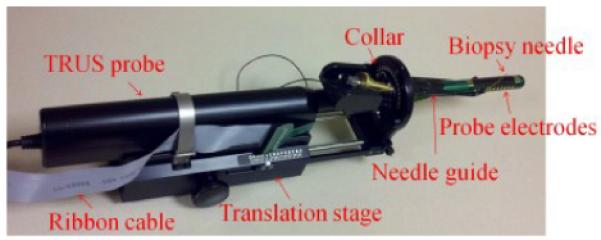
TRUS guided biopsy system with the biopsy needle, guide, collar, translation stage and probe electrodes.
Fig. 2.
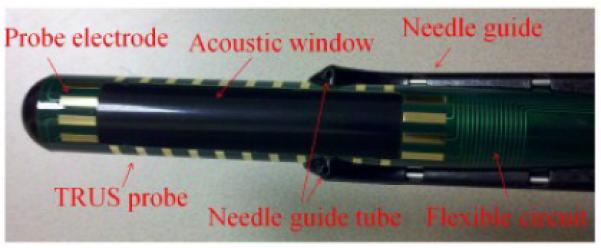
Probe electrodes plated on the TRUS probe shaft.
30 rectangular electrodes (2 mm × 8 mm) located around the periphery of a rectangular opening of 71 mm × 16 mm were plated on a custom designed flexible circuit. The flexible circuit was adhered to the TRUS probe shaft with the opening overlapping the acoustic window on the shaft (Fig. 2). By this fashion, acoustic signals can travel through the opening without any impedance. The flexible circuit was connected to the data acquisition system with a 1.5 m long ribbon cable.
The needle electrode was made by augmenting a clinical needle. An insulating polyimide sheath (Miniature Polyimide Tubing, 0.810 mm ID, 0.861 mm OD, Part Number: SWPT-0319-30) was applied onto the surface of the needle (0.643 mm OD × 254 mm, Myco Medical, Reli Chiba Point Needles, CHE22G101) leaving only the tip of the needle (2 – 3 mm) uncovered [12]. The other end of the needle was connected to the TREIT data acquisition system (Fig. 3).
Fig. 3.

The needle electrode augmented from applying a polyimide sheath tubing on the surface of a clinical needle. The exposed needle tip serves as the needle electrode.
B. Data Acquisition
During a clinical data acquisition prior to the radical prostatectomy surgery, the surgeon positions the TRUS probe in the patient's rectum so that the prostate falls in the center of the acoustic window. A 3D ultrasound image consisting of 72 frames representing cross-sectional transverse 2D slices is captured. Following this, the surgeon selects two biopsy sites guided by the commercial TRUS biopsy software [11]. Typically, the selected two biopsy sites are located at different lateral sides of the prostate so that both sides of the prostate can be electrically sensed.
After the 3D ultrasound scan of the prostate and before the needle insertion, a set of EIT data (at 3.2 kHz and 51.2 kHz) is collected using only the 30 probe electrodes. After inserting the biopsy needle at each location, EIT data with 31 electrodes (probe electrodes and the needle electrode) are recorded. The EIT data acquisition consists of driving an AC current (<1.6 mA) through a source electrode and a sink electrode and measuring the excitation current level and passive voltages on the remaining electrodes. The current level complies with the `patient auxiliary current' (PAC) standards (IEC601) for all electrode combinations at 51.2 kHz and the majority of combinations at 3.2 kHz [13]. Different combinations of source and sink electrode selections (driving patterns) result in a number of EIT measurements, which are used for electrical property image reconstructions. In a clinical data collection setting, a set (139) of linearly independent driving patterns optimized for sensitivity [14] is used to minimize the data acquisition time (~5 s).
For phantom experiments, the TREIT imaging system was vertically positioned in a saline bath (0.097 S/m). A metal ball inclusion (12.8 mm in diameter) was hung in the center of the imaging window, approximately 10 mm away from the probe surface (Fig. 4). EIT data were recorded at 3.2 kHz from all possible source and sink electrode combinations (930), or the full driving patterns. The full driving patterns contain a large number of redundant EIT data, which reduces errors during electrical property image reconstruction. In this phantom configuration, the needle was positioned at three locations in the distal region from the probe shaft to provide additional electrical sensing data.
Fig. 4.
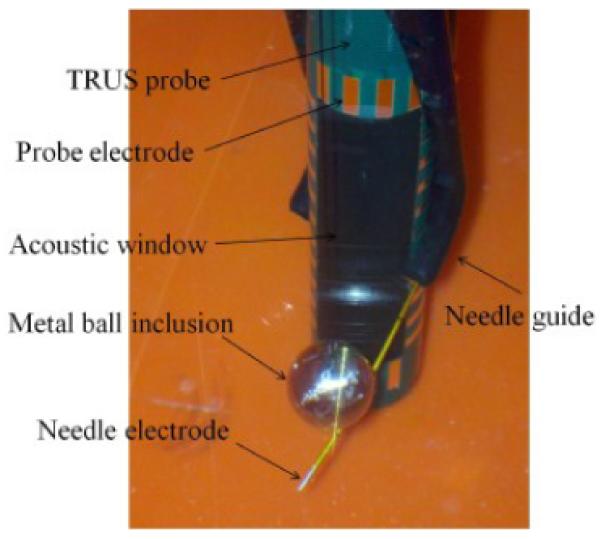
The phantom experiment configuration when imaging a metal ball inclusion.
C. Electrical property image reconstruction
A patient-specific prostate surface mesh containing the anatomic information is produced by manually segmenting the 3D TRUS image with a touch-screen enabled segmentation algorithm [15]. A 3D finite element (FE) mesh (Fig. 5) modeling the imaging field is constructed by coregistrating the prostate surface mesh and a cylindrical volume mesh. The probe electrode surfaces, TRUS probe shaft elements, prostate region elements and background elements (outside prostate region but not probe shaft) are correctly defined [10]. In addition, the needle electrodes are modeled as nodes in reconstruction FE mesh with the positions determined by the translation stage and collar coordinates.
Fig. 5.
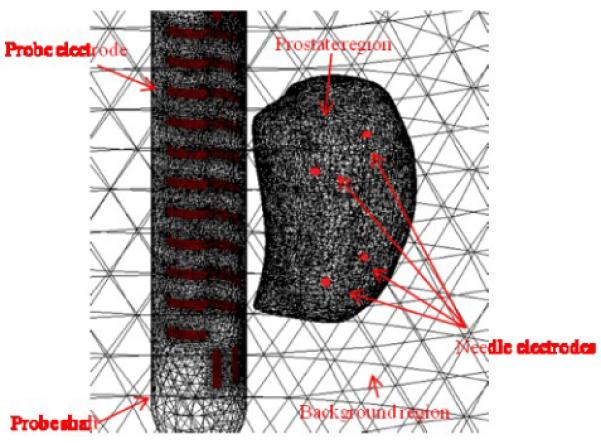
A reconstruction FE mesh with defined probe electrodes, prostate region, probe shaft region, background region and needle electrodes. The surface of a prostate was captured by TRUS in a patient and the locations of 4 simulated needle electrodes were indicated by red dots.
Each tetrahedron element in the reconstruction mesh is assigned a complex admittivity value γ (γ = σ + jω∊, σ: conductivity, ∊: permittivity, and ω is the angular frequency of the excitation single) and the nodes represent the scalar voltage potential field u in an enclosed body Ω. Under a quasistatic approximation where excitation currents are below 1 MHz, the EIT problem is modeled as:
| (1) |
| (2) |
| (3) |
| (4) |
| (5) |
| (6) |
where n is the outward normal vector extending from the surface, δ(x,y,z) is the Dirac delta function, Zp, Sp, Vp and Ip are the contact impedance, the surface area, the voltage and current measured on the probe electrode Ep, respectively [16], and Zn, Vn and In are the contact impedance, the voltage and current measured on the needle electrode En, respectively.
The complex admittivity distribution is computed by fitting the modeled measurements Mmod to the real measurements Mreal and minimizing the error in L2 norm:
| (6) |
Equation (6) is termed the Tikhonov regularization in solving the ill-posed EIT inverse problem. The penalty term (α: the Tikhonov factor and L the Laplacian operator) is added to ensure the gradual change of the admittivity inside the imaging domain [17].
The patient specific prostate region (tens of thousands elements) in the reconstruction mesh is discretized into an 8 × 8 × 8 pixelated coarse mesh to reduce the computational complexity [18]. The reconstruction algorithm regulates the admittivity in each coarse pixel to a single value. Additionally, the admittivity in the background region is also confined to converge to a single value [19].
Difference imaging is employed in the reconstruction process to minimize systematic errors. The baseline data are obtained by imaging a saline bath of approximately 0.1 S/m.
For the phantom experiment, the `prostate region' is defined as a wedge-shaped volume in front of the probe shaft [9]. The region spans 45° to 135°, extends from the probe surface to 50 mm away from the probe and has a height of 71 mm matching the acoustic window. The ultrasound image provides the inclusion's exact location.
III. Results and discussion
A. Simulation
Reconstructions were simulated to evaluate the effect of using the needle electrodes. Specifically, 4 internal electrodes were simulated with a patient's prostate in the imaging domain (Fig. 5). 416 simulated data points were generated by measuring a spherical inclusion of 1 cm in diameter with twice the conductivity compared to the background (Fig. 6 (a)). 3D conductivity distributions were computed using only the 30 probe electrodes and using 34 electrodes (with 4 needle electrodes) and 2D sagittal cross sections are demonstrated in Fig. 6 (b) and (c).
Fig. 6.
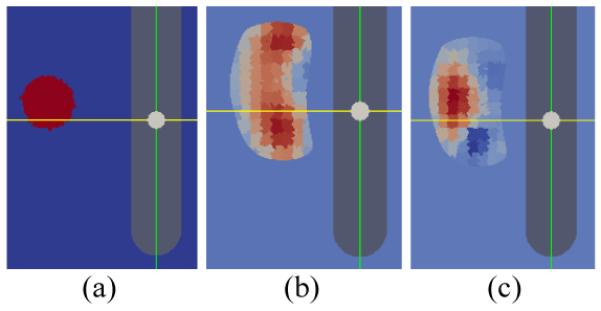
2D sagittal cross sections of EIT reconstructions with and without needle electrodes. (a) A simulated conductivity contrast (2:1) inclusion in the imaging domain. (b) Reconstructed conductivity distribution without using the needle electrodes. (c) Reconstructed condu ctivity distribution with incorporating the 4 needle electrodes.
Reconstruction using only the 30 probe electrodes failed to localize the simulated inclusion properly (Fig. 6 (b)). The increased conductivity spread to other regions in the simulated prostate gland. Incorporating the needle electrodes greatly enhanced the sensitivity in the far region in the prostate. Consequently, the inclusion was well localized (Fig. 6 (c)).
B. Phantom experiment
Conductivity reconstructions were computed using the measurements from only the 30 probe electrodes and from 3 needle electrodes in addition to the probe electrodes. The sagittal and transverse cross sections (the position of the inclusion) of the reconstruction images are demonstrated in Fig. 7. Ultrasound cross sections are also displayed as a reference. Reconstruction using the measurements from the additional needle electrodes (Fig. 7 (c) and (f)) demonstrated more localization of higher conductivity at the inclusion location compared to the reconstruction without using needle electrodes, where the increased conductivity diffused in the distal regions of the imaging field (Fig. 7 (b) and (e)).
Fig. 7.
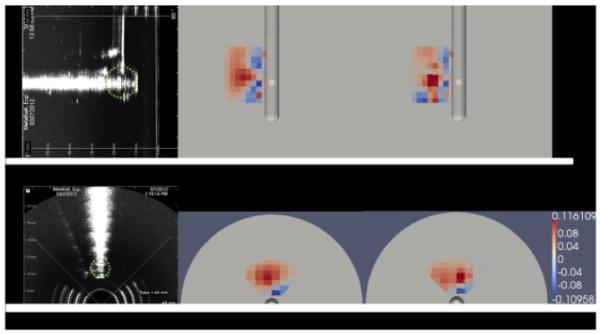
Ultrasound images and electrical property reconstruction images of imaging a metal ball inclusion. (a) Sagittal cross section of the ultrasound image. A green dotted circle is imposed on the ultrasound image to represent the size and location of the inclusion (same in (d)). (b) The sagittal cross section of the conductivity reconstruction using only 30 probe electrodes. (c) The sagittal cross section of th e conductivity reconstruction using 30 probe electrodes and 3 additional needle electrodes. (d) The transverse cross section of the ultrasound image. (e) The transverse cross section of the conductivity reconstruction using only 30 probe electrodes. (f) Tr ansverse cross section of the conductivity reconstruction using 30 probe electrodes and 3 additional needle electrodes. The color map of reconstructed values is in S/m.
The reconstructed conductivity values are demonstrated in Table I. The highest conductivity in the reconstruction is considered the reconstructed conductivity of the inclusion. The reconstructed inclusion conductivity contrast to the background (saline) is improved by 17.4% by using needle electrodes' measurements.
TABLE I.
Reconstructed conductivity of the phantom experiment (unit: S/m)
| Using 30 probe electrodes only | Using 30 probe electrodes and 3 needle electrodes | |
|---|---|---|
| Background region | 0.594×10⁻³ | 0.668×10⁻³ |
| Highest conductivity | 0.136 | 0.116 |
| Contrast to the background | 0.135 | 0.115 |
There were some artifacts in the reconstruction images (blue regions with lower conductivity than the background). These artifacts result from model-measurement mismatch. Whereas the Tikhonov regularization assumes gradual changes in conductivity, the interface of the inclusion and the saline bath exhibits a discontinuity in conductivity. This model-measurement mismatch artifact is also found in other EIT reconstructions [9], [20].
The reconstruction of the phantom experiment also suggests sensitivity improvement in the distal regions of the imaging field by incorporating measurements from a number of needle electrodes. This is because while probe electrodes can only establish proximal current paths in the near field, the needle electrodes in the far regions (internal electrodes inside the imaging domain) provide currents almost perpendicular to the probe surface, greatly enhancing the distal sensitivity.
C. Clinical data reconstruction
The electrical property images were reconstructed from clinical measurements and under ultrasound guidance. Exemplary image slices demonstrating the advantages using the needle electrodes are shown in Fig. 8. The pathology indications were obtained by microscopically examining sliced prostate tissues after the prostatectomy surgery.
Fig. 8.

Conductivity images reconstructed from clinical data. The pathology indication map is approximately located on the axial level of the reconstruction image. (a) The pathology indication map showing the location of the cancerous tissue (green) in the prostate slice. (b) The transverse cross section of the conductivity reconstruction using only 30 probe electrodes. (c) The transverse cross section of the conductivity reconstruction using 30 probe electrod es and 2 additional needle electrodes. The color map of reconstructed values is in S/m.
The elevated levels of conductivity matched the cancerous tissue located on the right of the pathology indication map (Fig. 8 (a)), which also complies with previous in vivo clinical findings. In addition, the cross section reconstructed involving the needle electrodes (Fig. 8 (c)) again exhibited more concentrated and enhanced values in highly conductive regions and even decreased values in the low conductive regions, compared to reconstructions using only the probe electrodes (Fig. 8 (b)). The enhanced contrast suggested increased image sensitivity when needle electrodes are incorporated. Clinical data being collected from an additional 25 men will be statistically analyzed in the future work.
IV. Conclusion
This study demonstrates that incorporating needle electrodes to the TREIT imaging system will enhance the sensitivity, especially at the distal region in the imaging field. TREIT with needle electrodes may have great potential in clinical prostate cancer detection.
Footnotes
Research supported by NIH/NCI 5RC1EB011000-02
REFERENCES
- [1].Brawer MK, Chetner MP, Beatie J, Buchner DM, Vessella RL, Lange PH. Screening for prostatic carcinoma with prostate specific antigen. J Urol. 1992;147:841. doi: 10.1016/s0022-5347(17)37401-3. [DOI] [PubMed] [Google Scholar]
- [2].Hoogendam A, Buntinx F F, de Vet HC. The diagnostic value of digital rectal examination in primary care screening for prostate cancer: a meta-analysis. Fam. Pract. 1999;16(6):621. doi: 10.1093/fampra/16.6.621. [DOI] [PubMed] [Google Scholar]
- [3].Kantoff PW, Taplin M. UpToDate. Waltham, MA: Uptodate: Clinical presentation, diagnosis, and staging of prostate cancer. http://www.uptodate.com/online/, Oct 2010. [Google Scholar]
- [4].Lee BR, Roberts WW, Smith DG, Ko HW, Epstein JI, Lecksell K, Partin AW, Walsh PC. Bioimpedance: Novel Use of a Minimally Invasive Technique for Cancer Localization in the Intact Prostate. Prostate. 1999;39:213–218. doi: 10.1002/(sici)1097-0045(19990515)39:3<213::aid-pros10>3.0.co;2-8. [DOI] [PubMed] [Google Scholar]
- [5].Halter RJ, Hartov A, Heaney JA, Paulsen KD, Schned AR. Electrical Impedance Spectroscopy of the Human Prostate. IEEE Transactions on Biomedical Engineering. 2007;54(no. 7) doi: 10.1109/TBME.2007.897331. [DOI] [PubMed] [Google Scholar]
- [6].Wan Y, Borsic A, Heaney J, Schned A, Hartov A, Halter R. Transrectal electrical impedance tomography (TREIT) of prostate: spatially co-registered pathological findings for prostate cancer detection. IEEE Trans. Med. Img. doi: 10.1118/1.4803498. to be submitted. [DOI] [PMC free article] [PubMed] [Google Scholar]
- [7].Jossinet J, Marry E, Matias A. Electrical impedance endotomography. Physics in Medicine and Biology. 2002;47(no. 13):2189–2202. doi: 10.1088/0031-9155/47/13/301. [DOI] [PubMed] [Google Scholar]
- [8].Jossinet J, Marry E, Montalibet A. Electrical impedance endo-tomography: imaging tissue from inside. Medical Imaging, IEEE Transactions on. 2002;21(no. 6):560–565. doi: 10.1109/TMI.2002.800610. [DOI] [PubMed] [Google Scholar]
- [9].Wan Y, Halter R, Borsic A, Manwaring P, Hartov A, Paulsen K. Sensitivity study of an ultrasound coupled transrectal electrical Impedance Tomography system for prostate imaging. Physiological Measurement. 2010;31(no. 8):17–29. doi: 10.1088/0967-3334/31/8/S02. [DOI] [PMC free article] [PubMed] [Google Scholar]
- [10].Wan Y. ProQuest Dissertations and Theses. Jan, 2012. Development of a combined ultrasound and electrical impedance imaging system for prostate cancer detection. [Google Scholar]
- [11].TargetScan biopsy system. Envisioneering Medical Technologies; St. Louis, MO: p. 63114. [Google Scholar]
- [12].Mishra V, Bouyad H, Halter RJ. Electrical impedance-based biopsy for prostate cancer detection. 2011 IEEE 37th Annual Northeast Bioengineering Conference (NEBEC) Conference Proceeding.2011. [Google Scholar]
- [13].Lionheart W, Kaipio J, McLeod C. Gneralized optimal current patterns and electrical safety in EIT. Physiol. Meas. 2001;22:85–90. doi: 10.1088/0967-3334/22/1/311. [DOI] [PubMed] [Google Scholar]
- [14].Borsic A, Halter R, Wan Y, Hartov A, Paulsen K. Sensitivity study and optimization of a 3D electric impedance tomography prostate probe. Physiol. Meas. 2009;30(no. 6):1–18. doi: 10.1088/0967-3334/30/6/S01. [DOI] [PMC free article] [PubMed] [Google Scholar]
- [15].Syed H, Borsic A, Hartov A, Halter R. Anatomically Accurate Hard Priors for Transrectal Electrical Impedance Tomography (TREIT) of the Prostate. Physiological Measurement. 2012 doi: 10.1088/0967-3334/33/5/719. In Press. O. Scherzer, Handbook of mathematical methods in imaging, 1st ed, Springer, 2010. [DOI] [PMC free article] [PubMed] [Google Scholar]
- [16].Uhlmann G. Electrical impedance tomography and Calderón's problem. Inverse Problems. 2009;25(no. 12):1–40. [Google Scholar]
- [17].Borsic A, Halter R, Wan Y, Hartov A, Paulsen K. Electrical impedance tomography reconstruction for three-dimensional imaging of the prostate. Physiol. Meas. 2010;31(no. 8):1–16. doi: 10.1088/0967-3334/31/8/S01. [DOI] [PMC free article] [PubMed] [Google Scholar]
- [18].Syed H. M.S. dissertation. Dartmouth College; New Hampshire, USA: 2011. Subvolume reconstruction algorithm for electrical impedance tomography. [Google Scholar]
- [19].Goharian M, Soleimani M, Jegatheesan A, Chin K, Moran G. A DSP based multi-frequency 3D electrical empedance tomography system. Annals Of Biomedical Engineering. 2008;36(no. 9):1594–1603. doi: 10.1007/s10439-008-9537-5. [DOI] [PubMed] [Google Scholar]


