Abstract
We previously reported that expression of the transcription factor interferon regulatory factor 1 (IRF1) is an early, critical maladaptive signal expressed by renal tubules during murine ischemic acute kidney injury (AKI). We now show that IRF1 mediates signals from reactive oxygen species (ROS) generated during ischemic AKI and that these signals ultimately result in production of α-subtypes of type I interferons (IFNαs). We found that genetic knockout of the common type I IFN receptor (IFNARI−/−) improved kidney function and histology during AKI. There are major differences in the spatial-temporal production of the two major IFN subtypes, IFNβ and IFNαs: IFNβ expression peaks at 4 h, earlier than IFNαs, and continues at the same level at 24 h; expression of IFNαs also increases at 4 h but continues to increase through 24 h. The magnitude of the increase in IFNαs relative to baseline is much greater than that of IFNβ. We show by immunohistology and study of isolated cells that IFNβ is produced by renal leukocytes and IFNαs are produced by renal tubules. IRF1, IFNαs, and IFNARI were found on the same renal tubules during ischemic AKI. Furthermore, we found that ROS induced IFNα expression by renal tubules in vitro. This expression was inhibited by small interfering RNA knockdown of IRF1. Overexpression of IRF1 resulted in the production of IFNαs. Furthermore, we found that IFNα stimulated production of maladaptive proinflammatory CXCL2 by renal tubular cells. Altogether our data support the following autocrine pathway in renal tubular cells: ROS > IRF1 > IFNα > IFNARI > CXCL2.
Keywords: AKI, innate immunity, type I interferon
ischemic acute kidney injury (AKI) causes significant short-term morbidity and mortality (33) and, over the long-term, may contribute to the increasing incidence of end-stage renal disease (15, 41, 55). Despite these major clinical implications, there is currently no specific therapy beyond supportive care (33). A major insight into pathogenesis was the recognition that the initial ischemic insult elicits maladaptive responses that exacerbate the injury (31). In other words, the ultimate amount of renal injury is determined not only by the direct effects of hypoxia but also by the ensuing maladaptive responses. Understanding the latter may reveal novel therapeutic targets for the treatment of AKI.
One maladaptive response is the production of type I interferons (IFNs). Knockout of the gene for the α-chain (IFNAR1) of the type I interferon (IFN) receptor heterodimer ameliorated ischemic AKI and decreased renal inflammation in mice (11). Such receptor knockout prevents signaling by, and thus the biological effects of, all type I IFNs (32, 37). These include IFN-ω, IFN-κ, IFNε, about which little is known, and also the better understood IFNβ and the IFNα family (which has 13 members in humans, 14 in mice).1 Their biological effects include increasing inflammation and increasing apoptosis (11). These effects should increase injury during ischemic AKI and are in addition to the more widely known antiviral effects of type I IFNs (36, 54).
Despite their importance in pathogenesis, little is known about the regulation of type I IFN production during ischemic AKI. We address four questions in this study. First, which type I IFNs are produced during ischemic AKI? This question may be important because although all type I IFNs bind to the same heterodimeric receptor (IFNAR), each may elicit a different response due to unique interactions with this receptor (37, 38, 49, 53). Second, which renal cells produce type I IFNs and what regulates this production following ischemia? Third, what regulates type I IFN production? Finally, which cells express the receptor for type I IFN? We now report that renal tubules produce IFNαs but no detectable IFNβ. This IFN production is regulated by reactive oxygen species (ROS) and the transcription factor IRF1. We find that renal tubules express the receptor for type I IFN and are stimulated in an autocrine fashion to produce the proinflammatory chemokine CXCL2, which exacerbates ischemic AKI (30). In contrast to renal tubules, renal leukocytes produce IFNβ but no detectable IFNαs.
METHODS
Animals.
B6.IFNAR(−/−) mice, which have a nonfunctional receptor for all type I IFNs because of transgenic knockout of the R1 chain (IFNAR1) of the heterodimer receptor, were originally from Dr. Michel Aguet (32). The mice used in our studies were a gift from Dr. Chandra Mohan (University of Texas Southwestern Medical Center). The C57BL/6J [IFNAR(+/+)] mice were obtained from the Jackson Laboratories (Bar Harbor, ME). We used 6- to 8-wk-old, male mice according to an approved protocol of the University of Texas Southwestern Medical Center, and according to standards set by the National Institutes of Health.
Murine ischemic AKI model.
Mice were anesthetized using inhaled isoflurane (Fortec System, Fraser Lake, NY), and body temperature was maintained at 37°C using a rectal probe and TR100 temperature controlling system (Fine Science Tools, Foster City, CA). Following laparotomy, the right kidney was removed and the left kidney was then made ischemic by clamping the renal pedicle for 20–30 min with a microvascular clamp during which the wound was covered. Sham surgery consisted of laparotomy, right nephrectomy, and dissection, but the clamp was placed underneath the left renal pedicle without occuding it. Peripheral serum was assayed for creatinine by capillary electrophoresis (O'Brien Center, University of Texas Southwestern).
Histopathology.
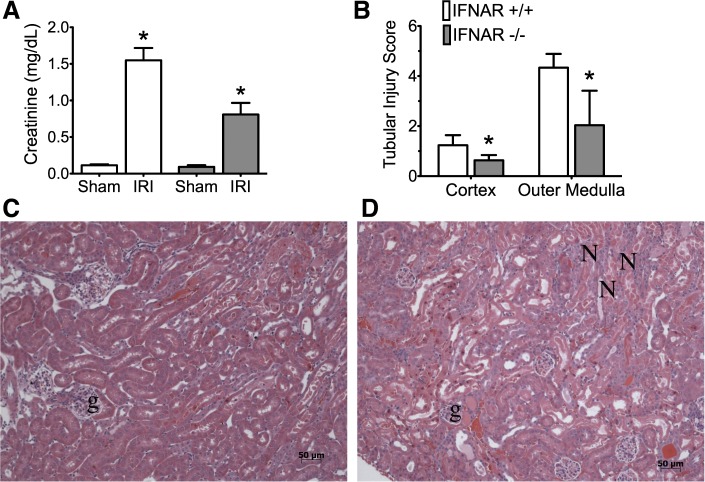
The kidneys were harvested at 24-h reperfusion, bisected, fixed in 10% buffered formalin, embedded in paraffin, sectioned at 4 μm, and stained with hematoxylin and eosin. The slides were examined by our pathologist (X. J. Zhou), who did know the genotype and treatment groups. The cortex and outer medulla of each specimen were examined at ×400 magnification to assess for epithelial necrosis, loss of brush border, tubular dilation, and cast formation. At least 10 fields were reviewed for each slide, and the percentage of tubules displaying these findings was estimated to generate an “injury score” (50); see Fig. 1 legend.
Fig. 1.
Renal function and histology in wild-type type I IFN receptor (IFNR+/+) and IFNAR−/− mice. In A–D, n = 3 per group; means ± SD are shown. A: serum creatinine at 24-h reperfusion. After ANOVA showed significant differences between groups, pairwise comparisons between ischemia-reperfusion injury (IRI) IFNR+/+ vs. IRI IFNAR−/− were conducted (*P < 0.05). B: morphometrics of injury. Hematoxylin and eosin (H&E) sections were scored for tubular injury in the cortex and outer medulla by a pathologist that was blinded to the experimental groups. The percentage of tubules displaying signs of injury were as follows (see methods): 0 = none; 1 = 1 to 10%; 2 = 11 to 25%; 3 = 26 to 45%; 4 = 46 to 75%; and 5 >75%. Pairwise comparison was conducted, *P < 0.05 by t-test. Representative micrographs of H&E-stained sections reveal less necrosis in the IFNAR1 deficient kidneys (C) compared with wild-type (D). N, necrotic tubules; g, glomeruli; magnification: ×20.
Immunofluorescence microscopy.
For IRF1 and IFNα costaining, ischemic kidneys at 4 h reperfusion were fixed in 4% paraformaldehyde for 4 h at 4°C, transferred into 30% sucrose overnight at 4°C, then embedded with OCT (Tissue-Tek, Sacura, CA), and frozen at −80°C. Sections of 7- to 10-μm thickness were fixed to slides in 4% paraformaldehyde, blocked with 10% normal goat serum and then incubated overnight at 4°C with rabbit anti-mouse IFNα at 1:20 dilution (cat. no. 32100–1; PBL Interferon Source, Piscataway, NJ) and mouse-anti-mouse IRF1 (Santa Cruz Biotechnology, Santa Cruz, CA) at 1:500 dilution or with 1:20 dilution of isotype control (normal rabbit IgG; cat. no. sc-2027; Santa Cruz Biotechnology). Goat anti-rabbit-Cy3 (1:500 dilution, 1-h incubation at room temperature, cat.no. 111165144; Jackson Immunoresearch Laboratories, West Grove, PA) was used as the secondary antibody to detect IFNα and VECTOR M.O.M. Immunodetection Kit (Vector Laboratories, Burlingame, CA) was used to detect IRF1 according to the kit protocol.
For IFNAR localization, ischemic kidneys were fixed in Immunohistofix and embedded in Immunohistowax (Intertiles, Brussels, Belgium) according to manufacturer's instructions. Sections of 5 μm were incubated with rabbit anti-mouse IFNAR1 (ab 62693; Abcam, Cambridge, MA), goat anti-rabbit-Cy3 secondary antibody, and then costained with fluorescein-labeled Lotus Tetragonolobus Lectin (LTA; cat. no. FL-1321; Vector Laboratories). Normal rabbit IgG (cat. no. sc-2027; Santa Cruz Biotechnology) was used as isotype control.
All sections were mounted in Vectashield (Vector Laboratories) and viewed by fluorescence microscopy (Carl Zeiss International, Oberkochen, Germany).
In situ hybridization.
To prepare the in situ hybridization probe, previously published primers for CXCL2 (28) amplified their respective fragments from ischemic kidneys. This was subcloned into pDrive cloning Vector (Qiagen PCR Cloning Kit) and S35 labeled sense and antisense probes were prepared. Previously published techniques from our laboratory were used for the in situ hybridiation (44, 61). In sections adjacent to those probed for CXCL2 in situ, collecting duct were identified by antibody to aquaphorin 3, and proximal tubules were identified by staining with TRITC-coupled LTA (43).
Quantitative RT-PCR.
Kidneys were harvested at indicated time points and flash frozen in liquid nitrogen. Total RNA was isolated from the frozen kidneys using RNeasy Midi Kits (cat. no.75144; Qiagen, Valencia, CA), and the RNA concentration was quantified using spectrophotometry at a wavelength of 260 nm. Total RNA from tissue culture cells, or CD45-selected cells, was extracted with RNeasy Mini Kit (Qiagen). All RNA was treated with DNase (Turbo DNA free kit from Applied Biosystems, Foster City, CA) to remove contaminating DNA. Reverse transcription was performed using the High Capacity cDNA reverse transcription kit (Life Technologies, Carlsbad, CA). Real-time PCR was performed using SYBR Green PCR MasterMix (Life Technologies) on an ABI StepOne Plus Real-Time PCR Instrument with 40 cycles, and an annealing temperature of 60°C. The primers used to amply the cDNAs of interest are listed in the Table 1. IFNβ transcript levels were quantified using a commercially available TaqMan primer-probe set (TaqMan Gene Expression Assay for murine IFNβ; cat. no. Mm00439552_s; Life Technologies) and TaqMan Gene Expression Master Mix (Life Technologies).
Table 1.
Primer sequences used in quantitative RT-PCR experiments
| Primer Name | Sequence |
|---|---|
| IFNα4 forward | GCA GAA GTC TGG AGA GCC CTC |
| IFNα4 reverse | TGA GAT GCA GTG TTC TGG TCC |
| IFNα5 forward | CTC AAA GCC TGT GTG ATG CAA |
| IFNα5 reverse | GTG TTT CTT CTC TCT CAG GTA |
| IFNα7 forward | CAT CTG CTG CTT GGG ATG GAT |
| IFNα7 reverse | TTC CTG GGT CAG AGG AGG TTC |
| IRF1 forward | CAC ACG GTG ACA GTG CTG G |
| IRF1 reverse | TAC AGG CCG ATA CAA AGC AGG AGA A |
| GAPDH forward | GGG TGT GAA CCA CGA GAA AT |
| GAPDH reverse | CCT TCC ACA ATG CCA AAG TT |
| TNFα forward | ACG TCG TAG CAA ACC ACC AA |
| TNFα reverse | TTG TCC CTT GAA GAG AAC CTG GGA |
| CXCL2 forward | GCT GGC CAC CAA CCA CCA GG |
| CXCL2 reverse | AGC GAG GCA CAT CAG GTA CG |
Gene of interest expression was normalized to GAPDH gene expression and quantified using the comparative ΔΔCt algorithm (2) with control samples (i.e., sham kidney and blank vector). Confirmation of primer specificity was performed by melting point analysis.
Overexpression of IRF1.
S3 cells were grown in DMEM/F12 (Life Technologies) supplemented with 10% FBS (Thermo Fisher, Waltham, MA) and incubated at 37°C and 5% CO2. This cell line was originally derived from dissected from S3 segments of the proximal tubule of the kidney of an SV40 large T antigen transgenic mouse (19). The overexpression vector used, pCMV-SPORT6 IRF1 (Open Biosystems, Huntsville, AL), contains full-length cDNA of IRF1 driven by the CMV promoter. The vector, pcDNA.3.1 (Life Technologies), was used as empty vector control. S3 cells were grown in six-well culture plates to 80% confluence. The plasmids were then transfected into S3 cells using Fugene HD transfection reagent (Roche, Indianapolis, IN). Total RNA was extracted from cells as described above 30 h following transfection.
IRF1 knockdown in proximal tubule cells.
Murine IRF1 ON-TARGET plus SMART Pool (cat. no. L-046743-01-0010, NM_008390) was purchased from Thermo-Fisher, along with appropriate controls (On-TARGET plus Non-targeting Pool; D-001810-10-05). Single-strand sense and antisense RNA nucleotide were annealed (90°C for 5 min and cooled at room temperature for 1 h) to generate a RNA duplex according to the manufacturer's instructions. Subconfluent cultures of S3 cells grown in six-well plates were incubated with a mixture of 40 nM of small interfering RNA and 6 μl of Lipofectamine 2000 (Life Technologies) according to the manufacturer's instructions for 48 h at 37°C before exposure to ROS. Monolayers were treated with ROS generated by the mixture of 2.5 mM hypoxanthine and 0.005 U/ml xanthine oxidase (both from Sigma-Aldrich, St. Louis, MO) and incubated at 37°C and 5% CO2 for 1 h.
Stimulation of proximal tubule cells by recombinant type I IFNs.
We obtained TKPTS cells from Dr. Bella Reuss (9) and used these in the experiments (see Fig. 8). TKPTS cells were grown in DMEM/F-12 1:1 medium supplemented with penicillin/streptomycin, 5 μg/ml of insulin, and 10% FBS. TKPTS were plated in 12-well tissue culture plates, and after overnight incubation, the culture medium was replaced with fresh medium before stimulation. TKPTS cells were stimulated with various concentrations of recombinant murine IFNα4 or IFNβ (PBL InterferonSource) for 4 h and then total RNA was isolated using RNeasy Mini Kits (Qiagen).
Fig. 8.
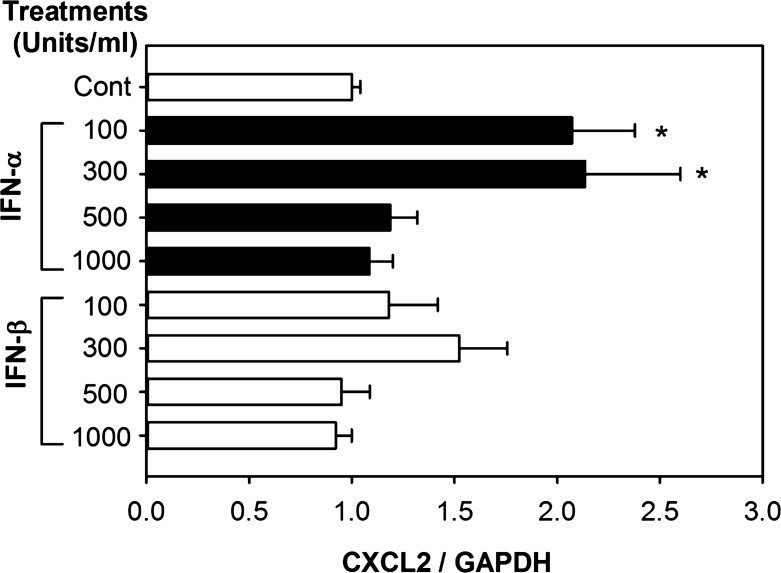
Effects of type I IFN on the expression of CXCL2 in TKPTS cells. TKPTS cells were treated with indicated concentrations of IFNα4 or IFNβ for 4 h, and then total RNA was processed for qRT-PCR. The x-axes represent the fold change of mRNA from treated groups compared with that from the control group and normalized to GAPDH expression using the comparative Ct (ΔΔCt) method. Results are expressed as the fold change of gene of interest/GAPDH mRNA (means ± SD) from at least 3 separate experiments. Statistical analysis was performed by ANOVA followed by pairwise comparisons using the Student-Newman-Keuls method. *P < 0.05, comparing the type I IFN-treated samples with control samples.
Isolation of CD45-positive cells from kidneys.
Sham and ischemic kidneys were harvested at 4-h reperfusion, finely minced with sterile scalpels to <1 mm pieces on ice, then incubated with collagenase mix (Liverase; Rochye Applied Science, Indianapolis, IN) for 20 min at 37°C. Tissue homogenates were transferred through 40-μm cell strainer (Facon; BD Biosciences, San Jose, CA) and washed with PBS. Magnetic beads (Dynabeads; sheep anti-rat IgG; Invitrogen, Oslo, Norway) were incubated/coated with rat anti-mouse CD45 antibodies (Clone 30-F11, eBioscience, San Diego, CA) at 4°C for 1 h (per manufacturer's instructions) and then incubated with tissue homgenates for 20 min at 4°C with gentle rotation and tilting. CD45-positive cells were selected using the Dyna magnet (Invitrogen), while the remaining, unselected cells were considered CD45 negative. Cells were lysed and RNA was isolated using the Rneasy Mini kit described above. CD45 transcripts were 1,000 to 4,000 higher in the CD45 positive compared with the CD45 negative cell population.
Statistical analysis.
Results are presented as means ± SD. The data were compared by ANOVA and the unpaired t-test as appropriate. Significant differences were accepted at P < 0.05. Sigma Plot 2000 software (SPSS, Chicago, IL) was used for statistical analysis, and graphs were generated using Prism Version 5.0d for Mac OS X (GraphPad Software, San Diego, CA; www.graphpad.com).
RESULTS
Type I IFN signaling is required for maximal kidney injury after ischemia.
Genetic knockout of the type I interferon receptor (IFNAR−/−) resulted in a lower serum creatinine at 24 h after ischemia (0.8 ± 0.2 mg/dl compared with 1.6 ± 0.2 mg/dl; n = 3; P = 0.007) in congenic wild-type mice (Fig. 1A) and also less morphologic injury. Morphometrics are shown in Fig. 1B, and representative photomicrographs are shown in Fig. 1, C and D.
Our results illustrate the priniciple that the ultimate amount of renal injury is a result of ischemia plus the maladaptive response. In other words, there is injury to the IFNR knockout kidneys because this knockout does not prevent the initial inschemic insult but blocks extension of the functional and morphologic injury by 50%. In humans, such decreases in the serum creatinine during ischemic AKI might have profound beneficial effects on prognosis in a variety of clinical settings (6, 23, 51, 52).
Our data confirm the one previous report on ischemic AKI in IFNAR−/− mice (11). Although that report investigated downstream maladaptive events of IFNAR stimulation (inflammation, cytokine production, and apoptosis in the whole kidney), upstream events and identification of IFN-producing and IFNARI-expressing cells were not studied and are the focus of our report.
Larger, and more sustained, increases in IFNαs compared with IFNβ after ischemia.
The best-understood type I IFNs are IFNαs and IFNβ; therefore, we studied the expression of these IFNs in total renal RNA isolated at various reperfusion times. Because the members of the IFNα subfamily are so similar structurally (36), no antibodies can differentiate them; furthermore, high homology at the mRNA level (54) also makes differentiating the individual subtypes from each other by RT-PCR challenging. We were able to successfully test nine IFNα subtypes and found that they had the same kinetics of expression (data not shown). In the various Figs. 1–8 of this report, we show data for IFNα4, α5, and α7 because these gave us the most reliable results.
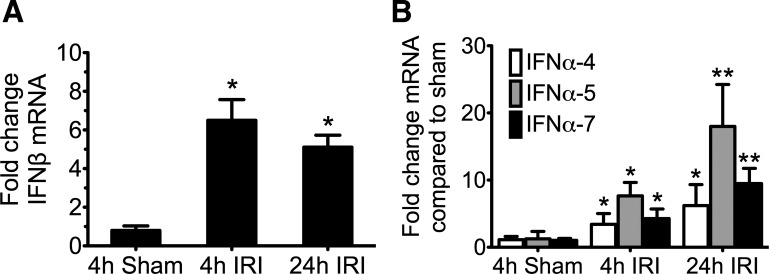
IFNβ mRNA expression peaked at 4-h reperfusion, earlier than IFNαs, and remained at the same elevated expression at 24 h. IFNα expression was detectable at 4 h and continued to increase at 24 h. There was a greater increase in the IFNαs. Thus IFNβ increased by sixfold from sham while IFNα7 increased by 18-fold. Note that the scale of the y-axis in Fig. 2A for IFNβ is from 0 to 10; in contrast the scale of Fig. 2B for IFNα is from 0 to 30.
Fig. 2.
Type I interferon mRNA expression in kidneys during ischemic acute kidney injury (AKI). Mice underwent warm ischemia or sham operation for 24 min, and kidneys were collected for RNA isolation at 4 h or 24 h following reperfusion. The y-axis represents the fold change of mRNA compared with the 4-h sham group and normalized to GAPDH expression using the comparative Ct method (ΔΔCt). A: interferon-β (IFNβ) expression peaks early and is sustained. B: expression of the interferon-α (IFNα) subtypes continues to increase at 24 h. In A and B, n = 4 for each group; means ± SD are depicted. *P < 0.05, using Student's t-test comparing the quantitative (q)RT-PCR fold change in the IRI group vs. the 4-h sham group. **P < 0.05, when comparing the 24 h to the 4-h AKI group (IFNα4 P = 0.16; IFNα5 P = 0.02; and IFNα7 P = 0.008).
Ischemic renal tubules express IFNαs but no detectable IFNβ.
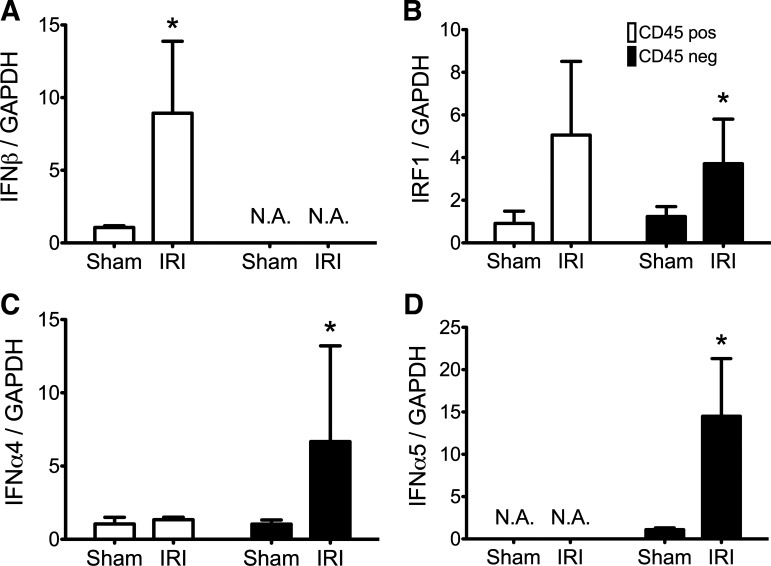
We also found that different cells expressed IFNβ and IFNαs. Ischemic renal tubules increased their expression of IFNαs but not IFNβ; in contrast, ischemic renal leukocytes increased their expression of IFNβ but not IFNαs. We used two different techniques to reach this conclusion. First, we studied cells from kidneys disrupted by mechanical and enzymatic treatment; we then used anti-CD45-coated magnetic beads to isolate leukocytes (which are CD45-positive) from all other cells. We previously validated this technique (5). Expression of IFNβ, but not the IFNαs, was increased in CD45-positive leukocytes from ischemic kidneys (Fig. 3, open bars). In contrast, expression of the IFNαs, but not IFNβ, was increased in the renal parenchymal cell population (Fig. 3, filled bars). Second, we studied sections of whole kidneys by immunohistology. The IFNα-expressing ischemic renal parenchymal cells from disrupted kidneys were identified by immunohistology as renal tubule cells (Fig. 4). We did not detect IFNβ protein on renal tubules.
Fig. 3.
Renal CD45 positive leukocytes (open bars) express IFNβ not IFNα; renal CD45-negative paarenchymal cells (filled bars) express IFNα not IFNβ. At 4-h reperfusion, CD45-positive or -negative cells were isolated from enzymatically disrupted kidneys as detailed in methods. RNA was processed for qRT-PCR of the different type I IFN species. The y-axes represent the fold change of mRNA compared with the sham surgery group and normalized to GAPDH expression using the comparative Ct (ΔΔCt) method. Mean fold change and SD are depicted in A–D; n = 6 for each group. *P < 0.05, with Student's t-test or Mann-Whitney test compared with sham sample within the CD45 population; N.A., no amplification for gene of interest. A: IFNβ expression is increased in the CD45-positive population; no IFNβ transcripts amplified in the CD45 negative population. B: IRF1 expression is increased in both populations but did not reach statistical significance for the CD45-positive samples (P = 0.0549 for CD45 positive; P < 0.03 for CD45 negative). C and D: IFNα4 and IFNα5 expression increases in CD45-negative population following IRI.
Fig. 4.
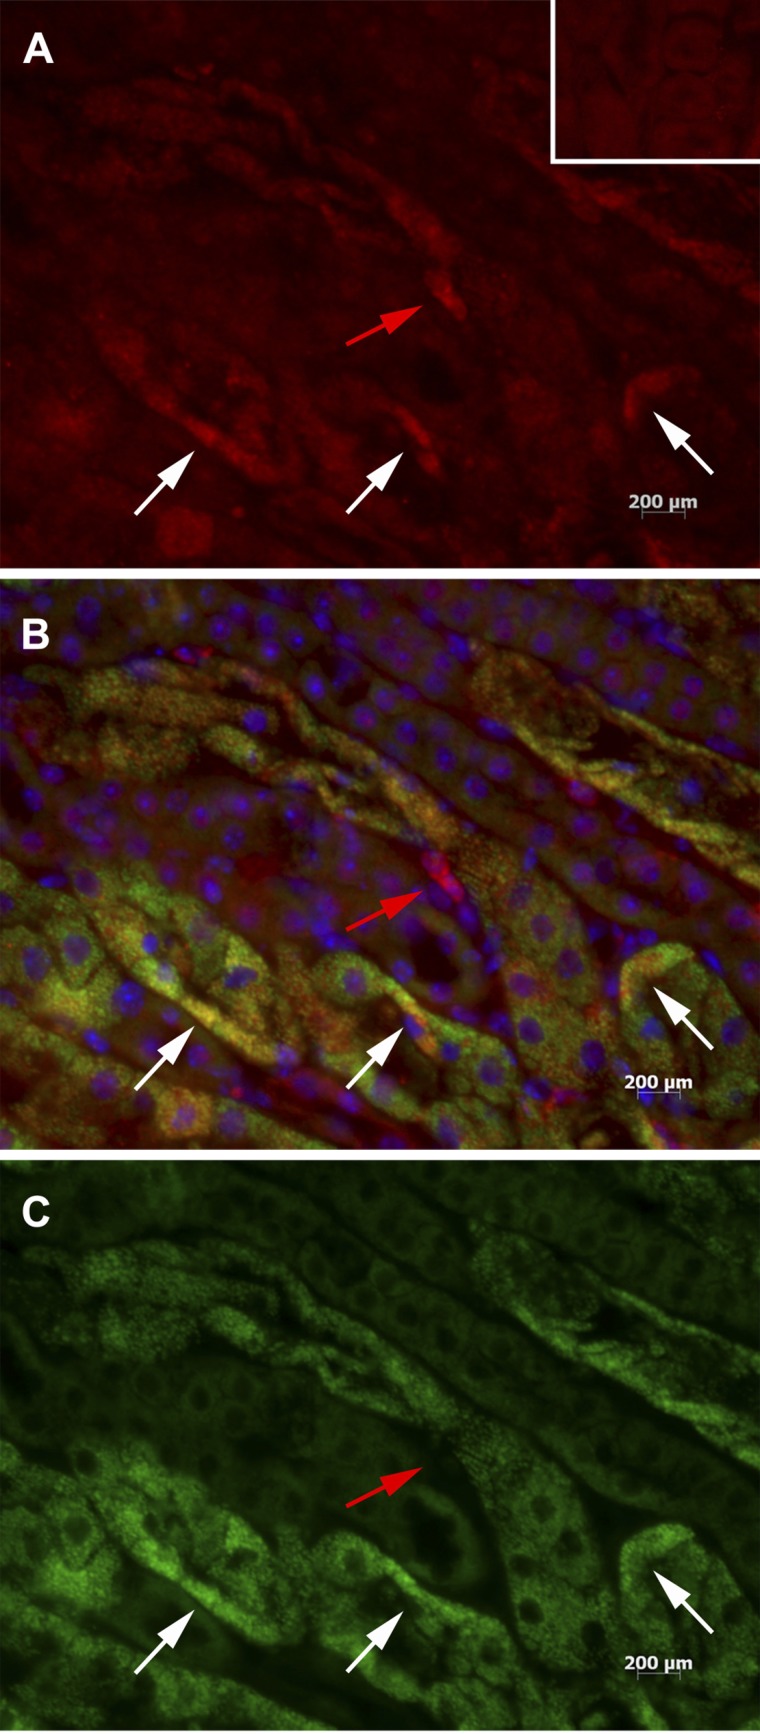
IRF1 colocalizes with IFNα in vivo following IRI. Sections of ischemic kidneys 4 h after reperfusion were stained with anti-IFNα and anti-IRF1 antibodies. Anti-IFNα stains red (A), anti-IRF1 stains green (C), and a merged image (B) shows tubule cells that stain for both IRF1 and IFNα as yellow. DAPI stains the nuclei blue. White arrows show that many tubular cells stain for both IFNα and IRF1. Red arrow shows a tubular cell that stains for IFNα but not IRF1. A, inset: staining for anti-IFNα antibody isotype control. Magnification: ×40.
Thus, our two techniques independently confirm that IFNαs, but not IFNβ, are expressed by tubules after ischemia. Such expression of IFNαs in vivo has not, to our knowledge, previously been reported. Therefore, we focused our efforts on this novel finding.
Regulation of tubular IFNα production by ROS and IRF1.
To understand how IFNα is regulated in renal tubules, we chose to study IRF1. This choice was based on three previous observations: 1) overexpression of this transcription factor increases IFNα but not IFNβ gene expression in vitro (3, 4, 10, 48, 57); 2) we previously showed that genetic knockout of IRF1 ameliorated injury (56) and concluded that IRF1 has an important maladaptive role during ischemic AKI; and 3) we found that IRF1 is expressed in vivo very early following ischemia (within 15 min) and therefore is a prime candidate to regulate early maladaptive genes (56).
If IRF1 regulates expression of IFNαs by renal tubular cells, then the IRF1 transcription factor and IFNα must be expressed in the same cell. Our immunohistology showed that this was indeed true. Sections of ischemic kidneys early following reperfusion (4 h) show colocalization of IRF1 and IFNα in proximal tubule cells via immunofluorescence staining (Fig. 4). Although the majority of IRF1 and IFNα are found in the same cells, a few cells stain for IFNα alone, suggesting that other regulatory pathways also exist.
Note that Fig. 3B, C, and D, which examined cells isolated from enzymatically dispersed ischemic kidneys, is consistent with the immunohistology above. IRF1 and IFNα are both found in the CD45-negative parenchymal cells; this population includes renal tubular cells.
IRF1 regulates the ROS-driven IFNα expression by renal tubule cells in vitro.
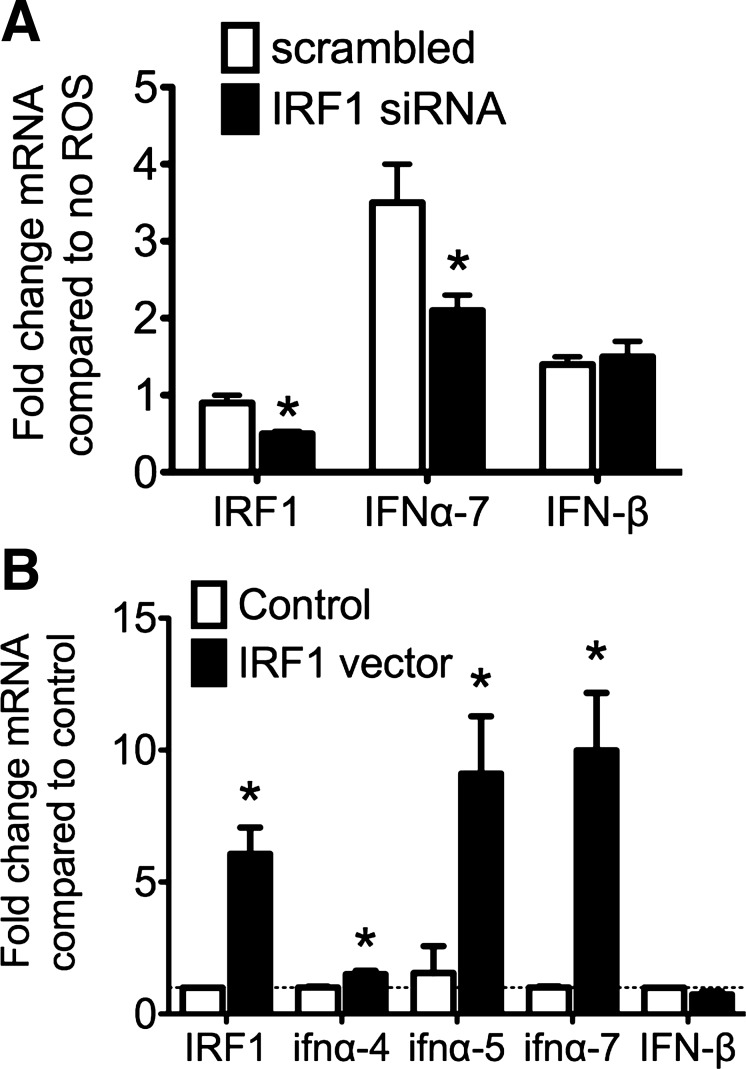
Having shown the colocalization of IRF1 and IFNα in tubule cells in vivo, we investigated the effect of knockdown and overexpression of IRF1 on IFNα expression in proximal tubule cells in vitro. We previously showed that ROS generated during ischemia (34, 35, 58) increases the expression of IRF1 in proximal tubule cells in vitro (56). We now find that IFNα mRNA is significantly increased in tubule cells following exposure to ROS in vitro, and this increase is prevented by IRF1 knockdown (Fig. 5A). We also found that expression of IFNαs, but not IFNβ, was increased by overexpression of IRF1 (Fig. 5B).
Fig. 5.
IRF1 regulates the expression of IFNα in vitro in response to reactive oxygen species (ROS). A: small interfering (si)RNA knockdown of IRF1. Immortalized proximal tubule cells (S3 cells) were transfected with siRNA or scrambled RNA against IRF1 and then exposed to ROS for 1 h. IFNα and IFNβ transcripts were measured using qRT-PCR and quantified using the comparative Ct method relative to cells that were not exposed to ROS and normalized to GAPDH expression, represented on the y-axis. Means ± SD are shown; n = 3 per group. *P <0.05, by t-test compared with scrambled expression (IRF1 P = 0.002; IFNα7 P = 0.048; and IFNβ P = 0.8). B: overexpression of IRF1 in vitro. Renal tubule cells were transfected with plasmid containing a CMV-driven overexpression of IRF1 or empty plasmid then assessed for expression of type I IFN via qRT-PCR. The y-axis represents fold change in mRNA transcripts compared with expression levels in the cells receiving the empty (control) plasmid and the x-axis labels the qRT-PCR targets. Means ± SD are shown with n = 3 per group. *P <0.05, by t-test compared with control vector (IRF1 P = 0.037; IFNα4 P = 0.019; IFNα5 P = 0.034; IFNα7 P = 0.015; and IFNβ P = 0.1).
Altogether, the above in vivo immunohistology and the in vitro IRF1 knockdown and overexpression data are consistent with the following sequence: ischemia/reperfusion leads to ROS production, which increases IRF1 expression, which then regulates the expression of IFNαs in renal tubular cells.
The type I IFN receptor (IFNAR) is expressed on proximal tubule cells.
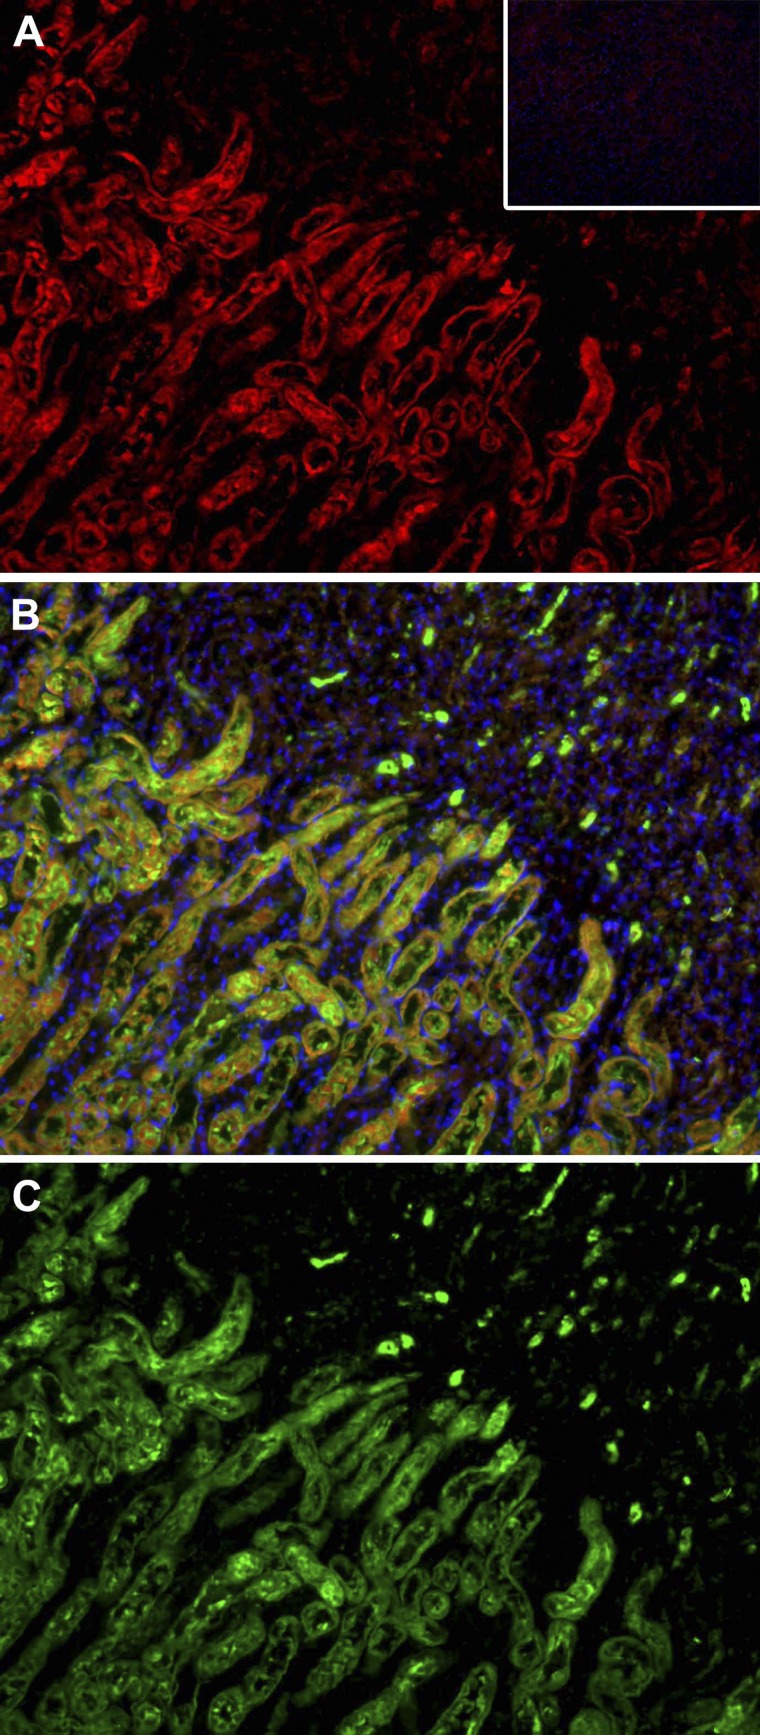
To our knowledge, the localization of the IFNAR during ischemic AKI has not previously been examined (7). We found strong expression on proximal tubules that were identified by costaining with LTA (Fig. 6) (22, 42).
Fig. 6.
IFNAR1 is localized in the proximal tubules in the outer stripe of the outer medulla. A: wild-type ischemic kidneys were stained with anti-IFNAR1 antibodies and secondary antibody conjugated to Cy3 (red). Normal rabbit serum was used as isotype control and resulted in no signal following secondary antibody incubation (inset). C: the same sections were also stained with fluorescein-labeled Lotus Tetragonolobus Lectin (LTA), which stains proximal tubules green. B: merged images reveal that many proximal tubules in the ischemic kidney sections stain with both LTA and anti-IFNAR1. Magnification: ×20.
The presence of IFNAR on renal tubules suggests that these cells may be regulated in an autocrine fashion by the IFNα they produce. Specifically, IFNα may stimulate production of maladaptive CXCL2 (also known as MIP2). This hypothesis is suggested by three published observations: 1) production of CXCL2 is increased during ischemic AKI (25); 2) CXCL2 exacerbates injury during ischemic AKI because its inhibition ameliorates disease (30); and 3) genetic knockout of IFNAR inhibits production of CXCL2 (11). However, a direct link between stimulation of renal tubular IFNAR1 and production of CXCL2 has not previously been demonstrated.
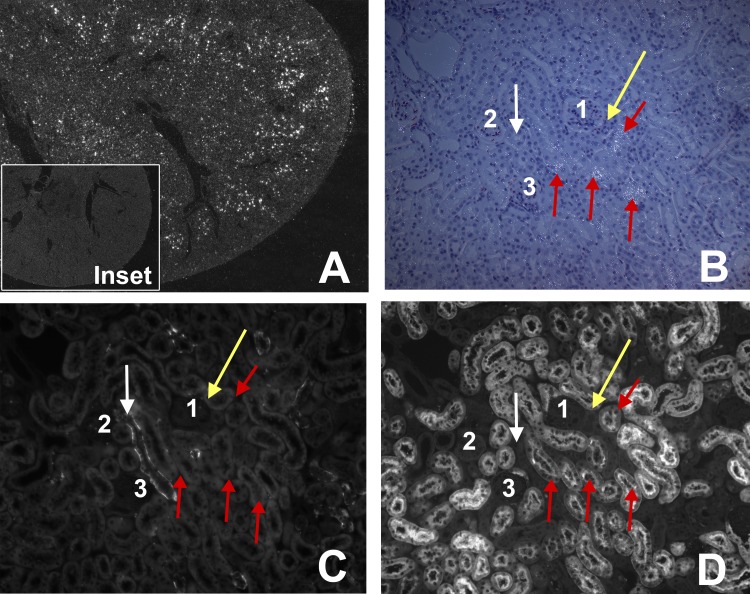
Our data suggest such a link: we found that CXCL2 is produced by the proximal tubules in vivo (Fig. 7). These are the same cells that express IFNAR (Fig. 6). We also stimulated renal tubular cells in vitro with IFNα or IFNβ. CXCL2 expression was stimulated more effectively by IFNα than by IFNβ (Fig. 8).
Fig. 7.
The neutrophil chemokine CXCL2 is expressed by proximal tubules of ischemic TLR4-sufficient kidneys 4 h after reperfusion. A: 2.5× of ischemic kidney. White dots indicate CXCL2 mRNA in the outer medulla. Inset: absence of CXCL2 mRNA in the nonischemic kidney. B, C, and D are serial sections. A: low-power darkfield in situ hybridization where bright dots are CXCL2 mRNA; B: combined dark and bright field at high power; bright dots are CXCL2 mRNA. C: stained with anti-aquaphorin 3 for collecting ducts. D: stained with LTA for proximal tubules. 1, 2, and 3 show the same glomeruli in B, C, and D. Red arrows show 3 proximal tubules that have white dots for CXCL2 mRNA in B, no staining for aquaphorin 3 (collecting duct) in C, and positive staining for LTA (proximal tubule) in D. White arrow shows a collecting duct that have no white dots (CXCL2) in B, positive staining for aquaphorin 3 (collecting duct) in C, and no staining for LTA (proximal tubule) in D. Gold arrow shows distal convoluted tubule that is negative for white dots (MIP2) in B, no staining for aquaphorin 3 (collecting duct) in C, and no staining for LTA (proximal tubule) in D.
DISCUSSION
The ultimate amount of renal injury during ischemic AKI is the result of the initial ischemic insult plus the ensuing maladaptive response (31). We now confirm a previous report (11) that production of type I IFN is one maladaptive response. These data are consistent with the maladaptive role of type I IFN in hepatic ischemia (59) and sterile injury of the brain (20). Although a role for type I IFN during ischemia-reperfusion injury has been established, which cells produce type I IFNs during ischemic AKI and what regulates IFN production were not known.
In this report, we focus on IFNβ and IFNαs, which are the best understood of the type I IFN family. We show that renal tubules produce IFNαs and leukocytes produce IFNβ during ischemic AKI. This conclusion is supported by two techniques: investigation of IFN production by isolated leukocytes vs. renal parenchymal cells and immunohistology of renal tissue sections. The production of IFNαs by ischemic renal tubules in vivo is a novel observation and is a major focus of our report. We found that production of IFNα by renal tubules is regulated by ROS present during ischemic AKI. The ROS activates the transcription factor IRF1 that then increases the transcription of IFNα genes. These conclusions are based on our following observations:
1) We find the IRF1 transcription factor and its putative regulated IFNα protein in the same tubules by immunohistology after ischemia (Fig. 4).
2) We find IRF1 and IFNα mRNA on the same CD45-negative parenchymal cells isolated from enzymatically dispersed ischemic kidneys (Fig. 3). This population includes renal tubular cells. This technique independently confirms the immunohistology discussed in “1” above.
3) We previously reported increased expression of IRF1 by renal tubule cells exposed to ROS in vitro (56). We now confirm and extend this result by showing ROS also stimulated expression of IFNαs (Fig. 5).
4) We show that small interfering RNA knockdown of IRF1 inhibited IFNα expression after ROS treatment (Fig. 5).
5) In addition, we showed that overexpression of IRF1 results in IFNα expression (Fig. 5).
We show that the type I IFN receptor (IFNAR) is expressed by renal tubules (Fig. 6). This allows these tubules to be regulated by IFNα in an autocrine fashion. One downstream effect of IFNα stimulation of renal tubules is the production of CXCL2. Production of this chemokine is required for maximal injury and inflammation during ischemic AKI in vivo (25, 30) and depends on functional IFNAR in vivo (11). We found that CXCL2 is produced by renal tubules in vivo (Fig. 7) and in vitro after stimulation by IFNα (Fig. 8). The greater response to IFNα, opposed to IFNβ, is consistent the known different responses elicited by the different type I IFNs (37, 38, 49, 53).
In contrast, renal leukocytes produce IFNβ but not IFNα (Fig. 3). Quantitative RT-PCR amplified IFNβ transcripts only in the CD45-positive leukocyte population from enzymatically dispersed ischemic kidneys. The regulation of IFNβ in these leukocytes is beyond the scope of this report. A possibility is that TLR4 regulates IFNβ; this occurs in macrophages during hepatic ischemic injury (59).
Most previous studies have focused on type I IFN production in response to infections, usually viral infections, and not on production in response to ischemia reperfusion. The transcription factors responsible for activating the type I IFN genes after infection are not IRF1 (40, 47, 57) but other members of this transcription factor family, usually IRF3 and 7 (47). Our results that different members of the IRF transcription family respond to different stimuli. IRF3 and 7 respond to infections; IRF1 to ROS. Thus we may have demonstrated a novel pathway of type I IFN gene activation where the sequence is ischemia/reperfusion >>> ROS >>> IRF1 >>> IFNαs.
Our report reinforces the recent recognition that ROS may act as signaling molecules (39). ROS are produced in response to ischemia-reperfusion (34, 35, 58). These ROS have both reversible (“redox” signaling) and irreversible “free radical” effects. Previous work focused on the latter. These catastrophic “free radical” effects of high concentrations of ROS kill cells by irreversibly oxidizing and damaging macromolecules, by inducing apoptosis, and by opening mitochondrial permeability transition pore, which causes “necroapoptosis” (12, 13). In contrast, the “redox” signaling effects are mediated by the reversible oxidation of amino acids, such as cysteines, that change protein conformation and thus function (8, 14, 17, 18). Ongoing studies in our laboratory aim to understand how ROS activates the transcription of IRF1.
A large body of work supports the concept that ischemic renal injury recruits an inflammatory response (1, 16, 21, 45). Some parts of this inflammation are maladaptive because inhibiting the inflammation ameliorates injury, as in this report. However, other parts of the inflammation are adaptive because some leukocytes produce growth factors that facilitate repair (for example, see refs. 24, 26, 27, 29, 46, 60). In addition, leukocytes may have maladaptive or adaptive roles at various times after ischemic injury.
In conclusion, in this study we show a maladaptive effect of type I IFN in ischemic AKI. Furthermore, we show that IFNαs are produced by ischemic renal tubules in response to ROS. We find that the transcription factor IRF1 mediates this response to ROS.
GRANTS
The preceding work was supported by National Institute of Diabetes and Digestive and Kidney Diseases Grant RO1-DK-069633 and Beecherl Foundation Grant (to C. Y. Lu), National Institute of Diabetes and Digestive and Kidney Diseases Grant T32-DK-07257 (to P. D. Winterberg), National Institute of Diabetes and Digestive and Kidney Diseases Grants F32-DK-084701 and T32-DK-07257 (to J. R. Hartono), a Genzyme Nephrology Fellowship (to Y. Wang), and the University of Texas Southwestern O'Brien Kidney Research Core Center (National Institute of Diabetes and Digestive and Kidney Diseases Grant DK-079328).
DISCLOSURES
No conflicts of interest, financial or otherwise, are declared by the author(s).
AUTHOR CONTRIBUTIONS
Author contributions: P.D.W., Y.W., and C.Y.L. conception and design of research; P.D.W., Y.W., K.-M.L., J.R.H., G.T.N., X.J.Z., and J.M.S. performed experiments; P.D.W., Y.W., and C.Y.L. analyzed data; P.D.W., K.-M.L., J.M.S., J.A.R., and C.Y.L. interpreted results of experiments; P.D.W., Y.W., and K.-M.L. prepared figures; P.D.W. drafted manuscript; P.D.W. and C.Y.L. edited and revised manuscript; P.D.W., Y.W., K.-M.L., J.R.H., G.T.N., X.J.Z., J.M.S., J.A.R., and C.Y.L. approved final version of manuscript.
ACKNOWLEDGMENTS
We thank Kathy Trueman for assistance in preparing the figures and Philip Chen for excellent technical assistance. We thank Dr. Elsa Bella-Reuss for permission to use her PKTPS cells, and to Dr. Robert Safirstein for providing those cells to us.
Present address for P. D. Winterberg: Division of Pediatric Nephrology, Emory School of Medicine, Atlanta, GA.
Footnotes
We use the abbreviation “IFNαs” to indicate all members of the IFNα family.
REFERENCES
- 1.Bonventre JV, Zuk A. Ischemic acute renal failure: an inflammatory disease? Kidney Int 66: 480–485, 2004 [DOI] [PubMed] [Google Scholar]
- 2.Bookout AL, Cummins CL, Mangelsdorf DJ, Pesola JM, Kramer MF. High-throughput real-time quantitative reverse transcription PCR. Curr Protoc Mol Biol 15: 15–18, 2006 [DOI] [PubMed] [Google Scholar]
- 3.Brzostek-Racine S, Gordon C, Van Scoy S, Reich NC. The DNA damage response induces IFN. J Immunol 187: 5336–5345, 2011 [DOI] [PMC free article] [PubMed] [Google Scholar]
- 4.Carey MF, Peterson CL, Smale ST. Confirming the functional importance of a rotein-DNA interaction. In: Transcriptional Regulation in Eukaryotes. Cold Spring Harbor, NY: Cold Spring Harbor Laboratory Press, 2009, p. 237–260 [DOI] [PubMed] [Google Scholar]
- 5.Chen J, Hartono J, John R, Bennett M, Zhou X, Wang Y, Wu Q, Winterberg P, Nagami GT, Lu CY. Interleukin 6 production by leukocytes during ischemic acute kidney injury is regulated by TLR4. Kidney Int 80: 504–515, 2011 [DOI] [PMC free article] [PubMed] [Google Scholar]
- 6.Chertow GM, Burdick E, Honour M, Bonventre JV, Bates DW. Acute kidney injury, mortality, length of stay, and costs in hospitalized patients. J Am Soc Nephrol 16: 3365–3370, 2005 [DOI] [PubMed] [Google Scholar]
- 7.de Weerd NA, Nguyen T. The interferons and their receptors–distribution and regulation. Immunol Cell Biol 90: 483–491, 2012 [DOI] [PMC free article] [PubMed] [Google Scholar]
- 8.Droge W. Free radicals in the physiological control of cell function. Physiol Rev 82: 47–95, 2002 [DOI] [PubMed] [Google Scholar]
- 9.Ernest S, Bello-Reuss E. Expression and function of P-glycoprotein in a mouse kidney cell line. Am J Physiol Cell Physiol 269: C323–C333, 1995 [DOI] [PubMed] [Google Scholar]
- 10.Ford E, Thanos D. The transcriptional code of human IFN-beta gene expression. Biochim Biophys Acta 1799: 328–336, 2010 [DOI] [PubMed] [Google Scholar]
- 11.Freitas MC, Uchida Y, Lassman C, Danovitch GM, Busuttil RW, Kupiec-Weglinski JW. Type I interferon pathway mediates renal ischemia/reperfusion injury. Transplantation 92: 131–138, 2011 [DOI] [PMC free article] [PubMed] [Google Scholar]
- 12.Galluzzi L, Blomgren K, Kroemer G. Mitochondrial membrane permeabilization in neuronal injury. Nat Rev Neurosci 10: 481–494, 2009 [DOI] [PubMed] [Google Scholar]
- 13.Hall AM. Pores for thought: new strategies to re-energize stressed mitochondria in acute kidney injury. J Am Soc Nephrol 22: 986–989, 2011 [DOI] [PubMed] [Google Scholar]
- 14.Halliwell B. Biochemistry of oxidative stress. Biochem Soc Trans 35: 1147–1150, 2007 [DOI] [PubMed] [Google Scholar]
- 15.Hsu CY. Yes, AKI truly leads to CKD. J Am Soc Nephrol 23: 967–969, 2012 [DOI] [PubMed] [Google Scholar]
- 16.Jang HR, Rabb H. The innate immune response in ischemic acute kidney injury. Clin Immunol 130: 41–50, 2009 [DOI] [PMC free article] [PubMed] [Google Scholar]
- 17.Jones DP. Radical-free biology of oxidative stress. Am J Physiol Cell Physiol 295: C849–C868, 2008 [DOI] [PMC free article] [PubMed] [Google Scholar]
- 18.Jones DP, Go YM. Redox compartmentalization and cellular stress. Diabetes Obes Metab 12, Suppl 2: 116–125, 2010 [DOI] [PMC free article] [PubMed] [Google Scholar]
- 19.Kauntiz JD, Smith Cummins VP, Misler D, Nagami GT. Inhibition of gentamicin uptake into cultured mouse proximal tubule epitelial cells by L-lysine. J Clin Pharmacol 33: 63–69, 1993 [DOI] [PubMed] [Google Scholar]
- 20.Khorooshi R, Owens T. Injury-induced type I IFN signaling regulates inflammatory responses in the central nervous system. J Immunol 185: 1258–1264, 2010 [DOI] [PubMed] [Google Scholar]
- 21.Kinsey GR, Li L, Okusa MD. Inflammation in acute kidney injury. Nephron Exp Nephrol 109: e102–107, 2008 [DOI] [PMC free article] [PubMed] [Google Scholar]
- 22.Laitinen L, Virtanen I, Saxen L. Changes in the glycosylation pattern during embryonic development of mouse kidney as revealed with lectin conjugates. J Histochem Cytochem 35: 55–65, 1987 [DOI] [PubMed] [Google Scholar]
- 23.Lassnigg A, Schmidlin D, Mouhieddine M, Bachmann LM, Druml W, Bauer P, Hiesmayr M. Minimal changes of serum creatinine predict prognosis in patients after cardiothoracic surgery: a prospective cohort study. J Am Soc Nephrol 15: 1597–1605, 2004 [DOI] [PubMed] [Google Scholar]
- 24.Lee S, Huen S, Nishio H, Nishio S, Lee HK, Choi BS, Ruhrberg C, Cantley LG. Distinct macrophage phenotypes contribute to kidney injury and repair. J Am Soc Nephrol 22: 317–326, 2011 [DOI] [PMC free article] [PubMed] [Google Scholar]
- 25.Lemay S, Rabb H, Postler G, Singh AK. Prominent and sustained up-regulation of gp130–signaling cytokines and of the chemokine MIP 2 in murine renal ischemia–reperfusion injury. Transplantation 69: 959–963, 2000 [DOI] [PubMed] [Google Scholar]
- 26.Li L, Huang L, Ye H, Song SP, Bajwa A, Lee SJ, Moser EK, Jaworska K, Kinsey GR, Day YJ, Linden J, Lobo PI, Rosin DL, Okusa MD. Dendritic cells tolerized with adenosine A2AR agonist attenuate acute kidney injury. J Clin Invest 122: 3931–3942, 2012 [DOI] [PMC free article] [PubMed] [Google Scholar]
- 27.Lin SL, Li B, Rao S, Yeo EJ, Hudson TE, Nowlin BT, Pei H, Chen L, Zheng JJ, Carroll TJ, Pollard JW, McMahon AP, Lang RA, Duffield JS. Macrophage Wnt7b is critical for kidney repair and regeneration. Proc Natl Acad Sci USA 107: 4194–4199, 2010 [DOI] [PMC free article] [PubMed] [Google Scholar]
- 28.Luan J, Furuta Y, Du J, Richmond A. Developmental expression of two CXC chemokines, MIP-2 and KC, and their receptors. Cytokine 14: 253–263, 2001 [DOI] [PMC free article] [PubMed] [Google Scholar]
- 29.Menke J, Iwata Y, Rabacal WA, Basu R, Yeung YG, Humphreys BD, Wada T, Schwarting A, Stanley ER, Kelley VR. CSF-1 signals directly to renal tubular epithelial cells to mediate repair in mice. J Clin Invest 119: 2330–2342, 2009 [DOI] [PMC free article] [PubMed] [Google Scholar]
- 30.Miura M, Fu X, Zhang QW, Remick DG, Fairchild RL. Neutralization of Gro alpha and macrophage inflammatory protein-2 attenuates renal ischemia/reperfusion injury. Am J Pathol 159: 2137–2145, 2001 [DOI] [PMC free article] [PubMed] [Google Scholar]
- 31.Molitoris BA. Transitioning to therapy in ischemic acute renal failure. J Am Soc Nephrol 14: 265–267, 2003 [DOI] [PubMed] [Google Scholar]
- 32.Muller U, Steinhoff U, Reis LF, Hemmi S, Pavlovic J, Zinkernagel RM, Aguet M. Functional role of type I and type II interferons in antiviral defense. Science 264: 1918–1921, 1994 [DOI] [PubMed] [Google Scholar]
- 33.Murugan R, Kellum JA. Acute kidney injury: what's the prognosis? Nat Rev Nephrol 7: 209–217, 2011 [DOI] [PMC free article] [PubMed] [Google Scholar]
- 34.Nath KA, Norby SM. Reactive oxygen species and acute renal failure. Am J Med 109: 665–678, 2000 [DOI] [PubMed] [Google Scholar]
- 35.Paller MS, Neumann TV. Reactive oxygen species and rat renal epithelial cells during hypoxia and reoxygenation. Kidney Int 40: 1041–1049, 1991 [DOI] [PubMed] [Google Scholar]
- 36.Pestka S, Krause CD, Walter MR. Interferons, interferon-like cytokines, and their receptors. Immunol Rev 202: 8–32, 2004 [DOI] [PubMed] [Google Scholar]
- 37.Platanias LC. Mechanisms of type-I- and type-II-interferon-mediated signalling. Nat Rev Immunol 5: 375–386, 2005 [DOI] [PubMed] [Google Scholar]
- 38.Rani MR, Ransohoff RM. Alternative and accessory pathways in the regulation of IFN-beta-mediated gene expression. J Interferon Cytokine Res 25: 788–798, 2005 [DOI] [PubMed] [Google Scholar]
- 39.Ray PD, Huang BW, Tsuji Y. Reactive oxygen species (ROS) homeostasis and redox regulation in cellular signaling. Cell Signal 24: 981–990, 2012 [DOI] [PMC free article] [PubMed] [Google Scholar]
- 40.Reis LF, Ruffner H, Stark G, Aguet M, Weissmann C. Mice devoid of interferon regulatory factor 1 (IRF-1) show normal expression of type I interferon genes. EMBO J 13: 4798–4806, 1994 [DOI] [PMC free article] [PubMed] [Google Scholar]
- 41.Rifkin DE, Coca SG, Kalantar-Zadeh K. Does AKI truly lead to CKD? J Am Soc Nephrol 23: 979–984, 2012 [DOI] [PMC free article] [PubMed] [Google Scholar]
- 42.Schulte BA, Spicer SS. Histochemical evaluation of mouse and rat kidneys with lectin-horseradish peroxidase conjugates. Am J Anat 168: 345–362, 1983 [DOI] [PubMed] [Google Scholar]
- 43.Shao X, Somlo S, Igarashi P. Epithelial-specific Cre/Lox recombination in the developing kidney and genitourinary tract. J Am Soc Nephrol 13: 1837–1846, 2002 [DOI] [PubMed] [Google Scholar]
- 44.Shelton JM, Lee MH, Richardson JA, Patel SB. Microsomal triglyceride transfer protein expression during mouse development. J Lipid Res 41: 532–537, 2000 [PubMed] [Google Scholar]
- 45.Sutton TA, Fisher CJ, Molitoris BA. Microvascular endothelial injury and dysfunction during ischemic acute renal failure. Kidney Int 62: 1539–1549, 2002 [DOI] [PubMed] [Google Scholar]
- 46.Tadagavadi RK, Reeves WB. Renal dendritic cells ameliorate nephrotoxic acute kidney injury. J Am Soc Nephrol 21: 53–63, 2010 [DOI] [PMC free article] [PubMed] [Google Scholar]
- 47.Tamura T, Yanai H, Savitsky D, Taniguchi T. The IRF family transcription factors in immunity and oncogenesis. Annu Rev Immunol 26: 535–584, 2008 [DOI] [PubMed] [Google Scholar]
- 48.Taniguchi T, Ogasawara K, Takaoka A, Tanaka N. Irf family of transcription factors as regulators of host defense. Annu Rev Immunol 19: 623–655, 2001 [DOI] [PubMed] [Google Scholar]
- 49.Thomas C, Moraga I, Levin D, Krutzik Peter O, Podoplelova Y, Trejo A, Lee C, Yarden G, Vleck Susan E, Glenn Jeffrey S, Nolan Garry P, Piehler J, Schreiber G, Garcia KC. Structural linkage between ligand discrimination and receptor activation by type I interferons. Cell 146: 621–632, 2011 [DOI] [PMC free article] [PubMed] [Google Scholar]
- 50.Thurman JM, Holers VM. The central role of the alternative complement pathway in human disease. J Immunol 176: 1305–1310, 2006 [DOI] [PubMed] [Google Scholar]
- 51.Tian J, Barrantes F, Amoateng-Adjepong Y, Manthous CA. Rapid reversal of acute kidney injury and hospital outcomes: a retrospective cohort study. Am J Kidney Dis 53: 974–981, 2009 [DOI] [PubMed] [Google Scholar]
- 52.Uchino S, Bellomo R, Bagshaw SM, Goldsmith D. Transient azotaemia is associated with a high risk of death in hospitalized patients. Nephrol Dial Transplant 25: 1833–1839, 2010 [DOI] [PubMed] [Google Scholar]
- 53.Uze G, Schreiber G, Piehler J, Pellegrini S. The receptor of the type I interferon family. Curr Top Microbiol Immunol 316: 71–95, 2007 [DOI] [PubMed] [Google Scholar]
- 54.van Pesch V, Lanaya H, Renauld JC, Michiels T. Characterization of the murine alpha interferon gene family. J Virol 78: 8219–8228, 2004 [DOI] [PMC free article] [PubMed] [Google Scholar]
- 55.Venkatachalam MA, Griffin KA, Lan R, Geng H, Saikumar P, Bidani AK. Acute kidney injury: a springboard for progression in chronic kidney disease. Am J Physiol Renal Physiol 298: F1078–F1094, 2010 [DOI] [PMC free article] [PubMed] [Google Scholar]
- 56.Wang Y, John R, Chen J, Richardson JA, Shelton JM, Bennett M, Zhou XJ, Nagami GT, Zhang Y, Wu QQ, Lu CY. IRF-1 promotes inflammation early after ischemic acute kidney injury. J Am Soc Nephrol 20: 1544–1555, 2009 [DOI] [PMC free article] [PubMed] [Google Scholar]
- 57.Wathelet MG, Lin CH, Parekh BS, Ronco LV, Howley PM, Maniatis T. Virus infection induces the assembly of coordinately activated transcription factors on the IFN-beta enhancer in vivo. Mol Cell 1: 507–518, 1998 [DOI] [PubMed] [Google Scholar]
- 58.Zager RA, Fuerstenberg SM, Baehr PH, Myerson D, Torok-Storb B. An evaluation of antioxidant effects on recovery from postischemic acute renal failure. J Am Soc Nephrol 4: 1588–1597, 1994 [DOI] [PubMed] [Google Scholar]
- 59.Zhai Y, Qiao B, Gao F, Shen X, Vardanian A, Busuttil RW, Kupiec-Weglinski JW. Type I, but not type II, interferon is critical in liver injury induced after ischemia and reperfusion. Hepatology 47: 199–206, 2008 [DOI] [PubMed] [Google Scholar]
- 60.Zhang MZ, Yao B, Yang S, Jiang L, Wang S, Fan X, Yin H, Wong K, Miyazawa T, Chen J, Chang I, Singh A, Harris RC. CSF-1 signaling mediates recovery from acute kidney injury. J Clin Invest 122: 4519–4532, 2012 [DOI] [PMC free article] [PubMed] [Google Scholar]
- 61.Zhang Y, Woodward VK, Shelton JM, Richardson JA, Link DC, Zhou XJ, Kielar ML, Jeyarajah DR, Lu CY. Ischemia/reperfusion induces G-CSF gene expression by renal medullary thick ascending limb cells in vivo and in vitro. Am J Physiol Renal Physiol 286: F1193–F1201, 2004 [DOI] [PubMed] [Google Scholar]


