

Abstract
Extracellular nucleotides such as adenosine-5′-triphosphate (ATP) and reactive oxygen species are essential local signaling molecules in the kidney. However, measurements of changes in the interstitial concentrations of these substances in response to various stimuli remain hindered due to limitations of existing experimental techniques. The goal of this study was to develop a novel approach suitable for real-time measurements of ATP and H2O2 levels in freshly isolated rat kidney. Rats were anesthetized and the kidneys were flushed to clear blood before isolation for consequent perfusion. The perfused kidneys were placed into a bath solution and dual simultaneous amperometric recordings were made with the enzymatic microelectrode biosensors detecting ATP and H2O2. It was found that basal levels of H2O2 were increased in Dahl salt-sensitive (SS) rats fed a high-salt diet compared with SS and Sprague-Dawley rats fed a low-salt diet and that medulla contained higher levels of H2O2 compared with cortex in both strains. In contrast, ATP levels did not change in SS rats when animals were fed a high-salt diet. Importantly, angiotensin II via AT1 receptor induced rapid release of both ATP and H2O2 and this effect was enhanced in SS rats. These results demonstrate that ATP and H2O2 are critical in the development of salt-sensitive hypertension and that the current method represents a unique powerful approach for the real-time monitoring of the changes in endogenous substance levels in whole organs.
Keywords: ATP, hydrogen peroxide, biosensors, angiotensin II, purinergic signaling
previous studies indicated that the kidney plays a dominant role in the long-term control of arterial pressure and that the pressure-natriuresis relationship is shifted to higher blood pressures in every experimental model of hypertension that has been studied to date. However, the factors that alter renal function and the pathways involved remain to be determined. The critical role of the circulating renin-angiotensin system (RAS) in the regulation of arterial blood pressure has been recognized for many years (1, 2, 17). Angiotensin II (ANG II), a pluripotent peptide hormone of the RAS system, directly regulates many processes in the body and is strongly linked to the hypertension. The study of the functional processes in the whole kidney presents a tremendous experimental challenge due to the structural and functional heterogeneity of the kidney tissues and rapid transient changes in the concentrations of the signaling molecules. The purines like adenosine-5′-triphosphate (ATP), adenosine-5′-diphosphate (ADP), and adenosine as well as reactive oxygen species (ROS) H2O2 and superoxide O2·− are among the most important paracrine signaling agents. Analysis of signaling mechanisms especially in vivo and ex vivo has been slowed by deficiencies in existing methods for direct measurements of the concentrations and dynamic changes of signaling molecules in whole organs. In this manuscript, we describe a novel approach suitable for real-time measurements of ATP and H2O2 levels in freshly isolated and perfused rat kidney, based on enzymatic microelectrode biosensors (6, 18).
We report here both a description and validation of this approach, and the application of these sensors for the determination of basal levels and acute changes of ATP and H2O2 in response to ANG II in the cortex and medulla of the kidney. These responses to ANG II are not just of technical interest since interstitial levels of ATP and ROS are thought to be elevated during inappropriate activation of the intrarenal RAS and thought to contribute to the pathogenesis of hypertension and renal injury (12, 24). However, it has remained unclear how ANG II elevates ATP and H2O2 in the interstitial space and the kinetics of these responses have not been reported before. To determine this, we performed analysis of ATP and H2O2 levels under basal conditions in blood-free kidney and their real-time release within the renal cortex following administration of ANG II in the Sprague-Dawley (SD) and Dahl salt-sensitive (SS) rat kidneys. It was observed that basal levels of cortical interstitial H2O2 were increased in SS rats fed a high-salt diet compared with SS and SD rats fed a low-salt diet. Renal cortical interstitial H2O2 concentration was also measured by traditional microdialysis to compare these two approaches. In addition, basal medullar levels of H2O2 were higher compared with the cortex area. In contrast, ATP levels were not different in the kidney cortex of SS and SD rats fed low- and high-salt diets. However, perfusion of the kidney with ANG II rapidly induced release of both ATP and H2O2.
MATERIALS AND METHODS
Animals.
All studies were performed in 8- to 10-wk-old male SD (Charles River, Wilmington, MA) or Dahl SS rats (SS/JrHsdMcwi rats have been inbred for more than 50 generations at the Medical College of Wisconsin). Animals were maintained on a 0.4% NaCl AIN-76 rodent diet (Dyets, Bethlehem, PA) throughout the study except when switched to a high 4.0% NaCl diet (Dyets) for the 3-wk protocol and water was provided ad libitum. Animal use and welfare procedures adhered to the National Institutes of Health Guide for the Care and Use of Laboratory Animals following protocols reviewed and approved by the Medical College of Wisconsin Institutional Animal Care and Use Committee.
Isolation of the kidney.
Because of the rapid clotting of blood in the euthanized state, rats were first deeply anesthetized and kidneys were flushed with Hanks balanced salt solution (HBSS; Life Technologies, Grand Island, NY) in situ. Rats were anesthetized with isoflurane inhalation and the surgical procedure was performed on a temperature-controlled table. The kidneys were perfused (6 ml/min) through the distal aorta with a HBSS solution at room temperature to remove blood from the organs. The flushing was continued for 2–3 min until the kidneys were completely blanched, and then the animal was euthanized by pneumothorax. The left kidney was then removed with the section of aorta, which was catheterized to allow consequent perfusion of the organ. The kidney capsule was carefully stripped to facilitate sensor insertion.
Real-time electrochemical detection of H2O2 and ATP release in rat kidney.
Biosensors (18) were obtained from Sarissa Biomedical (Coventry, UK). The ATP biosensor is formed by coating a platinum microelectrode with an ultrathin biolayer containing glycerol kinase and glycerol-3-phosphate oxidase. Two consequent reactions were catalyzed by these enzymes in the presence of ATP to cause production of H2O2, which could be detected with amperometry. The ATP sensor responds rapidly (10–90% rise in <10 s) and exhibits a linear response to ATP over the physiologically relevant concentrations (19). Additionally all electrodes have an outer permselectivity antifouling layer and an inner layer to defend the electrode surface or enzyme layer from interferences (6, 19). Biosensors were used in conjunction with a dual-channel DY2021 potentiostat and a recording system (Digi-Ivy, Austin, TX). A new pair of sensors was used every day for experiments with freshly isolated, blood-free and nonoxygenated kidneys. Although the sensors could be used more than once on the same day, it is important to repeat the pre- and postcalibration processes for each use as well as voltammetry cycling to obtain precise concentration measurements. Before each experiment, sensors were immersed for 15 min in a rehydrating buffer containing 100 mM NaCl, 1 mM MgCl2, 2 mM glycerol, 10 mM NaPi buffer, pH 7.4. Studies were carried out on a high-performance lab air table surrounded by a Faraday cage (TMC, Peabody, MA) to reduce noise. To increase sensor sensitivity, cyclic voltammetry (−500 to +500 mV) was used at a rate of 100 mV/s for 10 cycles (19). After this procedure, sensors were polarized to +600 mV for calibration. Both H2O2 (sarissaprobe Null) and ATP (sarissaprobe ATP) biosensors were calibrated to known H2O2 and ATP concentrations before and after each set of experiments. We use the term “H2O2 sensor” throughout this manuscript since the sarissaprobe Null sensor directly detects H2O2 at the microelectrode surface and this sensor was utilized to analyze H2O2 concentrations. All experiments and calibration protocols were performed at room temperature in bath solution containing in mM: 145 NaCl, 4.5 KCl, 2 MgCl2, 1 CaCl2, 10 HEPES, pH 7.35 adjusted with NaOH. After surgery, the flushed kidney with catheterized renal vessels was placed into the recording chamber and affixed with the silicone bands to avoid movement. Bath solution and solutions containing drugs were perfused through the kidney at the constant rate of 650 μl/min via the cannulated aorta using a perfusion pump (Razel Scientific Instruments, St. Albans, VT). Dual simultaneous amperometric recordings were made with the biosensors detecting ATP and H2O2 levels. The sensing section of the biosensors (0.5 mm of the tip) was inserted into the kidney cortex or medulla using MP-225 motorized micromanipulators (Sutter Instruments, Novato, CA). The sensors were polarized to +600 mV relative to an Ag/AgCl potentiostat reference electrode (Sarissa Biomedical) that was placed into the recording chamber close to the kidney. Final concentrations were calculated from calibration response ratios. The production rate was calculated by integrating the signal over the time value during the active release phase (phase when the signal was different from the baseline was considered the active release phase). Production rate is ratio of integral of release to the active phase time.
Renal cortex microdialysis.
Rats were anesthetized and the kidney was prepared for the acute in vivo microdialysis study following previously described protocols (20, 27). Briefly, the rats were anesthetized with ketamine (Ketaject; 30 mg/kg body wt im) and thiobutabarbital (Inactin; 50 mg/kg body wt ip) and then placed on a thermostatically controlled warming table to maintain body temperature at 37°C. One catheter was placed in the left femoral vein for a continuous infusion of 0.9% NaCl solution containing 2% albumin at a rate of 3.0 ml/h throughout the experiment to replace fluid loss and maintain a constant hematocrit (∼40%), which was measured during equilibration or when blood samples were taken during the experiment. The left femoral artery was cannulated and connected to a Statham pressure transducer for monitoring of mean arterial pressure throughout the experiment. The left kidney was exposed by a midline abdominal incision and placed in a stainless steel cup for implantation of microdialysis probes to dialyze H2O2 from the renal interstitium. The rats were allowed to stabilize after the surgical procedure for 1.5–2 h. Animals were euthanized at the end of experiments with an excess intravenous dose of pentobarbital sodium (150 mg/kg). The left kidney was excised and weighed, and the position of the dialysis probes was confirmed. If the probes or fibers were positioned incorrectly, the data of these dialysates were discarded. After equilibration period, dialysate effluent was collected over two 30-min intervals and renal cortex interstitial H2O2 concentrations were determined by fluorescence spectrometry using the Amplex Red H2O2 Assay Kit (Molecular Probes, Eugene, OR). Amplex Red is a fluorogenic substrate with very low background fluorescence, which reacts with H2O2 with a 1:1 stoichiometry to produce highly fluorescent resorufin. Reactions of the dialysate and kit reagent were incubated for 30 min at room temperature in the dark, and then fluorescence intensity was measured by a microtiter plate reader. Resorufin excitation and emission were detected spectrophotometrically at 530 and 595 nm, respectively, by Tecan Spectrafluor Plus Microplate Reader (Tecan US, Morrisville, NC). After background fluorescence was subtracted, H2O2 of the renal interstitial dialysate was calculated by using a resorufin-H2O2 calibration curve generated with increasing concentrations of H2O2 (0 to 2 μM) and Amplex Red in the perfusate.
Statistics.
Statistical analyses were performed using Origin software 6.0 (OriginLab, Northampton, MA). All summarized data are reported either as means ± SE or means ± SD (see Figs. 2 and 3). Data are compared using either the Student's (2-tailed) t-test or a one-way ANOVA and P ≤ 0.05 is considered significant.
Fig. 2.
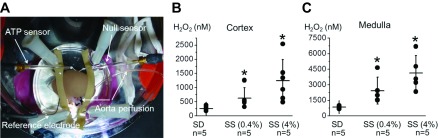
A: ATP and H2O2 biosensor installation into the isolated and perfused rat kidney. Both ATP and H2O2 biosensors were inserted into the kidney cortical layer and connected to a dual-channel potentiostat for current-time amperometry recordings. The reference electrode was placed onto the kidney surface clear of both sensors and also attached to the potentiostat to ensure noise quality recordings. The silicone resin was used to immobilize the kidney to avoid movement during perfusion. The aorta was continuously perfused with vehicle- or drug-containing solutions through a motorized laminar syringe pump. B and C: summary graphs of H2O2 concentrations in the kidney cortex and medulla. Sprague-Dawley (SD) and Dahl salt-sensitive (SS) rats fed low (0.4%)- or high-salt (4.0%; 3 wk) diets were used for the experiments. Dots represent single experiments (one kidney/rat) and the summary is reported as means ± SD. H2O2 levels were significantly increased in the medulla area compared with the cortex in all groups [note different scales for cortex (B) and medulla (C) values]. *P < 0.05 vs. SS rats fed a low-salt diet.
Fig. 3.

Microdialysis detection of hydrogen peroxide concentration in the renal cortex. A: scheme of microdialysis setup. The collection steel needles were implanted into the kidney cortex as shown on the scheme. Interstitial cortex fluid was collected by microdialysis and H2O2 levels were analyzed with fluorescence spectrometry. B: summary graphs of H2O2 concentrations in the kidney cortex. Dots represent single experiments (one kidney/rat) and the summary is reported as means ± SD. *P < 0.05 vs. SS rats fed a low-salt diet.
RESULTS
Application of biosensors to analyze basal levels of H2O2 and ATP in isolated perfused kidneys.
Calibration of the enzymatic microelectrodes was carried out in a separate chamber filled with the solution used for kidney perfusion and both H2O2 and ATP probes were calibrated to known ATP and H2O2 concentrations. Representative responses of the ATP and H2O2 biosensors to application of ATP and H2O2 are shown in Fig. 1. The response time was in the millisecond range and both ATP and H2O2 sensors gave significant responses at concentrations as low as 100 nM. The H2O2 sensor showed no sensitivity to changes of ATP in the bath solution; in contrast, the ATP sensor showed a clear sensitivity and rapid response to 10 μM ATP (Fig. 1A). Both sensors (H2O2 and ATP) were highly sensitive to H2O2 and had similar amplitude and kinetics in response to application of 10 μM H2O2 (Fig. 1D). The H2O2 signal was quickly blocked by adding 2 mg/ml of H2O2 scavenger catalase-polyethylene glycol (PEG-catalase) into the bath chamber (data not shown). Biosensors used in this study were previously utilized in different cell types and tissues and their selectivity for a number of substances was tested (6, 9, 10, 15, 16). For instance, as described by Gourine et al. (11), ATP biosensors are insensitive to other purinergic molecules like adenosine, UTP, or ADP. Figure 1, B and E, shows the representative amperometric curves of ATP and H2O2 in response to increasing concentrations of each. Linear increases of amperometric responses were observed in response to both ATP (over the range 0.1–10 μM) and H2O2 (0.1–5 μM) concentrations (Fig. 1, C and F). Control experiments revealed that addition of catalase rapidly blocks H2O2 response but does not influence the response to ATP (data not shown). In addition, the effects of ANG II were also tested, although it was found that concentrations of up to 10 μM did not produce any detectable changes on either of the sensors (data not shown).
Fig. 1.

Biosensors calibration protocol. The magnitude of the response of ATP (sarissaprobe ATP; red) and H2O2 (sarissaprobe Null; black) sensors to bath application of ATP (10 μM; A) or H2O2 (10 μM; D). Dose-response and calibration curves of ATP and H2O2 biosensors in response to ATP (B and C) or H2O2 (E and F) are shown and demonstrate linear responses for both from 0.1 to 5 and 10 μM (for H2O2 and ATP, respectively).
To study endogenous concentrations of H2O2 in the perfused kidneys, the H2O2 biosensor was gently inserted into the kidney cortex (Fig. 2A). After the constant signal level in the cortex area was established, the microelectrode was inserted up to 3 mm deep in medulla space. Importantly, current approach allows discrimination of signals from both the renal cortex and outer medulla since the biosensor sensing section is only 0.5 mm in length. This procedure was repeated three to four times for different locations of every kidney and the kidney was then perfused with bath solution containing 2 mg/ml PEG-catalase to test whether the signal detected by the H2O2 sensor indeed represented H2O2 levels in tissue. As summarized in Fig. 2B, basal levels of H2O2 in the kidney cortex of the SD rat averaged 253 ± 64 nM. In SS rats, H2O2 levels were significantly higher in rats fed a low (0.4%)- and a high (4.0%; 3 wk)-salt diet (626 ± 162 and 1,240 ± 307 nM, respectively). Interestingly, basal levels of H2O2 were significantly higher in the outer medulla compared with the renal cortex in all studied groups (SD and SS rats fed low- and high-salt diets). Quantitative analysis revealed that SS rats had higher levels of H2O2 than SD rats even when fed a low-salt diet (P < 0.05). Specifically, basal levels of H2O2 in the medulla for SS rats fed a 0.4% salt diet averaged 2,422 ± 1,040 nM and rats fed a 4.0% salt diet averaged 4,113 ± 753 nM (Fig. 2C). Application of PEG-catalase resulted in a steady decay of H2O2 signal (data not shown). Complete block of H2O2 signal was reached after 30–40 min of continuous kidney perfusion with PEG-catalase.
To further validate our data, we used an alternative tissue microdialysis approach for H2O2 concentration analysis in vivo as we described previously (20, 27). After a 2-h equilibration period, dialysate effluent was collected over three 30-min intervals and interstitial H2O2 concentrations in the renal cortex were determined (Fig. 3A). Similar to our data obtained with biosensors, H2O2 levels were higher in the renal cortex of SS rats fed a high-salt compared with those fed a low-salt diet (Fig. 3B) as we previously reported for the medulla (27). Furthermore, quantitative analysis revealed similar values for both approaches (see Figs. 2B and 3B).
To determine basal levels of endogenous ATP, the mathematical difference of the signals obtained from the H2O2 and ATP sensors was calculated. In contrast to H2O2, basal levels of ATP were not different in the kidney cortex of SD rats and SS rats fed a low- or a high-salt diet. ATP levels in the renal cortex averaged 405 ± 88 nM for SD rats fed a low-salt diet and 477 ± 112 and 407 ± 130 nM for SS rats fed low- and high-salt diets, respectively (n = 3 rats in each group).
Calculation of H2O2 and ATP concentrations in response to perfusion of ANG II.
Biosensor amperometry provides raw real-time data of changes in interstitial concentrations measured in pA. However, using mathematical equations and calibration curves we are able to recalculate these values in real concentrations. These values are critical for understanding many physiological and pathophysiological processes, since a number of mechanisms/pathways are activated only when ATP and/or H2O2 concentrations reach specific concentrations. For current experiments, each sensor was normalized to its own calibration level and Fig. 4 illustrates how the transient current amplitudes were used to obtain actual concentrations of H2O2 and ATP for both sensors for the kidneys perfused with ANG II (1 μM). Specifically, the H2O2 sensor detects H2O2 production while the difference between ATP and H2O2 sensors yields the ATP values. Normalization of the H2O2 sensor values to known H2O2 calibration level then provides actual H2O2 concentration in nanomoles. Respectively, normalization of the delta value to known ATP calibration level represents ATP concentrations in nanomoles (Fig. 4).
Fig. 4.

Calculation of H2O2 and ATP concentrations in response to the perfusion of the kidney with ANG II. Application of ANG II (1 μM) produced a detectable response on both sensors. Shown are the representative examples of H2O2 and ATP concentration calculations in response to ANG II perfusion. The H2O2 sensor detected H2O2 production in the kidney cortex of SD rat. The ATP sensor revealed the sum of both H2O2 and ATP concentrations. The difference between H2O2 and ATP sensors shows the exact ATP response value. Normalization of the H2O2 sensor values to known H2O2 calibration level represents H2O2 concentration changes in nM. Normalization of the difference value to known ATP calibration level represents the ATP concentration change in nM.
ANG II evokes acute ATP and H2O2 release in the kidney.
Superoxide and nitric oxide production in the kidney are known to play an important role in sodium homeostasis and salt-sensitive hypertension and renal injury (3, 4, 21, 28), yet little is known about how the highly reactive H2O2 molecule is involved in these processes. It was previously demonstated that H2O2 in the kidney medulla may account for as much as 50% of the hypertension and renal injury observed in the SS rat (20, 27). However, cortical H2O2 responses to a high-salt diet have not been previously determined and its determination in both SD and SS rats was therefore one of the goals of this study. Interstitial ATP is also a critical signaling molecule, the concentration of which fluctuates under certain physiological and pathophysiological conditions; it was shown that ATP plays an active role in autoregulation and inflammatory processes in the kidney and contributes to the decline in autoregulatory efficency in hypertension (8, 12, 13).
ANG II-induced changes of interstitial endogenous concentration of ATP and H2O2 were determined in normal and SS rats. These experiments represent the first real-time measurements of ATP and H2O2 release in the intact kidney. Freshly isolated kidneys of the SD or SS rats were perfused with 1 μM ANG II under constant laminar flow (650 μl/min). The maximum amplitude of the ANG II-induced H2O2 responses averaged 70 ± 15 (n = 8 applications), 189 ± 58 (n = 7), and 301 ± 91 nM (n = 8) for SD and SS rats fed a low- and a high-salt diets, respectively (Fig. 5, A and B). The H2O2 response exhibited a slow increase (over 100 s) to a stable maximal level that lasted during the rest of the perfusion time. The average production rate was 67 ± 17, 187 ± 55, and 294 ± 81 nM/s for SD and SS rats fed low- and high-salt diets, respectively (Fig. 5C).
Fig. 5.

ANG II perfusion causes H2O2 release in the rat kidney cortex. A: real-time changes of the mean H2O2 (gray bars show SE) from total n = 8 applications (4 kidneys from 4 different rats). Bars on the top represent ANG II (1 μM) application. B: maximal H2O2 concentration amplitude values during ANG II perfusion for SD and SS rats fed a low- and a high-salt diet, respectively. C: H2O2 production rates calculated as integral over time during the active release (phase different from 0). *P < 0.05 vs. SD rats.
The kinetics of ATP release had different characteristics compared with H2O2 release with rapid increase in concentration triggered by ANG II and followed by a slow decay of the signal due to ATP conversion to adenosine or substance pool depletion during exocytosis. The maximum amplitudes averaged 449 ± 145, 630 ± 49, and 1,087 ± 96 nM for SD rats and SS rats fed a low- and a high-salt diets, respectively (Fig. 6, A and B). The ATP production rates were 257 ± 100, 496 ± 202, and 829 ± 319 nM/s for the corresponding groups of rats (Fig. 6C).
Fig. 6.

ANG II perfusion causes ATP release in the rat kidney cortex. A: real-time changes of the mean ATP concentration (gray bars show SE) from total n = 8 applications (4 kidneys from 4 different rats). Bars on the top represent ANG II (1 μM) application. B: maximal ATP concentration amplitude values during ANG II perfusion for SD and SS rats fed a low- and a high-salt diet, respectively. C: ATP production rates calculated as integral over time during the active release (phase different from 0). *P < 0.05 vs. SD (*) or SS (#) rats fed a low-salt diet.
ANG II can act through AT1 and AT2 receptors. To test which receptor subtype mediated the acute release of ATP and H2O2 in response to ANG II, we used a well-established AT1 receptor antagonist losartan. ANG II application in the presence of 10 μM losartan strongly inhibited the release of both ATP and H2O2 (Fig. 7). Thus, these experiments reveal that the ANG II responses were mediated through AT1 receptors. Furthermore, these data provide additional evidence that this approach can be successfully used to analyze acute changes in some substances in response to drug perfusion.
Fig. 7.

ANG II increases H2O2 and ATP release via AT1 receptor. ANG II application in the presence of losartan (10 μM) results in strong inhibition of both ATP and H2O2 responses.
DISCUSSION
The present study applied biosensors to measure H2O2 and ATP in an intact perfused whole kidney. The kidney plays a central role in the regulation of arterial blood pressure (5, 14, 30). RAS hyperactivity is associated with progression of chronic kidney disease and hypertension (22, 23). Activation of purinergic signaling and ROS production trigger myriad processes in the kidney that result in an increased circulating blood volume and elevation of systemic blood pressure. The biosensor techniques used in this study revealed that ANG II infusion results in an immediate elevation of both H2O2 and ATP (Fig. 8).
Fig. 8.
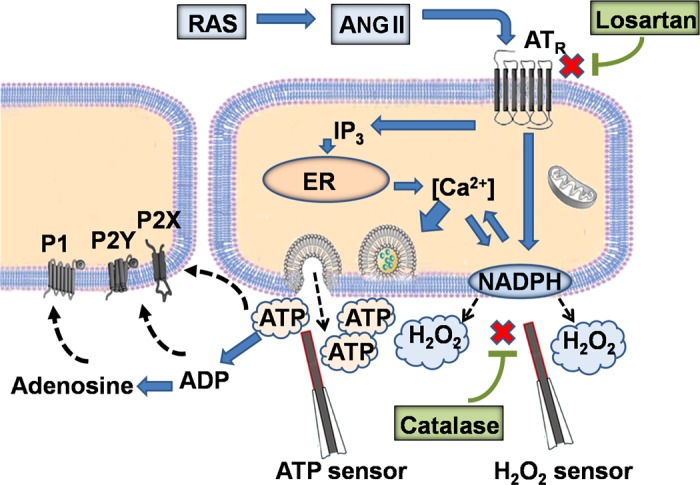
Detection of endogenous H2O2 and ATP release induced by ANG II. ANG II, the primary active component of the renin-angiotensin system (RAS) triggers: 1) NADPH oxidase mechanisms, which result in superoxide production and rapid increase in interstitial H2O2 concentration and 2) increase of intracellular Ca2+ concentration, which in turn stimulates ATP exocytosis. Losartan and catalase block AT1 receptors and decompose H2O2, respectively. ATP and H2O2 biosensors are also shown.
Biosensors are analytical tools that incorporate sensing elements, such as enzymes, to selectively detect small amounts of physiologically relevant molecules. Such sensors can be used in a broad range of applications, including clinical diagnostics. Earlier these sensors have been successfully used by others to determine purine release in tissues and cell cultures obtained from the central nervous system (6, 7, 9, 10, 31). In the present study, we utilized biosensors for the measurement of tissue concentrations and endogenous production of H2O2 and ATP in the freshly isolated perfused whole kidney. We show that this technique allows detection of not only basal levels of compounds, but also the dynamics of these signaling molecules released in response to drug perfusion. Real-time measurements are critical since both purines and ROS have a very short half-life due to fast degradation. Unfortunately, this approach does not allow us to discriminate between specific cell types responsible for the release of substances. However, this could be tested in bulk segments and primary isolates of specific cells/nephron segments using the same approach.
The incentive to apply a biosensor approach was driven by the need to move studies from single cells and monolayers to whole organs. The present study shows that the method has a strong potential for scientific and medical implications and in particular to further our understanding of the diseases related to disturbances of the purinergic signaling and oxidative stress. Biosensors used in this study are commercially available products, and their specificity was tested in a number of tissues (9, 10, 15, 25). Importantly, current studies demonstrate that these biosensors could be used in intact kidney and allow real-time measurements of the renal interstitial ATP and H2O2 concentrations and kinetic responses to drug perfusion. The approach can be utilized in other intact organs such as the heart and lungs to measure endogenous substances. Modification of this method could potentially allow measuring substances of interest in conscious animals. When the kidney is immobilized, similarly to the approach used in the micropuncture studies (26, 29), the intact kidney retains its complex architecture and regulation by systemic and intrarenal mechanisms.
In addition to ATP and H2O2, this method could be used to study a number of other endogenous substances, when corresponding sensors are utilized. At this moment, adenosine, inosine, acetylcholine, glutamate, and glucose sensors are commercially available. Furthermore, it should be possible to simultaneously detect ATP and its product adenosine using both corresponding biosensors. It is evident from the present study that ATP is rapidly released to target P2 receptors, but it is also converted to adenosine which may have slower dynamics and different physiological effects over time.
As in every experimental approach, this method has some limitations. First, current approach is highly sensitive to H2O2 level changes. This should be taken into account but could be significantly reduced by recurrent Null sensor calibrations. Similarly, prior calibration of the biosensors should be performed in pharmacological screening to avoid possible unspecific response to some drugs. Furthermore, ATP sensor stability and sensitivity are much better in solutions containing glycerol. However, to avoid glycerol toxicity to the kidney cells, we recommend to do short time experiments without glycerol in solution, presoaking microelectrode before the calibration in glycerol-contaning buffer. In this case, additional calibrations (before and after measurments) will be nessesary. Current studies were performed at room temperture and the perfusate was not oxygenated. Furthermore, bath solution and solutions containing drugs were perfused through the kidney at the rate of 650 μl/min, which is below physiological range for renal perfusion pressure. Another limitation is use of blood-free kidney in this preparation, which also represents a nonphysiological environment. Thus, these limitations, including influence of temperature, kidney oxygenation, and speed of perfusion, require further studies to evaluate whether these critical parameters affect measurements of endogenous substances in the kidney. Furthermore, extension of this approach to in vivo conditions will be useful for kidney and cardiovascular research. Use of isolated kidneys has some advantages such as simplicity of preparation and detection of real levels of ATP and H2O2 in the interstitium. However, future studies are required to extend this line of research to concious animals.
In conclusion, these data provide evidence that the current approach is ideal for acute recordings of ATP and H2O2 in different organs and tissues and could be used for identification of a variety of substances ex vivo and in vivo for research and diagnostic applications. Direct real-time measurements of purinergic agents and ROS concentrations have been of great value in understanding the functional roles of these substances in a number of diseases including chronic kidney disease and hypertension. The established method represents a unique powerful approach for real-time detection of substance release in organs or tissues and could be used for ex vivo and in vivo measurements under normal or pathological conditions. It is relatively simple to perform and provides a very sensitive system to obtain rapid response within an intact organ system. Using this tool we provide direct evidence that ANG II acutely mediates release of ATP and H2O2 in the kidney and this effect is enhanced in SS rats. Furthermore, the data indicate that SS rats have increased levels of H2O2 (especially in the medulla) when animals are fed a high-salt diet.
GRANTS
This research was supported by the American Diabetes Association Grant 1-10-BS-168 (to A. Staruschenko), American Heart Association 10POST4140109 and 13SDG14220012 (to T. S. Pavlov), and National Heart, Lung, and Blood Institute Grants HL108880 (to A. Staruschenko), HL82798, and HL29587 (to A. W. Cowley, Jr.).
DISCLOSURES
No conflicts of interest, financial or otherwise, are declared by the author(s).
AUTHOR CONTRIBUTIONS
Author contributions: O.P. and A.S. conception and design of research; O.P., V.L., D.V.I., T.S.P., and R.P.R. performed experiments; O.P., V.L., D.V.I., T.S.P., and R.P.R. analyzed data; O.P., A.W.C.J., and A.S. interpreted results of experiments; O.P. and A.S. prepared figures; O.P. and A.S. drafted manuscript; O.P., V.L., D.V.I., T.S.P., R.P.R., A.W.C.J., and A.S. edited and revised manuscript; O.P., V.L., D.V.I., T.S.P., R.P.R., A.W.C.J., and A.S. approved final version of manuscript.
ACKNOWLEDGMENTS
Dr. Jan Lopatar (University of Lausanne, Switzerland) is acknowleged for assistance in biosensor experiments and technical tips. Dr. Yong Jiang (Digi-Ivy) is acknowleged for assistance in amperometry/voltammetry setup installation.
REFERENCES
- 1.Bohlender J, Menard J, Ganten D, Luft FC. Angiotensinogen concentrations and renin clearance: implications for blood pressure regulation. Hypertension 35: 780–786, 2000 [DOI] [PubMed] [Google Scholar]
- 2.Conti S, Cassis P, Benigni A. Aging and the renin-angiotensin system. Hypertension 60: 878–883, 2012 [DOI] [PubMed] [Google Scholar]
- 3.Cowley AW., Jr Renal medullary oxidative stress, pressure-natriuresis, and hypertension. Hypertension 52: 777–786, 2008 [DOI] [PMC free article] [PubMed] [Google Scholar]
- 4.Cowley AW, Jr, Mori T, Mattson D, Zou AP. Role of renal NO production in the regulation of medullary blood flow. Am J Physiol Regul Integr Comp Physiol 284: R1355–R1369, 2003 [DOI] [PubMed] [Google Scholar]
- 5.Cowley AW, Jr, Roman RJ. The role of the kidney in hypertension. JAMA 275: 1581–1589, 1996 [PubMed] [Google Scholar]
- 6.Dale N, Frenguelli BG. Measurement of purine release with microelectrode biosensors. Purinergic Signal 8: 27–40, 2012 [DOI] [PMC free article] [PubMed] [Google Scholar]
- 7.Frayling C, Britton R, Dale N. ATP-mediated glucosensing by hypothalamic tanycytes. J Physiol 589: 2275–2286, 2011 [DOI] [PMC free article] [PubMed] [Google Scholar]
- 8.Gever JR, Cockayne DA, Dillon MP, Burnstock G, Ford AP. Pharmacology of P2X channels. Pflügers Arch 452: 513–537, 2006 [DOI] [PubMed] [Google Scholar]
- 9.Gourine AV, Kasymov V, Marina N, Tang F, Figueiredo MF, Lane S, Teschemacher AG, Spyer KM, Deisseroth K, Kasparov S. Astrocytes control breathing through pH-dependent release of ATP. Science 329: 571–575, 2010 [DOI] [PMC free article] [PubMed] [Google Scholar]
- 10.Gourine AV, Llaudet E, Dale N, Spyer KM. ATP is a mediator of chemosensory transduction in the central nervous system. Nature 436: 108–111, 2005 [DOI] [PubMed] [Google Scholar]
- 11.Gourine AV, Llaudet E, Dale N, Spyer KM. Release of ATP in the ventral medulla during hypoxia in rats: role in hypoxic ventilatory response. J Neurosci 25: 1211–1218, 2005 [DOI] [PMC free article] [PubMed] [Google Scholar]
- 12.Graciano ML, Nishiyama A, Jackson K, Seth DM, Ortiz RM, Prieto-Carrasquero MC, Kobori H, Navar LG. Purinergic receptors contribute to early mesangial cell transformation and renal vessel hypertrophy during angiotensin II-induced hypertension. Am J Physiol Renal Physiol 294: F161–F169, 2008 [DOI] [PMC free article] [PubMed] [Google Scholar]
- 13.Guan Z, Giddens MI, Osmond DA, Cook AK, Hobbs JL, Zhang S, Yamamoto T, Pollock JS, Pollock DM, Inscho EW. Immunosuppression preserves renal autoregulatory function and microvascular P2X1 receptor reactivity in ANG II-hypertensive rats. Am J Physiol Renal Physiol 304: F801–F807, 2013 [DOI] [PMC free article] [PubMed] [Google Scholar]
- 14.Guyton AC. Blood pressure control-special role of the kidneys and body fluids. Science 252: 1813–1816, 1991 [DOI] [PubMed] [Google Scholar]
- 15.Heinrich A, Ando RD, Turi G, Rozsa B, Sperlagh B. K+ depolarization evokes ATP, adenosine and glutamate release from glia in rat hippocampus: a microelectrode biosensor study. Br J Pharmacol 167: 1003–1020, 2012 [DOI] [PMC free article] [PubMed] [Google Scholar]
- 16.Klyuch BP, Dale N, Wall MJ. Receptor-mediated modulation of activity-dependent adenosine release in rat cerebellum. Neuropharmacology 62: 815–824, 2012 [DOI] [PubMed] [Google Scholar]
- 17.Kobori H, Nangaku M, Navar LG, Nishiyama A. The intrarenal renin-angiotensin system: from physiology to the pathobiology of hypertension and kidney disease. Pharmacol Rev 59: 251–287, 2007 [DOI] [PubMed] [Google Scholar]
- 18.Llaudet E, Botting NP, Crayston JA, Dale N. A three-enzyme microelectrode sensor for detecting purine release from central nervous system. Biosens Bioelectron 18: 43–52, 2003 [DOI] [PubMed] [Google Scholar]
- 19.Llaudet E, Hatz S, Droniou M, Dale N. Microelectrode biosensor for real-time measurement of ATP in biological tissue. Anal Chem 77: 3267–3273, 2005 [DOI] [PubMed] [Google Scholar]
- 20.Makino A, Skelton MM, Zou AP, Cowley AW. Increased renal medullary H2O2 leads to hypertension. Hypertension 42: 25–30, 2003 [DOI] [PubMed] [Google Scholar]
- 21.Manning RD, Jr, Tian N, Meng S. Oxidative stress and antioxidant treatment in hypertension and the associated renal damage. Am J Nephrol 25: 311–317, 2005 [DOI] [PubMed] [Google Scholar]
- 22.Navar LG, Prieto MC, Satou R, Kobori H. Intrarenal angiotensin II and its contribution to the genesis of chronic hypertension. Curr Opin Pharmacol 11: 180–186, 2011 [DOI] [PMC free article] [PubMed] [Google Scholar]
- 23.Navar LG, Harrison-Bernard LM, Nishiyama A, Kobori H. Regulation of intrarenal angiotensin II in hypertension. Hypertension 39: 316–322, 2002 [DOI] [PMC free article] [PubMed] [Google Scholar]
- 24.Polichnowski AJ, Jin C, Yang C, Cowley AW., Jr Role of renal perfusion pressure versus angiotensin II on renal oxidative stress in angiotensin II-induced hypertensive rats. Hypertension 55: 1425–1430, 2010 [DOI] [PMC free article] [PubMed] [Google Scholar]
- 25.Schmitt LI, Sims RE, Dale N, Haydon PG. Wakefulness affects synaptic and network activity by increasing extracellular astrocyte-derived adenosine. J Neurosci 32: 4417–4425, 2012 [DOI] [PMC free article] [PubMed] [Google Scholar]
- 26.Stockand JD, Vallon V, Ortiz P. In vivo and ex vivo analysis of tubule function. Compr Physiol 2: 2495–2525, 2012. [DOI] [PubMed] [Google Scholar]
- 27.Taylor NE, Cowley AW., Jr Effect of renal medullary H2O2 on salt-induced hypertension and renal injury. Am J Physiol Regul Integr Comp Physiol 289: R1573–R1579, 2005 [DOI] [PubMed] [Google Scholar]
- 28.Taylor NE, Glocka P, Liang M, Cowley AW., Jr NADPH oxidase in the renal medulla causes oxidative stress and contributes to salt-sensitive hypertension in Dahl S rats. Hypertension 47: 692–698, 2006 [DOI] [PubMed] [Google Scholar]
- 29.Vallon V. Micropuncturing the nephron. Pflügers Arch 458: 189–201, 2009 [DOI] [PMC free article] [PubMed] [Google Scholar]
- 30.Wadei HM, Textor SC. The role of the kidney in regulating arterial blood pressure. Nat Rev Nephrol 8: 602–609, 2012 [DOI] [PubMed] [Google Scholar]
- 31.Wall M, Eason R, Dale N. Biosensor measurement of purine release from cerebellar cultures and slices. Purinergic Signal 6: 339–348, 2010 [DOI] [PMC free article] [PubMed] [Google Scholar]