Abstract
Purpose
S100B is member of a multigenic family of Ca2+-binding proteins that is overexpressed by gliomas. Recently, we demonstrated that low concentrations of S100B attenuated microglia activation through the induction of Stat3. We hypothesized that overexpression of S100B in gliomas could promote tumor growth by modulating the activity of tumor-associated macrophages (TAMs).
Experimental Design
We stably transfected GL261 glioma cell lines with constructs that overexpressed (S100Bhigh) or underexpressed (S100Blow) S100B and compared their growth characteristics to intracranial wild-type (S100Bwt) tumors.
Results
Downregulation of S100B in gliomas had no impact on cell division in vitro but abrogated tumor growth in vivo. Interestingly, compared to S100Blow tumors, S100Bwt and S100Bhigh intracranial gliomas exhibited higher infiltration of TAMs, stronger inflammatory cytokine expression, and increased vascularity. To identify the potential mechanisms involved, the expression of the S100B receptor, RAGE (receptor for advanced glycation end products), was evaluated in gliomas. Although S100B expression induced RAGE in vivo, RAGE ablation in mice did not significantly inhibit TAM infiltration into gliomas, suggesting that other pathways were involved in this process. To evaluate other mechanisms responsible for TAM chemoattraction, we then examined chemokine pathways and found that CCL2 was upregulated in S100Bhigh tumors. Furthermore, analysis of TCGA’s glioma data bank demonstrated a positive correlation between S100B and CCL2 expression in human proneural and neural glioma subtypes, supporting our finding.
Conclusions
These observations suggest that S100B promotes glioma growth by TAM chemoattraction through upregulation of CCL2 and introduces the potential utility of S100B inhibitors for glioma therapy.
Keywords: Brain neoplasm, Macrophage, Mice, RAGE
Introduction
S100B is a member of the multigene family of Ca2+-binding proteins of the EF-hand type and has been implicated in the regulation of cellular activities such as metabolism, motility and proliferation (1, 2). In the nervous system, S100B is constitutively released by astrocytes into the extracellular space and at nanomolar concentrations, it can promote neurite outgrowth and protect neurons against oxidative stress (3). S100B expression, however, can be augmented by various stimuli such as trauma and inflammation (4). Acting in an autocrine fashion, micromolar concentrations of S100B activate microglia and astrocytes through the induction of iNOS and NF-κB, and increase the expression of pro-inflammatory cytokines such as IL-1β, IL-6 and TNF-α (5-7). Through these functions, S100B has been implicated in the pathogenesis of neurodegenerative brain disorders such as Alzheimer’s disease (8).
S100B is also overexpressed by most malignant gliomas. It is proposed to contribute to tumorigenesis by inhibiting the function of the tumor suppressor protein p53 (9, 10) and regulating cell proliferation and differentiation by stimulating the activity of the mitogenic kinases Ndr (11) and Akt (protein kinase B) (12). Furthermore, S100B stimulates glioma proliferation at low concentrations (13) and modulates astrocyte function through an interaction with Src kinase (14). These reports suggest that S100B may contribute to astrocyte differentiation and could promote their activation and motility in the CNS.
The role of S100B in gliomagenesis has not been extensively studied. We recently demonstrated that even at low levels, S100B modulated the activity of tumor-associated macrophages (TAMs) in a glioma model by activating Stat3 (15). We hypothesized that expression of S100B could also promote the growth of gliomas through modulation of TAM activity in vivo. Here, we show that S100B overexpression in gliomas enhanced TAM infiltration and promoted tumor growth in vivo. Furthermore, S100B upregulation resulted in increased angiogenesis and CCL2 (C-C motif ligand 2) overexpression. These findings were confirmed using publicly available data showing S100B directly correlates with CCL2 expression in proneural and neural glioma subtypes. To our knowledge, this is the first report that demonstrates the role of S100B in gliomagenesis and introduces the potential utility of S100B inhibitors for glioma therapy.
Materials and Methods
Reagents and cell lines
GL261 glioma cells were obtained from Dr. Karen Aboody’s laboratory in 2006 and stably transfected with firefly luciferase expression vector. Positive clones (GL261-luc) were selected using zeocin (1 mg/mL) and G418. Luciferase-expressing KR158B cells (or K-luc), an invasive glioma cell line that was derived from spontaneous gliomas in Trp53/Nf1 double-mutant mice in Dr. Tyler Jacks laboratory, was a generous gift from Dr. John Sampson (16). Both GL261 and K-luc cells were cultured in DMEM medium supplemented with 10% FBS (BioWhittaker, Walkersville, MD), 100 U/mL penicillin-G, 100 μg/mL streptomycin and 0.01 M Hepes buffer (Life Technologies, Gaithersburg, MD) in a humidified 5% CO2 atmosphere, and their tumorigenicity was authenticated by histological characterization of intracranial gliomas in mice. To modulate S100B expression, GL261-luc cells were stably trasfected with either murine s100b cDNA or shRNA vectors to respectively increase (S100Bhigh) or knock-down (S100Blow) S100B expression in GL261 gliomas (OriGene, Rockville MD). The control vector for shRNA was used to generate the control GL261 cells (S100Bwt). After transfection, cells were selected by Puromycin to generate monoclonal cell lines. To validate our findings in a second glioma model, K-luc cells (which express very low levels of S100B at baseline) were electroporated with s100B cDNA or control vectors, and cells were cultured in presence of Puromycin to generated monoclonal lines. S100B expression in each cell line was confirmed by Western blotting every month and remained stable throughout the study.
In vitro cell proliferation assay
S100Blow, S100Bhigh and S100Bwt GL261 cells were placed in six-well plates (1.5 × 10⁵ cells/well). Cell proliferation was measured by counting the trypsinized cells at different time intervals. For proliferation rate measurements, cells were incubated with BrdU (10 μM) for 30 minutes before quantifying the labeled cells by flow cytometry.
Tumor implantation and sample collection
Mice were housed and handled in accordance to the guidelines of City of Hope Institutional Animal Care and Use Committee under pathogen-free conditions. All mice were on C57BL/6J background. CX3CR1GFP Knock-in mice that express EGFP under control of the endogenous Cx3cr1 locus were purchased from Jackson Laboratory (Sacramento, CA). RAGE knockout mice, a generous gift from Dr. Yasuhiko Yamamoto (Kanazawa University, Japan), were bred at our institution and PCR genotyped using tail DNA (17). Intracranial (i.c.) tumor implantation was performed stereotactically at a depth of 3 mm through a bur hole placed 2mm lateral and 0.5 mm anterior to the bregma as described before (15). Briefly, GL261 glioma cells were harvested by trypsinization, counted, and resuspended in culture medium. Female C57BL/6 mice (Jackson Laboratory, Bar Harbor, ME) weighing 15-25 g were anesthetized by intraperitoneal (i.p.) administration of ketamine (132 mg/kg) and xylazine (8.8 mg/kg) and implanted with 105 tumor cells using a stereotactic head frame at a depth of 3 mm through a bur hole placed 2mm lateral and 0.5 mm anterior to the bregma. For in vivo proliferation rate measurements, mice bearing one-week old i.c. tumors were given BrdU (1 mg/day, i.p.) for seven days, then BrdU uptake in tumor cell suspensions was analyzed by flow cytometry.
Intravital Imaging
Twelve days after i.c. implantation of GL261 cells into CX3CR1GFP mice, a small cranial window was generated over the tumor site and covered with a 5 mm glass coverslip. Mice were then injected with Tetramethylrhodamine dextran (20 μg/200μl, i.v.) and Hoechst 33342(250 μg/mice, i.v.) and imaged using the Prairie Technologies Ultima 2-Photon Microscope.
In Vivo ONO-2506 administration
ONO-2506, an S100B inhibitor, was kindly provided by Ono Pharmaceutical Co. Ltd. (Osaka, Japan). For in vivo experiments, ONO-2506 was mixed with water and Tween 80, sonicated for 10 min and administrated (30 mg/kg, oral) one day after tumor implantation and continued daily for two weeks.
NF-κB assay
RAW macrophages that were stably transfected with a reporter construct that expresses an embryonic alkaline phosphatase gene encoding a secreted protein under the control of an NF-κB inducible promoter (RAW-Blue™, InvivoGen) were used to study NF-κB activation by measuring the secretion of embryonic alkaline phosphatase. S100Blow, S100Bwt and S100Bhigh GL261 cells were co-cultured with RAW-Blue™ cells in 96 well plates at different ratios. One day later, the NF-κB activity was measured by Quanti-Blue assay according to the manufacturer’s instructions.
Real time RT-PCR and Western blot
Real-time PCR was performed in a TaqMan 5700 Sequence Detection System (Applied Biosystems, Foster City, CA) as described previously (15). CCL2 expression was measured using CCL2-F ACTCACCTGCTGCTACTCATTCAC and CCL2-R AACTACAGCTTCTTTGGGACACCT primers. Western blots were performed as describe before (15) using primary Abs specific for S100B (Abcam), full length RAGE (Abcam), β-actin (Santa Cruse), S100A8 and S100A9 (R&D Systems), HMGB1 and GAPDH (Cell Signaling).
ELISA
Supernatant from cultured cells were used for measurement of high-mobility group protein B1 (HMGB1), CCL2 (MCP-1), Chemokine (C-X-C motif) ligand 12 (CXCL12, SDF-1α), according to the manufacturer’s instructions. All kits were purchased from R&D System (Minneapolis, MN), except for the HMGB1 ELISA kit, which was purchased from NovaTein Biosciences (Cambridage, MA).
Flow cytometry analysis
Cells were harvested, washed, and stained with anti-CD11b in the presence of FcR-Block, anti-CD16/32. After wash, cells were fixed using CytoFix/CytoPermbuffer. For in vivo RAGE, BrdU and CCL2 staining, tumor tissue was minced and digested with trypsin for 20 min at 37°C. Tissue homogenate was then filtered through a 40 μM filter and prepped using Fixation/Permeabilization solution according to the manufacturer’s instructions (BD Pharmingen. San Diego, CA). Multiple-color FACS analyses was performed at City of Hope FACS facility using a 3-laser CyAn immunocytometry system (Dako Cytomation, Fort Collins, CO), and data was analyzed using FlowJo software (TreeStar, San Carlos, CA) ad described before (18). PerCP-conjugated Abs to mouse CD45 (Cat: 557235) and purified mouse anti-BrdU (Cat: 555627) were purchased from BD Pharmingen (San Diego, CA) Allophycocyanin-conjugated anti-mouse CD11b (Cat: 17-0112-82) and the primary rabbit-anti-mouse RAGE (Cat: ab3611-100) was purchased from Abcam (Middlesex, NJ). The primary rabbit-anti-mouse CCL2 (Cat: sc-28879), secondary goat anti-rabbit-FITC (Cat: sc-2012) and secondary goat anti-mouse-FITC (Cat: sc-2010) were purchased from Santa Cruz Biotechnology (Santa Cruz, CA). The primary rabbit anti-pSTAT3 (Cat: 9145S) was purchased from Cell Signaling Technology (Danvers, MA).
Immunofluorescence staining
Frozen brain sections were prepared from normal and tumor-bearing C57BL/6 mice. Immediately after harvest, brains were fixed in paraformaldehyde for four hours before storage in 30% sucrose solution. Brains were embedded in O.C.T. (Tissue-Tek) and 10 μm sections were cut using cryostat (Leica Microsystem Inc., Bannockburn, IL). Prior to immunofluorescence staining, slides were baked at 37°C and permeabilized in methanol for 15 min. After a one hour block, slides were incubated with CCL2 (1:100 dilution of rabbit anti-CCL2 Ab; Santa Cruz Biotechnology, Santa Cruz, CA), S100B (1:200 dilution of rabbit anti-mouse S100B Ab; Abcam, Middlesex, NJ), or RAGE (1:200 dilution of Rabbit anti-mouse RAGE Ab; Abcam, Middlesex, NJ) primary Abs for 1 h. Slides were washed with TBS 3 times for 5 min and incubated with secondary antibody (Goat anti-rabbit Alexa Fluor 555 1:200 dilution; Life Technologies, Carlsbad, CA) for another hour. Sections were mounted in Vectashield mounting medium containing 4060-diamidino-2-phenylindole (DAPI) (Vector, Burlingame, CA). Images were obtained by AX-70 fluorescent microscopy (Leica Microsystems Inc., Bannockburn, IL) and were prepared by Zeiss LSM Image Browser software.
The Cancer Genome Atlas (TCGA) analysis
To check for correlations with TCGA signature genes, gene expression data from eight independent cohorts (19-26) were used to test for correlations between S100B, S100A8, S100A9 and the mesenchymal, classical, neural, and proneural signature genes from Verhaak et al. (27). P-values were calculated using the cor.test function in R (28), and False Discovery Rates (FDR) were calculated using the method of Benjamini and Hochberg (29).
To look for possible correlations between S100B and CCL2 in glioma subtypes, Pearson correlation coefficients and p-values were calculated using microarray gene expression values (from Affymetrix HT HGU133A arrays) for tumor samples in the training dataset from Verhaak et al. (27). P-values were calculated using the cor.test function in R (28).
Statistical analysis
Statistical comparison in all different experimental conditions was performed with the prism software using two-way analysis of variance (ANOVA) or Student’s t test.
Results
S100B promotes in vivo glioma growth
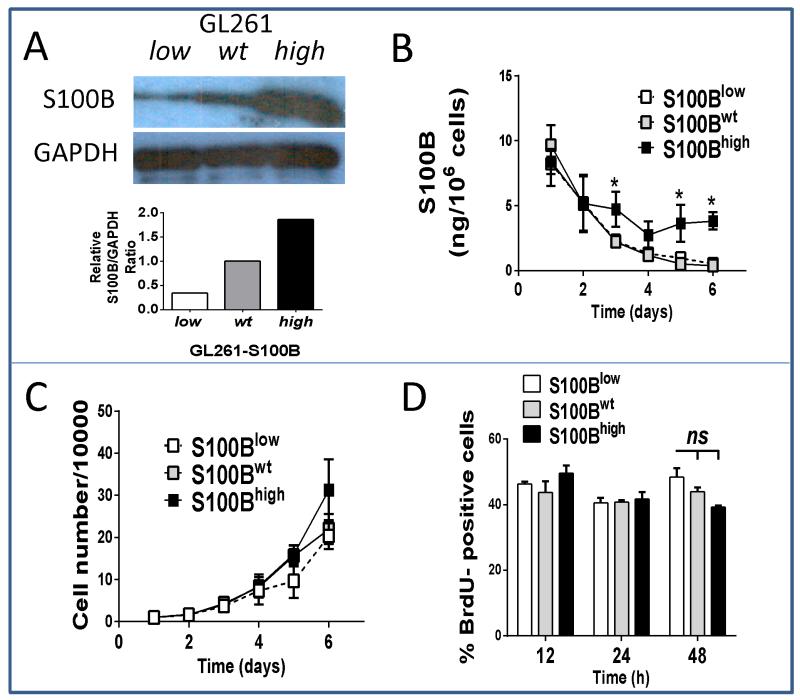
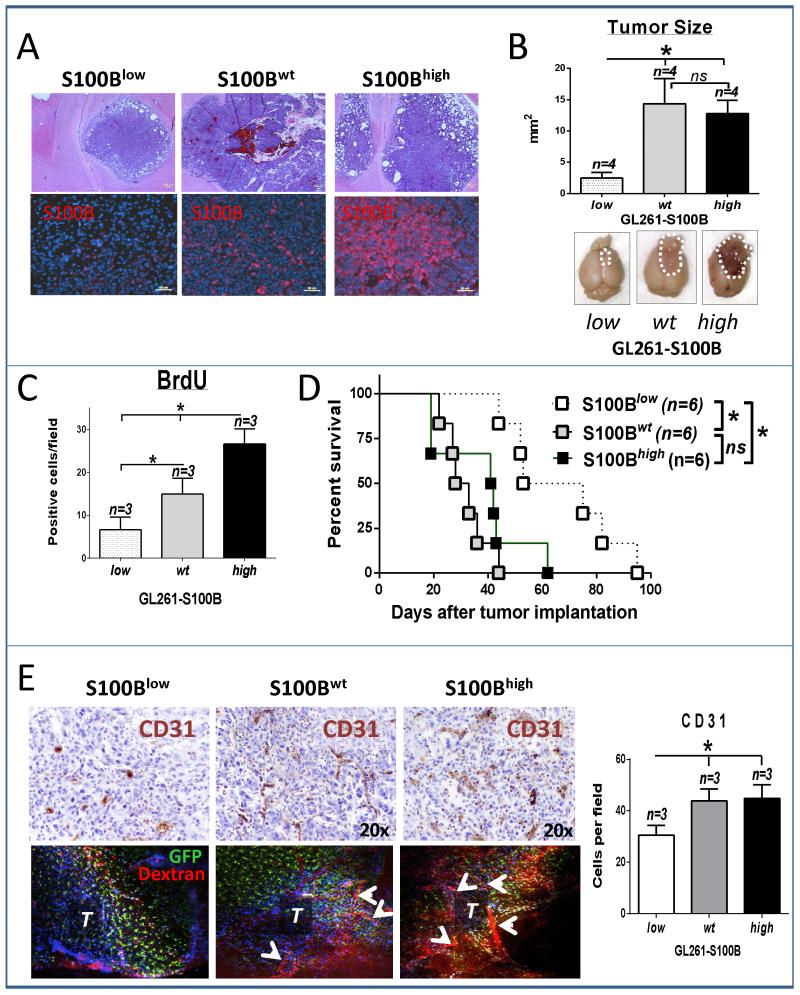
To examine if S100B stimulated glioma growth, stably-transfected GL261 glioma cell lines that either overexpressed (S100Bhigh) or underexpressed (S100Blow) S100B were generated and compared to mock-transfected and wild-type GL261 cells (Fig 1). Because mock-transfection had no impact on cell proliferation or S100B production (not shown), these cells were used as controls (S100Bwt) in the subsequent experiments. As expected, S100B expression was lower in S100Blow cells (Fig. 1A), but its secretion was similar to S100Bwt cells (Fig. 1B). In contrast, S100Bhigh cells expressed and secreted higher levels of S100B (Fig. 1B). Irrespective of S100B expression, however, all cells had similar in vitro proliferation rates (Fig 1C and D). In contrast, in vivo tumor growth rate, determined by tumor size, proliferation rate and animal survival, was different among the three cell lines (Fig. 2A-D). S100B knockdown significantly reduced tumor growth and prolonged animal survival (Fig. 2C and D), but it’s upregulation did not have a significant impact on tumor size or animal survival. Tumor S100B expression also correlated with increased angiogenesis as both S100Bwt and S100Bhigh tumors exhibited higher vascularity than S100Blow i.c. gliomas (Fig. 2E). Because S100B has pro-inflammatory functions at high concentrations, we examined its impact on tumor inflammation.
Figure 1.
Modulation of S100B production does not affect proliferation of GL261 glioma cells in vitro. Cells were stably transected with plasmids that carried either S100B siRNA or cDNA to knockdown (S100Blow) or enhance (S100Bhigh) S100B expression, respectively. Cells transfected with bank plasmid (S100Bwt) were used as control. S100B production by each cell line was measured by A, Western blot and B, ELISA. In vitro proliferate rates of S100Blow and S100Bhigh cells were similar to control cells as measured by C, cell number/plate or, D, BrdU uptake. Experimental results are representative of at least two separate experiments (n=3, ±SD). * : p < 0.05.
Figure 2.
S100B enhances tumor growth in vivo. A and B, S100Blow, S100Bhigh and S100Bwt GL261 cells were implanted into frontal lobes of syngeneic mice and two weeks later tumor growth was evaluated by histology and tumor size measurements. Cross sections through the largest tumor area were used for size calculations (n=4±SD). In vivo tumor growth was analyzed by C, BrdU uptake in two-week old tumors (n=3±SD) and D, animal survival (n=6). E, Tumor vascular density was measured by CD31 staining (top panel and bar graph, n=3±SD) and intra-vital imaging (bottom panel) in CX3CR1GFP mice. T: tumor, arrows point to tumor vessels. All results are representative of two separate experiments. * : p < 0.05. ns: not significant
S100B promotes inflammation and potentiates macrophage infiltration into gliomas
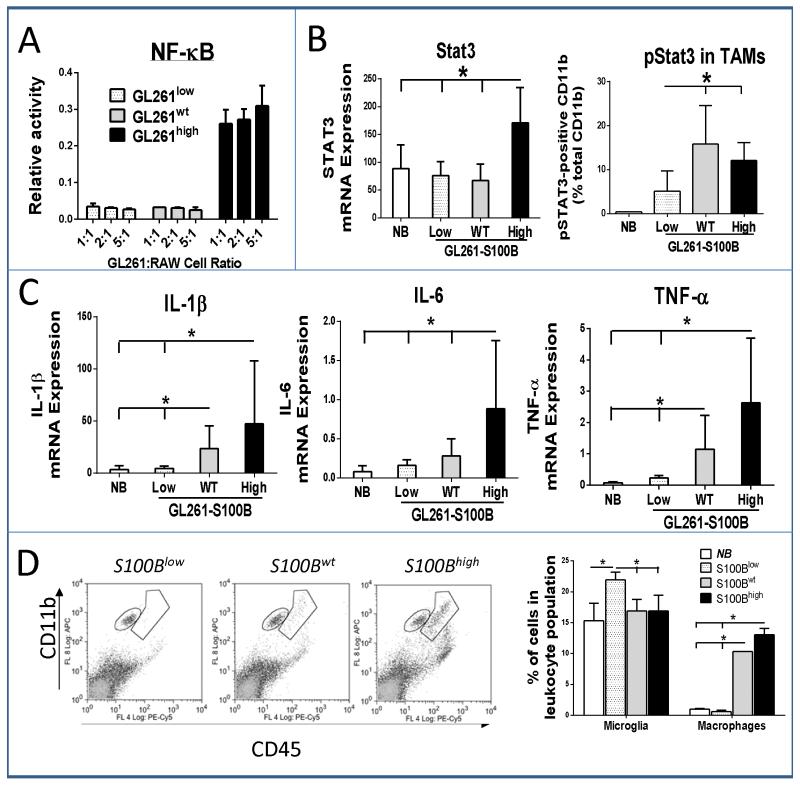
To determine the effect of glioma-derived S100B on macrophage activation, GL261 cells were co-incubated with RAW-Blue™ cells. Activation of NF-κB in these cells induces the secretion of alkaline phosphatase that can be quantified colorimetrically (30). Only S100Bhigh cells, which secreted high levels of S100B in vitro, were capable of activating NF-κB in RAW cells (Fig. 3A). Similarly, i.c. S100Bhigh tumors demonstrated increased inflammatory response as measured by tumor Stat3 expression, Stat3 phosphorylation in TAMs, and inflammatory cytokine production (Fig. 3B and C). In comparison to S100Blow tumors, S100Bwt gliomas also had higher levels of TAM pStat3 and tumor inflammation (IL-1β and TNF-α expression) (Fig. 3B and C). The results confirmed that S100B production by tumor cells can generate an inflammatory tumor microenvironment that could promote tumor growth. Because S100B has been shown to increase microglia motility (31) and because TAMs have been shown to promote tumor growth and angiogenesis (32, 33), we next quantified TAM infiltration into each tumor type.
Figure 3.
S100B increases inflammatory response in GL261 tumors. A, NF-κB activation in RAW-Blue™ macrophages was measured after a 24 hour co-incubation with GL261 cells at different cell ratios (n=3). B, In vivo Stat3 upregulation in i.c. tumors (left, RT-PCR) and pStat3 expression in TAMs isolated from i.c. gliomas two weeks after tumor implantation (right, FACS) was compared to normal brain (NB). C, S100B expression by gliomas promoted the expression of pro-inflammatory cytokines (RT-PCR) and D, infiltration of microglia (CD11bhigh CD45low) and macrophages (CD11bhigh CD45high) into two-week old tumors (n=3 mice/group, ±SD). Results are representative of three separate experiments. *: p<0.05.
TAMs in gliomas represent a heterogeneous cell population that consist of resident CNS microglia, and macrophages that arise from blood monocytes. Using a previously described flow cytometry characterization method (34), we evaluated the TAM subpopulations and found the proportion of macrophages (CD11bhigh CD45high), but not microglia (CD11bhigh CD45low), to be higher in S100Bwt and S100Bhigh tumors compared to S100Blow tumors (Fig 3D). S100Blow tumors had higher proportion of infiltrating microglia most likely as a result of chemoattraction of these cells into tumors and lack of macrophage trafficking. Thus, S100B appeared to promote inflammation and chemoattraction of circulating myeloid-derived cells into gliomas.
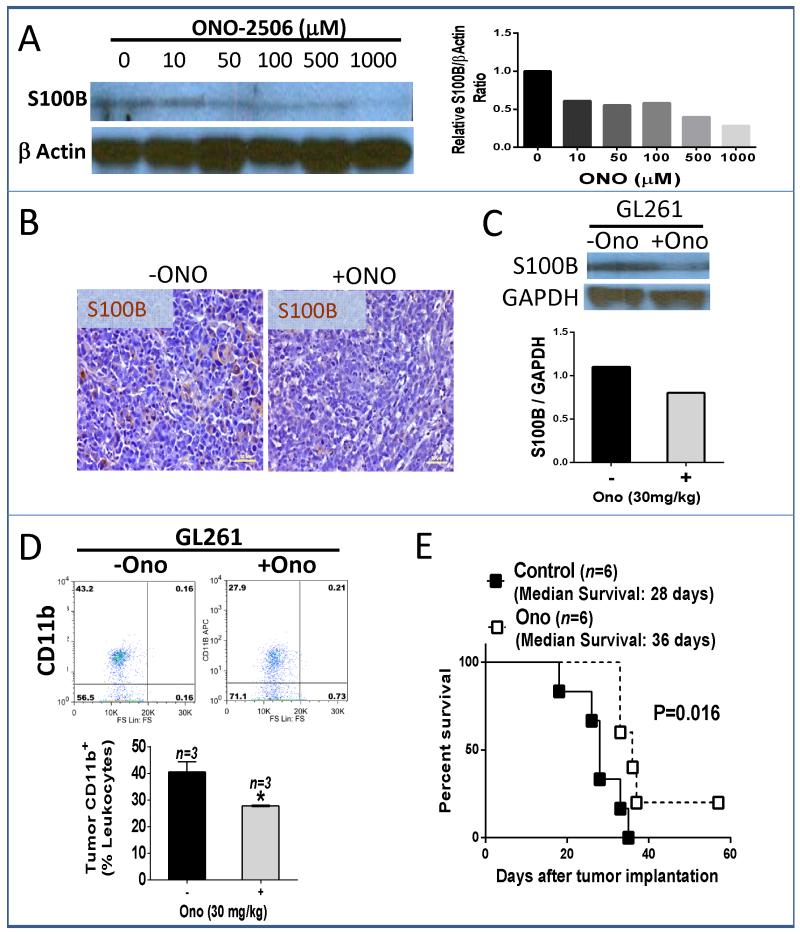
To assess if S100B function was reversible, we inhibited its production in gliomas with ONO-2506, an S100B inhibitor (35). ONO-2506 partially blocked S100B production both in vitro (Fig. 4A) and in vivo (Fig. 4B). Furthermore, ONO-2506 reduced TAM infiltration (Fig. 4D) and prolonged the survival of animals bearing ic S100Bwt gliomas (Fig. 4E). To further elucidate potential mechanisms involved in the promotion of inflammation in gliomas, we examined the expression of RAGE (receptor for advanced glycation end products), an S100B receptor.
Figure 4.
Inhibition of S100B production abrogates the growth of GL261 gliomas. A, In vitro inhibition of S100B production in S100Bwt cells by ONO-2506 at 48 h. B, For in vivo experiments, mice bearing four-day-old i.c. S100Bwt gliomas received daily ONO-2506 (30 mg/kg, orally) for two weeks, after which tumors were harvested for B, S100B analysis by immunohistochemistry and C, Western blotting. D, Representative dot plot (top) and FACS quantification (bottom) of tumor CD11b positive cells demonstrating inhibition of TAM infiltration into two-week old intracranial GL261 gliomas by ONO-2506. E, Two-week treatment with ONO-2506 also improved survival of mice bearing i.c. GL261-S100Bwt gliomas. Results are representative of two separate experiments. *: p<0.05.
Activation of RAGE by S100B
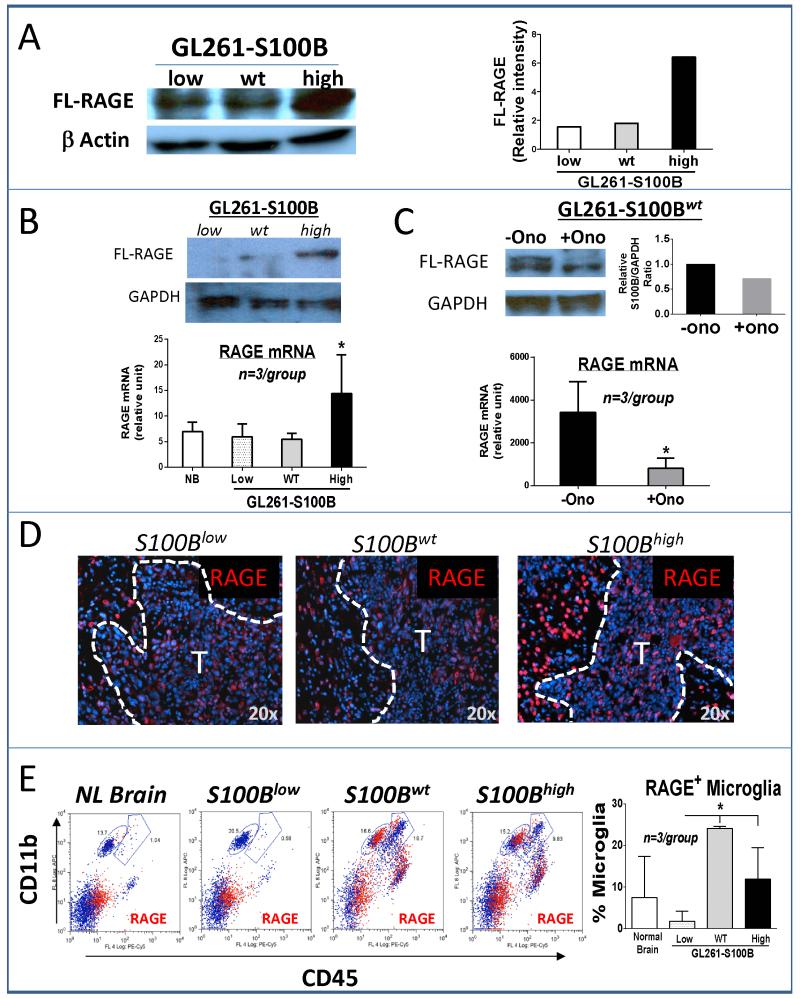
The expression of RAGE, which is upregulated after binding to its ligands, was increased in S100Bhigh cells in vitro (Fig. 5A). Following implantation into the brain, RAGE expression was also upregulated in two-week-old S100Bhigh tumors (Fig. 5B), and its expression was suppressed by ONO-2506 (Fig. 5C). Immunohistochemical analysis of tumors confirmed the in vitro data and demonstrated upregulation of RAGE in i.c. S100Bhigh gliomas, but most of the RAGE upregulation appeared to be in the neurons adjacent to the S100Bhigh tumor margin (Fig. 5D). Because, we previously reported RAGE expression by TAMs in gliomas (15), its expression was also quantified in these cells by flow cytometry. Interestingly, RAGE expression was similar in S100Bwt and S100Bhigh gliomas, whereas S100B knockdown significantly inhibited RAGE expression in microglia (Fig. 5D). Thus, upregulation of S100B by gliomas appeared not only to activate RAGE in tumor cells, but also to activate it in surrounding neurons and microglia.
Figure 5.
S100B stimulates RAGE expression. A, Western analysis demonstrating in vitro upregulation of full-length (FL)-RAGE in the S100Bhigh cells. B, In vivo FL-RAGE expression was measured in two-week old i.c. gliomas by Western (top) and RT-PCR (bottom, n=3 mice/group), NB: normal brain. C, ONO-2506 (30 mg/kg/day for two weeks) inhibited the expression of S100B in S100Bwt gliomas. D, RAGE expression (red stain) in tumor (T) and tumor periphery in three-week-old (S100Blow) and two-week-old (S100wt and S100Bhigh) i.c. gliomas. E, RAGE expression (red events) by tumor-associated leukocytes was measured in GL261 gliomas two weeks after i.c. implantation. Microglia (CD11bhigh CD45low) RAGE expression was significantly lower in S100Blow gliomas. (n= 3 mice /group, ±SD) * : p < 0.05. All results are representative of three separate experiments.
To assess if activation of RAGE was due to upregulation of other RAGE ligands, we evaluated the expression of S100A8, S100A9 and HMGB1, in this model. Pro-inflammatory S100A8/A9 heterodimers that are released by cells of myeloid origin have been shown to promote the migration and retention of myeloid-derived suppressor cells in tumors (36). Although not expressed by glial cells, S100A8/A9 can be detected in glioma-infiltrating TAMs following therapy (37). Protein analysis of cells from the three GL261-S100B subtypes did not detect either S100A8 or S100A9 (not shown). HMGB1, on the other hand, was detectable, but its expression was not different among the three cell lines (Supplementary Fig. S1). The data suggested that S100B, and not other RAGE ligands, was responsible for RAGE induction in tumors. Because RAGE enhances microglia motility in the brain (31), we next studied TAM infiltration in Rage −/− mice.
S100Bwt tumors were implanted into either wt or Rage −/− mice and TAMs were quantified at one and two weeks. Surprisingly, we did not detect a significant difference in the proportion of TAMs in the two strains (Supplementary Fig. S2). This result suggested that RAGE may not be essential for S100B-mediated TAM infiltration in this model. To evaluate other mechanisms, we studied the expression of chemokines in the three cell lines.
Chemokine production
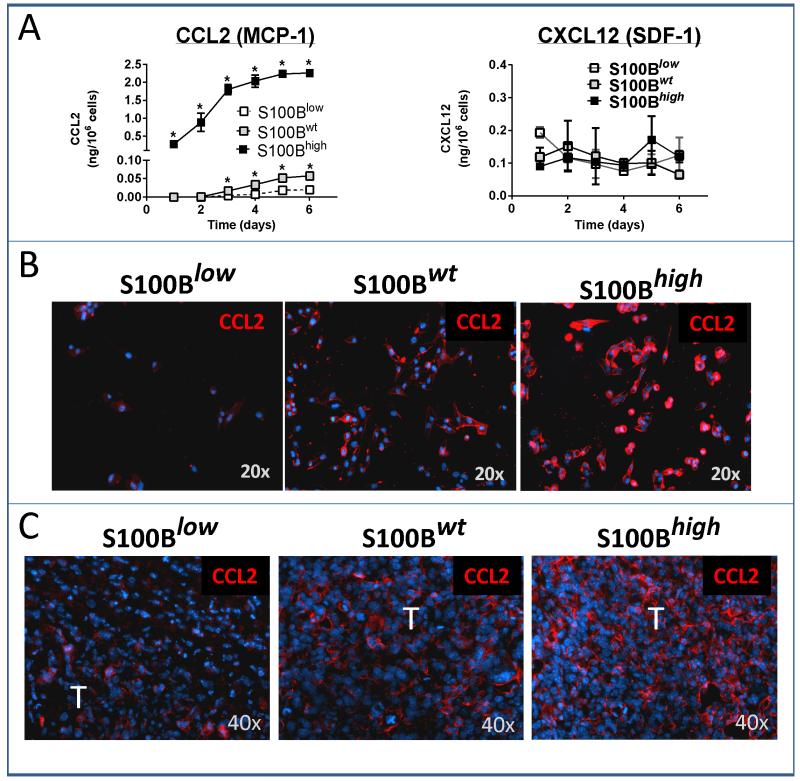
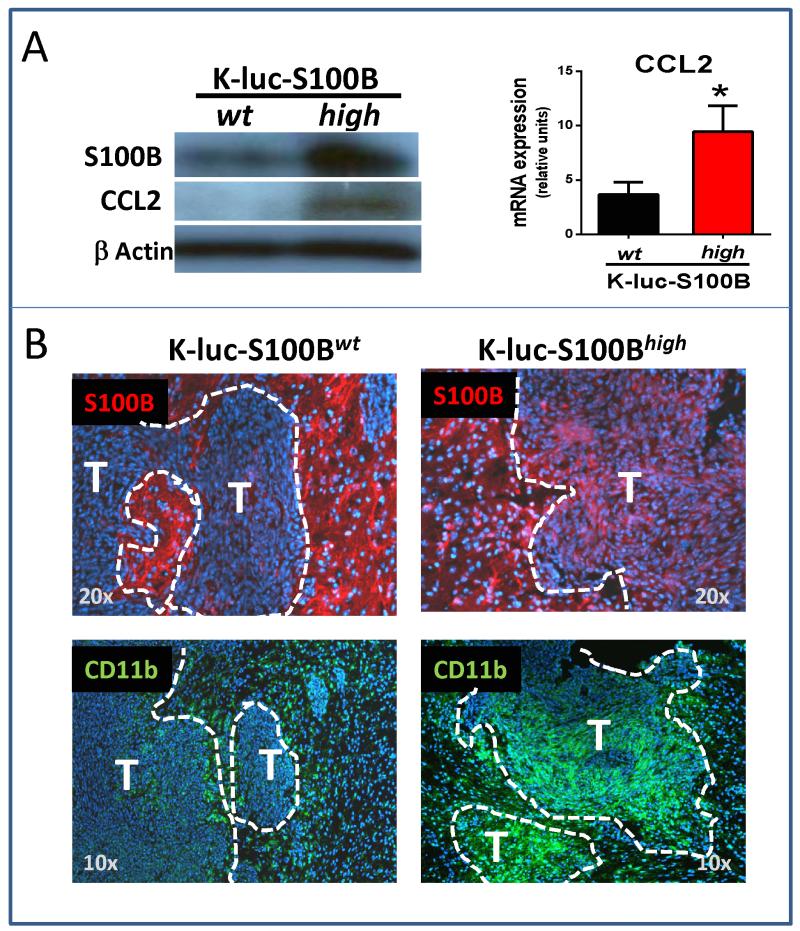
Analysis of supernatants recovered from the three glioma cell types demonstrated a marked increase in CCL2 secretion from S100Bhigh cells (Fig. 6A, top left). CCL2 production by S100Bwt cells was also higher than S100Blow cells, but not as much as S100Bhigh cells. In contrast, secretion of CXCL12 was not significantly different among the three cell lines (Fig. 6A top right). In vitro CCL2 secretion also correlated well with intracellular CCL2 levels in vitro (Fig. 6B) and CCL2 staining in i.c. GL261 tumors (Fig. 6C). Thus, S100B upregulation resulted in induction of CCL2 in GL261 cells and was responsible for TAM infiltration into gliomas. To confirm these findings in another cell line, K-luc gliomas (which express very low levels of S100B at baseline) were stably transfected with s100B cDNA or the control vector, and examined for CCL2 expression. Similar to GL261 cells, S100B upregulation in K-luc gliomas also increased CCL-2 expression (Fig. 7A) and TAM infiltration (Fig. 7B).
Figure 6.
CCL2 upregulation by S100B. A, In vitro CCL2 (but not CXCL12) secretion and B, expression (red staining) was significantly higher in S100Bwt and S100Bhigh GL261 cells (n=3/group, ±SD, * : p < 0.05). C, In vivo CCL2 expression was also upregulated in two-week old i.c. S100Bwt and S100Bhigh tumors (T). Results are representative of two separate experiments.
Figure 7.
S100B upregulation stimulates CCL2 expression and TAM trafficking into i.c. K-luc gliomas. To validate our findings in a second glioma model, a monoclonal K-luc glioma cell line that overexpressed S100B was generated and assessed for CCL2 production. A, K-luc-S100Bhigh, but not control cells that were transfected with blank plasmid (K-luc-S100Bwt), expressed higher levels of CCL2 in vitro (n=3/group, ±SD, * : p < 0.05). B, Ten-day old i.c. K-luc-S100Bhigh gliomas expressed higher levels of S100B (top panel, red stain) and exhibited stronger TAM infiltration (CD11b staining, green stain) as compared to K-luc-S100Bwt tumors. Most of the S100B expression in the K-luc-S100Bwt was in the astrocytes (arrows) adjacent to the invasive tumor edge. (n=2 mice/group). T: tumor.
Correlation to human gliomas
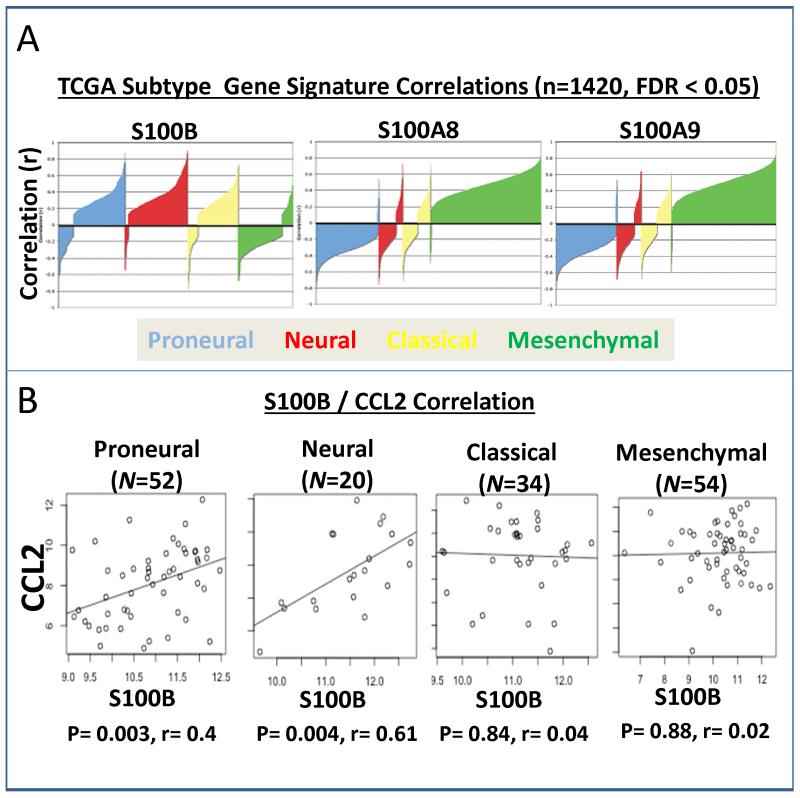
To evaluate the relevance of our observations to human gliomas, public data from TCGA (containing 1376 primary samples, 44 recurrent samples, and 35 normal tissue samples) was analyzed for possible correlations of S100B to different glioma subtypes. Among the four subtypes, mesenchymal tumors have been shown to have higher overall necrosis and associated inflammatory infiltrates (27). Contrary to our expectations, S100B expression positively correlated with proneural, neural, and classical, but not mesenchymal subtype (Fig. 8A). S100A8 and S100A9 expression, in contrast to S100B, positively correlated to the mesenchymal subtype. Interestingly, S100B expression correlated with CCL2 expression in all of the TCGA HT-U133A arrays (ρ=0.11, p=0.037, N=339), and the correlation was stronger in neuronal (ρ=0.61, p=0.00409, N=20) and proneural (ρ=0.40, p=0.00336, N=52) glioma subtypes (Fig. 8B), confirming our observations that S100B may play a role in TAM infiltration through upregulation of CCL2 in some glioma subtypes.
Figure 8.
Correlation of S100B and CCL2 expression in human gliomas. A, Correlation silhouette plots with S100B, S100A8, and S100A9 with the TCGA signature genes from Verhaak et al. Correlation coefficients for correlations with a false-discovery rate (FDR) < 0.05 are plotted. S100A8 and S100A9 show positive correlations with the mesenchymal subtype and negative correlations with the proneural subtype, whereas S100B shows a negative correlation with the mesenchymal subtype and positive correlations with the proneural, neural, and classical subtypes. Correlations are calculated separately per probe per array per cohort. B, Scatter plots for CCL2 and S100B within the four molecular subtypes in the TCGA training data from Verhaak et al. CCL2 and S100B show significant positive correlation in proneural and neural tumors, but not classical or mesenchymal tumors.
Discussion
TAMs are heterogeneous cell populations that constitute a major component of inflammatory cells in tumor microenvironment (38). These cells, when found in gliomas, are derived in part from CNS microglia and circulating monocytes, and have been implicated in glioma angiogenesis, invasion, local tumor recurrence and immunosuppression (32, 33, 39, 40). The mechanisms responsible for the infiltration of TAMs into tumors have been widely studied and inhibition of this process has been proposed as a general treatment strategy for cancer (41). Among a variety of cytokines, chemokines and growth factors that are involved in TAM trafficking in gliomas (40, 42-46), CCL2 was the first to be identified in tumor samples (47, 48). And although CCL2 expression can be induced by a number of stimuli, mechanisms responsible for its baseline expression by gliomas has not been identified. Here, we demonstrate that S100B, which is expressed by most gliomas, is an important inducer of CCL2.
Pro-inflammatory S100 proteins such as S100A8 or S100A9 have been implicated in chemoattraction of myeloid-derived cells into tumors (36), but the role of S100B in this process has not been studied before. The biological effect of S100B is strongly dependent on its intracellular and extracellular concentration in the CNS; at nanomolar quantities S100B has neurotrophic effects, whereas at micromolar concentrations S100B has pro-inflammatory and pro-apoptotic functions (49). Although high S100B extracellular levels are detected after brain injury or in neurodegenerative disorders (50), the exact extracellular concentration of S100B in gliomas is unknown and was not measured here. Nevertheless, our study suggests that S100B-mediated TAM chemoattraction and tumor progression occurred through both autocrine and paracrine pathways. Because RAGE, an S100B receptor, is involved in microglia trafficking in the brain (31), we first evaluated the role of this receptor on TAM trafficking in our glioma model.
RAGE is constitutively expressed in the lung. In the brain, most cells (including monocytes/macrophages, endothelial cells and neurons) express low levels of RAGE under physiological conditions, but the expression of RAGE in these cells can be induced by its ligands (such as S100 proteins and HMGB1) (51). In conditions such as diabetes mellitus and arthritis, expression of RAGE on macrophages is important for their trafficking and for mediating chronic inflammation (52). However, in our glioma model, TAM infiltration was not significantly altered in Rage −/− mice, confirming that S100B-mediated TAM chemoattraction was not directly due to S100B-RAGE interaction on leukocytes, but through the production of CCL2 by glioma cells.
Although the exact mechanism by which S100B stimulated CCL2 production in the S100Bwt and S100Bhigh tumors was not studied here, our previous work and other studies suggest Stat3 activation to be involved in this process (15). Similar to vascular smooth muscle cells (53, 54), RAGE induction by S100B may have enhanced CCL2 production by glioma cells. And although a variety cytokines are capable of inducing CCL2, these cytokines ultimately function through Stat3, and inhibition of Stat3 completely abrogates the induction of CCL2 in some cancer cells (55). Thus, CCL2 upregulation by S100B most likely occurred through activation of Stat3 in glioma cells.
In this study, S100B inhibition in GL261 gliomas significantly decreased tumor progression and angiogenesis, possibly by preventing TAM trafficking. However, the increased tumor growth in both S100Bwt and S100Bhigh may have been a direct effect of S100B and not TAMs. Similar to brain inflammatory conditions (56), S100B activation of RAGE on both tumor and tumor-associated leukocytes may have generated a tumor-promoting inflammatory environment with secretion of pro-angiogenic cytokines such as IL-6 and TNF-α (57). Supporting our previous report, S100B-mediated activation of Stat3 in TAMs may have also contributed to the local immunosuppressive tumor milieu and tumor progression (15). What was not clear in the current study, however, is why further upregulation of S100B did not enhance the tumorigenicity of GL261 gliomas? Despite a higher proliferative rate, animal survival and tumor growth of the S100Bhigh tumors were similar to the S100Bwt group. Since S100B inflammatory responses are concentration dependent, we speculate that higher levels of S100B in S100Bhigh gliomas may have shifted the tumor-promoting microenvironment into a cytotoxic pro-inflammatory one, thus limiting tumor growth. In future studies we will address this issue by evaluating the effect of S100B levels on tumor immunogenicity.
The interaction of RAGE with its ligands leads to sustained cellular perturbation in chronic diseases such as diabetes, inflammation, and Alzheimer’s disease (58, 59). The activation of RAGE by glioma S100B in our study may have other implications besides induction of tumor inflammation. Although not studied in detail, we noted that RAGE expression appeared to increase in neurons adjacent to S100Bhigh tumors. In neurons, RAGE mediates oxidative stress induced by amyloid-beta peptide (60), causing mitochondrial dysfunction (61). Targeted expression of RAGE in neurons also accelerates cognitive decline (62), and its inhibition has been shown to normalize cognitive performance in mice models of Alzheimer disease (63). Considering the cytotoxic effects of RAGE, its upregulation in neurons by glioma S100B could be partly responsible for neurotoxicity associated with malignant gliomas.
In summary, we demonstrated that glioma production of S100B enhanced tumor growth through CCL2 upregulation and TAM chemoattraction in murine models. In human gliomas, however, a direct correlation between S100B and CCL2 expression was only detected in neural and proneural, but not classical or mesenchymal glioma types. This observation, although unexpected initially, highlights the complexity of chemokine/cytokine networks involved in the chemoattraction of myeloid-derived cells into gliomas. Mesenchymal-type gliomas, for example, are characterized by necrosis and inflammatory infiltrates (27). In these tumors, other S100 proteins (such as S100A8 and A9) or chemokines that are induced by hypoxia (such as CXCL12) may be more important in maintaining a pro-inflammatory tumor microenvironment (64). Nevertheless, our observations highlight the role of S100B in gliomagenesis and introduce the potential utility of S100B inhibitors for glioma therapy.
Supplementary Material
Statement of Translational Relevance.
Tumor-associated macrophages are heterogeneous cell populations that constitute a major component of inflammatory cells in tumor microenvironment. These cells, when found in gliomas, are derived in part from brain microglia and circulating monocytes, and have been implicated in glioma angiogenesis, invasion, local tumor recurrence and immunosuppression. Here, we show that S100B overexpression by tumor cells promotes the growth of gliomas and enhances the infiltration of macrophages through CCL2 upregulation. To our knowledge, this is the first report that demonstrates the role of S100B in gliomagenesis and introduces the potential utility of S100B inhibitors for glioma therapy.
Acknowledgements
The authors thank Dr. Brian Armstrong for assisting with confocal microscopy and intravital imaging, and Dr. Margaret Morgan for editorial support.
Grant Support: This work was supported by R21CA131765, R01CA155769, James S. McDonnell Foundation and ThinkCure Foundation. The City of Hope Flow Cytometry Core was equipped in part through funding provided by ONR N00014-02-1 0958, DOD 1435-04-03GT-73134, and NSF DBI-9970143. The Bioinformatics Core was funded in part by NCI CCSG P30 CA33572.
Footnotes
Conflict of Interests: None
References
- 1.Donato R. S100: a multigenic family of calcium-modulated proteins of the EF-hand type with intracellular and extracellular functional roles. Int J Biochem Cell Biol. 2001;33:637–68. doi: 10.1016/s1357-2725(01)00046-2. [DOI] [PubMed] [Google Scholar]
- 2.Marenholz I, Heizmann CW, Fritz G. S100 proteins in mouse and man: from evolution to function and pathology (including an update of the nomenclature) Biochem Biophys Res Commun. 2004;322:1111–22. doi: 10.1016/j.bbrc.2004.07.096. [DOI] [PubMed] [Google Scholar]
- 3.Winningham-Major F, Staecker JL, Barger SW, Coats S, Van Eldik LJ. Neurite extension and neuronal survival activities of recombinant S100 beta proteins that differ in the content and position of cysteine residues. J Cell Biol. 1989;109:3063–71. doi: 10.1083/jcb.109.6.3063. [DOI] [PMC free article] [PubMed] [Google Scholar]
- 4.Mrak RE, Griffinbc WS. The role of activated astrocytes and of the neurotrophic cytokine S100B in the pathogenesis of Alzheimer’s disease. Neurobiol Aging. 2001;22:915–22. doi: 10.1016/s0197-4580(01)00293-7. [DOI] [PubMed] [Google Scholar]
- 5.Hu J, Van Eldik LJ. S100 beta induces apoptotic cell death in cultured astrocytes via a nitric oxide-dependent pathway. Biochim Biophys Acta. 1996;1313:239–45. doi: 10.1016/0167-4889(96)00095-x. [DOI] [PubMed] [Google Scholar]
- 6.Lam AG, Koppal T, Akama KT, Guo L, Craft JM, Samy B, et al. Mechanism of glial activation by S100B: involvement of the transcription factor NFkappaB. Neurobiol Aging. 2001;22:765–72. doi: 10.1016/s0197-4580(01)00233-0. [DOI] [PubMed] [Google Scholar]
- 7.Ponath G, Schettler C, Kaestner F, Voigt B, Wentker D, Arolt V, et al. Autocrine S100B effects on astrocytes are mediated via RAGE. J Neuroimmunol. 2007;184:214–22. doi: 10.1016/j.jneuroim.2006.12.011. [DOI] [PubMed] [Google Scholar]
- 8.Mori T, Koyama N, Arendash GW, Horikoshi-Sakuraba Y, Tan J, Town T. Overexpression of human S100B exacerbates cerebral amyloidosis and gliosis in the Tg2576 mouse model of Alzheimer’s disease. Glia. 2010;58:300–14. doi: 10.1002/glia.20924. [DOI] [PMC free article] [PubMed] [Google Scholar]
- 9.Lin J, Yang Q, Yan Z, Markowitz J, Wilder PT, Carrier F, et al. Inhibiting S100B restores p53 levels in primary malignant melanoma cancer cells. J Biol Chem. 2004;279:34071–7. doi: 10.1074/jbc.M405419200. [DOI] [PubMed] [Google Scholar]
- 10.Rustandi RR, Baldisseri DM, Weber DJ. Structure of the negative regulatory domain of p53 bound to S100B(betabeta) Nat Struct Biol. 2000;7:570–4. doi: 10.1038/76797. [DOI] [PubMed] [Google Scholar]
- 11.Millward TA, Heizmann CW, Schafer BW, Hemmings BA. Calcium regulation of Ndr protein kinase mediated by S100 calcium-binding proteins. EMBO J. 1998;17:5913–22. doi: 10.1093/emboj/17.20.5913. [DOI] [PMC free article] [PubMed] [Google Scholar]
- 12.Arcuri C, Bianchi R, Brozzi F, Donato R. S100B increases proliferation in PC12 neuronal cells and reduces their responsiveness to nerve growth factor via Akt activation. J Biol Chem. 2005;280:4402–14. doi: 10.1074/jbc.M406440200. [DOI] [PubMed] [Google Scholar]
- 13.Selinfreund RH, Barger SW, Pledger WJ, Van Eldik LJ. Neurotrophic protein S100 beta stimulates glial cell proliferation. Proc Natl Acad Sci U S A. 1991;88:3554–8. doi: 10.1073/pnas.88.9.3554. [DOI] [PMC free article] [PubMed] [Google Scholar]
- 14.Brozzi F, Arcuri C, Giambanco I, Donato R. S100B Protein Regulates Astrocyte Shape and Migration via Interaction with Src Kinase: IMPLICATIONS FOR ASTROCYTE DEVELOPMENT, ACTIVATION, AND TUMOR GROWTH. J Biol Chem. 2009;284:8797–811. doi: 10.1074/jbc.M805897200. [DOI] [PMC free article] [PubMed] [Google Scholar]
- 15.Zhang L, Liu W, Alizadeh D, Zhao D, Farrukh O, Lin J, et al. S100B attenuates microglia activation in gliomas: possible role of STAT3 pathway. Glia. 2011;59:486–98. doi: 10.1002/glia.21118. [DOI] [PMC free article] [PubMed] [Google Scholar]
- 16.Terada K, Wakimoto H, Tyminski E, Chiocca EA, Saeki Y. Development of a rapid method to generate multiple oncolytic HSV vectors and their in vivo evaluation using syngeneic mouse tumor models. Gene Ther. 2006;13:705–14. doi: 10.1038/sj.gt.3302717. [DOI] [PubMed] [Google Scholar]
- 17.Myint KM, Yamamoto Y, Doi T, Kato I, Harashima A, Yonekura H, et al. RAGE control of diabetic nephropathy in a mouse model: effects of RAGE gene disruption and administration of low-molecular weight heparin. Diabetes. 2006;55:2510–22. doi: 10.2337/db06-0221. [DOI] [PubMed] [Google Scholar]
- 18.Zhao D, Alizadeh D, Zhang L, Liu W, Farrukh O, Manuel E, et al. Carbon nanotubes enhance CpG uptake and potentiate antiglioma immunity. Clin Cancer Res. 2011;17:771–82. doi: 10.1158/1078-0432.CCR-10-2444. [DOI] [PMC free article] [PubMed] [Google Scholar]
- 19.Comprehensive genomic characterization defines human glioblastoma genes and core pathways. Nature. 2008;455:1061–8. doi: 10.1038/nature07385. [DOI] [PMC free article] [PubMed] [Google Scholar]
- 20.Freije WA, Castro-Vargas FE, Fang Z, Horvath S, Cloughesy T, Liau LM, et al. Gene expression profiling of gliomas strongly predicts survival. Cancer Res. 2004;64:6503–10. doi: 10.1158/0008-5472.CAN-04-0452. [DOI] [PubMed] [Google Scholar]
- 21.Gravendeel LA, Kouwenhoven MC, Gevaert O, de Rooi JJ, Stubbs AP, Duijm JE, et al. Intrinsic gene expression profiles of gliomas are a better predictor of survival than histology. Cancer Res. 2009;69:9065–72. doi: 10.1158/0008-5472.CAN-09-2307. [DOI] [PubMed] [Google Scholar]
- 22.Lee Y, Scheck AC, Cloughesy TF, Lai A, Dong J, Farooqi HK, et al. Gene expression analysis of glioblastomas identifies the major molecular basis for the prognostic benefit of younger age. BMC Med Genomics. 2008;1:52. doi: 10.1186/1755-8794-1-52. [DOI] [PMC free article] [PubMed] [Google Scholar]
- 23.Murat A, Migliavacca E, Gorlia T, Lambiv WL, Shay T, Hamou MF, et al. Stem cell-related “self-renewal” signature and high epidermal growth factor receptor expression associated with resistance to concomitant chemoradiotherapy in glioblastoma. J Clin Oncol. 2008;26:3015–24. doi: 10.1200/JCO.2007.15.7164. [DOI] [PubMed] [Google Scholar]
- 24.Petalidis LP, Oulas A, Backlund M, Wayland MT, Liu L, Plant K, et al. Improved grading and survival prediction of human astrocytic brain tumors by artificial neural network analysis of gene expression microarray data. Mol Cancer Ther. 2008;7:1013–24. doi: 10.1158/1535-7163.MCT-07-0177. [DOI] [PMC free article] [PubMed] [Google Scholar]
- 25.Phillips HS, Kharbanda S, Chen R, Forrest WF, Soriano RH, Wu TD, et al. Molecular subclasses of high-grade glioma predict prognosis, delineate a pattern of disease progression, and resemble stages in neurogenesis. Cancer Cell. 2006;9:157–73. doi: 10.1016/j.ccr.2006.02.019. [DOI] [PubMed] [Google Scholar]
- 26.Sun L, Hui AM, Su Q, Vortmeyer A, Kotliarov Y, Pastorino S, et al. Neuronal and glioma-derived stem cell factor induces angiogenesis within the brain. Cancer Cell. 2006;9:287–300. doi: 10.1016/j.ccr.2006.03.003. [DOI] [PubMed] [Google Scholar]
- 27.Verhaak RG, Hoadley KA, Purdom E, Wang V, Qi Y, Wilkerson MD, et al. Integrated genomic analysis identifies clinically relevant subtypes of glioblastoma characterized by abnormalities in PDGFRA, IDH1, EGFR, and NF1. Cancer Cell. 2010;17:98–110. doi: 10.1016/j.ccr.2009.12.020. [DOI] [PMC free article] [PubMed] [Google Scholar]
- 28.R Development Core Team . R: A Language and Environment for Statistical Computing. R Foundation for Statistical Computing; Vienna, Austria: 2010. [Google Scholar]
- 29.Benjamini Y, Hochberg Y. Controlling the False Discovery Rate: A Practical and Powerful Approach to Multiple Testing. Journal of the Royal Statistical Society Series B (Methodological) 1995;57:289–300. [Google Scholar]
- 30.Fan H, Zhang I, Chen X, Zhang L, Wang H, Da Fonseca A, et al. Intracerebral CpG immunotherapy with carbon nanotubes abrogates growth of subcutaneous melanomas in mice. Clin Cancer Res. 2012;18:5628–38. doi: 10.1158/1078-0432.CCR-12-1911. [DOI] [PMC free article] [PubMed] [Google Scholar]
- 31.Bianchi R, Kastrisianaki E, Giambanco I, Donato R. S100B protein stimulates microglia migration via RAGE-dependent up-regulation of chemokine expression and release. J Biol Chem. 2011;286:7214–26. doi: 10.1074/jbc.M110.169342. [DOI] [PMC free article] [PubMed] [Google Scholar]
- 32.Zhai H, Heppner FL, Tsirka SE. Microglia/macrophages promote glioma progression. Glia. 2011;59:472–85. doi: 10.1002/glia.21117. [DOI] [PMC free article] [PubMed] [Google Scholar]
- 33.Du R, Lu KV, Petritsch C, Liu P, Ganss R, Passegué E, et al. HIF1α Induces the Recruitment of Bone Marrow-Derived Vascular Modulatory Cells to Regulate Tumor Angiogenesis and Invasion. Cancer Cell. 2008;13:206–20. doi: 10.1016/j.ccr.2008.01.034. [DOI] [PMC free article] [PubMed] [Google Scholar]
- 34.Badie B, Schartner JM. Flow cytometric characterization of tumor-associated macrophages in experimental gliomas. Neurosurgery. 2000;46:957–61. doi: 10.1097/00006123-200004000-00035. discussion 61-2. [DOI] [PubMed] [Google Scholar]
- 35.Higashino H, Niwa A, Satou T, Ohta Y, Hashimoto S, Tabuchi M, et al. Immunohistochemical analysis of brain lesions using S100B and glial fibrillary acidic protein antibodies in arundic acid- (ONO-2506) treated stroke-prone spontaneously hypertensive rats. J Neural Transm. 2009;116:1209–19. doi: 10.1007/s00702-009-0278-x. [DOI] [PMC free article] [PubMed] [Google Scholar]
- 36.Sinha P, Okoro C, Foell D, Freeze HH, Ostrand-Rosenberg S, Srikrishna G. Proinflammatory S100 proteins regulate the accumulation of myeloid-derived suppressor cells. J Immunol. 2008;181:4666–75. doi: 10.4049/jimmunol.181.7.4666. [DOI] [PMC free article] [PubMed] [Google Scholar]
- 37.Deininger MH, Pater S, Strik H, Meyermann R. Macrophage/microglial cell subpopulations in glioblastoma multiforme relapses are differentially altered by radiochemotherapy. J Neurooncol. 2001;55:141–7. doi: 10.1023/a:1013805915224. [DOI] [PubMed] [Google Scholar]
- 38.Mantovani A, Sica A. Macrophages, innate immunity and cancer: balance, tolerance, and diversity. Current Opinion in Immunology. 2010;22:231–7. doi: 10.1016/j.coi.2010.01.009. [DOI] [PubMed] [Google Scholar]
- 39.Raychaudhuri B, Rayman P, Ireland J, Ko J, Rini B, Borden EC, et al. Myeloid-derived suppressor cell accumulation and function in patients with newly diagnosed glioblastoma. Neuro Oncol. 2011;13:591–9. doi: 10.1093/neuonc/nor042. [DOI] [PMC free article] [PubMed] [Google Scholar]
- 40.Wang SC, Hong JH, Hsueh C, Chiang CS. Tumor-secreted SDF-1 promotes glioma invasiveness and TAM tropism toward hypoxia in a murine astrocytoma model. Lab Invest. 2012;92:151–62. doi: 10.1038/labinvest.2011.128. [DOI] [PubMed] [Google Scholar]
- 41.Lazennec G, Richmond A. Chemokines and chemokine receptors: new insights into cancer-related inflammation. Trends in Molecular Medicine. 2010;16:133–44. doi: 10.1016/j.molmed.2010.01.003. [DOI] [PMC free article] [PubMed] [Google Scholar]
- 42.Kerber M, Reiss Y, Wickersheim A, Jugold M, Kiessling F, Heil M, et al. Flt-1 signaling in macrophages promotes glioma growth in vivo. Cancer Res. 2008;68:7342–51. doi: 10.1158/0008-5472.CAN-07-6241. [DOI] [PubMed] [Google Scholar]
- 43.Held-Feindt J, Hattermann K, Muerkoster SS, Wedderkopp H, Knerlich-Lukoschus F, Ungefroren H, et al. CX3CR1 promotes recruitment of human glioma-infiltrating microglia/macrophages (GIMs) Exp Cell Res. 2010;316:1553–66. doi: 10.1016/j.yexcr.2010.02.018. [DOI] [PubMed] [Google Scholar]
- 44.Hao C, Parney IF, Roa WH, Turner J, Petruk KC, Ramsay DA. Cytokine and cytokine receptor mRNA expression in human glioblastomas: evidence of Th1, Th2 and Th3 cytokine dysregulation. Acta Neuropathol. 2002;103:171–8. doi: 10.1007/s004010100448. [DOI] [PubMed] [Google Scholar]
- 45.Coniglio SJ, Eugenin E, Dobrenis K, Stanley ER, West BL, Symons MH, et al. Microglial stimulation of glioblastoma invasion involves epidermal growth factor receptor (EGFR) and colony stimulating factor 1 receptor (CSF-1R) signaling. Mol Med. 2012;18:519–27. doi: 10.2119/molmed.2011.00217. [DOI] [PMC free article] [PubMed] [Google Scholar]
- 46.Badie B, Schartner J, Klaver J, Vorpahl J. In vitro modulation of microglia motility by glioma cells is mediated by hepatocyte growth factor/scatter factor. Neurosurgery. 1999;44:1077–82. doi: 10.1097/00006123-199905000-00075. discussion 82-3. [DOI] [PubMed] [Google Scholar]
- 47.Leung SY, Wong MP, Chung LP, Chan AS, Yuen ST. Monocyte chemoattractant protein-1 expression and macrophage infiltration in gliomas. Acta Neuropathol. 1997;93:518–27. doi: 10.1007/s004010050647. [DOI] [PubMed] [Google Scholar]
- 48.Desbaillets I, Tada M, de Tribolet N, Diserens AC, Hamou MF, Van Meir EG. Human astrocytomas and glioblastomas express monocyte chemoattractant protein-1 (MCP-1) in vivo and in vitro. Int J Cancer. 1994;58:240–7. doi: 10.1002/ijc.2910580216. [DOI] [PubMed] [Google Scholar]
- 49.Donato R. Intracellular and extracellular roles of S100 proteins. Microscopy Research and Technique. 2003;60:540–51. doi: 10.1002/jemt.10296. [DOI] [PubMed] [Google Scholar]
- 50.Rothermundt M, Peters M, Prehn JH, Arolt V. S100B in brain damage and neurodegeneration. Microsc Res Tech. 2003;60:614–32. doi: 10.1002/jemt.10303. [DOI] [PubMed] [Google Scholar]
- 51.Bierhaus A, Humpert PM, Morcos M, Wendt T, Chavakis T, Arnold B, et al. Understanding RAGE, the receptor for advanced glycation end products. J Mol Med. 2005;83:876–86. doi: 10.1007/s00109-005-0688-7. [DOI] [PubMed] [Google Scholar]
- 52.Rouhiainen A, Kuja-Panula J, Wilkman E, Pakkanen J, Stenfors J, Tuominen RK, et al. Regulation of monocyte migration by amphoterin (HMGB1) Blood. 2004;104:1174–82. doi: 10.1182/blood-2003-10-3536. [DOI] [PubMed] [Google Scholar]
- 53.Reddy MA, Li SL, Sahar S, Kim YS, Xu ZG, Lanting L, et al. Key role of Src kinase in S100B-induced activation of the receptor for advanced glycation end products in vascular smooth muscle cells. J Biol Chem. 2006;281:13685–93. doi: 10.1074/jbc.M511425200. [DOI] [PubMed] [Google Scholar]
- 54.Hayakawa E, Yoshimoto T, Sekizawa N, Sugiyama T, Hirata Y. Overexpression of receptor for advanced glycation end products induces monocyte chemoattractant protein-1 expression in rat vascular smooth muscle cell line. J Atheroscler Thromb. 2012;19:13–22. doi: 10.5551/jat.9472. [DOI] [PubMed] [Google Scholar]
- 55.Tsuyada A, Chow A, Wu J, Somlo G, Chu P, Loera S, et al. CCL2 mediates cross-talk between cancer cells and stromal fibroblasts that regulates breast cancer stem cells. Cancer Res. 2012;72:2768–79. doi: 10.1158/0008-5472.CAN-11-3567. [DOI] [PMC free article] [PubMed] [Google Scholar]
- 56.Bianchi R, Giambanco I, Donato R. S100B/RAGE-dependent activation of microglia via NF-kappaB and AP-1 Co-regulation of COX-2 expression by S100B, IL-1beta and TNF-alpha. Neurobiol Aging. 2010;31:665–77. doi: 10.1016/j.neurobiolaging.2008.05.017. [DOI] [PubMed] [Google Scholar]
- 57.Schmid Michael C, Avraamides Christie J, Dippold Holly C, Franco I, Foubert P, Ellies Lesley G, et al. Receptor Tyrosine Kinases and TLR/IL1Rs Unexpectedly Activate Myeloid Cell PI3Kγ, A Single Convergent Point Promoting Tumor Inflammation and Progression. Cancer Cell. 2011;19:715–27. doi: 10.1016/j.ccr.2011.04.016. [DOI] [PMC free article] [PubMed] [Google Scholar]
- 58.Schmidt AM, Sahagan B, Nelson RB, Selmer J, Rothlein R, Bell JM. The role of RAGE in amyloid-beta peptide-mediated pathology in Alzheimer’s disease. Curr Opin Investig Drugs. 2009;10:672–80. [PubMed] [Google Scholar]
- 59.Bucciarelli LG, Wendt T, Qu W, Lu Y, Lalla E, Rong LL, et al. RAGE blockade stabilizes established atherosclerosis in diabetic apolipoprotein E-null mice. Circulation. 2002;106:2827–35. doi: 10.1161/01.cir.0000039325.03698.36. [DOI] [PubMed] [Google Scholar]
- 60.Yan SD, Chen X, Fu J, Chen M, Zhu H, Roher A, et al. RAGE and amyloid-[beta] peptide neurotoxicity in Alzheimer’s disease. Nature. 1996;382:685–91. doi: 10.1038/382685a0. [DOI] [PubMed] [Google Scholar]
- 61.Takuma K, Fang F, Zhang W, Yan S, Fukuzaki E, Du H, et al. RAGE-mediated signaling contributes to intraneuronal transport of amyloid-β and neuronal dysfunction. Proceedings of the National Academy of Sciences. 2009;106:20021–6. doi: 10.1073/pnas.0905686106. [DOI] [PMC free article] [PubMed] [Google Scholar]
- 62.Zlokovic BV. Neurovascular mechanisms of Alzheimer’s neurodegeneration. Trends in Neurosciences. 2005;28:202–8. doi: 10.1016/j.tins.2005.02.001. [DOI] [PubMed] [Google Scholar]
- 63.Deane R, Singh I, Sagare AP, Bell RD, Ross NT, LaRue B, et al. A multimodal RAGE-specific inhibitor reduces amyloid beta-mediated brain disorder in a mouse model of Alzheimer disease. J Clin Invest. 2012;122:1377–92. doi: 10.1172/JCI58642. [DOI] [PMC free article] [PubMed] [Google Scholar]
- 64.Tseng D, Vasquez-Medrano DA, Brown JM. Targeting SDF-1/CXCR4 to inhibit tumour vasculature for treatment of glioblastomas. Br J Cancer. 2011;104:1805–9. doi: 10.1038/bjc.2011.169. [DOI] [PMC free article] [PubMed] [Google Scholar]
Associated Data
This section collects any data citations, data availability statements, or supplementary materials included in this article.


