

Abstract
Objectives
To evaluate cartilage repair and native tissue using a three-dimensional (3D), radial, ultra-short echo time (UTE) 23Na MR sequence without and with an inversion recovery (IR) preparation pulse for fluid suppression at 7 Tesla (T).
Methods
This study had institutional review board approval. We recruited 11 consecutive patients (41.5±11.8 years) from an orthopaedic surgery practice who had undergone a knee cartilage restoration procedure. The subjects were examined postoperatively (median=26 weeks) with 7-T MRI using: proton-T2 (TR/TE=3,000 ms/60 ms); sodium UTE (TR/TE=100 ms/0.4 ms); fluid-suppressed, sodium UTE adiabatic IR. Cartilage sodium concentrations in repair tissue ([Na+]R), adjacent native cartilage ([Na+]N), and native cartilage within the opposite, non-surgical compartment ([Na+]N2) were calculated using external NaCl phantoms.
Results
For conventional sodium imaging, mean [Na+]R, [Na+]N, [Na+]N2 were 177.8±54.1 mM, 170.1±40.7 mM, 172.2±30 mM respectively. Differences in [Na+]R versus [Na+]N (P=0.59) and [Na+]N versus [Na+]N2 (P=0.89) were not significant. For sodium IR imaging, mean [Na+]R, [Na+]N, [Na+]N2 were 108.9±29.8 mM, 204.6±34.7 mM, 249.9± 44.6 mM respectively. Decreases in [Na+]R versus [Na+]N (P=0.0.0000035) and [Na+]N versus [Na+]N2 (P=0.015) were significant.
Conclusions
Sodium IR imaging at 7 T can suppress the signal from free sodium within synovial fluid. This may allow improved assessment of [Na+] within cartilage repair and native tissue.
Keywords: Cartilage repair, Sodium MRI, Inversion recovery, 7 Tesla, Ultra-high field
Introduction
Over the last two decades, there has been remarkable progress in the field of cartilage restoration procedures. Focal cartilage defects that were once considered permanent are now amenable to treatment with a variety of surgical options, including microfracture, osteochondral autografting/allografting and matrix-assisted autologous chondrocyte implantation [1].
Magnetic resonance imaging (MRI) plays an important role in assessing the surgical outcome and status of the cartilage repair tissue. The morphology of the repair tissue can be evaluated, as well as its integration with adjacent native cartilage [2–4]. Beyond evaluation of morphology, biochemical imaging techniques permit evaluation of native and repair tissue collagen and proteoglycan content [5–10]. These techniques include markers for collagen, such as T2 mapping [11], and markers for proteoglycans, such as T1rho mapping [12, 13], delayed gadolinium-enhanced MRI of cartilage (dGEMRIC) [14], glycosaminoglycan chemical exchange saturation transfer (gagCEST) [9, 15], and sodium MRI [8, 12, 16, 17].
Sodium MRI is considered a reasonable reference standard for cartilage proteoglycan content. Because of the negative fixed-charged density imparted to the cartilage extracellular matrix by sulphate and carboxyl groups of glycosaminoglycans, sodium content is directly proportional to glycosaminoglycan content [18]. In addition, sodium does not require the use of exogenous contrast agent. It does, however, require radiofrequency coils tuned to the sodium Larmor frequency (11.27 MHz/T).
One challenge to the performance of sodium MRI of cartilage is that sodium is present both within cartilage (bound sodium, [Na+]=250–300 mM) and within synovial fluid (free sodium, [Na+]=140–150 mM). Quantitative assessment of sodium within cartilage tissue alone could therefore be rendered difficult or inaccurate secondary to the presence of synovial fluid at the cartilage surface or within cartilage fissures. In the case of native cartilage, sodium concentration may be underestimated. In the case of cartilage repair tissue, sodium concentration may be overestimated if the repair tissue has sodium concentration less than 140–150 mM.
Recently, it has been reported by Madelin et al. [19] that a fluid-suppressed, adiabatic inversion recovery (IR) pulse sequence at 7 Tesla (T) can distinguish between these two pools of sodium based on differences in their T1 relaxation times. The goal of this study was to perform the first clinical application of fluid-suppressed sodium IR imaging by using it in the postoperative assessment of cartilage repair patients from an orthopaedic surgery practice. We compared this sequence with: (1) the conventional three-dimensional (3D) radial ultrashort echo time (UTE) sodium MR pulse sequence without IR at 7 T and (2) fluid-sensitive, proton T2-weighted imaging at 7 T.
Materials and methods
Subjects
This study had institutional review board approval and written informed consent was obtained. From an orthopaedic surgery practice, we recruited 11 consecutive patients who had undergone cartilage restoration procedures (mean age 41.5± 11.8 years; ten males, one female). Table 1 provides the age, cartilage lesion location, type of surgery, and amount of time to imaging follow-up for all subjects. Subjects were excluded if they had absolute or relative contraindications to MRI (metal inside their bodies, claustrophobia).
Table 1.
Summary of patient age and gender, location of cartilage repair procedure, type of procedure, time to follow-up MRI, and morphology of repair tissue
| Patient no. | Age | Sex | Knee | Site | Surgery | Follow-up (weeks) | Defect filling | Integration to border zone | Surface | Structure | Signal intensity |
|---|---|---|---|---|---|---|---|---|---|---|---|
| 1 | 46 | M | Left | Patella lateral | Mfx | 32 | <50% | Complete | Deep ulcer | Heterogeneous | Iso |
| 2 | 50 | M | Right | Lateral femoral condyle | Mfx | 12 | 0% | None | None | None | None |
| 3 | 42 | M | Left | Medial femoral condyle | SG | 68 | <50% | Incomplete-Border visible | Fibrillation | Heterogeneous | Iso |
| 4 | 55 | F | Left | Lateral femoral condyle | Mfx | 96 | >50% | Complete | Fibrillation | Homogeneous | Iso |
| 5 | 31 | M | Right | Patella medial | JCI | 12 | None | None | None | None | None |
| 6 | 51 | M | Right | Medial femoral condyle | OAllo | 104 | >50% | Complete | Intact | Homogeneous | Iso |
| 7 | 41 | M | Right | Medial femoral condyle | SG | 151 | <50% | Incomplete-Border visible | Fibrillation | Homogeneous | Iso |
| 8 | 20 | M | Left | Medial femoral condyle | OAuto | 12 | <50% | Complete | Intact | Homogeneous | Iso |
| 9 | 24 | M | Left | Patella medial | DFR | 14 | 100% | Incomplete-Border visible | Intact | Heterogeneous | Hyper |
| 10 | 54 | M | Right | Lateral trochlea | Mfx | 26 | <50% | Complete | Deep ulcer | Heterogeneous | Iso |
| 11 | 43 | M | Left | Lateral femoral condyle | MACI | 26 | 100% | Incomplete – border visible | Intact | Homogeneous | Hyper |
M male, F female, SI signal intensity, Iso isointense, Hyper hyperintense, Mfx microfracture, SG synthetic graft, JCI juvenile cartilage implant, OAllo osteochondral allograft, OAuto osteochondral autograft, DFR displaced osteochondral fragment reattachment, MCI matrix-assisted autologous chondrocyte implantation
MRI
The entire affected knee of each subject was examined on a commercially available 7-T whole-body MR system (Magnetom, Siemens, Erlangen, Germany).
Two different coils were used for the sodium and proton imaging. For sodium imaging, we used a quadrature bird-cage transmit–receive coil 18 cm in diameter (Rapid MR International, Columbus, OH, USA) tuned to the sodium frequency at 7 T (78.6 MHz). For the sodium data acquisition, we used a 3D radial UTE pulse sequence (TR/TE= 100 ms/0.4 ms, 10,000 projections, 128 points/projection, FOV=20 cm×20 cm×20 cm). For the inversion recovery preparation pulse, we used an adiabatic wide-band uniform rate and smooth transition (WURST) pulse. Although a rectangular pulse has been used for sodium inversion recovery imaging in the brain [20], adiabatic preparation pulses are robust towards B1 and B0 field heterogeneity (which can be problematic at 7 T) and have been shown to be better than a rectangular pulse for suppression of signal from sodium within free fluid [19]. Data acquisition times for the sequences without and with inversion recovery preparation were 17 min 40 s and 21 min, respectively.
For proton imaging, we used a birdcage-transmit, 28 channel-receive knee coil, 18 cm in diameter (Quality Electrodynamics, Mayfield Village, OH, USA). We examined patients using a fat-suppressed, fluid-sensitive, 2D T2-weighted MR sequence (TR/TE=3,000 ms/60 ms, FOV= 14 cm, matrix=256×256 pixels, slice thickness=2 mm, gap size=0.5 mm, acquisition time=6 min 29 s).
Morphology of cartilage repair tissue
Using proton T2-weighted images, we evaluated the morphological characteristics of cartilage repair tissue using criteria defined by previous studies [3, 21]. These criteria included: degree of defect repair and filling of defect (complete, hypertrophy, incomplete [>50%, <50%, subchondral bone exposed]); integration to border zone (complete, incomplete [demarcating border visible, defect visible]); surface of repair tissue (intact, damaged); structure of repair tissue (homogeneous, heterogeneous); signal intensity of repair tissue (isointense, moderately hyperintense, markedly hyperintense).
Generation of [Na+] maps and calculation of [Na+]
The generation of sodium concentration maps and calculation of [Na+] was performed as previously described [19]. In brief, all patients were examined with the same set of calibration phantoms placed adjacent to the patella within the field of view. Sodium concentration was then calculated in MATLAB (Natick, MA, USA) as follows: regions of interest (ROIs) were drawn in four calibration phantoms (150, 200, 250 and 300 mM NaCl) and their average signal intensities were corrected for T1, T2short and T2long of the gels as described in Madelin et al. [19]. Another ROI was drawn in the noise area and the mean value of the noise was used as a 0-mM sodium concentration phantom. A linear regression curve of these corrected phantom intensities and noise versus sodium concentrations was then calculated and used to extrapolate the sodium 3D maps of the whole sample.
For a better estimation of [Na+] in cartilage in vivo, after the regression curve calculation from the gel signals, but before extrapolation of the images to sodium maps, the images were also corrected for the T1, T2short and T2long of cartilage measured in vivo [22]. As 75% of the volume in cartilage is extracellular and composed of water, and sodium ions are mainly present in this space, the sodium maps were divided by 0.75 in order to get the real sodium concentration [23, 24]. Less than 5% of the cartilage volume is composed of cells [25] and the intracellular sodium concentration, estimated to be around 5–10 mM, is considered negligible in this study.
From sodium concentration maps, three regions of interest were drawn in:
The cartilage repair tissue
The native cartilage adjacent to the site of cartilage repair
Native cartilage within a different knee compartment not involved in surgery
The locations of the ROIs were drawn under the guidance of a musculoskeletal radiologist and based on the T2-weighted proton images. The size of the ROI for the cartilage repair tissue was drawn to encompass the entire area of the repair. The size of the ROI for the native cartilage tissue was the same as that of the repair tissue for a given patient. If the repair location was within the patella or femoral trochlea, the medial or lateral knee compartment on the opposite side of the lesion was chosen as the non-surgical knee compartment. In order to ensure that identical ROIs were drawn on sodium inversion recovery and non-inversion recovery datasets, ROIs drawn on one dataset were automatically propagated by MATLAB onto the other dataset.
Reproducibility study
The root mean square coefficient of variation (RMS-CV) of Na MRI for quantification of cartilage sodium concentration at both 3 T and 7 T is reported to be in the range of 7.5–13.6% [26]. This range is similar to that of proton MRI techniques for quantitative assessment of biochemical cartilage composition, such as T2 mapping (3–29%) and T1rho (7–19%) [27, 28]. Similar to these previous studies, we also conducted a reproducibility study by performing MRI on three subjects twice within 1 day and once 1 week later to assess RMS-CV.
Statistical analysis
Statistical analysis was performed using SPSS 16.0 (Somers, NY, USA). We used a two-tailed paired t-test (with P <0.05 as significant) to compare cartilage sodium concentration within:
Cartilage repair tissue versus adjacent native cartilage tissue for images without and with IR
Adjacent native tissue and native tissue within the knee compartment not undergoing surgical repair, also on images without and with IR
Results
Morphology of cartilage repair tissue
Table 1 summarises patient characteristics, locations and types of surgeries, length of follow-up and the morphology of the cartilage repair tissue. Median imaging follow-up was 26 weeks (range=12–151 weeks). The cartilage repair procedures included microfracture (n=5), osteochondral allografting (n=1), osteochondral autografting (n=1), synthetic resorbable graft placement (n=1), detached osteochondral fragment re-implantation (n=1), matrix-assisted autologous chondrocyte implantation (n=1), and juvenile cartilage implantation (n=1). Repair tissue had predominantly: partial thickness defect filling (9/11), incomplete border integration (6/11), surface irregularity (7/11), heterogeneous structure (6/11) and isointense signal (6/11).
Representative 1H images and 23Na concentration maps at 7 T
Figures 1, 2, 3, 4 show representative 7-T proton and sodium maps (without and with inversion recovery) from four patients with different types of cartilage repair procedures, including: an osteochondral allograft (Fig. 1), an osteochondral autograft (Fig. 2), reattachment of a displaced osteochondral fragment (Fig. 3) and synthetic resorbable graft placement (Fig. 4).
Fig. 1.
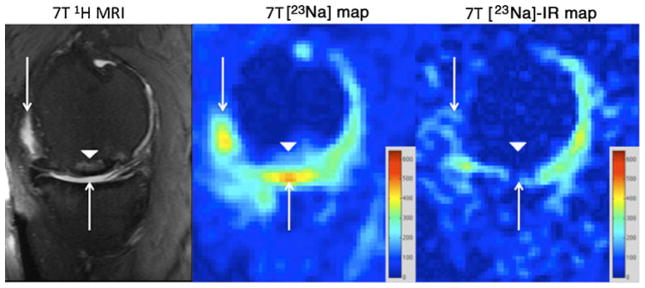
Sagittal T2-weighted 7-T MR image (left panel) of the right knee demonstrating an osteochondral allograft (arrowhead) at the weight-bearing aspect of the medial femoral condyle. There is synovial fluid at the articular surface (arrows). On the conventional 23Na concentration map (middle panel), hyperintense signal is seen from synovial fluid at the articular surface (arrows) and to a lesser extent in a subchondral location at the repair site (arrowhead). On the sodium concentration map generated from 23Na-IR MRI (right panel), there is suppression of signal from free sodium within synovial fluid (arrows) and also in the subchondral location (arrowhead). The sodium images represent concentration maps with coloured bars indicating range of [Na+] in mM (red=600 mM, blue=0 mM). The larger apparent joint space size on sodium maps compared with proton images is likely due to partial volume averaging from the lower resolution of the sodium maps (2 mm×2 mm×2 mm vs 0.546 mm×0.546 mm×2 mm)
Fig. 2.
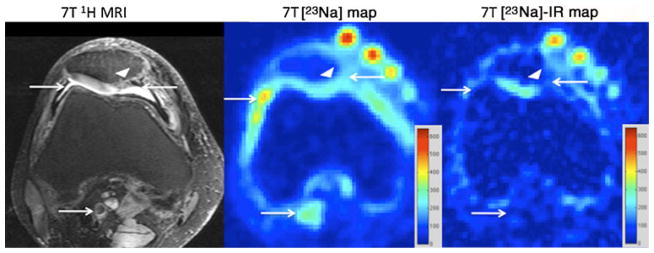
Axial T2-weighted 7-T MR image (left panel) of the right knee, demonstrating a juvenile cartilage cell implantation (arrowhead) at the medial facet of the patella. Structures containing free sodium, such as synovial fluid and popliteal vessels, are indicated by arrows. On the conventional 23Na maps (middle panel), hyperintense signal is seen from synovial fluid at the articular surface and within the popliteal vessels (arrows). On the 23Na-IR map (right panel), there is suppression of signal from free sodium within synovial fluid and within popliteal vessels (arrows). The calibration phantoms containing 300 mM, 250 mM, 200 mM and 150 mM are seen at the anterior aspect of the knee. The sodium images represent concentration maps with coloured bars indicating range of [Na+] in mM (red=600 mM, blue= 0 mM)
Fig. 3.
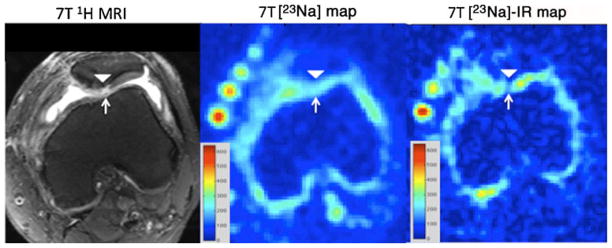
Axial T2-weighted 7-T MR image (left panel) of the left knee, demonstrating a displaced osteochondral fragment re-attachment (arrowhead) at the medial facet of the patella. Synovial fluid is seen within a full-thickness fissure (arrow). On the conventional 23Na map (middle panel), hyperintense signal is seen from synovial fluid within the fissure (arrow). On the 23Na-IR map (right panel), there is suppression of signal from synovial fluid within the fissure. The calibration phantoms containing 300 mM, 250 mM, 200 mM and 150 mM are seen at the anterior aspect of the knee. The sodium images represent concentration maps with coloured bars indicating range of [Na+] in mM (red=600 mM, blue=0 mM)
Fig. 4.
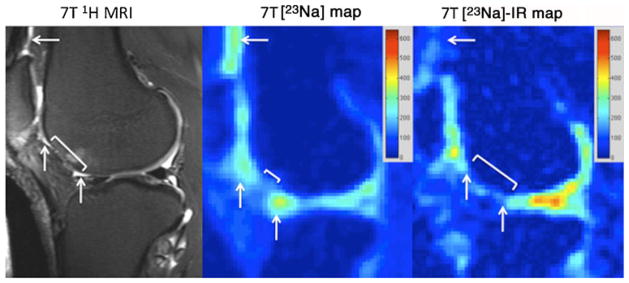
Sagittal T2-weighted 7-T MR image (left panel) of the right knee demonstrating an attempted microfracture (bracket) at the anterior aspect of the lateral femoral condyle. Synovial fluid is seen at the articular surface (arrows). On the conventional 23Na map (middle panel), hyperintense signal is seen from the synovial fluid at the articular surface. On the 23Na-IR maps (right panel), there is suppression of signal from synovial fluid. The sodium images represent concentration maps with coloured bars indicating range of [Na+] in mM (red=600 mM, blue=0 mM). The larger apparent joint space size on sodium maps compared with the proton images is likely due to partial volume averaging from the lower resolution of the sodium maps (2 mm×2 mm×2 mm vs 0.546 mm×0.546 mm×2 mm)
In every case, on the proton images (left panels), synovial fluid is seen either at the cartilage surface or insinuating within cartilage fissures (arrows). For conventional sodium maps (middle panels), signal from free sodium within synovial fluid is present (arrows). Finally, on sodium IR maps (right panels), there is suppression of the signal from free sodium within synovial fluid, as well as blood vessels (arrows).
Cartilage sodium concentration without and with inversion recovery magnetisation preparation
Table 2 provides sodium concentrations calculated from conventional and IR images for repair tissue, adjacent native cartilage within the same compartment, and native cartilage from a different compartment not involved in surgery. Figure 5a illustrates the relationships between sodium concentrations for repair tissue and adjacent native tissue for each patient as measured on conventional and IR images.
Table 2.
Sodium concentrations (mM) calculated from conventional sodium MRI and sodium-inversion recovery MRI for repair tissue, adjacent native cartilage tissue, and native cartilage tissue within the non-surgical compartment (non-surg). P values for comparisons between repair and adjacent native tissue and between native adjacent tissue and native tissue within a non-surgical compartment are shown
|
|
[Na+] in mM
|
[Na+] in mM measured from IR
|
|||||
|---|---|---|---|---|---|---|---|
| Subject No. | Procedure | Repair | Native adjacent | Native non-surg | Repair | Native adjacent | Native non-surg |
| 1 | Mfx | 174.1 ±15.5 | 154.3 ±4.9 | 168.5 ±10.5 | 135.4 ±9.2 | 194.9 ±12.4 | 234.0 ±17.7 |
| 2 | Mfx | 113.1 ±19.7 | 126.2 ±35.4 | 176.4 ±12.5 | 65.9 ±13.1 | 232.2 ±72.1 | 299.5 ±11.7 |
| 3 | SG | 131.4 ±12.5 | 117.3 ±24.2 | 213.5 ±14.4 | 113.0 ±7.3 | 172.9 ±20.5 | 285.1 ±16.5 |
| 4 | Mfx | 154.3 ±25.5 | 168.4 ±12.7 | 162.5 ±17.9 | 120.5 ±32.3 | 212.2 ±19.5 | 279.7 ±22.8 |
| 5 | JCI | 182.7 ±5.7 | 202.7 ±32.3 | 154.7 ±8.2 | 78.7 ±6.1 | 217.1 ±13.8 | 274.5 ±22.9 |
| 6 | OAllo | 265.6 ±17.5 | 187.0 ±3.4 | 200.8 ±18.9 | 153.8 ±15.7 | 207.2 ±13.4 | 295.3 ±15.8 |
| 7 | SG | 283.9 ±59.1 | 238.7 ±24.1 | 219.3 ±16.6 | 72.6 ±20.1 | 140.9 ±27.3 | 255.2 ±29.0 |
| 8 | OAuto | 190.4 ±57.7 | 156.1 ±24.8 | 125.8 ±34.1 | 94.3 ±35.7 | 201.6 ±48.8 | 257.3 ±24.7 |
| 9 | DFR | 150.9 ±10.5 | 162.5 ±20.5 | 175.3 ±8.1 | 120.8 ±22.4 | 217.8 ±30.3 | 270.7 ±19.7 |
| 10 | Mfx | 126.2 ±14.3 | 173.7 ±19.5 | 168.3 ±21.6 | 96.4 ±19.5 | 141.0 ±8.1 | 136.3 ±22.4 |
| 11 | MACI | 183.8 ±16.4 | 154.2 ±12.6 | 129.6 ±6.1 | 146.7 ±27.7 | 255.4 ±30.8 | 222.0 ±20.0 |
| Mean | 177.8 | 170.1 | 172.2 | 108.9 | 204.6 | 249.8 | |
| Standard deviation | ±54.1 | ±40.7 | ±30.3 | ±29.8 | ±34.7 | ±44.6 | |
| P value: repair vs native adjacent | 0.59 | 0.0000035 | |||||
| P value: native adjacent vs native non-surg | 0.89 | 0.015 | |||||
Fig. 5.

a Graphs indicating the sodium concentrations for cartilage repair tissue and native adjacent cartilage tissue for each patient, calculated from both conventional 23Na maps and 23Na-IR maps. A statistically significant decrease in mean repair tissue sodium concentration is detected on 23 Na-IR maps (P=0.0000035), but not on conventional 23Na maps (P=0.59). b Graphs indicating the sodium concentrations for native cartilage adjacent to the repair site and native cartilage tissue within a different compartment not involved in surgery. This was calculated for each patient, from both conventional 23Na maps and 23Na-IR maps. A statistically significant decrease in adjacent native cartilage sodium concentration compared with native cartilage within a non-surgical compartment is detected on 23Na-IR maps (P=0.015), but not on conventional 23Na maps (P=0.89)
A statistically significant decrease in [Na+] in the repair tissue compared with adjacent native tissue was identified on IR maps only. On the conventional sodium maps, mean [Na+] within repair tissue and native tissue were 177.8± 54.1 mM and 170.1±40.7 mM, respectively (P=0.59). On sodium IR maps, mean [Na+] within repair tissue and native tissue were 108.9±29.8 mM and 204.6±34.7 mM, respectively (P=0.0000035).
Figure 5b illustrates the relationships between sodium concentrations for native cartilage tissue adjacent to the repair tissue compared with native tissue within a different, non-surgical compartment for each patient as measured on conventional and IR images. A statistically significant decrease in sodium concentration within native cartilage within the surgical compartment compared with native cartilage within the non-surgical compartment was identified on IR images only.
On the conventional sodium maps, mean sodium concentrations within native tissue within the surgical and non-surgical compartments were 170.1±40.7 mM and 172.2± 30.2 mM, respectively (P=0.89). On sodium IR maps, mean sodium concentrations within native tissue within the surgical and non-surgical compartments were 204.6±34.7 mM and 249.8±44.6 mM, respectively (P=0.015).
The RMS-CVs for the measurement of cartilage sodium concentration using conventional and inversion recovery imaging were 7.9% and 4.7%, respectively.
Discussion
In summary, we have applied a fluid-suppressed, sodium IR pulse sequence at 7 T to evaluate cartilage repair patients postoperatively. This sequence suppresses the signal from free sodium within synovial fluid in the same manner as when fluid-attenuated inversion recovery (FLAIR) is used in brain imaging to suppress signal from mobile free water protons in cerebrospinal fluid. As a result, it is feasible to quantitatively assess the sodium signal from within cartilage tissue alone. In this study of cartilage repair patients, use of this sodium IR sequence allowed statistically significant decreases in sodium concentration to become detectable in: (1) cartilage repair tissue compared with adjacent native cartilage tissue and (2) adjacent native cartilage tissue compared with native cartilage tissue within a different knee compartment not involved in surgery. Without the use of the IR sequence, these statistically significant differences were not detectable.
As the number of surgical options for the treatment of focal cartilage defects has increased [1], there has been increasing interest in non-invasive imaging techniques to assess the quality of cartilage repair tissue and surgical outcomes [2]. Numerous previous studies have demonstrated the ability of biochemical MR imaging techniques (T2 mapping, dGEMRIC, gagCEST, sodium MRI) to distinguish cartilage repair tissue from native tissue [5, 7–9, 29].
In this study, statistically significant relationships between repair tissue and native tissue and between native tissue within different compartments were detectable only when the sodium IR pulse sequence was used. For native cartilage tissue ([Na+] typically 250–300 mM), mean [Na+] was higher when the IR sequence was used; this is consistent with the presence of synovial fluid ([Na+]=140–150 mM), causing underestimation of cartilage sodium concentration on non-fluid-suppressed imaging. For repair tissue, mean [Na+] was lower when the IR sequence was used; this is consistent with the presence of synovial fluid causing overestimation of repair tissue sodium concentration on non-fluid-suppressed imaging.
The finding that repair tissue mean [Na+] was lower than that of adjacent native cartilage tissue is consistent with the results of previously published studies. In these studies, regardless of type of procedure or whether imaging was performed by dGEMRIC [10], sodium MRI [8, 9] or gagC-EST [9], these studies showed that repair tissue proteoglycan content is decreased compared with native cartilage tissue. (It should be noted that prior studies of sodium MRI [8, 9] evaluated sodium signal intensity only, rather than sodium concentration as in this study; however, the conclusions are the same.)
The finding that native cartilage tissue within the injury/surgical compartment has lower [Na+] compared with native cartilage tissue within the non-surgical compartment has, to the best of our knowledge, not been described before. However, this is consistent with ex vivo studies demonstrating that trauma to the articular surface results in: (1) proteoglycan release from the cartilage matrix [30] and (2) a gradient of chondrocyte damage along the cartilage surface extending from the site of osteochondral injury outwards, with non-viable chondrocytes at the site injury and greater numbers of viable chondrocytes further from the injury site [31].
For the sodium data acquisition, we used a 3D radial UTE sequence. Bound sodium has a bi-exponential T2 decay with a fast component of 0.5–8 ms and a slow component of 15–30 ms, which account for approximately 60% and 40% of the sodium signal, respectively [32]. The use of a UTE sequence will, therefore, decrease T2* signal loss. The 3D radial sequence is well suited for short TE imaging as no slice selection pulse is required, thus minimising the delay between excitation and data acquisition. In addition, the k-space trajectory begins at the origin of k-space, allowing efficient sampling of low-frequency, high-amplitude data. Finally, for magnetisation preparation, we used an adiabatic inversion recovery pulse, which has been shown to be better than a rectangular inversion recovery pulse for fluid-suppressed sodium imaging at 7 T [19].
This study has limitations. First, this is a preliminary study with a low number of patients. However, as an initial demonstration of feasibility, the number of subjects was enough to demonstrate statistical significance. Second, patients had a variety of cartilage repair procedures, which influenced the type of repair tissue generated, and thus the repair tissue sodium concentration. Related to this, there may also be heterogeneity in sodium concentration within the repair tissue itself (as suggested by standard deviations shown in Table 2) due to the variation in type of surgery, whether any degeneration is present, and the maturity/stage of the repair tissue. We note, however, that we recruited consecutive patients in order to more accurately reflect the clinical reality of an orthopaedic surgery practice that performs different types of surgeries and sends these patients for imaging assessment. Furthermore, the presence of different types and locations of cartilage repair procedures, if anything, would make statistically significant differences more difficult to detect. Third, we do not have clinical, surgical, or non-MR imaging correlation with the results. In the future, it would be interesting to know if the findings correlate with clinical symptoms or with cartilage morphology evaluated on arthroscopy or other imaging techniques. Finally, ROIs to assess the sodium concentrations were drawn manually. Even though some repair sites were as small as 10 mm, the ROIs on the non-inversion recovery and inversion recovery images were identical, as they were automatically propagated by MATLAB from one dataset onto the other.
In conclusion, we performed 7-T sodium MRI of cartilage-repair patients both with and without an inversion recovery preparation pulse for suppression of sodium signal from free fluid. In this preliminary study, the use of a fluid-suppressed, adiabatic inversion recovery pulse sequence allowed significant differences in sodium concentration between cartilage repair and native tissue and among native tissue within different compartments to become detectable. Future studies will be needed with larger patient populations in order to determine the clinical utility of this technique.
Given the increase in volume and types of cartilage restoration procedures being performed, this technique may facilitate the more accurate assessment of cartilage repair tissue quality and the efficacies of different procedures. This technique could also be applied to the evaluation of cartilage biochemical composition in degenerative osteoarthritis or arthroses in which a metric of cartilage proteoglycan concentration is desired.
Key Points.
NaIR magnetic resonance imaging can suppress signal from sodium within synovial fluid.
NaIR MRI thus allows assessment of sodium concentration within cartilage tissue alone.
This may facilitate more accurate assessment of repair tissue composition and quality.
Acknowledgments
The authors acknowledge grant support from the Radiological Society of North America (RR0806) RSNA and the United States National Institutes of Health (NIH/NIAMS K23AR059748, R01AR056260, R01AR053133, R01AR060238).
Contributor Information
Gregory Chang, Email: gregory.chang@nyumc.org, Quantitative Multinuclear Musculoskeletal Imaging Group, Center for Biomedical Imaging, Department of Radiology, NYU Langone Medical Center, 660 First Avenue, New York, NY 10016, USA.
Guillaume Madelin, Quantitative Multinuclear Musculoskeletal Imaging Group, Center for Biomedical Imaging, Department of Radiology, NYU Langone Medical Center, 660 First Avenue, New York, NY 10016, USA.
Orrin H. Sherman, Department of Orthopedic Surgery, Hospital for Joint Diseases—NYU School of Medicine, 301 East 17th Street, New York, NY 10003, USA
Eric J. Strauss, Department of Orthopedic Surgery, Hospital for Joint Diseases—NYU School of Medicine, 301 East 17th Street, New York, NY 10003, USA
Ding Xia, Quantitative Multinuclear Musculoskeletal Imaging Group, Center for Biomedical Imaging, Department of Radiology, NYU Langone Medical Center, 660 First Avenue, New York, NY 10016, USA.
Michael P. Recht, Quantitative Multinuclear Musculoskeletal Imaging Group, Center for Biomedical Imaging, Department of Radiology, NYU Langone Medical Center, 660 First Avenue, New York, NY 10016, USA
Alexej Jerschow, Department of Chemistry, New York University, Waverly Building, Room 966, 24 Waverly Place, New York, NY 10003, USA.
Ravinder R. Regatte, Quantitative Multinuclear Musculoskeletal Imaging Group, Center for Biomedical Imaging, Department of Radiology, NYU Langone Medical Center, 660 First Avenue, New York, NY 10016, USA
References
- 1.Williams RJ. Cartilage repair strategies. Humana Press; Totowa: 2007. [Google Scholar]
- 2.Trattnig S, Domayer S, Welsch GW, Mosher T, Eckstein F. MR imaging of cartilage and its repair in the knee – a review. Eur Radiol. 2009;19:1582–1594. doi: 10.1007/s00330-009-1352-3. [DOI] [PubMed] [Google Scholar]
- 3.Marlovits S, Striessnig G, Resinger CT, et al. Definition of pertinent parameters for the evaluation of articular cartilage repair tissue with high-resolution magnetic resonance imaging. Eur J Radiol. 2004;52:310–319. doi: 10.1016/j.ejrad.2004.03.014. [DOI] [PubMed] [Google Scholar]
- 4.Potter HG, Foo LF. Magnetic resonance imaging of articular cartilage: trauma, degeneration, and repair. Am J Sports Med. 2006;34:661–677. doi: 10.1177/0363546505281938. [DOI] [PubMed] [Google Scholar]
- 5.Trattnig S, Mamisch TC, Welsch GH, et al. Quantitative T2 mapping of matrix-associated autologous chondrocyte transplantation at 3 Tesla: an in vivo cross-sectional study. Invest Radiol. 2007;42:442–448. doi: 10.1097/01.rli.0000262088.67368.49. [DOI] [PubMed] [Google Scholar]
- 6.Trattnig S, Mamisch TC, Pinker K, et al. Differentiating normal hyaline cartilage from post-surgical repair tissue using fast gradient echo imaging in delayed gadolinium-enhanced MRI (dGEMRIC) at 3 Tesla. Eur Radiol. 2008;18:1251–1259. doi: 10.1007/s00330-008-0859-3. [DOI] [PubMed] [Google Scholar]
- 7.White LM, Sussman MS, Hurtig M, Probyn L, Tomlinson G, Kandel R. Cartilage T2 assessment: differentiation of normal hyaline cartilage and reparative tissue after arthroscopic cartilage repair in equine subjects. Radiology. 2006;241:407–414. doi: 10.1148/radiol.2412051750. [DOI] [PubMed] [Google Scholar]
- 8.Trattnig S, Welsch GH, Juras V, et al. 23Na MR imaging at 7 T after knee matrix-associated autologous chondrocyte transplantation preliminary results. Radiology. 2010;257:175–184. doi: 10.1148/radiol.10100279. [DOI] [PubMed] [Google Scholar]
- 9.Schmitt B, Zbyn S, Stelzeneder D, et al. Cartilage quality assessment by using glycosaminoglycan chemical exchange saturation transfer and 23Na MR imaging at 7 T. Radiology. 2011;260:257–264. doi: 10.1148/radiol.11101841. [DOI] [PubMed] [Google Scholar]
- 10.Trattnig S, Marlovits S, Gebetsroither S, et al. Three-dimensional delayed gadolinium-enhanced MRI of cartilage (dGEMRIC) for in vivo evaluation of reparative cartilage after matrix-associated autologous chondrocyte transplantation at 3.0 T: preliminary results. J Magn Reson Imaging. 2007;26:974–982. doi: 10.1002/jmri.21091. [DOI] [PubMed] [Google Scholar]
- 11.Mosher TJ, Dardzinski BJ. Cartilage MRI T2 relaxation time mapping: overview and applications. Semin Musculoskelet Radiol. 2004;8:355–368. doi: 10.1055/s-2004-861764. [DOI] [PubMed] [Google Scholar]
- 12.Borthakur A, Mellon E, Niyogi S, Witschey W, Kneeland JB, Reddy R. Sodium and T1rho MRI for molecular and diagnostic imaging of articular cartilage. NMR Biomed. 2006;19:781–821. doi: 10.1002/nbm.1102. [DOI] [PMC free article] [PubMed] [Google Scholar]
- 13.Li X, Benjamin Ma C, Link TM, et al. In vivo T(1rho) and T (2) mapping of articular cartilage in osteoarthritis of the knee using 3 T MRI. Osteoarthr Cart. 2007;15:789–797. doi: 10.1016/j.joca.2007.01.011. [DOI] [PMC free article] [PubMed] [Google Scholar]
- 14.Burstein D, Gray M, Mosher T, Dardzinski B. Measures of molecular composition and structure in osteoarthritis. Radiol Clin North Am. 2009;47:675–686. doi: 10.1016/j.rcl.2009.04.003. [DOI] [PubMed] [Google Scholar]
- 15.Ling W, Regatte RR, Navon G, Jerschow A. Assessment of glycosaminoglycan concentration in vivo by chemical exchange-dependent saturation transfer (gagCEST) Proc Natl Acad Sci USA. 2008;105:2266–2270. doi: 10.1073/pnas.0707666105. [DOI] [PMC free article] [PubMed] [Google Scholar]
- 16.Wang L, Wu Y, Chang G, et al. Rapid isotropic 3D-sodium MRI of the knee joint in vivo at 7 T. J Magn Reson Imaging. 2009;30:606–614. doi: 10.1002/jmri.21881. [DOI] [PMC free article] [PubMed] [Google Scholar]
- 17.Staroswiecki E, Bangerter NK, Gurney PT, Grafendorfer T, Gold GE, Hargreaves BA. In vivo sodium imaging of human patellar cartilage with a 3D cones sequence at 3 T and 7 T. J Magn Reson Imaging. 2010;32:446–451. doi: 10.1002/jmri.22191. [DOI] [PMC free article] [PubMed] [Google Scholar]
- 18.Wheaton AJ, Borthakur A, Shapiro EM, et al. Proteoglycan loss in human knee cartilage: quantitation with sodium MR imaging – feasibility study. Radiology. 2004;231:900–905. doi: 10.1148/radiol.2313030521. [DOI] [PubMed] [Google Scholar]
- 19.Madelin G, Lee JS, Inati S, Jerschow A, Regatte RR. Sodium inversion recovery MRI of the knee joint in vivo at 7 T. J Magn Reson. 2010;207:42–52. doi: 10.1016/j.jmr.2010.08.003. [DOI] [PMC free article] [PubMed] [Google Scholar]
- 20.Stobbe R, Beaulieu C. In vivo sodium magnetic resonance imaging of the human brain using soft inversion recovery fluid attenuation. Magn Reson Med. 2005;54:1305–1310. doi: 10.1002/mrm.20696. [DOI] [PubMed] [Google Scholar]
- 21.Marlovits S, Singer P, Zeller P, Mandl I, Haller J, Trattnig S. Magnetic resonance observation of cartilage repair tissue (MOCART) for the evaluation of autologous chondrocyte transplantation: determination of interobserver variability and correlation to clinical outcome after 2 years. Eur J Radiol. 2006;57:16–23. doi: 10.1016/j.ejrad.2005.08.007. [DOI] [PubMed] [Google Scholar]
- 22.Madelin G, Jerschow A, Regatte RR. Sodium relaxation times in the knee joint in vivo at 7 T. NMR Biomed. 2011 doi: 10.1002/nbm.1768. [DOI] [PMC free article] [PubMed] [Google Scholar]
- 23.Shapiro EM, Borthakur A, Kaufman JH, Leigh JS, Reddy R. Water distribution patterns inside bovine articular cartilage as visualized by 1H magnetic resonance imaging. Osteoarthr Cart. 2001;9:533–538. doi: 10.1053/joca.2001.0428. [DOI] [PubMed] [Google Scholar]
- 24.Borthakur A, Shapiro EM, Akella SV, Gougoutas A, Kneeland JB, Reddy R. Quantifying sodium in the human wrist in vivo by using MR imaging. Radiology. 2002;224:598–602. doi: 10.1148/radiol.2242011039. [DOI] [PubMed] [Google Scholar]
- 25.Kuettner KE. Biochemistry of articular cartilage in health and disease. Clin Biochem. 1992;25:155–163. doi: 10.1016/0009-9120(92)90224-g. [DOI] [PubMed] [Google Scholar]
- 26.Madelin G, Babb JS, Xia D, Chang G, Jerschow A, Regatte RR. Reproducibility and repeatibility of quantitative sodium MRI in vivo in articular cartilage at 3 T and 7 T. Magn Reson Med. 2011 doi: 10.1002/mrm.23307. [DOI] [PMC free article] [PubMed] [Google Scholar]
- 27.Glaser C, Mendlik T, Dinges J, et al. Global and regional reproducibility of T2 relaxation time measurements in human patellar cartilage. Magn Reson Med. 2006;56:527–534. doi: 10.1002/mrm.21005. [DOI] [PubMed] [Google Scholar]
- 28.Mosher TJ, Zhang Z, Reddy R, et al. Knee articular cartilage damage in osteoarthritis: analysis of MR image biomarker reproducibility in ACRIN-PA 4001 multicenter trial. Radiology. 2011;258:832–842. doi: 10.1148/radiol.10101174. [DOI] [PMC free article] [PubMed] [Google Scholar]
- 29.Welsch GH, Apprich S, Zbyn S, et al. Biochemical (T2, T2* and magnetisation transfer ratio) MRI of knee cartilage: feasibility at ultra-high field (7 T) compared with high field (3 T) strength. Eur Radiol. 2010 doi: 10.1007/s00330-010-2029-7. [DOI] [PubMed] [Google Scholar]
- 30.DiMicco MA, Patwari P, Siparsky PN, et al. Mechanisms and kinetics of glycosaminoglycan release following in vitro cartilage injury. Arthritis Rheum. 2004;50:840–848. doi: 10.1002/art.20101. [DOI] [PubMed] [Google Scholar]
- 31.Tochigi Y, Buckwalter JA, Martin JA, et al. Distribution and progression of chondrocyte damage in a whole-organ model of human ankle intra-articular fracture. J Bone Joint Surg Am. 2011;93:533–539. doi: 10.2106/JBJS.I.01777. [DOI] [PMC free article] [PubMed] [Google Scholar]
- 32.Bansal N, Szczepaniak L, Ternullo D, Fleckenstein JL, Malloy CR. Effect of exercise on (23)Na MRI and relaxation characteristics of the human calf muscle. J Magn Reson Imaging. 2000;11:532–538. doi: 10.1002/(sici)1522-2586(200005)11:5<532::aid-jmri9>3.0.co;2-#. [DOI] [PubMed] [Google Scholar]