Abstract
Aberrant expression of apurinic-apyrimidinic endonuclease–1 (APEX1) has been reported in numerous human solid tumors and is positively correlated with cancer progression; however, the role of APEX1 in tumor progression is poorly defined. Here, we show that APEX1 contributes to aggressive colon cancer behavior and functions as an upstream activator in the Jagged1/Notch signaling pathway. APEX1 overexpression or knockdown in human colon cancer cell lines induced profound changes in malignant properties such as cell proliferation, anchorage-independent growth, migration, invasion, and angiogenesis in vitro and in tumor formation and metastasis in mouse xenograft models. These oncogenic effects of APEX1 were mediated by the upregulation of Jagged1, a major Notch ligand. Furthermore, APEX1 expression was associated with Jagged1 in various colon cancer cell lines and in tissues from colon cancer patients. This finding identifies APEX1 as a positive regulator of Jagged1/Notch activity and suggests that it is a potential therapeutic target in colon cancers that exhibit high levels of Jagged1/Notch signaling.
Introduction
Notch signaling plays an important role in determining cell fate and maintaining progenitor cell populations as well as the balance among cell proliferation, differentiation, and apoptosis (1). Abnormal activation of the Notch signaling pathway has been linked to various developmental disorders and multiple malignancies (2, 3).
The Notch pathway is activated when specific ligands, such as Jagged1 (encoded by JAG1), bind to 4 related transmembrane Notch receptors. Upon ligand binding, Notch proteins are cleaved by the γ-secretase protease complex, releasing the Notch intercellular domain. Cleaved Notch then translocates to the nucleus, where it interacts with the DNA-binding factor C-promoter binding factor–1 (CBF-1; also known as RBP-Jκ or CSL) and transcriptional coactivators to modulate the expression of target genes (4). Because Notch mutations in solid tumors are rare (5, 6), other mechanisms of activation — including Notch gene amplification (7), loss of negative regulators (8), and activation by ligands (9) — have been proposed. In the intestine, Notch signaling pathways are required for the maintenance of intestinal homeostasis and play major roles in the development of colorectal cancer (5, 10, 11). Recent studies have unraveled the cross-talk between the Notch and Wnt pathways in colon adenomas, through β-catenin–mediated transcriptional activation of the Notch ligand Jagged1 (12, 13). However, much remains to be learned about the pathways involved in the upstream control of Notch activity.
Apurinic-apyrimidinic endonuclease–1 (APEX1; also known as redox factor-1 [Ref-1]) is a multifunctional protein responsible for the repair of single-strand DNA breaks and Ap sites. It also stimulates the DNA-binding activity of a number of transcription factors involved in cancer promotion and progression, such as AP1, NF-κB, p53, early growth response 1 (EGR1), MYB, HLF, and PAX8 (14, 15). APEX1 is often overexpressed in solid tumors (16–21), and its expression level and subcellular localization have been related to clinical stage and poor prognosis in various tumors, including breast cancer, cervical cancer, colorectal cancer, hepatic cancer, prostate cancer, and osteosarcoma (18, 21–25).
Several lines of evidence implicate APEX1 in cancer cell growth and tumorigenicity. For example, APEX1 plays a role in sustaining cell viability and proliferation in colon cancer and breast cancer cells (26). APEX1 knockdown in ovarian cancer cells led to a decrease in proliferation in vitro and the growth of an ovarian tumor xenograft (27). In pancreatic cancer, APEX1 has been implicated in anticancer properties at multiple functional levels, such as inhibition of cancer cell migration and invasion (28, 29) and inhibition of pancreatic tumor growth in both cell line and xenograft models (30). Moreover, APEX1 depletion significantly suppressed tumor promoter–induced colony formation of mouse epithelial cells in soft agar (31), and inhibition of the APEX1 redox domain suppressed tumor-associated endothelial cell growth and angiogenesis (32). Accumulating evidence shows that APEX1 overexpression is positively correlated with cancer progression, making it an intriguing potential target for anticancer therapies. Thus, APEX1 represents a therapeutic target in need of further investigation.
In the present study, we investigated the possible role of APEX1 in tumorigenicity of colon cancer and explored the oncogenic mechanism of APEX1 in colon cancer cells.
Results
APEX1 enhances tumorigenicity in human fibroblast GM00637 and colon cancer cell lines.
To evaluate the tumorigenic effects of APEX1 expression in noncancerous cells, we generated GM00637 cells (an immortalized human fibroblast cell line) stably overexpressing full-length APEX1 (referred to herein as GM00637-APEX1 cells) or the control vector. We first explored the effects of APEX1 overexpression on cell growth in low-serum (1% FBS) medium. Compared with the control cells, GM00637-APEX1 cells were significantly more visible and proliferative in low-serum medium (Supplemental Figure 1A; supplemental material available online with this article; doi: 10.1172/JCI65521DS1). We next examined the capacity of APEX1 to drive anchorage-independent growth in soft agar colony formation assays. Whereas control cells induced the formation of only a few colonies in soft agar, GM00637-APEX1 cells formed numerous colonies after 4 weeks (Supplemental Figure 1B), demonstrating that APEX1 could induce a transformed phenotype. Additionally, APEX1 overexpression enhanced the migratory potential of GM00637 cells, as demonstrated by wound-healing and Transwell assays (Supplemental Figure 1, C and D).
Given that APEX1 controls cell proliferation, transformation, and migration in GM00637 cells, that APEX1 plays a role in proliferation in colon cancer cells, and that increased APEX1 levels in colon cancer are associated with poor prognosis (24), we studied its potential effects on colon cancer progression. Western blot analysis in different human colon cell lines revealed high levels of APEX1 expression in NCI-H548, NCI-H716, DLD1, KM12SM, and KM12C cells, but low levels in SW480, HT29, and NCI-H747 cells (see below).
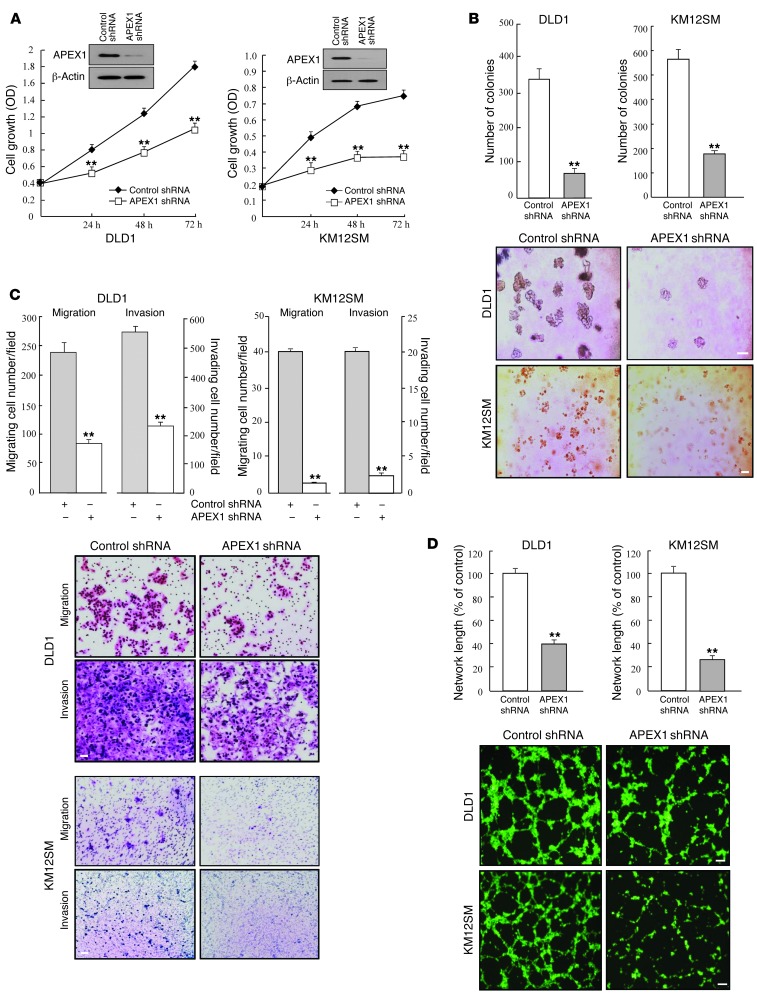
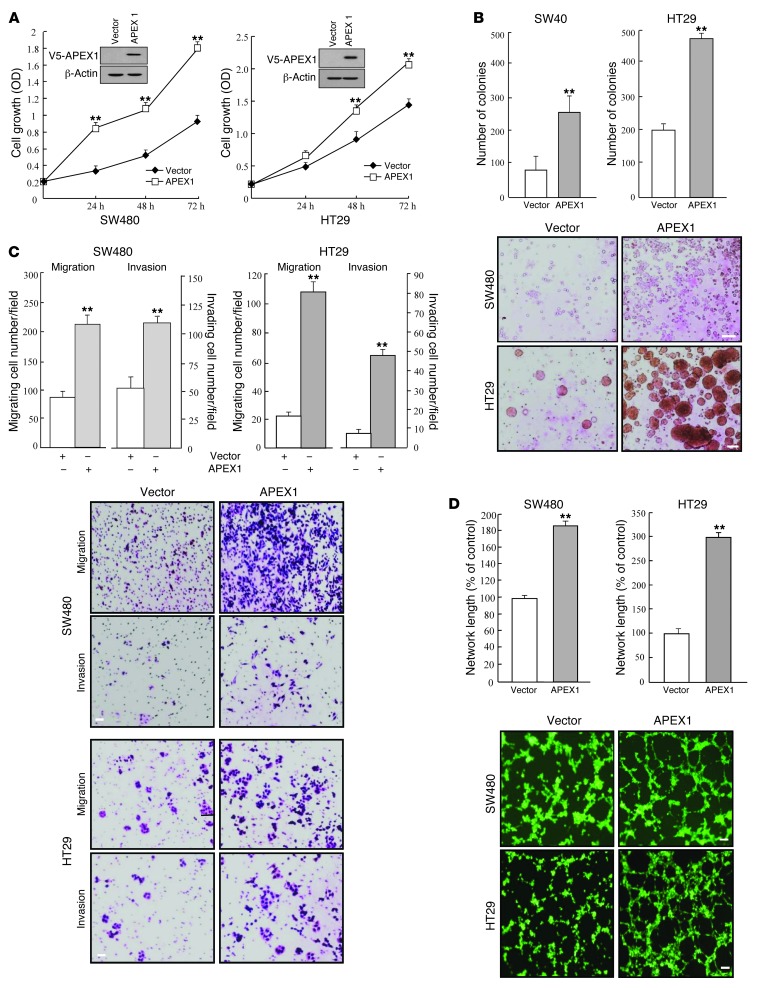
To assess the contribution of APEX1 to the tumorigenic potential of colon cancer cells, we analyzed the effects of APEX1 depletion on the ability of these cells to proliferate and grow in an anchorage-independent manner. After initially using siRNA to transiently reduce APEX1 protein levels, we sought to increase the knockdown efficiency by using DLD1 and KM12SM colon cancer cell lines, which normally express a high level of APEX1, to produce cell lines stably expressing reduced levels of APEX1. Thus, we generated a shRNA construct encoding an APEX1-targeting shRNA and used it to establish stable APEX1-knockdown DLD1 and KM12SM cell lines (referred to herein as APEX1-shRNA/DLD1 and APEX1-shRNA/KM12SM cells, respectively). Importantly, APEX1 depletion clearly slowed cell proliferation and also significantly impaired colony formation by DLD1 and KM12SM cells in soft agar (Figure 1, A and B). Additionally, APEX1-shRNA/DLD1 and APEX1-shRNA/KM12SM cells migrated and invaded approximately 60%–80% less than control shRNA–transfected cells (Figure 1C). Angiogenesis was also robustly inhibited in APEX1-shRNA/DLD1 and APEX1-shRNA/KM12SM cells (Figure 1D). These results suggest that APEX1 regulates the tumorigenic behavior of colon cancer cells. We next explored the effect of ectopic expression of APEX1 on tumorigenicity of SW480 and HT29 colon cancer cell lines, which express low endogenous levels of APEX1. After stable transfection with an APEX1 cDNA expression construct, the resulting APEX1-overexpressing SW480 and HT29 cells (referred to herein as SW480-APEX1 and HT29-APEX1 cells, respectively) demonstrated significant increases in cellular proliferation, colony-forming activity in soft agar, invasion and migration ability, and angiogenesis (Figure 2, A–D). Together, these results indicate that the expression of endogenous APEX1 in colon cancer cells may be important for maintaining proliferative, migratory, invasive, and angiogenic capacities.
Figure 1. APEX1 regulates tumorigenic features in DLD1 and KM12SM human colon cancer cell lines.
DLD1 and KM12SM cells were transfected with control or APEX1 shRNA. (A) Growth curves and Western blot analysis. (B) Anchorage-independent colony formation on soft agar. (C) Cell migration and invasion. Data represent the average cell number from 5 viewing fields. (D) Tube formation assays were performed by culturing HUVECs in tube formation with supernatants from the indicated cells. Results in A–D are mean ± SD (n = 3). **P < 0.01. Scale bars: 150 μm (B); 40 μm (C); 80 μm (D).
Figure 2. APEX1 regulates tumorigenic features in SW480 and HT29 human colon cancer cell lines.
SW480 and HT29 cells were transfected with control or APEX1-expressing vector. (A) Growth curves and Western blot analysis. (B) Colony formation on soft agar after 14 days of culture. (C) Cell migration and invasion. (D) Tube formation assays were performed by culturing HUVECs in tube formation with supernatants from the indicated cells. Results in A–D are mean ± SD (n = 3). **P < 0.01. Scale bars: 150 μm (B); 40 μm (C); 80 μm (D).
APEX1 upregulates JAG1 gene expression.
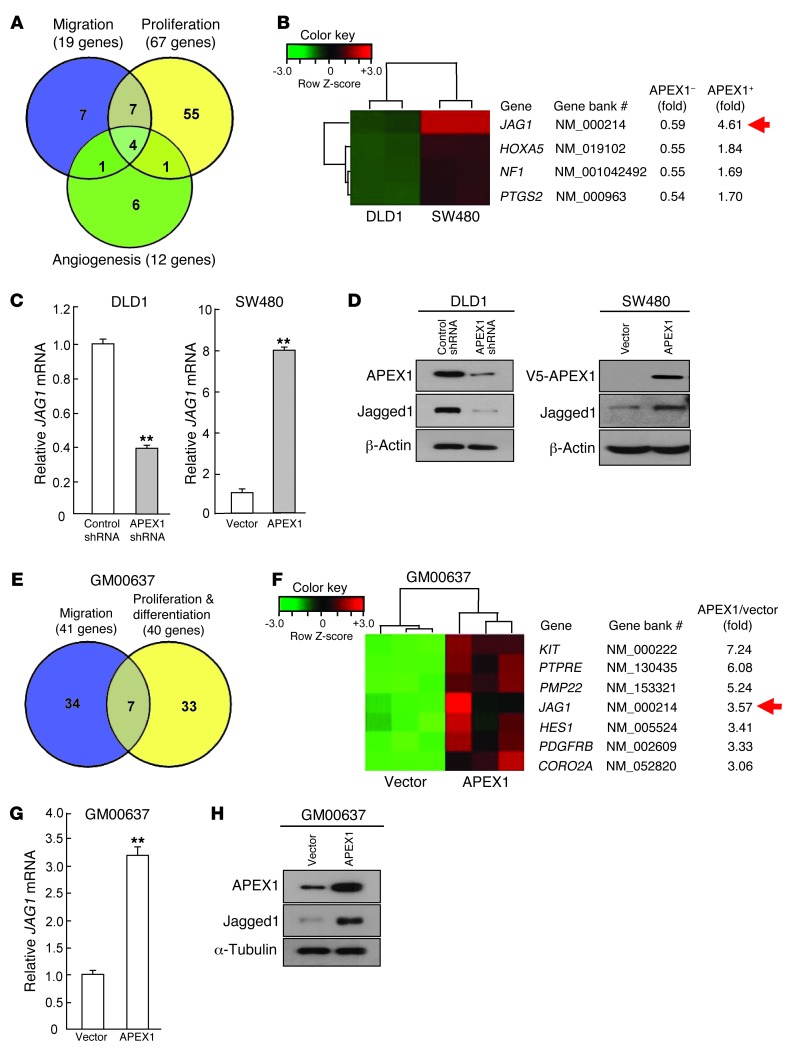
To examine the role of APEX1 in the regulation of gene expression and the consequences on colon cancer progression, we used cDNA microarrays to identify genes that were differentially expressed in SW480-APEX1, APEX1-shRNA/DLD1, and their control cells. We were specifically interested in genes with increased expression in SW480-APEX1 cells, but decreased expression in APEX1-shRNA/DLD1 cells. We used a 1.5-fold induction threshold in SW480-APEX1 cells and 1.5-fold reduction threshold in APEX1-shRNA/DLD1 cells and identified 81 genes meeting these criteria (Supplemental Table 1). Using ontology analysis consisting of proliferation, migration, and angiogenesis, we discovered 4 genes that satisfied these 3 biological criteria (Figure 3, A and B). Among these, JAG1 (which encodes the Notch ligand) was particularly interesting, because activation of Notch signaling is involved in human colon cancer (5, 12, 13, 33–35). We also conducted expression microarray profiling of control and GM00637-APEX1 cells. A Venn diagram comprising genes expressed with a 3-fold increase in GM00637-APEX1 cells revealed 7 common genes involved in migration and in proliferation and differentiation (Figure 3, E and F). Importantly, JAG1 was also found to be upregulated in GM00637-APEX1 cells, further supporting the possibility that JAG1 may be a downstream target of APEX1. To confirm the microarray data, expression of Jagged1 was examined using real-time RT-PCR and Western blot analyses in APEX1-shRNA/DLD1 and SW480-APEX1 cells. Whereas JAG1 mRNA and Jagged1 protein were downregulated by transfection of an APEX1 siRNA, JAG1 mRNA and Jagged1 protein were upregulated by transfection of an APEX1 expression vector (Figure 3, C and D). Additionally, we confirmed the upregulation of Jagged1 by APEX1 in GM00637 cells, obtaining similar results (Figure 3, G and H).
Figure 3. APEX1 upregulates Jagged1 transcription.
(A) Number of common and unique APEX1 target genes in migration, proliferation, and angiogenesis of DLD1 and SW480 cells. (B) Heat map showing 4 common genes, including JAG1 (arrow), involved in the 3 tumorigenic processes in A. (C) Quantitative real-time RT-PCR for relative JAG1 mRNA from DLD1 cells transfected with control or APEX1 siRNA and from SW480 cells transfected with control or APEX1 expression vector. (D) Western blot analysis of Jagged1 expression in the indicated cells. (E) Number of common and unique APEX1 target genes involved in migration and in proliferation and differentiation of GM00637 cells. (F) Heat map showing 7 common genes, including JAG1 (arrow), involved in the 2 biological processes in E. (G) Relative expression of JAG1 mRNA in GM00637 cells transfected with control or APEX1 expression vector. (H) Western blot analysis of Jagged1 expression in the indicated GM00637 cells. Results in C and G are mean ± SD (n = 3). **P < 0.01.
APEX1 is a positive regulator of Jagged1/Notch signaling in colon cancer cells.
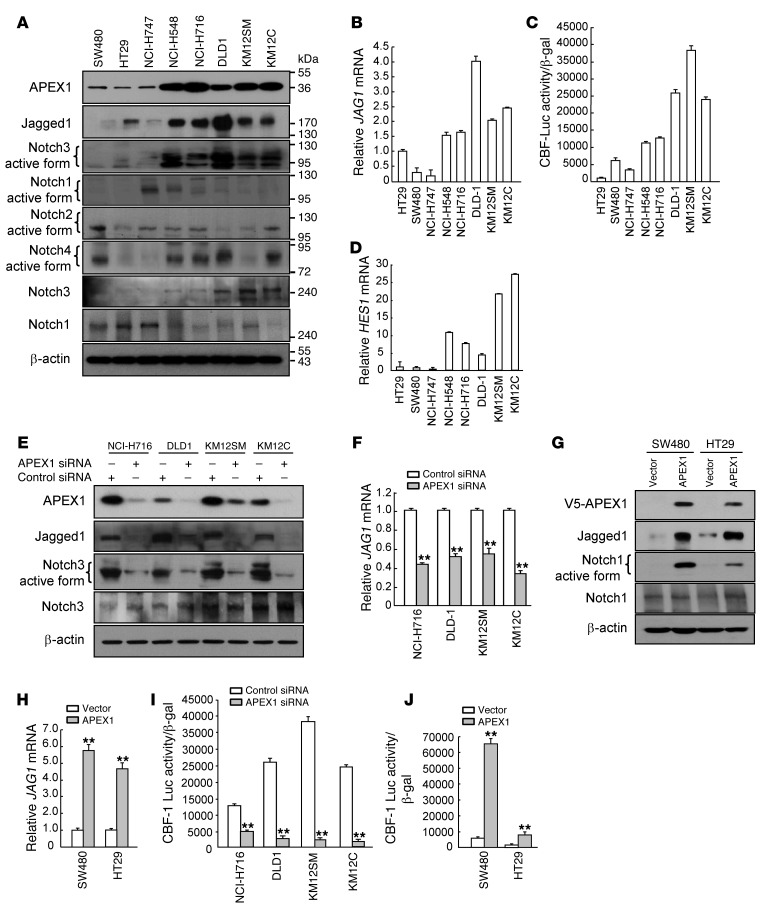
To further corroborate the correlation between the expression levels of APEX1 and Jagged1 in colon cancer cells, we performed Western blot and real-time RT-PCR analyses on a number of different human colon cancer cells. APEX1 and Jagged1 were coexpressed in the human colon cancer cell lines. Higher expression of Jagged1 protein and JAG1 mRNA was found in human colon cancers with high APEX1 expression, including cell lines NCI-H548, NCI-H716, DLD1, KM12SM, and KM12C (Figure 4, A and B). Conversely, human colon cancer cells expressing low levels of APEX1, including the lines SW480, HT29, and NCI-H747, exhibited little Jagged1 protein and JAG1 mRNA expression. We also examined the endogenous levels of APEX1 and Jagged1 in 17 human cancer cell lines, including SNU638, AGS, SNU216, and SNU484 (gastric cancer); DMS53, H460, H1299, Calu-1, and SK-MES-1 (lung cancer); U87, U373, M059J, and M059K (glioma); and PANC-1, ASPC-1, MIAPaCa-2, and BXPC-3 (pancreatic cancer). Although APEX1 and Jagged1 were not coexpressed in some of the glioma and pancreatic cell lines, APEX1 was closely coexpressed with Jagged1 in the gastric and lung cancer cell lines (Supplemental Figure 2).
Figure 4. Jagged1 expression and Notch signaling are elevated in colon cancer cells expressing APEX1.
(A–D) Western blot analysis for expression of the indicated proteins (A), JAG1 mRNA levels (B), relative CBF-1–Luc promoter reporter luciferase assay (C), and HES1 mRNA levels (D) in 8 colon cancer cell lines. (E, F, and I) Western blot analysis for expression of the indicated proteins (E), JAG1 mRNA levels (F), and CBF-1–Luc promoter reporter luciferase assay (I) in 4 colon cancer cell lines transfected with control or APEX1 siRNA. (G, H, and J) Western blot analysis for expression of the indicated proteins (G), JAG1 mRNA levels (H), and CBF-1–Luc promoter reporter luciferase assay (J) in SW480 and HT29 cells transfected with control or APEX1 expression vector. Results in B–D, F, and H–J are mean ± SD (n = 3). **P < 0.01.
4 Notch proteins have been described (Notch1, Notch2, Notch3, and Notch4) that serve as receptors for the specific ligands. Upon receptor-ligand interaction, Notch proteins are cleaved by γ-secretase activity, and the resulting cleaved Notch translocates to the nucleus, where it associates with the DNA-binding protein (4). Thus, we next sought to determine the cleaved forms of Notch protein in 8 colon cancer cell lines by Western blot analysis. Activated Notch3 was present at higher levels in colon cancer cell lines with high expression of APEX1 and at lower levels in colon cancer cell lines with lower expression of APEX1 (Figure 4A).
We next quantified the levels of Notch activation by following luciferase activity driven from a Notch-dependent CBF-1–responsive reporter transfected into colon cancer cell lines. The activity of the CBF-1–dependent luciferase reporter gene was higher in colon cancer cell lines expressing high versus low levels of APEX1 (Figure 4C). We also used RT-PCR to examine Notch target gene HES1 expression in colon cancer cell lines and found the same increased levels of HES1 in colon cancer cells with high APEX1 expression (Figure 4D).
In light of this evidence supporting activated Jagged1/Notch signaling in colon cancer cells with APEX1 expression, we examined whether knockdown or overexpression of APEX1 could cause abnormal Jagged1/Notch signaling pathway activity. When APEX1 was knocked down by transfection with APEX1 siRNA in colon cancer cells, including NCI-H716, DLD1, KM12SM, and KM12C, levels of Jagged1 protein and JAG1 mRNA were dramatically reduced (Figure 4, E and F). Conversely, the levels of JAG1 mRNA and Jagged1 protein were significantly increased in SW480-APEX1 and HT29-APEX1 cells (Figure 4, G and H), which suggests that APEX1 upregulated Jagged1 in various colon cancer cells by affecting gene transcription.
We next investigated Notch signaling in colon cancer cell lines. The expression of activated Notch3 in colon cancer cell lines with high expression of APEX1 was markedly reduced when APEX1 expression was decreased by siRNA (Figure 4E). On the other hand, SW480-APEX1 and HT29-APEX1 cells exhibited substantially increased cleaved Notch1 protein levels (Figure 4G), which suggests that APEX1 plays an important role in the efficient activation of Notch1 or Notch3 signaling, depending on the cellular context of colon cancer.
To examine whether the APEX1-mediated upregulation of cleaved Notch in colon cancer cells is functional, we examined whether APEX1 is capable of regulating CBF-1–Luc activity and HES1 mRNA expression. APEX1 siRNA–transfected NCI-H716, DLD1, KM12SM, and KM12C cells exhibited decreased CBF-1–Luc activity and HES1 expression (Figure 4I and Supplemental Figure 3A). Conversely, SW480 and HT29 cells overexpressing APEX1 had enhanced CBF-1 promoter activity and HES1 expression (Figure 4J and Supplemental Figure 3B). Together, these results suggest that the enhanced activity of Notch signaling in colon cancer cells is likely APEX1 dependent.
APEX1 activates Notch signaling through Jagged1 upregulation.
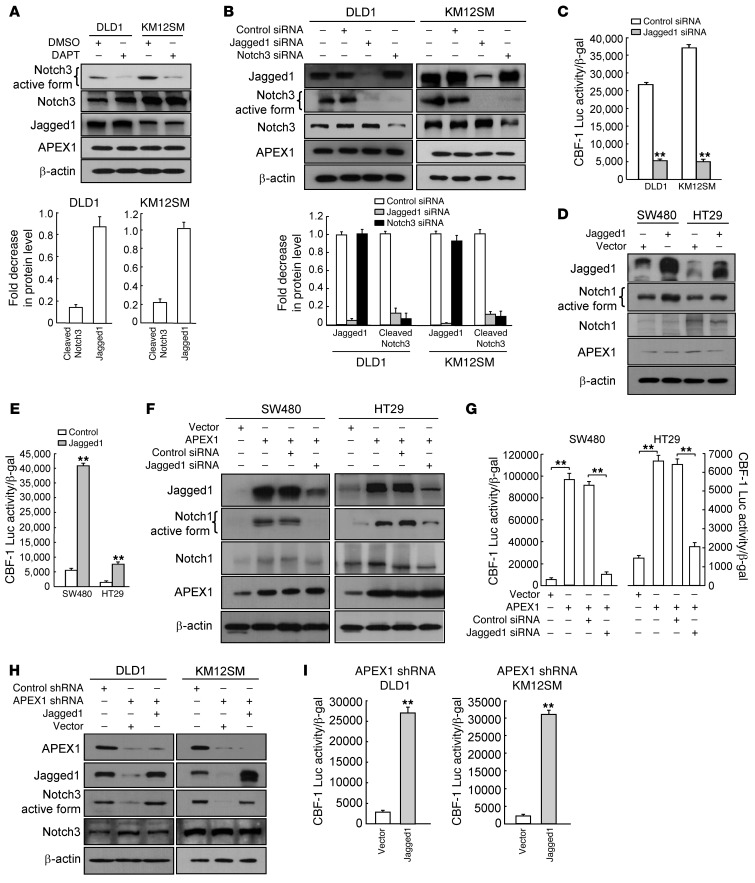
Notch receptors and their ligands use various positive and negative feedback mechanisms to control availability and, ultimately, signaling (36, 37). However, there are limited reports examining their effects on each other’s expression. To investigate the mechanism by which APEX1 leads to Notch signaling activation in colon cancer cells, we initially explored the functional relationship between Jagged1 expression and Notch activation using pharmacologic and genetic approaches. We treated DLD1 and KM12SM cells with DAPT, which blocks Notch cleavage and activation, and analyzed the cells for Jagged1 protein. Whereas cleaved Notch3 was substantially reduced in DAPT-treated DLD1 and KM12SM cells, DAPT did not affect Jagged1 expression (Figure 5A). We then used siRNA constructs to specifically inhibit Notch3 in order to determine whether the observed Jagged1 expression in DAPT-treated cells could be replicated. Western blot analysis revealed that Notch3-specific siRNA transfection decreased Notch3 expression more than 95% compared with expression in control siRNA–transfected DLD1 and KM12SM cells. Consistent with the DAPT data, Notch3 siRNA did not significantly alter the expression of Jagged1 (Figure 5B).
Figure 5. APEX1 is a positive regulator of Notch signaling through Jagged1.
(A) Western blot analysis for expression of the indicated proteins in DLD1 and KM12SM cells treated with DMSO or DAPT. Expression levels were quantified by densitometry and are shown as the fold decrease relative to with DMSO-treated cells. (B) Western blot analysis for expression of the indicated proteins in DLD1 and KM12SM cells transfected with the indicated siRNA. Expression levels were quantified by densitometry and expressed as fold decrease relative to untreated cells. (C) CBF-1–Luc promoter reporter luciferase assay in the indicated cells. (D and E) Western blot analysis for expression of the indicated proteins (D) and CBF-1–Luc promoter reporter luciferase assay (E) in SW480 and HT29 cells transfected with control or Jagged1 expression vector. (F and G) Western blot analysis for expression of the indicated proteins (F) and CBF-1–Luc promoter luciferase assay (G) in SW480 and HT29 cells transfected with the indicated vector or siRNA. (H) Western blot analysis for expression of the indicated proteins in DLD1 and KM12SM cells transfected with the indicated vector or shRNA. (I) CBF-1–Luc promoter reporter luciferase assay in the indicated cells. Results in A–C, E, G, and I are mean ± SD (n = 3). **P < 0.01.
We next examined whether Jagged1 knockdown or overexpression could affect Notch activity. Transfection of DLD1 and KM12SM cells with Jagged1 siRNA for 48 hours clearly decreased the expression of Jagged1 protein, and cells with reduced levels of Jagged1 had lower cleaved Notch3 levels and CBF-1–Luc activity compared with control siRNA–transfected cells (Figure 5, B and C). Furthermore, transfection of SW480 and HT29 cells with a Jagged1 expression vector increased activated Notch1 expression as well as CBF-1 promoter activities in the cells (Figure 5, D and E). Although the functional relationship between Jagged1 and Notch activation is complex and not yet fully understood, these results suggest that Notch activation is a consequence of autocrine or paracrine activation of the Notch receptor by Jagged1 in colon cancer cells.
We next asked whether Jagged1 is essential for APEX1-induced Notch activation. Levels of endogenous Jagged1 were depressed with siRNA in SW480-APEX1 and HT29-APEX1 cells, and then Notch activity was measured. As shown in Figure 5F, Jagged1 siRNA reduced the levels of cleaved Notch1 in SW480-APEX1 and HT29-APEX1 cells. Knockdown of Jagged1 also clearly suppressed CBF-1 promoter activity in these cells (Figure 5G). When wild-type Jagged1 was transiently expressed in APEX1-shRNA/DLD1 and APEX1-shRNA/KM12SM cells, both cleaved Notch3 and CBF-1 promoter activity were completely rescued in these APEX1-deficient cells (Figure 5, H and I), which suggests that Jagged1 is required for APEX1-induced Notch activation.
APEX1 promotes colon cancer progression by Jagged1.
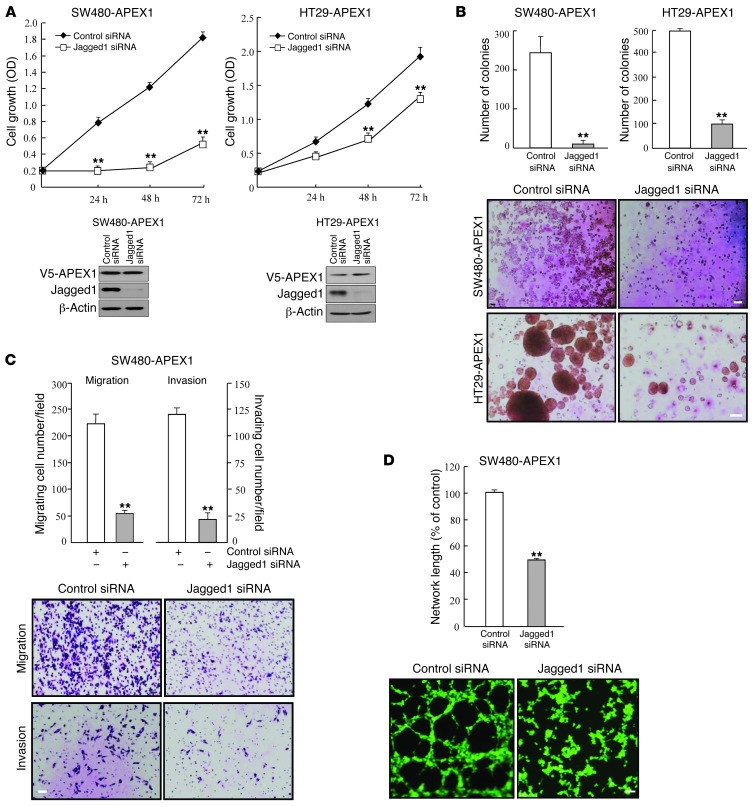
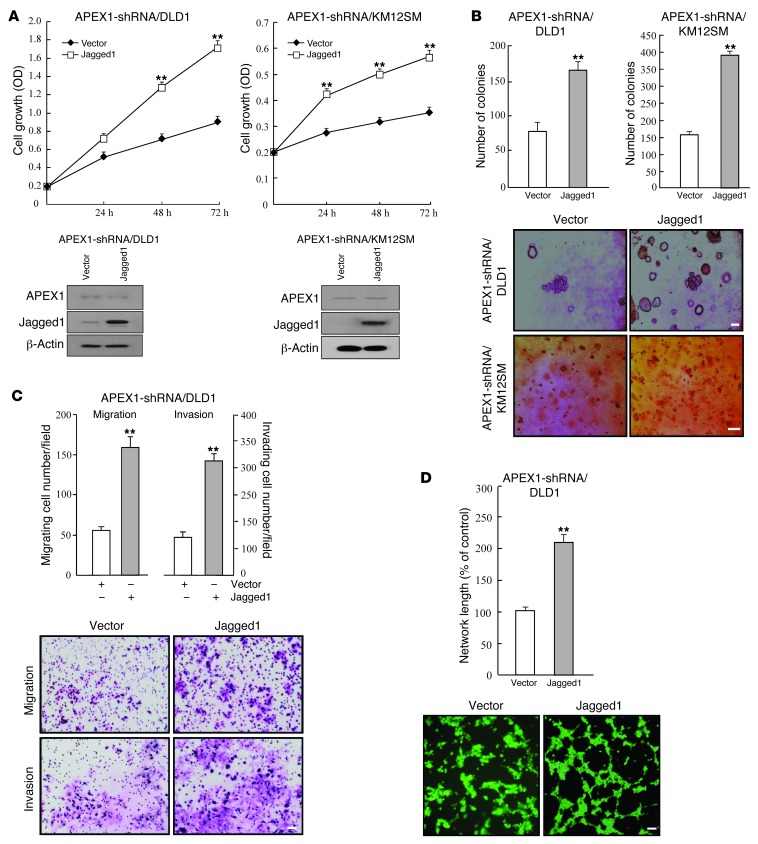
Given the importance of Jagged1/Notch signaling in colon carcinogenesis (5, 12, 34, 35, 38), the involvement of Jagged1 in APEX1-mediated increased tumorigenicity of colon cancer cells was of interest. Additionally, the transcriptional regulation of human Jagged1 has been elusive. Thus, we analyzed the effects of Jagged1 knockdown on APEX1 function. In cell proliferation assays, scrambled control siRNA–transfected SW480-APEX1 and HT29-APEX1 cells showed cell growth, which was slowed down with siRNA-mediated Jagged1 knockdown (Figure 6A). Next, we studied the effects of Jagged1 on anchorage-independent growth. As shown in Figure 6B, knockdown of Jagged1 in both SW480-APEX1 and HT29-APEX1 cells inhibited the anchorage-independent growth induced by APEX1 compared with vector-transfected cells. Furthermore, transfection of Jagged1 siRNA in SW480-APEX1 cells clearly reduced migration, invasion, and angiogenesis (Figure 6, C and D), which suggests that APEX1 promoted cancer progression through Jagged1 expression. When we transiently transfected APEX1-shRNA/DLD1 and APEX1-shRNA/KM12SM cells with a Jagged1 cDNA expression construct to overexpress Jagged1 in these cells, cellular proliferation and anchorage-independent growth were increased (Figure 7, A and B). Moreover, overexpression of Jagged1 in APEX1-shRNA/DLD1 cells also increased invasion, migration ability, and angiogenesis (Figure 7, C and D). These results indicate that Jagged1 is required for the tumorigenetic activity of APEX1 in colon cancer.
Figure 6. Jagged1 knockdown attenuates tumorigenicity in APEX1-overexpressed SW480 and HT29 cells.
SW480-APEX1 and HT29-APEX1 cells were transfected with control or Jagged1 siRNA. (A) Cell growth. Lysates of cells were examined for Jagged1 and APEX1 expression by Western blot analysis. (B) Colony formation in soft agar after 14 days of culture. (C) Cell migration and invasion. Data represent the average cell numbers from 5 viewing fields. (D) Tube formation assays were performed by culturing HUVECs in tube formation with supernatants from the indicated cells. Results in A–D are mean ± SD (n = 3). **P < 0.01. Scale bars: 80 μm (B and D); 40 μm (C).
Figure 7. Jagged1 overexpression enhances tumorigenicity in APEX1-depleted DLD1 and KM12SM cells.
APEX1-shRNA/DLD1 and APEX1-shRNA/KM12SM cells were transfected with control vector or Jagged1 expression vector. (A) Cell growth. Lysates of cells were examined for Jagged1 and APEX1 expression by Western blot analysis. (B) Colony formation in soft agar after 14 days of culture. (C) Cell migration and invasion. (D) Tube formation assays were performed by culturing HUVECs in tube formation with supernatants from the indicated cells. Results in A–D are mean ± SD (n = 3). **P < 0.01. Scale bars: 100 μm (B); 40 μm (C); 80 μm (D).
APEX1/Jagged1 signaling in colon cancer cells promotes tumor growth and metastatic spreading in mice.
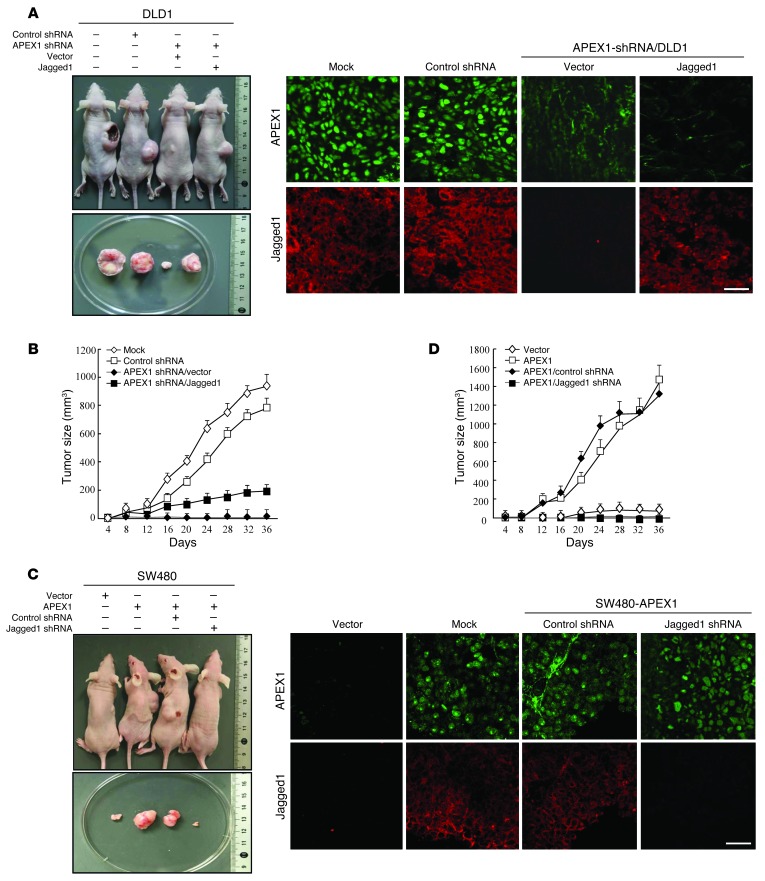
We next evaluated the effects of the APEX1/Jagged1 pathway on tumor formation and progression in vivo using mouse xenograft models. Initially, we constructed models from DLD1 and SW480 cells implanted subcutaneously in the right flank of nude mice. At 36 days after injection, all mice implanted with DLD1 control cells developed large tumors, whereas tumor growth of SW480 control cells was negligible at 36 days (data not shown). To determine whether the established tumors were affected by APEX1, we injected APEX1-shRNA/DLD1 and control DLD1 cells into nude mice and measured the tumor volume over time. Whereas control mice displayed visible tumors at 12 days after implantation, with exponential tumor growth until day 36, tumor outgrowth and size were reduced in APEX1-deficient tumor–bearing mice (Figure 8, A and B), which indicates that stable knockdown of APEX1 in colon cancer cells reduced tumor growth in vivo. To determine whether this reduced tumor growth resulted from loss of the Jagged1 effect, nude mice were injected with Jagged1- or vector-transfected APEX1-shRNA/DLD1 cells. No tumor growth of vector-transfected APEX1-shRNA/DLD1 cells was seen at day 36, whereas Jagged1-transfected cells continued to grow until day 36 (Figure 8, A and B). However, Jagged1 overexpression did not completely rescue tumor growth in APEX1-shRNA/DLD1 cells, which suggests that additional APEX1 targets also control tumor growth. We then compared the abilities of SW480-APEX1 and control cells to form tumors in mice. At 36 days after implantation, SW480-APEX1 cells gave rise to substantially larger tumors, whereas control cells did not form tumors (Figure 8, C and D). To determine whether this increased tumor growth resulted from the induction of Jagged1 expression, nude mice were injected with Jagged1 siRNA– or control siRNA–transfected SW480-APEX1 cells. Tumor growth was detected in mice receiving control siRNA–transfected cells, but not Jagged1 siRNA–transfected cells, after 36 days (Figure 8, C and D).
Figure 8. APEX1 regulates tumor growth through Jagged1 in a mouse model.
(A and B) The indicated DLD1 cells were implanted subcutaneously in nude mice (n = 6). (A) Photographs of representative mice and tumors (each condition was independently repeated 3 times) and immunofluorescence analysis of APEX1 and Jagged1 in tumors. (B) Growth curves of mammary tumors after implantation. (C and D) The indicated SW480 cells were injected into the right flank of nude mice (n = 6). (C) Photographs of representative mice and tumors and immunofluorescence analysis of APEX1 and Jagged1 in tumors. (D) Growth curves of mammary tumors after injection. Results in B and D are mean ± SD (n = 6). Scale bars: 40 μm (A and C).
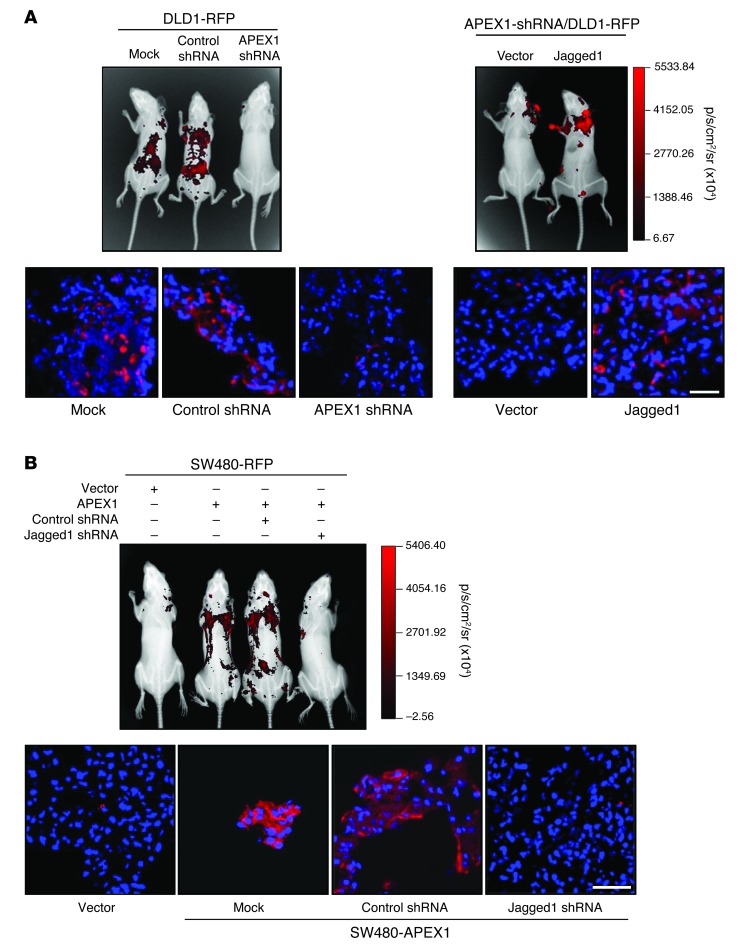
Because the enhanced or reduced lung metastasis might have been due to faster or slower primary tumor growth, respectively, we further evaluated the in vivo effects of the APEX1/Jagged1 pathway on lung metastasis of colon cancer using an experimental metastasis assay. Red fluorescent protein–based (RFP-based) noninvasive bioluminescence imaging was used to monitor the presence of tumor cells. Control or APEX1-shRNA/DLD1 cells expressing pCMV-DsRed were injected into the peritoneal cavity of nude mice. After 5 weeks, fluorescence imaging revealed multiple large lung metastases in mice injected with control DLD1 cells, but no metastases in mice injected with APEX1-shRNA/DLD1 cells (Figure 9A). Conversely, the metastatic activity of SW480 cells, assessed by their fluorescence, was markedly increased by APEX1 compared with the control (Figure 9B). Finally, we examined the role of Jagged1 in APEX1-induced metastasis. Metastatic activity was increased in the lungs of mice injected with Jagged1-overexpressing APEX1-shRNA/DLD1 cells, whereas knockdown of Jagged1 in SW480-APEX1 cells reduced the number of lung metastases (Figure 9, A and B). Taken together with our earlier findings, these observations indicate that APEX1 promotes colon cancer cell growth and metastasis in vivo through upregulated Jagged1 expression.
Figure 9. APEX1 regulates tumor metastasis through Jagged1 in a mouse model.
The indicated DLD1-RFP (A) and SW480-RFP (B) cells were injected into the abdominal cavity of BALB/c mice (n = 6), and colon cancer metastasis to the lung was measured by fluorescence expression. Shown are representative fluorescence images at 5 (DLD1) and 8 (SW480) weeks after injection and histological analyses showing RFP fluorescence of lung tissue sections. Scale bars: 40 μm (A and B).
Involvement of EGR1 in Jagged1 upregulation by APEX1.
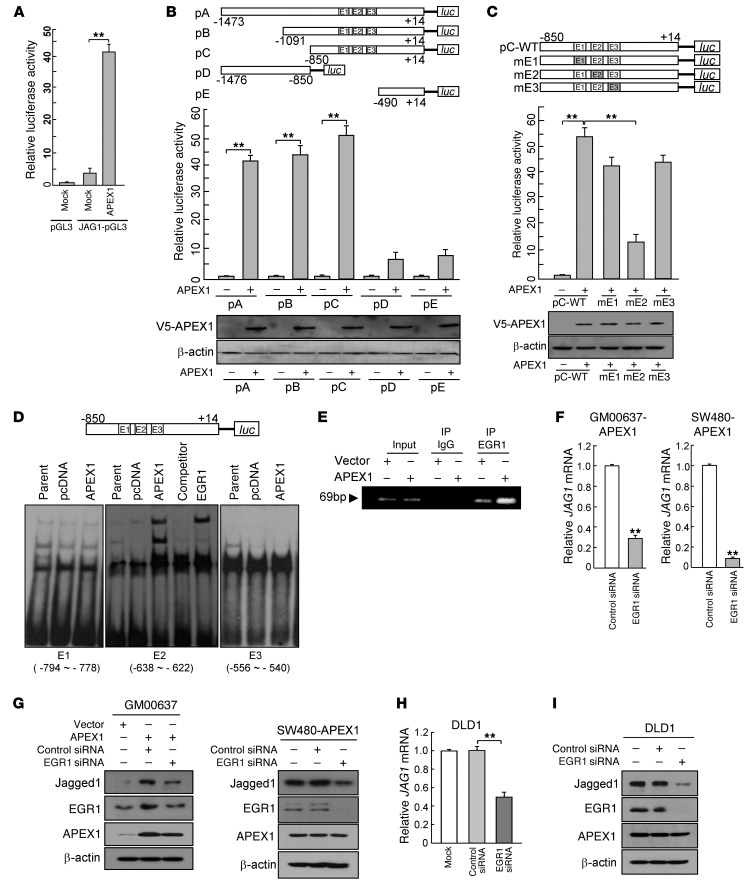
To explore the possible direct influence of APEX1 on the Jagged1 promoter, we cloned a human Jagged1 promoter fragment (nucleotides –1473 to +14) into the pGL3 luciferase vector and cotransfected the APEX1 cDNA construct and the Jagged1 reporter construct into GM00637 cells. Transfection reporter assays indicated that Jagged1 transcriptional activity was induced significantly by APEX1 expression (Figure 10A).
Figure 10. APEX1 upregulates Jagged1 expression by increasing EGR1 activity.
(A) Control and APEX1-overexpressing GM00637 cells were transfected with the indicated plasmids and harvested for a Jagged1 reporter assay. (B) Top: Jagged1 promoter constructs used for reporter assay. Middle: Reporter assay in GM00637 cells transfected with the indicated Jagged1 promoter fragments fused to pGL3 basic vector. Bottom: Western blot analysis of V5-APEX1 expression in GM00637 cells transfected with the indicated vectors. (C) Reporter assay in GM00637 cells with Jagged1 promoter constructs (pC) with mutations in different EGR1 regions (mE1, mE2, mE3). (D) EMSA analysis of 3 putative EGR1 consensus sites (E1, E2, E3) of the Jagged1 promoter in the indicated GM00637 cells. Unlabeled oligonucleotides were used as competitors. For supershift assays, anti-EGR1 antibody was added to the reaction mixtures prior to separating the DNA-protein complex. (E) ChIP assay for Jagged1 promoter (E2 site) in control and GM00637-APEX1 cells. (F–I) JAG1 mRNA (F and H) and Jagged1 protein (G and I) levels in GM00637-APEX1 and SW480-APEX1 cells (F and G) or in DLD1 cells (H and I) transfected with control or EGR1 siRNA. Results in A–C, F, and H are mean ± SD (n = 3). **P < 0.01.
To dissect the promoter region required for APEX1-induced Jagged1 transcription, we generated 4 fragments from the full-length Jagged1 promoter. Specific deletions of the Jagged1 promoter demonstrated that a 360-bp region from –850 to –490 contained the major APEX1-responsive element (Figure 10B). Since APEX1 enhances DNA binding of EGR1 by acting as a transcriptional coactivator (39), and given that the APEX1-responsive region of the Jagged1 promoter (position –850 to –490) contains 3 potential EGR1-binding sites, at –794 to –778, –638 to –662, and –556 to –540 (sites E1, E2, and E3, respectively; Figure 10B), we investigated whether APEX1-induced EGR1 activity contributes to the increase in Jagged1 promoter activity. To validate the functionality of these potential EGR1 binding sites, we mutated the EGR1 binding motifs in E1, E2, and E3 of the Jagged1 promoter and used these constructs in a reporter assay. Mutations in E1 and E3 did not significantly affect the ability of APEX1 to induce Jagged1 transcription activation; however, mutations in E2 markedly decreased the effect of APEX1 on Jagged1 transcription activation (Figure 10C), which suggests that E2, but not E1 or E3, is important for APEX1-induced Jagged1 transcription. To determine whether EGR1 binds directly to E2, we performed EMSAs of nuclear extracts from parent, control vector–transfected, and GM00637-APEX1 cells using isotope-labeled DNA probes containing E1, E2, and E3. Nuclear extract from APEX1-expressing cells bound specifically to the putative EGR1 binding site E2, but not to E1 or E3; moreover, competition with an unlabeled, wild-type E2 binding site oligonucleotide blocked the binding to E2 (Figure 10D). Furthermore, supershifted DNA-protein complex was observed after adding the anti-EGR1 antibody to the DNA binding reaction. To directly confirm the binding of EGR1 to the endogenous Jagged1 promoter in vivo, we performed ChIP assays in pcDNA3- and APEX1 expression vector–transfected cells. The results showed that EGR1 bound in vivo to the E2 region in pcDNA3-expressing cells, and the amount of ChIP associated with EGR1 increased in APEX1-expressing cells (Figure 10E). These results suggest that increased interaction of EGR1 with E2 in the Jagged1 promoter contributes to an APEX1-mediated increase in Jagged1 transcription.
To assess whether the ability of APEX1 to upregulate Jagged1 expression depends on its activation of EGR1, we suppressed EGR1 expression levels in GM00637-APEX1 and SW480-APEX1 cells using EGR1 siRNA and measured Jagged1 expression by real-time RT-PCR and Western blot. Knockdown of EGR1 significantly suppressed the levels of JAG1 mRNA and Jagged1 protein in GM00637-APEX1 and SW480-APEX1 cells, whereas control siRNA did not affect Jagged1 expression (Figure 10, F and G). We then tested whether endogenous EGR1 contributes to Jagged1 expression in DLD1 cells. Indeed, EGR1 siRNA transfection significantly decreased JAG1 mRNA and Jagged1 protein expression (Figure 10, H and I). These results suggest that APEX1 increases Jagged1 expression, at least in part, by activating EGR1 transcriptional activity.
APEX1 and Jagged1 expression levels correlate in human colon cancer tissues.
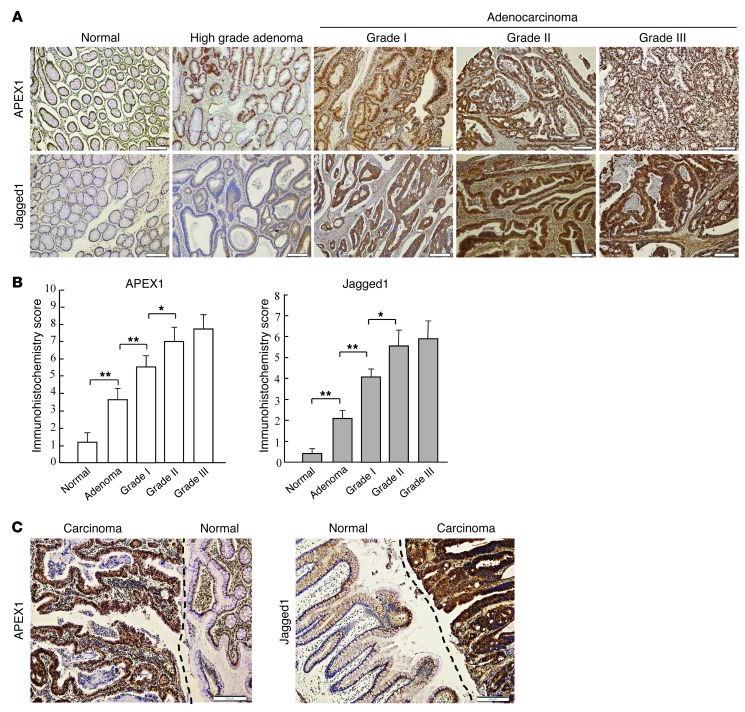
Because APEX1 overexpression correlates with Jagged1 expression in vitro, and these components are important in colon cancer progression, we sought to determine whether there a positive correlation exists between APEX1 and Jagged1 expression in colon carcinoma tissues. To test this, we performed immunohistochemical staining to detect Jagged1 and APEX1 expression on colorectal tissue samples consisting of normal human colon tissues, colorectal adenoma, and colorectal adenocarcinomas of different grades. Tissue staining was scored on the basis of cytoplasmic membrane and cytoplasm for Jagged1 and nuclei for APEX1. APEX1 and Jagged1 proteins were weakly detected in most normal colon tissues, which had average immunohistochemical scores of 1.21 ± 0.64 (n = 25) for APEX1 and 0.48 ± 0.25 (n = 24) for Jagged1 (Figure 11, A and B). In contrast, APEX1 and Jagged1 staining in adenoma was significantly increased, to 3.64 ± 0.71 (n = 58) and 2.12 ± 0.54 (n = 41), respectively. Immunohistochemical scores of APEX1 and Jagged1 progressively increased in adenoma, grade I adenocarcinoma, and grade II adenocarcinoma (Figure 11, A and B). We also investigated APEX1 and Jagged1 expression in patient colon tumors versus normal adjacent tissues. Analyses of APEX1 and Jagged1 expression showed that colon carcinoma tissues strongly expressed APEX1 and Jagged1, whereas these proteins were expressed at low levels in normal colon tissues (Figure 11C). This observation underscores the clinical relevance of APEX1 and Jagged1 expression in colon cancer.
Figure 11. Correlation between APEX1 and Jagged1 expression in human colon cancer.
(A) Jagged1 and APEX1 proteins in normal colon tissue, colorectal adenoma, and grade I–III colorectal adenocarcinoma are shown by immunohistochemistry with anti-Jagged1 and anti-APEX1 antibodies. Brown staining indicates positive APEX1 or Jagged1 staining. (B) APEX1 and Jagged1 expression levels, assessed by immunohistochemistry scoring (see Methods). Jagged1 expression significantly correlated with APEX1 levels (P < 0.01, Pearson correlation test). (C) Representative images of Jagged1 and APEX1 immunoreactivity in normal colon epithelium and colon adenocarcinoma (separated by dashed lines). Results in B are SEM. *P < 0.05; **P < 0.01. Scale bars: 200 μm (A and C).
Discussion
Accumulating evidence indicates that aberrant APEX1 expression is a general phenomenon in human cancers (18, 21–25). Although previous studies suggested the involvement of APEX1 in tumor progression, its exact role in tumorigenicity remained elusive. The present study clearly demonstrated an important role for APEX1 in the positive control of growth potential and carcinogenesis in immortalized human fibroblasts and colon cancer cells. APEX1-shRNA/DLD1 and APEX1-shRNA/KM12SM cells exhibited significantly reduced cell proliferation and tumorigenic features. Conversely, APEX1 overexpression in SW480, HT29, and GM00637 cells promoted cancer progression. Our in vivo results strongly supported our in vitro data: after injection of APEX1-shRNA/DLD1 cells into nude mice, pulmonary tumor growth and metastasis were significantly decreased compared with controls. On the other hand, significant increases in tumor growth and metastasis of SW480-APEX1 cells were observed in nude mice. These results indicate that APEX1 induced a phenotypic transformation in SW480 cells, causing them to acquire invasive and migratory properties and thus the capacity to metastasize to the lung. Given the involvement of APEX1 in colon cancer progression, our objective was to evaluate relevant APEX1 target genes. We identified JAG1, which encodes the Notch ligand Jagged1, as a direct transcriptional target of APEX1.
Jagged1 has been reported to be upregulated in a number of different cancers, including prostate, breast, ovarian, and colorectal cancers (34, 40–42). It is associated with cancer progression, as it is overexpressed in prostate and breast cancer patients with a poor prognosis and promotes osteolytic bone metastasis in breast cancer (40, 41, 43). In the intestine, Jagged1 expression is restricted to enteroendocrine cells in the normal human intestinal epithelium and is elevated in approximately 50% of human colon tumors (34). Recent reports have shown that Notch activation, accompanied by Wnt-mediated upregulation of Jagged1, is required for tumorigenesis in the intestine (12, 34, 44). Thus, Jagged1 expression in different types of colon cancer appears to be positively associated with pathological grade and metastatic status. However, several crucial aspects remain unclear, in particular the regulation of Jagged1 expression and the contribution of its upstream effects to the neoplastic phenotype. Our present results demonstrated that, in human colon cancer cells, APEX1 expression was positively correlated with the expression of Jagged1 and cleaved Notch. In support of this association, colon cancer cells in which Jagged1 was upregulated due to APEX1 overexpression exhibited hyperactive Notch signaling, while APEX1 overexpression in colon cancer cell lines and in vivo in nude mice induced malignant features, tumor growth, and metastases in the lung via Jagged1 expression. Conversely, APEX1 knockdown–impaired Jagged1/Notch signaling in colon cancer cell lines led to a significant decrease in cancer progression, tumor growth, and metastasis. Jagged1 expression partially rescued these tumorigenic features in APEX1-knockdown cells. Our data identified APEX1 as a major regulator of the Jagged1/Notch signaling pathway in colon cancer cell lines and as a critical player in colon cancer progression that acts by upregulating Jagged1 expression.
Although studies have demonstrated a significant correlation between Jagged1 expression and the functional activation of Notch signaling in various cancer cell lines, little is known about the pathways involved in the upstream control of Jagged1 and Notch gene expression and activity. Recent studies revealed that reciprocal regulation of the Notch receptor and its ligand acts to amplify or sustain Notch signaling activation. For example, Notch3 has the capacity to maintain a differentiated phenotype through a positive feedback loop that includes both autoregulation and Jagged1 expression in the same mural cells (37). Notch3 signaling activation, which in turn upregulates Jagged1, maintains long-term Notch3 signaling in ovarian cancer cells (45). On the other hand, Jagged1 promotes the osteolytic bone metastasis of breast cancers by activating the Notch pathway in the bone microenvironment (43). β-catenin stimulates Notch signaling by modulating Jagged1 in colorectal cancer cells. This activation of Notch is involved in maintaining Wnt signaling (44). In addition, Notch activation resulting from the β-catenin–mediated upregulation of Jagged1 is required for tumorigenesis in the intestine (12). Our results demonstrated that Jagged1 knockdown or overexpression significantly affected Notch signaling activation in colon cancer cells. However, the Jagged1 expression was not significantly affected by pharmacological or chemical inhibitors of the Notch receptor, which indicates that Jagged1 is a positive regulator of Notch signaling in colon cancer. Our results also showed that APEX1-mediated increases in Jagged1 transcription resulted from increased binding of the transcription factor EGR1 to the Jagged1 promoter and that EGR1 knockdown caused the downregulation of Jagged1 levels in colon cancer cells with strong APEX1 expression. This suggests that APEX1 potentiates the Notch signaling pathway through a mechanism involving transcriptional upregulation of Jagged1 expression via increased EGR1 activity. Therefore, because β-catenin is a positive regulator of Jagged1 activation in the intestine (12, 44), it is possible that EGR1 and β-catenin are collaborating for upregulation of Jagged1 expression in colon cancer, contributing to colon cancer development and progression.
Targeting γ-secretase to block Notch signaling is considered a promising strategy for treating human cancers, particularly colon cancer. Although effective in vitro, γ-secretase inhibitors have toxic effects attributable to their actions in normal stem cells (3, 46). Together, our findings suggest that in tumors with upregulated expression of both APEX1 and Jagged1, a lower γ-secretase inhibitor dose may provide a better response when administered in combination with an APEX1 inhibitor.
In summary, our present study revealed that APEX1 positively regulates Notch signaling by upregulating Jagged1 expression, which promotes colon cancer tumorigenesis, both in vitro and in vivo. Because levels of APEX1, Jagged1, and cleaved Notch are strongly correlated in human colon cancer cells, pharmacological targeting of APEX1 overexpression may be a promising approach for treating or preventing colon cancer with strong activation of Jagged1/Notch signaling.
Methods
Cell cultures, chemicals, and tissue samples.
Human fibroblast GM00637 cells were obtained from the Coriell Institute for Medical Research and cultured in MEM. HUVECs were obtained from Cambrex Bio Science and cultured in EGM-2 (Cambrex Bio Science). Gastric cancer cells (AGS, SNU216, SNU484, and SNU638), glioblastomas (U87MG and U373MG), lung cancer cells (NCI-H460 and NCI-H1299), colon cancer cells (SW480, HT29, NCI-H548, NCI-H716, and DLD1), and pancreatic cancer cells (Capan-1, BXPC-3, and ASPC-1) were cultured in RPMI-1640 (Invitrogen). Human glioblastomas (M059J and M059K) were grown in DMEM/F12. DMS53 (human lung cancer) cells were grown in WayMouth’s medium (Invitrogen). Calu-1 (human lung cancer) cells were grown in McCoy’s 5A medium. SK-MES-1 (lung cancer), NCI-H747 (colon cancer), KM12SM (colon cancer), and PANC1 and MIAPaCa-2 (pancreatic cancer) cells were grown in DMEM. KM12C (colon cancer) cells were grown in MEM. All cancer cell lines were purchased from ATCC, except for the human gastric cancer cell lines SNU216, SNU484, SNU638 (Korean Cell Line Bank). All media were supplemented with 10% heat-inactivated FBS and 1% penicillin/streptomycin. Cells were maintained in 5% CO2-humidified atmosphere at 37°C. N-[N-(3,5-difluorophenacetyl)-l-alanyl]-(S)-phenylglycinet-butyl ester (DAPT) and DMSO were purchased from Calbiochem. Samples of colon adenocarcinoma and normal tissue from the same patient were provided by C. Choi (Chonnam National University Hospital, National Biobank of Korea, Gwangju, Republic of Korea).
Gene expression analysis.
Control and GM00637-APEX1 cells, control and APEX1-shRNA/DLD1, and control and SW480-APEX1 cells were harvested, and total RNA was extracted using TRIzol (Invitrogen) and purified using RNeasy columns (Qiagen) according to the manufacturers’ instructions. RNA quality and purity were assessed by measuring OD260/280 using an Agilent 2100 Bioanalyzer (Agilent Technologies). Total RNA was amplified and purified using Agilent’s Low RNA Input Linear Amplification Kit (Agilent Technologies) to yield cyanine-labeled cRNA. After purification, the cRNA was quantified using the ND-1000 Spectrophotometer (NanoDrop) and hybridized to microarrays. Gene expression profiling was conducted using A Whole Human Genome Microarray 44K (Agilent Technologies) containing more than 40,000 60-mer polynucleotide probes. Analyses were performed according to the manufacturers’ recommendations. 2 repetitions were performed. After hybridization, arrays were scanned using a DNA microarray scanner (Agilent Technologies) and quantified using Feature Extraction Software (Agilent Technologies). All data normalization and selection of “fold-changed genes” were performed using GeneSpringGX 7.3 (Agilent Technologies). Normalized ratio averages were calculated by dividing the average normalized signal channel intensity by the average normalized control channel intensity. Biological pathway– and ontology-based analysis was performed using the Gene Ontology Database ( http://www.geneontology.org) and Gene Cards Database ( http://www.genecards.org). All microarray data were deposited in GEO (accession no. GSE45912).
Plasmid constructs, RNAi, and generation of stable cell lines.
Human Jagged1 cDNA was amplified from GM00637 cells by RT-PCR (forward primer, 5′-ATGCGTTCCCCACGGAC-3′; reverse primer, 5′-CTATACGATGTACTCCATTCGGTTTAAGCTC-3′) and cloned into the pcDNA3.1 mammalian expression vector (Invitrogen). The APEX1-expressing vector (pcDNA3-APEX1) was described previously (29). Cells were transfected with siRNA using RNA max-i (Invitrogen). siRNA target sequences were as follows: APEX1, 5′-AAGTCTGGTACGACTGGAGTA-3′; Jagged1, 5′-AAATGGGATGATGACTGTAAT-3′; Notch3, 5′-AACTGCGAAGTGAACATTGAC-3′; EGR1, 5′-AAGAGGCATACCAAGATCCACTT-3′. GFP siRNA (sc-45924; Santa Cruz Biotechnology) was used as a negative control. For generating cell lines stably overexpressing APEX1 shRNA or Jagged1 shRNA, oligonucleotides encoding the target sequence for APEX1 (forward, 5′-GATCCGTCTGGTACGACTGGAGTATTCAAGAGATACTCCAGTCGTACCAGACTTTTTTGGAAA-3′; reverse, 5′-AGCTTTTCCAAAAAAGTCTGGTACGACTGGAGTATCTCTTGAATACTCCAGTCGTACCAGACG-3′) or Jagged1 (forward, 5′-GATCCATGGGATGATGACTGTAATTTCAAGAGAATTACAGTCATCATCCCATTTTTTTGGAAA-3′; reverse, 5′-AGCTTTTCCAAAAAAATGGGATGATGACTGTAATTCTCTTGAAATTACAGTCATCATCCCATG-3′) were annealed and cloned into psilencer2.1-U6 (Ambion). For control shRNA, a nontargeting scramble sequence was cloned into psilencer2.1-U6. DLD1 and KM12SM cells were transfected with APEX1 shRNA or scrambled control shRNA using Lipofectamine 2000 (Invitrogen) and cultured in selection medium containing 400 μg/ml hygromycin for 4–5 weeks. To generate stable GM00637-APEX1, SW480-APEX1, and HT29-APEX1 cells, the cells were transfected with empty vector, pcDNA3, or APEX1-expressing vector using Lipofectamine 2000 (Invitrogen). Cells were then incubated in medium containing 400 mg/ml G418 for 4–5 weeks.
Quantitative real-time RT-PCR.
Total RNA was purified from cells using TRIzol (Invitrogen) according to the manufacturer’s protocol. cDNA was synthesized using 1 μg RNA, M-MLV RT (Invitrogen), and random hexamers (Promega). Real-time PCR analysis was performed using the SYBR Premix Ex Taq kit (TaKaRa Bio) and the Mx3000P Kit (Stratagene) with specific primers. Primers used for real-time RT-PCR were as follows: JAG1 forward, 5′-GAAACAGCTCGCTGATTGCT-3′; JAG1 reverse, 5′-ACCAAGCAACAGATCCAAGC-3′; APEX1 forward, 5′-TGAAGCCTTTCGCAAGTTCCT-3′; APEX1 reverse, 5′-TGAGGTCTCCACACAGCACAA-3′; HES1 forward, 5′-ACAGAAAGTCATCAAAGCCT-3′; HES1 reverse, 5′-AGAGCATCCAAAATCAGTGT-3′; q18S rRNA forward, 5′-CGCCGCTAGAGGTGAAATTC-3′; q18S rRNA reverse, 5′-TTGGCAAATGCTTTCGCTC-3′. Each sample was analyzed in triplicate, and target genes were normalized relative to the reference housekeeping gene, 18S rRNA.
Immunoblotting.
Cells were washed with 1× PBS and lysed in lysis buffer (20 mM HEPES, pH 7.4; 2 mM EGTA; 50 mM glycerol phosphate; 1% Triton X-100; 10% glycerol; 1 mM DTT; 1 mM phenylmethylsulfonyl fluoride; 10 μg/ml leupeptin; 10 μg/ml aprotinin; 1 mM Na3VO4; and 5 mM NaF). Protein content was determined using a dye-binding microassay (Bio-Rad), and 10–160 μg protein per lane was electrophoresed on 8–12% SDS polyacrylamide gels. Proteins were blotted onto Hybond ECL membranes (Amersham Pharmacia Biotech), and immunoblotting was carried out using the following antibodies: mouse anti-APEX1 (sc-17774), rabbit anti-Jagged1 (sc-8303), goat anti-Notch1 (sc-6014), rabbit anti-Notch2 (sc-5545), rabbit anti-Notch3 (sc-5593), goat anti-Notch4 (sc-8644), mouse anti–β-actin (sc-47778), and mouse anti–α-tubulin (sc-23948) from Santa Cruz Biotechnology; rabbit anti–cleaved Notch1 (Val1744) (D38B8), rabbit anti-Notch1 (3608), and rabbit anti-Notch3 (2889P) from Cell Signaling Technology. 4 protein ladders (PM1001, SM0671, P8500, and P8502) were used for molecular weight determination (Fermentas, GenDEPOT). The blotted proteins were detected using an enhanced chemiluminescence detection system (iNtRON).
Jagged1 promoter cloning and reporter assay.
The Jagged1 promoter (nucleotides –1,473 to +14) was amplified from genomic DNA of HeLa cells. The approximately 1.5-kb PCR product was cloned into the pGL3-Basic vector (Promega) to create a pGL-Jagged1 luciferase reporter (pA) vector, and the deletion fragments of the Jagged1 promoter were amplified by PCR using the pA Jagged1 promoter as template. The pB Jagged1 promoter construct encompassed nucleotides –1,091 to +14; the pC Jagged1 promoter construct encompassed nucleotides –850 to +14; the pD Jagged1 promoter construct encompassed nucleotides –1,476 to –850; the pE Jagged1 promoter construct encompassed nucleotides –490 to +14; and the mEGR1-1, mEGR1-2, and mEGR1-3 Jagged1 promoter constructs contained 3 mutated putative EGR1 binding sites (E1, E2, and E3, respectively), which were generated using the pC Jagged1 promoter construct as a template with a Muta-Direct Site Directed Mutagenesis Kit (Intron Biotechnology). The mutated nucleotide sequences (denoted by underline) were as follows: mutated E1, 5′-GTTGGAAATCGCC-3′; mutated E2, 5′-GGTAGAGTCTCCG-3′; mutated E3, 5′-CCCGGAGTTGGCT-3′.
Luciferase reporter assay.
Cells were cotransfected with pGL3-Basic vector, Jagged1 promoter constructs, or CBF-1 promoter constructs (provided by S.D. Hayward, Johns Hopkins School of Medicine, Baltimore, Maryland, USA) and pSV-gal (Promega) using Fugene6 (Roche Diagnostics) for 24 hours. Luciferase activity and β-gal activity were analyzed using the Luciferase assay system and β-gal Enzyme Assay System (Promega), respectively. Luciferase activity was normalized based on β-gal activity and adjusted using the empty pGL3-Basic vector to determine relative luciferase activity. Each sample was analyzed in triplicate, and experiments were performed at least 3 times.
EMSA.
Nuclear lysates were prepared from parent, pcDNA3, and GM00637-APEX1 cells for the EGR1 EMSA assays. Double-stranded oligonucleotides corresponding to nucleotides –794 to –778 (E1, 5′-CCCAGGGTGAGCCCCTCTCATGAATATTAA-3′), –638 to –622 (E2, 5′-GAGCATCCCGCTCCCAACCCCTTCCAAGTTC-3′), and –556 to –540 (E3, 5′-GCCCGGGGCGCCCGAGGGGGCGGTCCCCGCTGGG-3′) of the human Jagged1 promoter containing the putative EGR1 binding sites were annealed and end-labeled with [γ-32P]ATP and T4 polynucleotide kinase (New England Biolabs). The labeled probe was incubated with nuclear extracts in binding buffer containing 10 mM Tris-HCL, 50 mM NaCl, 1 mM EDTA, 4% glycerol, and 2 μg polydI-dC in a total volume of 20 μl at room temperature for 30 minutes. For competition experiments, unlabeled competitor DNA was added to the mixture before adding the labeled probe. For supershift assay, 1 μM anti-EGR1 antibody (sc-189; Santa Cruz Biotechnology) was added to the reaction mixtures and incubated for 30 minutes prior to separating the DNA-protein complex. DNA-protein complexes were resolved on a 6% polyacrylamide gel with 1× Tris-borate/EDTA buffer at 150 V for 2 hours at room temperature. Gels were dried, and label complexes were detected by autoradiography.
ChIP assay.
ChIP assay was performed using the EZ ChIP kit (Upstate Chemicon) according to the manufacturer’s instructions. The cell pellets were suspended in lysis buffer and sonicated to shear DNA. After sonication, the lysate was centrifuged, and the supernatant was diluted 10-fold with ChIP dilution buffer (0.01% SDS; 1% Triton X-100; 2 mM EDTA; 20 mM Tris–HCl, pH 8.0; 150 mM NaCl; and protease inhibitors). Rabbit anti-EGR1 (sc-189, 1:250; Santa Cruz Biotechnology) or normal rabbit IgG (negative control, 1:500; Upstate Chemicon) were added to the supernatant and incubated overnight at 4°C with rotation. The immunocomplex was precipitated with protein A/G-agarose, washed, and eluted with elution buffer (1% SDS; 0.1M NaHCO; and 200 mM NaCl). Reversal of cross-linking was performed by heating at 65°C overnight in the presence of NaCl. The DNA was purified using a spin column. The region amplified was the promoter region of the human Jagged1 promoter (–638 and –622), which contains a putative EGR1-binding site, E2. Primer sequences were as follows: forward, 5′-GCCCTGGTTCTTCTACGC-3′; reverse, 5′-TAGTGCGAGGAGGAACTTGG-3′.
Immunostaining.
7-μm tumor cryosections were stained with APEX1 (sc-17774, 1:500; Santa Cruz Biotechnology) or Jagged1 (sc-8303, 1:200; Santa Cruz Biotechnology) antibodies. For immunohistochemistry, a biotinylated goat anti-mouse or rabbit antibody (Vector Laboratories) followed by horseradish peroxidase–conjugated streptavidin (Vector Laboratories) was used. Protein expression was scored in the nucleus for APEX1 and in the cytoplasmic membrane and cytoplasm for Jagged1. APEX1 and Jagged1 immunoreactivity was determined by scoring for staining intensity (0, none; 1, weak; 2; moderate; 3, strong) and percent positive cells (0, <5%; 1, 6%–25%; 2, 26%–50%; 3, 50%–75%; 4, >76%) and expressed as the product of both scores. For immunofluorescence, the FITC-conjugated secondary antibodies goat anti-rabbit Alexa Fluor 594 and goat anti-mouse Alexa Fluor 488 were used (both from Invitrogen), and nuclei were counterstained with DAPI (Sigma-Aldrich). Immunofluorescence was detected by confocal microscopy (Carl Zeiss).
Soft agar colony formation assay.
Soft agar assays were performed in 6-well plates. The base layer of each well consisted of 2 ml with final concentrations of 1× medium and 0.6% low–melting point agarose (Duchefa). Plates were chilled at 4°C until solid. Next, a 1-ml growth agar layer was poured, consisting of 5 × 10⁴ cells suspended in 1× medium and 0.3% low–melting point agarose; plates were again chilled at 4°C until the growth layer congealed. A further 1 ml of 1× medium without agarose was added on top of the growth layer. Cells were allowed to grow at 37°C and 5% CO2 for 14 days, and total colonies were stained with 0.005% crystal violet (Sigma-Aldrich) and counted. Images were analyzed using Image-Pro Plus 4.5 software (Media Cybernetics). Assays were repeated a total of 3 times.
Cell migration and invasion assays.
In vitro cell migration assays were performed in a 24-well Transwell plate with 8-μm polyethylene terephthalate membrane filters (BD Biosciences) separating the lower and upper culture chambers. Cells were grown to subconfluence (∼75%–80%) and serum starved for 24 hours. After detachment with trypsin, cells were washed with PBS and resuspended in serum-free medium, after which the cell suspension (2 × 10⁴ cells) was added to the upper chamber. Complete medium was added to the bottom wells of the chamber. The cells that had not migrated were removed from the upper face of the filters using cotton swabs, and the cells that had migrated to the lower face of the filters were fixed with 4% formaldehyde and stained with 0.1% crystal violet. Images of 3 random ×10 fields were captured from each membrane, and the number of migratory cells was counted. The mean of triplicate assays for each experimental condition was used. The cell invasion assay was essentially the same as the cell migration assays, except that the membrane filters were coated with Matrigel.
Wound healing.
GM00637 cells transfected with the APEX1 expression vector or with the control vector were seeded in 6-well culture dishes at a density of 15 × 104 cells/well. A wound was incised 24 hours later in the central area of the confluent culture, which was incubated for a further 28 hours, following careful washing to remove detached cells and addition of fresh medium. Cultures were observed at 0, 12, 24, 28, and 36 hours, and phase-contrast pictures were taken on the wounded area using an inverted microscope.
Cell growth assay.
Cell growth assay was performed using the WST-1 Assay (Roche Molecular Biochemicals). Equal numbers of cells were seeded in triplicate wells in 48-well plates and maintained in low-serum medium (0.1% FBS). WST-1 reagent was then added to the cells at the indicated times and incubated for 2 hours at 37°C. The spectrophotometric absorbance of the samples was measured using an Ultra Multifunctional Microplate Reader (Tecan) at 450 nm.
Tumor formation in nude mice.
The 6-week-old male BALB/c nude mice (Orient Bio Inc.) used in this study were housed in our pathogen-free facility and handled in accordance with standard-use protocols and animal welfare regulations. DLD1 and SW480 cells, stably transfected with the indicated shRNA or expression vector, and control cells were harvested and resuspended in DMEM. Next, 2 × 10⁶ SW480 cells and 5 × 10⁶ DLD1 cells were injected subcutaneously into the right flank of a BALB/c nude mouse. Tumor size was measured with a caliper every 3 days; after 36 days, mice were killed, and tumors were excised.
Peritoneal injection for the metastasis assay.
For the colon cancer cell metastasis assay, all cells were stably transfected with a RFP expression plasmid, pCMV-DsRed (Clontech). To study APEX1 deficiency or Jagged1 overexpression in a colon cancer metastasis model, mock DLD1, control-shRNA/DLD1, APEX1-shRNA/DLD1, vector-transfected APEX1-shRNA/DLD1, or Jagged1-transfected APEX1-shRNA/DLD1 cells were injected into the peritoneal cavity of Balb/c nude mice. After 5 weeks, 6 mice per group were killed, and lung tissue was analyzed for metastasis occurrence. To study the role of APEX1 overexpression or Jagged1 deficiency in metastasis to the lung, vector-transfected SW480, APEX1-transfected SW480, control shRNA–transfected SW480-APEX1, or Jagged1 shRNA–transfected SW480-APEX1 cells were injected into the peritoneal cavity of Balb/c nude mice. 8 weeks later, 6 mice per group were anesthetized and put in Kodak MI 2000 imaging system (MS FX PRO; Carestream Health). The excitation filter was set at 465 nm; exposure time per image was 30 seconds. Animals were subsequently killed, and the lungs excised for imaging analyses under the same conditions. After whole imaging, the lungs were frozen and sectioned at 4 μm for confocal laser scanning fluorescence microscopy and hematoxylin and eosin staining.
Angiogenesis assay.
48-well culture plate wells were coated with Matrigel (BD Biosciences), which was allowed to polymerize for 30 minutes at 37°C. HUVECs cultured for 24 hours in endothelial cell basal medium (Cambrex Bio Science) were seeded on coated plates at a density of 2 × 10⁴ cells/well in endothelial cell basal medium, then incubated at 37°C with 5% CO2 for 4–6 hours. Cells were washed with Hanks balanced salt solution and stained with Calcein-AM (Molecular Probes) in Hanks buffered saline at 37°C for 1 hour. Photography of the matrices using a fluorescence microscope (Olympus) and a CoolPix 4500 digital camera (Nikon) was used to assess network formation. Quantification of tube formation was done using Adobe Photoshop 7.0 (Adobe Systems) or Image-Pro Plus 4.5 software (Media Cybernetics).
Statistics.
Unless otherwise indicated, data are presented as mean ± SD of 3 or 6 independent results. Significance of differences was assessed by 2-tailed paired Student’s t test; a P value less than 0.05 was considered statistically significant. Correlation of APEX1 expression with Jagged1 levels was assessed using the Pearson correlation test with P value; a P value of 0.01 or less was considered statistically significant.
Study approval.
The tissue microarray slides included human colon tumor of different grades and adjacent normal colon tissues taken from BioChain and Super Bio-Chips. Normal colon tissues and adenocarcinoma and adenoma patient samples were obtained from the Chosun University Department of Pathology tissue bank and Chonnam National University Hwasun Hospital, a member of the National Biobank of Korea, which is supported by the Ministry of Health, Welfare, and Family Affairs. Informed consent was not required, as we used archival samples from a tissue bank that remained anonymous. Protocols for human studies were approved by the Institutional Review Board of Chosun University School of Medicine. All animal procedures were reviewed and approved by the Institutional Animal Welfare and Use Committee of Chosun University School of Medicine.
Supplementary Material
Acknowledgments
This research was supported by the National Research Foundation of Korea (NRF), funded by the Ministry of Science, ICT, and Future Planning (NRF-2011-0018686). M.-H. Kim was supported by a basic research grant (2010-0004810).
Footnotes
Conflict of interest: The authors have declared that no conflict of interest exists.
Citation for this article: J Clin Invest. 2013;123(8):3211–3230. doi:10.1172/JCI65521.
References
- 1.Schroeter EH, Kisslinger JA, Kopan R. Notch-1 signalling requires ligand-induced proteolytic release of intracellular domain. Nature. 1998;393(6683):382–386. doi: 10.1038/30756. [DOI] [PubMed] [Google Scholar]
- 2.Yin L, Velazquez OC, Liu ZJ. Notch signaling: emerging molecular targets for cancer therapy. Biochem Pharmacol. 2010;80(5):690–701. doi: 10.1016/j.bcp.2010.03.026. [DOI] [PubMed] [Google Scholar]
- 3.Miele L, Golde T, Osborne B. Notch signaling in cancer. Curr Mol Med. 2006;6(8):905–918. doi: 10.2174/156652406779010830. [DOI] [PubMed] [Google Scholar]
- 4.Kopan R, Ilagan MX. The canonical Notch signaling pathway: unfolding the activation mechanism. Cell. 2009;137(2):216–233. doi: 10.1016/j.cell.2009.03.045. [DOI] [PMC free article] [PubMed] [Google Scholar]
- 5.Qiao L, Wong BC. Role of Notch signaling in colorectal cancer. Carcinogenesis. 2009;30(12):1979–1986. doi: 10.1093/carcin/bgp236. [DOI] [PubMed] [Google Scholar]
- 6.Wu Y, et al. Therapeutic antibody targeting of individual Notch receptors. Nature. 2010;464(7291):1052–1057. doi: 10.1038/nature08878. [DOI] [PubMed] [Google Scholar]
- 7.Park JT, et al. Notch3 gene amplification in ovarian cancer. Cancer Res. 2006;66(12):6312–6318. doi: 10.1158/0008-5472.CAN-05-3610. [DOI] [PubMed] [Google Scholar]
- 8.Pece S, et al. Loss of negative regulation by Numb over Notch is relevant to human breast carcinogenesis. J Cell Biol. 2004;167(2):215–221. doi: 10.1083/jcb.200406140. [DOI] [PMC free article] [PubMed] [Google Scholar]
- 9.Leong KG, et al. Jagged1-mediated Notch activation induces epithelial-to-mesenchymal transition through Slug-induced repression of E-cadherin. J Exp Med. 2007;204(12):2935–2948. doi: 10.1084/jem.20071082. [DOI] [PMC free article] [PubMed] [Google Scholar]
- 10.van Es JH, et al. Notch/gamma-secretase inhibition turns proliferative cells in intestinal crypts and adenomas into goblet cells. Nature. 2005;435(7044):959–963. doi: 10.1038/nature03659. [DOI] [PubMed] [Google Scholar]
- 11.Fre S, Huyghe M, Mourikis P, Robine S, Louvard D, Artavanis-Tsakonas S. Notch signals control the fate of immature progenitor cells in the intestine. Nature. 2005;435(7044):964–968. doi: 10.1038/nature03589. [DOI] [PubMed] [Google Scholar]
- 12.Rodilla V, et al. Jagged1 is the pathological link between Wnt and Notch pathways in colorectal cancer. Proc Natl Acad Sci U S A. 2009;106(15):6315–6320. doi: 10.1073/pnas.0813221106. [DOI] [PMC free article] [PubMed] [Google Scholar]
- 13.Fre S, et al. Notch and Wnt signals cooperatively control cell proliferation and tumorigenesis in the intestine. Proc Natl Acad Sci U S A. 2009;106(15):6309–6314. doi: 10.1073/pnas.0900427106. [DOI] [PMC free article] [PubMed] [Google Scholar]
- 14.Tell G, Quadrifoglio F, Tiribelli C, Kelley MR. The many functions of APE1/Ref-1: not only a DNA repair enzyme. Antioxid Redox Signal. 2009;11(3):601–620. doi: 10.1089/ars.2008.2194. [DOI] [PMC free article] [PubMed] [Google Scholar]
- 15.Bhakat KK, Mantha AK, Mitra S. Transcriptional regulatory functions of mammalian AP-endonuclease (APE1/Ref-1), an essential multifunctional protein. Antioxid Redox Signal. 2009;11(3):621–638. doi: 10.1089/ars.2008.2198. [DOI] [PMC free article] [PubMed] [Google Scholar]
- 16.Yang S, Irani K, Heffron SE, Jurnak F, Meyskens FL. Alterations in the expression of the apurinic/apyrimidinic endonuclease-1/redox factor-1 (APE/Ref-1) in human melanoma and identification of the therapeutic potential of resveratrol as an APE/Ref-1 inhibitor. Mol Cancer Ther. 2005;4(12):1923–1935. doi: 10.1158/1535-7163.MCT-05-0229. [DOI] [PubMed] [Google Scholar]
- 17.Bobola MS, Blank A, Berger MS, Stevens BA, Silber JR. Apurinic/apyrimidinic endonuclease activity is elevated in human adult gliomas. Clin Cancer Res. 2001;7(11):3510–3518. [PubMed] [Google Scholar]
- 18.Kelley MR, et al. Elevated and altered expression of the multifunctional DNA base excision repair and redox enzyme Ape1/ref-1 in prostate cancer. Clin Cancer Res. 2001;7(4):824–830. [PubMed] [Google Scholar]
- 19.Moore DH, Michael H, Tritt R, Parsons SH, Kelley MR. Alterations in the expression of the DNA repair/redox enzyme APE/ref-1 in epithelial ovarian cancers. Clin Cancer Res. 2000;6(2):602–609. [PubMed] [Google Scholar]
- 20.Sak SC, Harnden P, Johnston CF, Paul AB, Kiltie AE. APE1 and XRCC1 protein expression levels predict cancer-specific survival following radical radiotherapy in bladder cancer. Clin Cancer Res. 2005;11(17):6205–6211. doi: 10.1158/1078-0432.CCR-05-0045. [DOI] [PubMed] [Google Scholar]
- 21.Wang D, Luo M, Kelley MR. Human apurinic endonuclease 1 (APE1) expression and prognostic significance in osteosarcoma: enhanced sensitivity of osteosarcoma to DNA damaging agents using silencing RNA APE1 expression inhibition. Mol Cancer Ther. 2004;3(6):679–686. [PubMed] [Google Scholar]
- 22.Kakolyris S, et al. Human apurinic endonuclease 1 expression in a colorectal adenoma-carcinoma sequence. Cancer Res. 1997;57(9):1794–1797. [PubMed] [Google Scholar]
- 23.Di Maso V, et al. Subcellular localization of APE1/Ref-1 in human hepatocellular carcinoma: possible prognostic significance. Mol Med. 2007;13(1–2):89–96. doi: 10.2119/2006-00084.DiMaso. [DOI] [PMC free article] [PubMed] [Google Scholar]
- 24.Noike T, Miwa S, Soeda J, Kobayashi A, Miyagawa S. Increased expression of thioredoxin-1, vascular endothelial growth factor, and redox factor-1 is associated with poor prognosis in patients with liver metastasis from colorectal cancer. Hum Pathol. 2008;39(2):201–208. doi: 10.1016/j.humpath.2007.04.024. [DOI] [PubMed] [Google Scholar]
- 25.Kakolyris S, et al. Human AP endonuclease 1 (HAP1) protein expression in breast cancer correlates with lymph node status and angiogenesis. Br J Cancer. 1998;77(7):1169–1173. doi: 10.1038/bjc.1998.194. [DOI] [PMC free article] [PubMed] [Google Scholar]
- 26.Fung H, Demple B. A vital role for Ape1/Ref1 protein in repairing spontaneous DNA damage in human cells. Mol Cell. 2005;17(3):463–470. doi: 10.1016/j.molcel.2004.12.029. [DOI] [PubMed] [Google Scholar]
- 27.Fishel ML, et al. Knockdown of the DNA repair and redox signaling protein Ape1/Ref-1 blocks ovarian cancer cell and tumor growth. DNA Repair (Amst). 2008;7(2):177–186. doi: 10.1016/j.dnarep.2007.09.008. [DOI] [PMC free article] [PubMed] [Google Scholar]
- 28.Zou GM, Maitra A. Small-molecule inhibitor of the AP endonuclease 1/REF-1 E3330 inhibits pancreatic cancer cell growth and migration. Mol Cancer Ther. 2008;7(7):2012–2021. doi: 10.1158/1535-7163.MCT-08-0113. [DOI] [PMC free article] [PubMed] [Google Scholar]
- 29.Kim MH, et al. Ape1/Ref-1 induces glial cell-derived neurotropic factor (GDNF) responsiveness by upregulating GDNF receptor alpha1 expression. Mol Cell Biol. 2009;29(8):2264–2277. doi: 10.1128/MCB.01484-08. [DOI] [PMC free article] [PubMed] [Google Scholar]
- 30.Fishel ML, et al. Impact of APE1/Ref-1 redox inhibition on pancreatic tumor growth. Mol Cancer Ther. 2011;10(9):1698–1708. doi: 10.1158/1535-7163.MCT-11-0107. [DOI] [PMC free article] [PubMed] [Google Scholar]
- 31.Yang S, Misner BJ, Chiu RJ, Meyskens FL. Redox effector factor-1, combined with reactive oxygen species, plays an important role in the transformation of JB6 cells. Carcinogenesis. 2007;28(11):2382–2390. doi: 10.1093/carcin/bgm128. [DOI] [PubMed] [Google Scholar]
- 32.Zou GM, Karikari C, Kabe Y, Handa H, Anders RA, Maitra A. The Ape-1/Ref-1 redox antagonist E3330 inhibits the growth of tumor endothelium and endothelial progenitor cells: therapeutic implications in tumor angiogenesis. J Cell Physiol. 2009;219(1):209–218. doi: 10.1002/jcp.21666. [DOI] [PubMed] [Google Scholar]
- 33.Koduru S, Kumar R, Srinivasan S, Evers MB, Damodaran C. Notch-1 inhibition by Withaferin-A: a therapeutic target against colon carcinogenesis. Mol Cancer Ther. 2010;9(1):202–210. doi: 10.1158/1535-7163.MCT-09-0771. [DOI] [PMC free article] [PubMed] [Google Scholar]
- 34.Guilmeau S, Flandez M, Mariadason JM, Augenlicht LH. Heterogeneity of Jagged1 expression in human and mouse intestinal tumors: implications for targeting Notch signaling. Oncogene. 2010;29(7):992–1002. doi: 10.1038/onc.2009.393. [DOI] [PubMed] [Google Scholar]
- 35.Serafin V, et al. Notch3 signalling promotes tumour growth in colorectal cancer. J Pathol. 2011;224(4):448–460. doi: 10.1002/path.2895. [DOI] [PubMed] [Google Scholar]
- 36.Bray SJ. Notch signalling: a simple pathway becomes complex. Nat Rev Mol Cell Biol. 2006;7(9):678–689. doi: 10.1038/nrm2009. [DOI] [PubMed] [Google Scholar]
- 37.Liu H, Kennard S, Lilly B. NOTCH3 expression is induced in mural cells through an autoregulatory loop that requires endothelial-expressed JAGGED1. Circ Res. 2009;104(4):466–475. doi: 10.1161/CIRCRESAHA.108.184846. [DOI] [PMC free article] [PubMed] [Google Scholar]
- 38.Dufraine J, Funahashi Y, Kitajewski J. Notch signaling regulates tumor angiogenesis by diverse mechanisms. Oncogene. 2008;27(38):5132–5137. doi: 10.1038/onc.2008.227. [DOI] [PMC free article] [PubMed] [Google Scholar]
- 39.Fantini D, et al. APE1/Ref-1 regulates PTEN expression mediated by Egr-1. Free Radic Res. 2008;42(1):20–29. doi: 10.1080/10715760701765616. [DOI] [PMC free article] [PubMed] [Google Scholar]
- 40.Reedijk M, et al. High-level coexpression of JAG1 and NOTCH1 is observed in human breast cancer and is associated with poor overall survival. Cancer Res. 2005;65(18):8530–8537. doi: 10.1158/0008-5472.CAN-05-1069. [DOI] [PubMed] [Google Scholar]
- 41.Santagata S, et al. JAGGED1 expression is associated with prostate cancer metastasis and recurrence. Cancer Res. 2004;64(19):6854–6857. doi: 10.1158/0008-5472.CAN-04-2500. [DOI] [PubMed] [Google Scholar]
- 42.Choi JH, Park JT, Davidson B, Morin PJ, Shih Ie M, Wang TL. Jagged-1 and Notch3 juxtacrine loop regulates ovarian tumor growth and adhesion. Cancer Res. 2008;68(14):5716–5723. doi: 10.1158/0008-5472.CAN-08-0001. [DOI] [PMC free article] [PubMed] [Google Scholar]
- 43.Sethi N, Dai X, Winter CG, Kang Y. Tumor-derived JAGGED1 promotes osteolytic bone metastasis of breast cancer by engaging notch signaling in bone cells. Cancer Cell. 2011;19(2):192–205. doi: 10.1016/j.ccr.2010.12.022. [DOI] [PMC free article] [PubMed] [Google Scholar]
- 44.Pannequin J, et al. The wnt target jagged-1 mediates the activation of notch signaling by progastrin in human colorectal cancer cells. Cancer Res. 2009;69(15):6065–6073. doi: 10.1158/0008-5472.CAN-08-2409. [DOI] [PubMed] [Google Scholar]
- 45.Chen X, Stoeck A, Lee SJ, Shih Ie M, Wang MM, Wang TL. Jagged1 expression regulated by Notch3 and Wnt/beta-catenin signaling pathways in ovarian cancer. Oncotarget. 2010;1(3):210–218. doi: 10.18632/oncotarget.127. [DOI] [PMC free article] [PubMed] [Google Scholar]
- 46.Garber K. Notch emerges as new cancer drug target. J Natl Cancer Inst. 2007;99(17):1284–1285. doi: 10.1093/jnci/djm148. [DOI] [PubMed] [Google Scholar]
Associated Data
This section collects any data citations, data availability statements, or supplementary materials included in this article.


