Abstract
Flow cytometry is a well-established and powerful high-throughput fluorescence measurement tool that also allows for the sorting and enrichment of subpopulations of cells expressing unique fluorescence signatures. Owing to the reliance on intensity-only signals, flow cytometry sorters cannot easily discriminate between fluorophores that spectrally overlap. In this paper we demonstrate a new method of cell sorting using a fluorescence lifetime-dependent methodology. This approach, referred to herein as phase-filtered cell sorting (PFCS), permits sorting based on the average fluorescence lifetime of a fluorophore by separating fluorescence signals from species that emit differing average fluorescence lifetimes. Using lifetime-dependent hardware, cells and microspheres labeled with fluorophores were sorted with purities up to 90%. PFCS is a practical approach for separating populations of cells that are stained with spectrally overlapping fluorophores or that have interfering autofluorescence signals.
OCIS codes: (170.1420) Biology; (170.3650) Lifetime-based sensing; (170.6280) Spectroscopy, fluorescence and luminescence; (300.2530) Fluorescence, laser-induced
1.Introduction
The ability to sort viable censuses of cells based on a unique fluorescence signal is, and continues to be, an extremely powerful function of flow cytometry. More broadly known as the trademarked name, FACS (fluorescence activated cell sorting), cell sorting allows cytometrists to physically separate a population of cells into smaller isolates for subsequent culturing and experimentation. Since the inception of this approach in the 1960s [1, 2], cell sorting has rapidly expanded [3–5], and the commercialized technology has continuously improved. Owing to the breadth of FACS measurements in research and clinical settings, sorting instruments are now available that detect up to 18 colors simultaneously. Yet, the number of fluorescent channels on a single sorter is not necessarily limited by how many photomultiplier tube (PMT) detectors can physically fit on an instrument but rather by the photo-physical attributes of the organic fluorophores used. That is, the emission spectra of many common fluorophores are broad and the more colors used, the more prevalent the problem of fluorescence spillover. Additionally, in cytometry dim fluorescence expressers are challenging to detect in the presence of autofluorescence.
Detecting the fluorescence lifetime, or the average time a fluorophore resides in an excited state, is a possible alternative to intensity-based measurements. The fluorescence lifetime can be captured for a number of biologically significant purposes including a better understanding of different biochemical processes, to more accurately resolve Forster resonance energy transfer (FRET), and to observe the dynamics of biological macromolecules and assemblies, to name a few [6]. Early demonstrations of time resolved flow cytometry techniques involved frequency-domain measurements performed with complex analog devices [7–13]. Such time resolved cytometry systems required analog-dependent homodyning, and recently digital approaches now permit un-complex sorting and analysis [14–16]. However, the digital sorting approaches that have been demonstrated require high-speed data acquisition systems that need to process high frequency signals and also generate synthetic digital signals with specialty field-programmable gate array (FPGA) programming to initiate sorting.
In this contribution, fluorescence lifetime-dependent cell sorting is further developed using a technique called phase filtered cell sorting (PFCS). The phase filtering approach can be likened to optical filtering, however optical filters separate signals based on emission spectra and this phase filter approach will separate signals based on emission timing (fluorescence lifetimes). To demonstrate this, a MATLAB® (The Mathworks) simulation to model phase filtering was accomplished and followed up with real PFCS using fluorescently labeled cells and microspheres.
In general, PFCS is an original approach in that it foreshadows adapting fluorescence lifetime-based discrimination onto any standard and commercial cell sorter. Unlike prior lifetime-based cytometry systems, this approach is unique because no complex data acquisition system is required. Rather, existing commercial cell sorters with data acquisition systems that accept low-frequency waveforms filtered down after a pre-amplification stage can be used in real time to sort populations of cells that are labeled with different, but spectrally overlapping fluorophores.
2. Theory
Fluorescence lifetime measurements in flow cytometry are mainly performed in the frequency domain. The fluorescence lifetime is extracted by modulating the excitation source at a radio frequency and measuring the phase shift of the modulated fluorescence signal relative to the excitation signal. In flow cytometry, the detected fluorescence signal is Gaussian in shape; thus a phase-resolved signal resembles a ‘modulated-Gaussian’ shaped waveform. The fluorescence emission signal is approximated by the functions below:
| (1) |
which is simplified to,
| (2) |
where V(t) is the time-dependent fluorescence signal, A represents the total fluorescence signal intensity, is the angular frequency of the modulation, m and are the respective demodulation and phase shift terms associated with a single fluorescence decay time (τ), and a is a term associated with the laser mode, beam waist and the velocity of the samples passing through the laser beam at time t0.
In practice, the phase filtering approach is very similar to standard frequency-domain homodyne detection. The signal represented by Eqs. (1) and (2) is mixed with a phase-shifted reference signal at the same modulation frequency of the emission signal. The mixed signal is then low-pass filtered so that a standard data acquisition system can appropriately handle the low-frequency analog-to-digital conversion. The mixed and filtered result is phase-dependent, or reliant on the average fluorescence lifetime of the excited fluorophore(s) detected. Equation (3) represents this result where is the phase of the reference signal, which has the same angular frequency as the fluorescence emission.
| (3) |
The relationship between a phase shift and fluorescence lifetime, when single exponential decay kinetics are assumed is shown in Eq. (4).
| (4) |
By slightly modifying the aforementioned theory, phase filtering can be accomplished. Figure 1 is an illustration that depicts phase filtering both mathematically and in practice. The fluorescence emission signal, depicted by the modulated Gaussian waveform, results from a cell that expresses fluorescence from one of two unique but spectrally overlapping fluorophores (for this example referred to as fluorophore #1 and fluorophore #2). During standard intensity-based FACS experiments, individual cells are separated from each other when the cells are labeled with fluorophores having separate quantum efficiencies and spectral emission. However, if both have the same spectral emission and fluorescence yield then cells labeled with fluorophore #1 cannot be sorted from cells labeled with fluorophore #2. If cells express fluorescence from two spectrally overlapping fluorophores, or express fluorescence from a single fluorophore with a distinct double-exponential decay, Eq. (3) can be re-written as two phase-dependent contributions shown by Eqs. (5) and (6).
| (5) |
| (6) |
The total fluorescence detected is then re-defined as a summation of Eqs. (5) and (6) to represent the function below.
Fig. 1.
Illustration of signal processing electronics and different stages required for phase-filtered cell sorting. A modulated Gaussian signal (solid black line) is input into stage 1; see also Eq. (7). After band-pass filtering this signal, stage 2 represents the “cleaned” and total fluorescence signal. The total signal is split in half and each half is mixed with separate phase-delayed reference signals (shown as a single sinusoidal input as solid black line) represented by Eq. (8) and (9). At stage 3, the output of each mixed signal represented by Eqs. (10) and (11) are then low-pass filtered. The final phase-sensitive fluorescence signals at stage 4 are delivered to a flow cytometry data acquisition system for routine analysis or sorting. The outputs after stage 4 are signals from Dye #1 (blue line) and Dye #2 (red line). The different stages are also simulated and exemplified in Fig. 3.
| (7) |
Where A1, A2 are the signal intensities, m1, m2 are the demodulation factors, and 1, 2 are the phase shifts proportional to the two fluorescence lifetimes contained in the signal.
The aim of phase-filtering is to turn a summation signal (Eq. (7)), which is measured experimentally into a signal that is dependent on only one fluorophore (e.g. Eq. (5) or (6)). Therefore during real-time cell sorting, a sorting decision can be made based on signals that are related to the presence of only one of the fluorophores despite the photodetector collecting the total fluorescence. Nulling one of the fluorescence signals by exploiting the fluorophore’s lifetime is necessary for this to occur. Nulling is accomplished during mixing by altering the reference signal phase. That is, the total signal (Eq. (7)) is divided in half so that the resulting two signals are mixed with independent references signals with unique phase shifts:
| (8) |
| (9) |
Mixing is accomplished using a phase-sensitive detector (PSD, see Fig. 1) hardware that is described later. The new signals, labeled as Dye #1 and Dye #2, are fluorescence signals representing only contributions from fluorophore #1 (as shown in Fig. 1 by a blue line) and #2, respectively (as shown in Fig. 1 by a red line). For PSD1, the signal is represented by Eq. (10) because the total contribution from fluorophore #2 is suppressed, or nulled to zero. Similarly PSD2 signal is expressed by Eq. (11), where any fluorescence from fluorophore #1 is nulled to zero.
| (10) |
| (11) |
3. Materials and methods
Two steps were taken to evaluate and demonstrate PFCS. Mathematical modeling was first accomplished to simulate, using MATLAB®, phase-sensitive detection theory and verify the methodology using a variety of fictional fluorescence lifetimes. Second, experiments with fluorescence microspheres (i.e. standard cytometry calibration beads infused with combinations of fluorophores) and cultures of fixed mammalian cells were completed to test cell sorting by discriminating between the fluorescence lifetimes of all samples.
3.1 Simulation of phase-filtered fluorescence measurements
For the mathematical modeling work the constraints and variables controlled during the simulation included the total signal intensity, modulation frequency, fluorescence lifetime(s), and phase shifts. Table 1 provides the different specifications and parameters used for the simulation. Different modulation frequencies were tested to evaluate the optimum modulation source for the fluorescence lifetime combinations simulated. The mixing approach was simply the multiplication of an artificially generated reference signal with the simulated fluorescence having two lifetime contributions. The result of the multiplication was a continuous function with a high frequency and DC component. Low-pass filtering involved converting the mixed signal into the frequency domain using a Fast Fourier Transform (FFT), after which the high-frequency component from the FFT result was cut off. Then the signal was converted back using an inverse FFT.
Table 1. Simulation parameters.
|
|
Input parameters
|
Output
|
||||
|---|---|---|---|---|---|---|
| Objects | Intensity | Transit Time (µs) | Modulation (MHz) | (ns) | REF1 | |
| Dye #1 | 1 | 15 | 1 | 16 | 95.74 | |
| Dye #2 | 1 | 15 | 1 | 19 | –83.19 | |
3.2 Fluorescence microspheres and fluorescently labeled mammalian cell culture
The fluorescence microspheres used in this study included Flow-Check Fluorospheres (Beckman Coulter Inc.) and Fluoresbrite® Yellow Green (YG) Microspheres (PolySciences Inc). Both samples were used on the flow cytometers at approximate concentrations of 106 spheres/mL PBS. Both microsphere types are 10 µm in diameter and excite at 405-nm and 488-nm with broad emission spectra that overlap from ~500-nm to 600-nm. The fluorescence lifetimes of each sphere population were measured with standard lifetime-based cytometry (described later).
Chinese Cricetulus griseus ovary (CHO-KI) cells (ATCC: CCL-61) were also cultured to demonstrate phase filtered cell sorting. CHO-K1 cells were grown attached to the wall of T-25 flasks (Santa Cruz Biotechnology, Santa Cruz, CA) in DMEM/F12 media (Life technologies, Grand Island, NY) supplemented with 10% Fetal Bovine Serum. Standard mammalian cell culture incubation was followed (i.e. 80% relative humidity, with 5% CO2 at 37 °C). At slightly under full confluence the cells were detached from the flask with 1 mL of 0.25% Tryspin-EDTA (Life technologies, Grand Island, NY), centrifuged at 840 rpm for 4 minutes and re-suspended in phosphate buffered saline to obtain three volumes at a concentration of 106 cells/mL. After fixation with 95% ethanol solution the cells were treated with RNase at 30 µL of 1 µg/mL and fluorescently stained with ethidium bromide (EB, AnaSpec, Inc., Fremont,CA) or propidium iodide (PI, AnaSpec, Inc., Fremont,CA). EB and PI are DNA intercalating agents often used for cell viability and cell cycle analyses [17–20]. When excited with 488 nm, both of the dyes fluoresce red. PI, due to its brightness and spectral emission overlap with EB, is not ideally suited to be used in combination with EB. Thus, both were chosen for the PFCS experiment. The fluorescence lifetime of EB increases dramatically from 1.67 ns to 19 ns when bound to DNA content [21], and the fluorescence lifetime of PI has been reported as 16 ns [14, 22].
3.2 Phase-filtered cell and microsphere sorting and analysis experiments
For the PFCS demonstration, three methods were used: (1) standard cytometry measurements and analyses to collect routine fluorescence intensity and side scatter measurements of the cells and microspheres; (2) standard frequency-domain flow cytometry measurements using digital lifetime techniques to collect the average fluorescence lifetime of the cells and microspheres prior to attempting phase-filtering; and (3) phase-filtered cell sorting using analog hardware described herein to null different fluorescence contributions in a multi-fluorophore cell population, and sort based on this value.
Standard flow cytometry measurements were acquired with a BD Accuri C6 Flow Cytometer (Beckton Dickinson Corp) to evaluate the fluorescence emission signal of the microspheres and fluorescently labeled cells. The results evaluated included observing the mean and percentage coefficient of variation (%CV) to determine if EB and PI appropriately intercalated into the DNA of the fixed cells.
Fluorescence lifetimes were first verified using a digital frequency-domain flow cytometer as well as an analog frequency domain flow cytometer. The cytometry systems and the methods of obtaining the fluorescence lifetime are described elsewhere [10, 14, 22]. Briefly, the digital system includes a modified FACSVantage SE flow cytometer that is fitted with a radio-frequency modulated laser (488-nm, 50 mW Vortran® laser Stradus Laser Technology, CA). The modulated fluorescence signal is directed to a high-speed data acquisition system [23], where digital signal processing takes place to extract the phase shift of the fluorescence signal relative to a Rayleigh scatter signal and ultimately the average fluorescence lifetime (refer to Eq. (4)). The analog system is a laboratory-built cytometer also with a radio-frequency modulated laser (488-nm, 50 mW Vortran® laser Stradus Laser Technology, CA), and the fluorescence lifetime is obtained through an analog homodyne mixing system.
The PFCS system is illustrated in Fig. 2 . In this system either a 407-nm, 100 mW solid state CUBE laser (Coherent, Inc, Santa Clara, CA, 1142279) or a 488-nm, 50 mW diode (Vortran® laser Stradus Laser Technology, CA) was used to excite the fluorescence microspheres and fluorescently labeled cells. A dual output channel arbitrary function generator (Tektronix, Beaverton, AFG 3102) operating at 6 MHz with a 50% square wave duty cycle digitally modulated the laser(s). The same 5-color FACSVantage flow cytometer was fitted with a high-frequency preamplifier (Advanced Research Instruments Corporation, Golden) replacing the FACSVantage low-frequency transimpedance amplifiers. Additionally a passive 6 MHz band-pass filter (Chesterfield) was used to further reduce arbitrary frequencies (high or low) in the signal. Phase detectors (mini-circuits, Brooklyn) were employed for mixing, and a multi-channel low-pass filter (Krohn-Hite, Brockton) electronically filtered the high-frequencies away. Analog signal delay lines (Allen Avionics, Mineola) were used to adjust the phase of the reference signals.
Fig. 2.
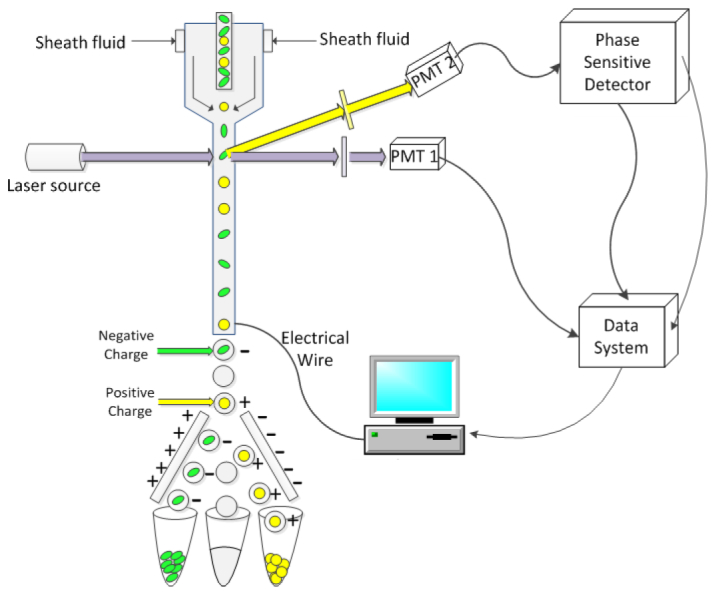
Simplified diagram of the PFCS system. Fluorescently labeled particles or cells rapidly transit a modulated laser beam during hydrodynamic focusing. The fluorescence and side scattered light are focused onto photomultiplier tube detectors. Signals from the PMTs are collected and routed to the PFCS hardware. A box represents all PFCS hardware, which are depicted in detail by Fig. 1. After phase-filtering, the signals are connected to the cytometry data system and normal sorting is accomplished. Sorting is based upon the formation of droplets and the selective charging of each droplet based on the phase-sensitive parameter. Once charged the droplets are attracted to either positively or negatively charged plates to be collected into separate vials. All sorting gates are set on the cytometry computer after the phase filtering is performed.
During experiments with 407-nm excitation, a 409 nm sharp cut-off long-pass optical filter (Semrock, Rochester) was attached to the front of the fluorescence photomultiplier tube (PMT) for fluorescence detection. Additionally a 407/14-nm band-pass optical filter (Semrock, Rochester) was used to detect scatter (either in the forward or side direction). With excitation at 488-nm, a 520 nm long-pass filter was placed on the fluorescence PMT and a 488/10-nm band pass filter allowed scattered light measurements. Cell sorting was controlled using the FACSVantage CellQuest Pro (Becton Dickinson, CA) software at nominal pressures and event rates (100 events/s). Real-time, conventional flow cytometry data (.fcs files), resulting from the phase-filtering experiments, were evaluated through standard histogram and dot-plot format.
The methodology for sorting of cells or microspheres involved first measuring the fluorescence lifetime of each sample. Then, upon a priori knowledge of the fluorescence lifetimes, a sample (or mixture of samples) was loaded onto the PFCS system. During acquisition, the fluorescence signals were obtained, and as depicted in Fig. 1, were split, mixed, nulled for elimination of a fraction of the signal coming from one fluorophore, and filtered. After filtering, the phase-sensitive signals were re-routed back to the FACSVantage where they were digitized and turned into a standard cytometry parameter to be plotted as a histogram in real-time. Cytometric markers (upper and lower bound regions) were used to select the phase-sensitive populations for sorting.
4. Results
4.1 Simulation of phase-filtered fluorescence measurements
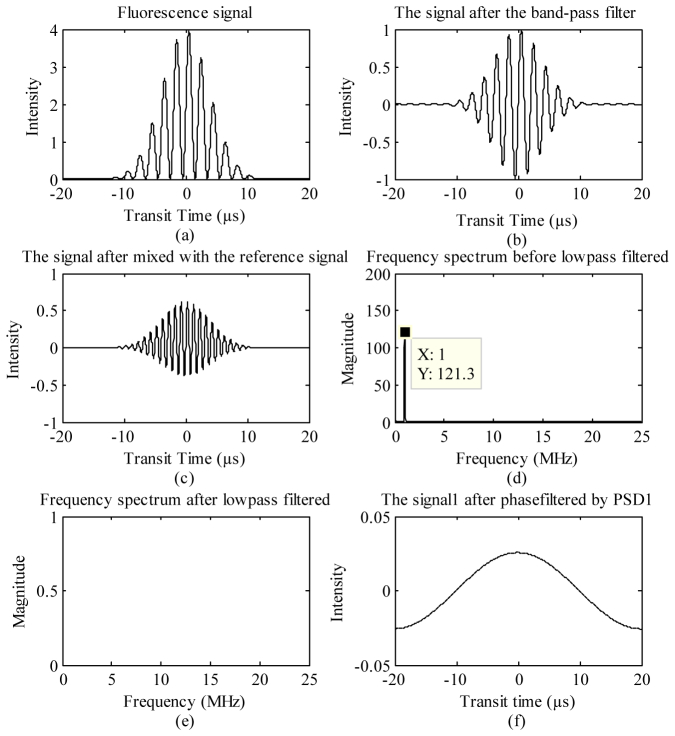
Example results of the simulation output where mathematical functions of each electronic stage were modeled are plotted in Figs. 3(a) -3(f). For this example the two fluorophores had simulated fluorescence lifetimes of 16 ns and 19 ns, and the modulation frequency introduced was 1 MHz. Figure 3(a) represents the total fluorescence signal, which consists of fluorescence from the two independent fluorophores (see also stage 1 in Fig. 1). Figure 3(b) plots the resulting function after band-pass filtering (see also Eq. (2) for mathematical representation and stage 2 of Fig. 1). After this stage, the resulting phase shift values (ϕ1 and ϕ2) of each fluorophore were extracted and found to be 5.74° and 6.81°. Likewise, the reference phase shifts ( ) necessary to null the respective fluorophores were calculated to be 95.74° and −83.19° (see also Table 1. and Eqs. (8) and (9)).
Fig. 3.
Simulation results at each stage during phase-resolved detection (see also Fig. 1 for each stage) where (a) is the total fluorescence signal from a mixture of two spectrally overlapping fluorophores (Eq. (7)) when the modulation frequency is 1 MHz. After band-pass filtering of this signal (b), the fluorescence signal is mixed with a 1-MHz phase-shifted reference signal (c). Simulation of low-pass filtering is a 3-stage process. First, a Fast Fourier Transform of (c) results in (d), where the 1-MHz high frequency from the FFT output is revealed. Then low pass filtering of (d) results in (e), where the 1-MHz peak is eliminated. Finally, an inverse FFT of (e) is accomplished to collect the final phase-sensitive signal (f).
Figure 3(c) is a plot of the function after eliminating one fluorophore signal away from the total fluorescence signal. In this example, fluorophore #1 (16 ns) was nulled, leaving only a fluorescence signal from fluorophore #2 (19ns). Nulling occurred after reference phases were determined and used to adjust the reference signal delay (see also stage 3 in Fig. 1). Finally, Figs. 3(d)-3(f) are plots of the low-pass filtering stages. The FFT (Fig. 3(d)) led to a distribution of frequency components where the 1 MHz peak is dominant (i.e. from the fundamental modulation frequency). In this simulation result (Fig. 3(d)), the distribution plotted ranges up to 25MHz. This FFT output assumes that the signal is sampled at a 50 mega-sample per second (MSPS) data acquisition system. Thus 25MHz is the Nyquist frequency for this assumption and the mirror image high frequencies (25 to 50 MHz) from the FFT output are not displayed. Figure 3(e) then displays the removal of the high frequency (1 MHz) after low-pass filtering (Fig. 3(e)). The phase-resolved signal was rebuilt by the inverse FFT (Fig. 3(f)).
When the single exponential decay equation (Eq. (4)) is assumed, then mathematical calculations can be used to properly select the optimum frequencies to be use on the PFCS system. This effectively maximizes the perturbation between and allows us to gauge the proper frequency to use during cell sorting experiments. Eight modulation frequencies were used to calculate several different phase shift values for fluorophores having either a 16- or 19-ns lifetime (i.e. simulating PI and EB) as shown in Table 2 . The modulation frequencies used were 1, 2, 3, 4, 5, 6, 7, and 8 MHz. The eight modulation frequencies resulted in eight unique phase-shift values for each fluorophore. At 6 MHz, a fluorophore with a 16-ns fluorescence lifetime imparts a 31.1° phase shift in the modulated signal. Likewise, a fluorophore with a 19-ns fluorescence lifetime imparts a 35.61° phase shift in the modulated signal. Therefore, 6 MHz was selected for phase-filtered cell sorting in order to increase the factor of for PI and EB, to make the signals more sensitive, and to work within the frequency limitations of our instrument.
Table 2. Modulation frequencies for EB and PI.
| Frequency (MHz)
|
1
|
2
|
3
|
4
|
5
|
6
|
7
|
8
|
|
|---|---|---|---|---|---|---|---|---|---|
| Materials | Phase Shift (angular degree) | ||||||||
| PI | 5.74 | 11.37 | 16.78 | 21.91 | 26.69 | 31.10 | 35.13 | 38.81 | |
| EB | 6.81 | 13.43 | 19.70 | 25.53 | 30.83 | 35.61 | 39.88 | 43.68 | |
Figures 4(a) -4(c) are histograms of the fluorescence lifetime results using the digital fluorescence lifetime flow cytometer [14]. The Flow-Check fluorospheres, had a previously reported fluorescence lifetime of 7 ns [22], and were evaluated at this range (Fig. 4(a)). The fluorescence lifetime populations of the fluorescently labeled cells are displayed in Figs. 4(b) and 4(c). The mean fluorescence lifetimes of EB and PI stained cells were 19.28 ns and 16.07 ns, respectively. The standard deviations of the lifetime distributions of both samples were 1.733 ns and 1.490 ns, respectively.
Fig. 4.
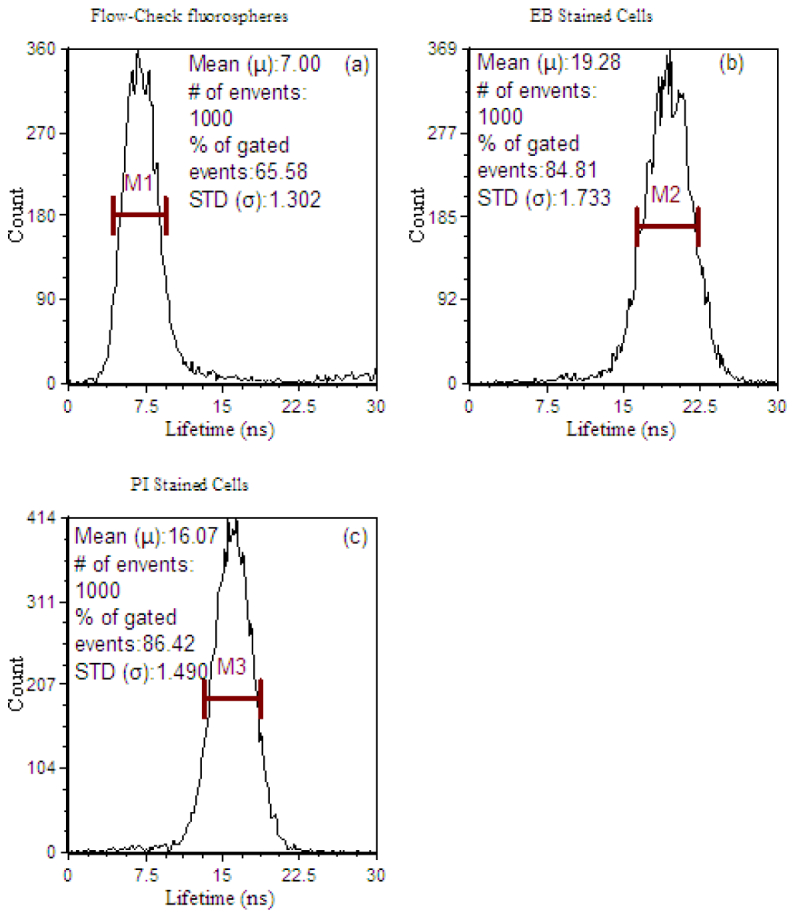
Cytometric histograms displaying the number of fluorescence microspheres or cells having a measured fluorescence lifetime. Measurements were made with a modified FACSVantage SE digital lifetime cytometer. (a) Fluorescence lifetime histogram of Flow-Check fluorospheres, which is an average of 7 ns. The standard deviation of the fluorescence lifetime measured in this population is 1.302 ns. (b) Fluorescence lifetime histogram of EB stained cells. The mean fluorescence lifetime is 19.28 ns with 1.733 standard deviation (STD). (c) Fluorescence lifetime histogram of PI stained cells. The mean lifetime is 16.07 ns with 1.490 STD
4.2 PFCS with fluorescence microspheres
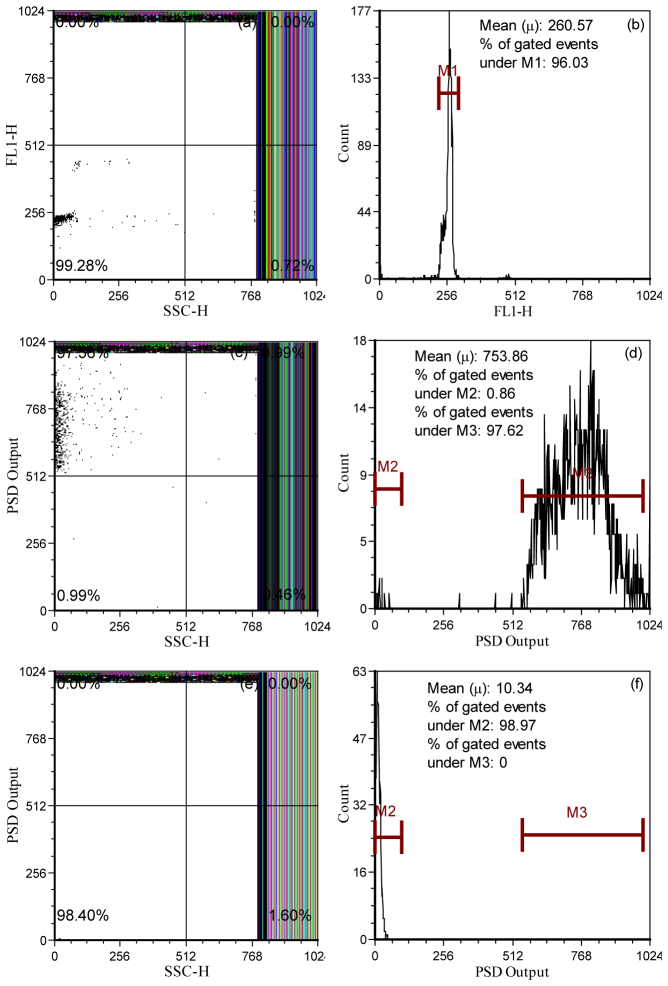
Figures 5(a) -5(f) is a panel of 1-D and 2-D histograms that exemplify the step-wise phase filtering of Flow-Check fluorospheres. With routine cytometric parameters (fluorescence intensity, FL1-H and side-scatter, SSC), the Flow-Checkfluorosphere were counted; the PFCS system produced a standard cytometric dot plot of SSC vs FL1-H (Fig. 5(a)) with a population CV of 4.88%. Similarly when plotted as a 1-D histogram, the fluorospheres display a tight and visibly uniform fluorescence (FL1-H) distribution (Fig. 5(b)). The maximized phase-sensitive fluorescence signal for the Flow-Check fluorospheres is displayed both as a dot plot and histogram (Figs. 5(c) and 5(d)). The populations in Figs. 5(c) and 5(d) are a result of mixing the fluorescence signal with a 130° shifted reference signal and filtering (i.e. using PFCS theory to maximize the phase signal). Alternatively, when the fluorescence signal is mixed with a reference signal shifted in phase by 40° (90° ( ) phase difference with 130°) near total elimination (nulling) of the fluorosphere population is obvious (Figs. 5(e)-5(f)).
Fig. 5.
Histograms and dot plots representing the number of Flow-Check fluorospheres having a specific side-scatter intensity (SSC), fluorescence intensity (FL1-H), or phase-sensitive intensity (PSD) signal before and after the phase-filtering process. Panels (a) and (b) present typical scatter and fluorescence histograms to illustrate the presence and detectability of the fluorospheres on the PFCS system. Panels (c) and (d) are the PSD fluorescence intensity counts measured by the same cytometer after phase filtering to maximize the fluorosphere signal (i.e. ). The dot plot shows the signal correlated to side scatter (SSC). Panels (e) and (f) are the PSD fluorescence intensity counts measured by the same cytometer after phase filtering to eliminate the fluorosphere signal (i.e. ).
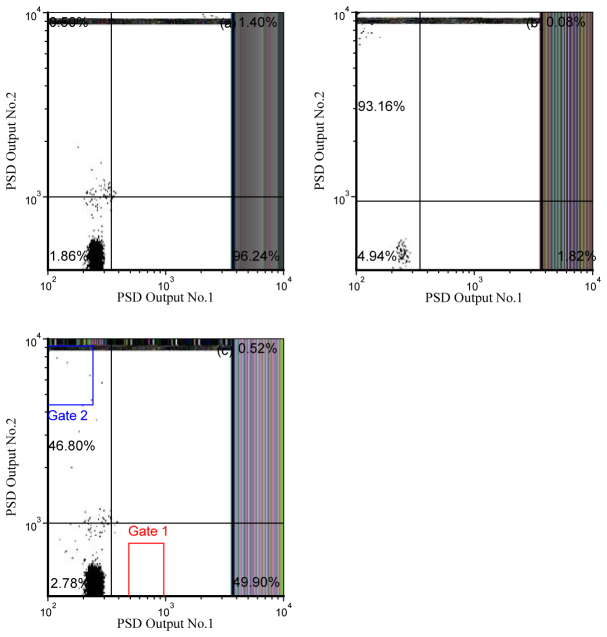
Figures 6(a) -6(c) is a panel with results demonstrating that phase filtered detection is possible with a retrofitted cell sorter. The events are displayed using the PSD outputs as correlated parameters. Flow-Check fluorospheres were first measured during which the reference phase of PSD No.2 (see Fig. 1) was adjusted to eliminate a phase-shifted signal that would result if fluorescence microspheres with a 3-ns lifetime (i.e. YG microspheres) were added to the Flow-Check fluorosphere population. Although no YG microspheres were at this stage introduced into the sample, Fig. 6(a) proves that the PSD signal from Flow-Check fluorosphere will remain visible when observing PSD No.1 output. Likewise, Fig. 6(b) displays a histogram when only YG microspheres were measured with the retrofitted PFCS cytometer. Upon measuring the YG microspheres, the reference phase of PSD No.1 was adjusted to null away any phase-sensitive signal that might arise if Flow-Check fluorospheres were present. Again, no Flow-Check fluorospheres were introduced at this proof-of-concept stage; rather the purpose was to determine if the output signal from PSD No.2 was observable when filtering away a different fictitious lifetime from the YG fluorescence lifetime. Lastly, Fig. 6(c) reveals the phase-dependent population results for a mixture of the Flow-Check fluorospheres and YG microspheres measured by the PFCS system. During measurement, the settings of the two PSDs were kept the same as described above. Thus the respective PSD No. 1 and No. 2 output signals reveal the discriminated events. The mixture was found to consist of approximately 49.90% Flow-Check fluorospheres and 46.80% YG microspheres. The gates shown in Fig. 6(c) are the actual gates set using the FACSVantage CellQuest Pro software for sorting.
Fig. 6.
Dot plots of phase-resolved detection prior to sorting. The parameters plotted are PSD No.1 vs. PSD No.2 (see Fig. 1). In panels (a) and (b) Flow-Check fluorospheres and YG microspheres are measured separately with the PFCS system. Panel (a): PSD No.1 is used to null YG fluorescence so that only fluorescence from Flow-Check fluorospheres is detectable; this demonstrates that the Flow-Check fluorosphere signals remain. Panel (b): PSD No.2 is adjusted to null Flow-Check fluorospheres so only signals from YG microspheres are detectable. Panel (c) is a dot plot of the phase-resolved detection of a mixed sample. Dots in gate 1 are Flow-Check fluorospheres and dots in gate 2 represent individual YG microspheres when the respective PSD channels are nulled to result in only one type of fluorescence signal per channel.
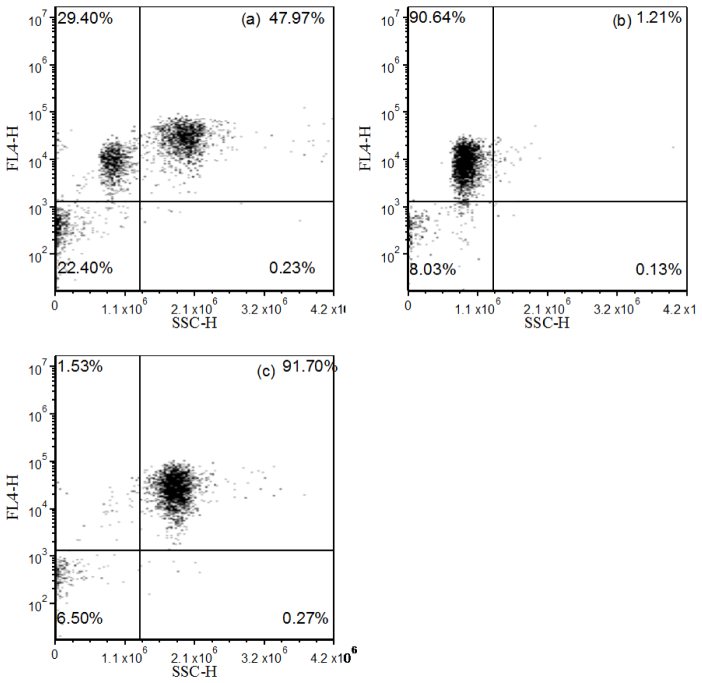
Figures 7(a) -7(c) is a panel of dot plots obtained before and after phase-filtered cell sorting of a mixture of fluorescence microspheres. Using a BDAccuri C6 flow cytometer, the pre- and post-sort mixtures were examined. Figure 7(a) is a dot plot of the microsphere mixture before sorting; the fraction of different microspheres counted verifies the count shown in Fig. 6(c). After sorting based on the phase-resolved detection, YG microspheres were purified to 90.64% (Fig. 7(b)) and Flow-Check fluorospheres were purified to 91.70% (Fig. 7(c)).
Fig. 7.
Dot plots demonstrating separation of mixed fluorescence microspheres using PFCS. A BD Accuri flow cytometer was used to obtain the three plots where panel (a) is pre-sort Flow-Check fluorosphere and YG microsphere mixture, panel (b) and (c) display the number of separated YG and Flow-Check fluorospheres when PSFC was implemented. YG microspheres were purified to 90.64% and Flow-Check fluorospheres were purified to 91.70%.
4.3 PFCS of fluorescently labeled cells
With the same approach, the PFCS results for a mixture of cells labeled with either EB or PI are displayed in Figs. 8 and 9 . When populations of each cell type were measured separately, the PFCS hardware were optimized such that the reference phase ( ) of PSD No.1 was adjusted to null the PI signal in the EB detection channel and the reference phase ( ) of PSD No.2 was adjusted to null the EB signal in the PI detection channel. Figure 8 is a dot plot displaying populations that are a mixture of PI- and EB-stained cells after the phase filtering settings were adjusted. It is apparent in the dot plot of Fig. 8 that PI and EB-stained events (i.e. cells, represented by dots) considerably overlap. That is, both PSD values for all cells fall in the lower left quadrant of the dot plot. This is due to the fact that the spread of fluorescence lifetime of EB-stained cells overlaps mildly with the variation of fluorescence lifetime of PI stained cells (as this is a stochastic process). Therefore in order to ensure separation for sorting of EB vs. PI stained cells, two non-overlapping gates were drawn, resulting in ~15% and 30% of the total number of cells for the PI-stained and EB-stained, events respectively. Cell sorting was then accomplished and the separated populations were collected.
Fig. 8.
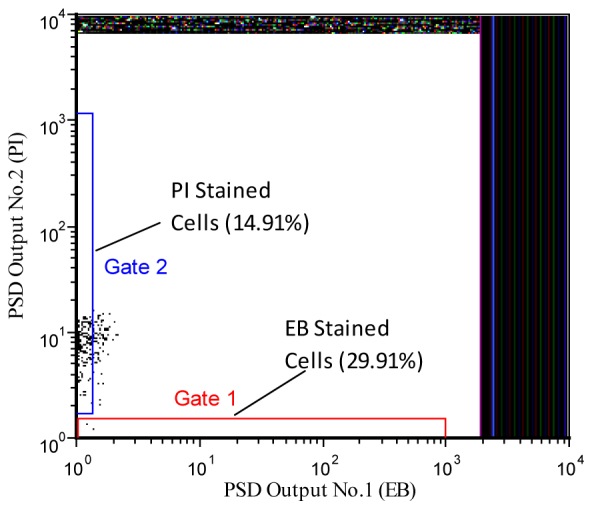
Dot plot of two correlated parameters, PSD No.1 vs PSD No.2 (see Fig. 1), for a mixture of EB and PI stained cells. The events show counts in the respective PSD channels where channel No.1 contains only signals from the EB-labeled cells and channel No.2 contains fluorescence signals from only PI-labeled cells. The plot was obtained after adjusting the respective PSD channels to null the signal from either the PI- or EB-stained samples. Therefore dots in Gate 01 are EB stained cells, which are approximately 29.91% of the total population, and dots in Gate 02 are approximately 14.91% of the total population.
Fig. 9.
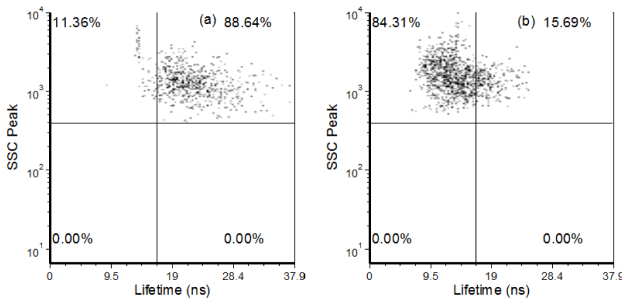
Dot plots showing populations of sorted EB- and PI-labeled cells using an analog fluorescence lifetime flow cytometer. Panel (a) displays example results of a population of cells with only ethidium bromide as the primary fluorescent label. Likewise, panel (b) displays the number of cells sorted that only contain PI as the primary fluorescence label.
PI emits in the same spectral range as EB, thus evaluating the ability to separate cells labeled with these fluorophores was not possible with the BD Accuri C6 flow cytometer. Sorting purities were thus evaluated with lifetime measurements using our analog frequency-domain flow cytometer [9]. The sorted results are displayed in Figs. 9(a) and 9(b). Dot plots of the side scattering signals versus the fluorescence lifetime of each population are displayed when measured at an emission longer than 600 nm. Compared to the mixed samples, the isolates were purified to 84.31% for the PI-labeled cells and 88.64% for the EB labeled cells.
5. Discussion and conclusions
With this paper we demonstrate cell sorting by leveraging the fluorescence lifetime and modifying a standard FACS system with phase-sensitive detection hardware. A mixture of CHO-K1 cells that were labeled with either EB or PI fluorophores was sorted in real time to result in separate populations having only EB and only PI stained cells. This was possible despite the fact the labeled cells expressed similar fluorescence emissions because the fluorescence lifetime of each fluorophore was exploited.
In conventional flow cytometry, increasingly complicated data analysis methods are necessary to separate signals that spectrally overlap. For example, compensation subsequent to event collection is often misunderstood, full spectral flow cytometers are now being designed, and multi-color instruments are continuously evolving [24–32]. During sorting, there is little time for on-line and complex data analysis approaches. The experimental and modeling work performed herein demonstrate steps that can be taken to implement phase filtering on any commercial flow cytometer. We also foreshadow digital phase filtering systems, which would exploit digital signal processing to be performed on-line. The single existing drawback to this method is the rapid attenuation of the value of , which is a product of multiplication. This attenuation affects the non-nulled signal, which is proportional to the fluorescence intensity (See Eqs. (10) and (11)). A possible remedy is to further amplify the fluorescence signal during these conditions. In general this contribution presents a feasibly approach to sorting based upon the fluorescence lifetime value during conditions when a mixed population of cells are labeled with overlapping fluorescent dyes. By utilizing the fluorescence lifetime, which is independent of emission intensity, a number of applications can be imagined where the concentration of the fluorophore is ignored and instead the total fluorescence signal is captured and electronically fractioned into different contributions representative of only one type of emission decay.
Acknowledgments
This work is supported by NIH Grant: R15 EB012013-01.
References and links
- 1.Fulwyler M. J., “Electronic separation of biological cells by volume,” Science 150(3698), 910–911 (1965). 10.1126/science.150.3698.910 [DOI] [PubMed] [Google Scholar]
- 2.Bonner W. A., Hulett H. R., Sweet R. G., Herzenberg L. A., “Fluorescence activated cell sorting,” Rev. Sci. Instrum. 43(3), 404–409 (1972). 10.1063/1.1685647 [DOI] [PubMed] [Google Scholar]
- 3.Steinkamp J. A., Fulwyler M. J., Coulter J. R., Hiebert R. D., Horney J. L., Mullancy P. F., “A new multiparameter separator for microscopic particles and biological cells,” Rev. Sci. Instrum. 44(9), 1301–1310 (1973). 10.1063/1.1686375 [DOI] [PubMed] [Google Scholar]
- 4.Jett J. H., Alexander R. G., “Droplet sorting of large particles,” Cytometry 6(5), 484–486 (1985). 10.1002/cyto.990060514 [DOI] [PubMed] [Google Scholar]
- 5.Bartholdi M. F., Parson J. D., Albright K. A., Cram L. S., “System for flow sorting chromosomes on the basis of pulse shape,” Cytometry 11(1), 165–172 (1990). 10.1002/cyto.990110119 [DOI] [PubMed] [Google Scholar]
- 6.Lakowicz J. R., Time-resolved laser Spectroscopy in Biochemistry (1988). [Google Scholar]
- 7.Pinsky B. G., Ladasky J. J., Lakowicz J. R., Berndt K., Hoffman R. A., “Phase-resolved fluorescence lifetime measurements for flow cytometry,” Cytometry 14(2), 123–135 (1993). 10.1002/cyto.990140204 [DOI] [PubMed] [Google Scholar]
- 8.Deka C., Sklar L. A., Steinkamp J. A., “Fluorescence lifetime measurements in a flow cytometer by amplitude demodulation using digital data acquisition technique,” Cytometry 17(1), 94–101 (1994). 10.1002/cyto.990170112 [DOI] [PubMed] [Google Scholar]
- 9.Steinkamp J. A., “Phase-sensitive detection methods for resolving fluorescence emission signals and directly quantifying lifetime,” Methods in cell biology 42, 627–640 (1994). [DOI] [PubMed] [Google Scholar]
- 10.Steinkamp J. A., Crissman H. A., “Resolution of fluorescence signals from cells labeled with fluorochromes having different lifetimes by phase-sensitive flow cytometry,” Cytometry 14(2), 210–216 (1993). 10.1002/cyto.990140214 [DOI] [PubMed] [Google Scholar]
- 11.Steinkamp J. A., Lehnert B. E., Lehnert N. M., “Discrimination of damaged/dead cells by propidium iodide uptake in immunofluorescently labeled populations analyzed by phase-sensitive flow cytometry,” J. Immunol. Methods 226(1-2), 59–70 (1999). 10.1016/S0022-1759(99)00053-8 [DOI] [PubMed] [Google Scholar]
- 12.Baskić D., Popović S., Ristić P., Arsenijević N. N., “Analysis of cycloheximide-induced apoptosis in human leukocytes: fluorescence microscopy using annexin V/propidium iodide versus acridin orange/ethidium bromide,” Cell Biol. Int. 30(11), 924–932 (2006). 10.1016/j.cellbi.2006.06.016 [DOI] [PubMed] [Google Scholar]
- 13.Edidin M., “A rapid, quantitative fluorescence assay for cell damage by cytotoxic antibodies,” J. Immunol. 104(5), 1303–1306 (1970). [PubMed] [Google Scholar]
- 14.Houston J. P., Naivar M. A., Freyer J. P., “Digital analysis and sorting of fluorescence lifetime by flow cytometry,” Cytometry A.77, 861-872 (2010). [DOI] [PMC free article] [PubMed] [Google Scholar]
- 15.P. Jenkins, M. A. Naivar, and J. P. Houston, 1040 South Horseshoe Drive Las Cruces, NM 88003 are revising a mansucript to be called “Multi-frequency flow cytometry.”
- 16.J. P. Houston, M. A. Naivar, and J. P. Freyer, “Capture of fluorescence decay times by flow cytometry,” Current Protocols in Flow Cytometry, Chapter 1: Unit 1.25 Jan (2012). [DOI] [PMC free article] [PubMed] [Google Scholar]
- 17.Jones K. H., Senft J. A., “An improved method to determine cell viability by simultaneous staining with fluorescein diacetate-propidium iodide,” The journal of histochemistry and cytochemistry: official journal of the Histochemistry Society 33, 77–79 (1985). [DOI] [PubMed] [Google Scholar]
- 18.Krishan A., “Rapid flow cytofluorometric analysis of mammalian cell cycle by propidium iodide staining,” J. Cell Biol. 66(1), 188–193 (1975). 10.1083/jcb.66.1.188 [DOI] [PMC free article] [PubMed] [Google Scholar]
- 19.Böhmer R. M., Ellwart J., “Cell cycle analysis by combining the 5-bromodeoxyuridine/33258 Hoechst technique with DNA-specific ethidium bromide staining,” Cytometry 2(1), 31–34 (1981). 10.1002/cyto.990020107 [DOI] [PubMed] [Google Scholar]
- 20.Larsen J. K., Munch-Petersen B., Christiansen J., Jørgensen K., “Flow cytometric discrimination of mitotic cells: resolution of M, as well as G1, S, and G2 phase nuclei with mithramycin, propidium iodide, and ethidium bromide after fixation with formaldehyde,” Cytometry 7(1), 54–63 (1986). 10.1002/cyto.990070108 [DOI] [PubMed] [Google Scholar]
- 21.Heller D. P., Greenstock C. L., “Fluorescence lifetime analysis of DNA intercalated ethidium bromide and quenching by free dye,” Biophys. Chem. 50(3), 305–312 (1994). 10.1016/0301-4622(93)E0101-A [DOI] [PubMed] [Google Scholar]
- 22.Steinkamp J. A., Keij J. F., “Fluorescence intensity and lifetime measurement of free and particle-bound fluorophore in a sample stream by phase-sensitive flow cytometry,” Journal Name: Rev. Sci. Instrum. 70(12), 4682–4688 (1999). 10.1063/1.1150143 [DOI] [Google Scholar]
- 23.Naivar M. A., Parson J. D., Wilder M. E., Habbersett R. C., Edwards B. S., Sklar L., Nolan J. P., Graves S. W., Martin J. C., Jett J. H., Freyer J. P., “Open, reconfigurable cytometric acquisition system: ORCAS,” Cytometry A. 71, 915–924 (2007). [DOI] [PubMed] [Google Scholar]
- 24.George T. C., Basiji D. A., Hall B. E., Lynch D. H., Ortyn W. E., Perry D. J., Seo M. J., Zimmerman C. A., Morrissey P. J., “Distinguishing modes of cell death using the ImageStream multispectral imaging flow cytometer,” Cytometry A 59A(2), 237–245 (2004). 10.1002/cyto.a.20048 [DOI] [PubMed] [Google Scholar]
- 25.Mittag A., Lenz D., Gerstner A. O. H., Sack U., Steinbrecher M., Koksch M., Raffael A., Bocsi J., Tárnok A., “Polychromatic (eight-color) slide-based cytometry for the phenotyping of leukocyte, NK, and NKT subsets,” Cytometry A 65A(2), 103–115 (2005). 10.1002/cyto.a.20140 [DOI] [PubMed] [Google Scholar]
- 26.De Rosa S. C., Herzenberg L. A., Herzenberg L. A., Roederer M., “11-color, 13-parameter flow cytometry: identification of human naive T cells by phenotype, function, and T-cell receptor diversity,” Nat. Med. 7(2), 245–248 (2001). 10.1038/84701 [DOI] [PubMed] [Google Scholar]
- 27.Baumgarth N., Roederer M., “A practical approach to multicolor flow cytometry for immunophenotyping,” J. Immunol. Methods 243(1-2), 77–97 (2000). 10.1016/S0022-1759(00)00229-5 [DOI] [PubMed] [Google Scholar]
- 28.De Rosa S. C., Brenchley J. M., Roederer M., “Beyond six colors: a new era in flow cytometry,” Nat. Med. 9(1), 112–117 (2003). 10.1038/nm0103-112 [DOI] [PubMed] [Google Scholar]
- 29.Roederer M., De Rosa S., Gerstein R., Anderson M., Bigos M., Stovel R., Nozaki T., Parks D., Herzenberg L., Herzenberg L., “8 Color, 10-parameter flow cytometry to elucidate complex leukocyte heterogeneity,” Cytometry 29(4), 328–339 (1997). [DOI] [PubMed] [Google Scholar]
- 30.Stewart C. C., Stewart S. J., “Four color compensation,” Cytometry 38(4), 161–175 (1999). [DOI] [PubMed] [Google Scholar]
- 31.Bagwell C. B., Adams E. G., “Fluorescence Spectral Overlap Compensation for Any Number of Flow Cytometry Parameters,” Ann. N. Y. Acad. Sci. 677(1 Clinical Flow), 167–184 (1993). 10.1111/j.1749-6632.1993.tb38775.x [DOI] [PubMed] [Google Scholar]
- 32.Bigos M., Baumgarth N., Jager G. C., Herman O. C., Nozaki T., Stovel R. T., Parks D. R., Herzenberg L. A., “Nine color eleven parameter immunophenotyping using three laser flow cytometry,” Cytometry 36(1), 36–45 (1999). [DOI] [PubMed] [Google Scholar]


