Abstract
BACKGROUND
Efatutazone (CS-7017), a novel peroxisome proliferator-activated receptor gamma (PPARγ) agonist, exerts anticancer activity in preclinical models. The authors conducted a phase 1 study to determine the recommended phase 2 dose, safety, tolerability, and pharmacokinetics of efatutazone.
METHODS
Patients with advanced solid malignancies and no curative therapeutic options were enrolled to receive a given dose of efatutazone, administered orally (PO) twice daily for 6 weeks, in a 3 + 3 intercohort dose-escalation trial. After the third patient, patients with diabetes mellitus were excluded. Efatutazone dosing continued until disease progression or unacceptable toxicity, with measurement of efatutazone pharmacokinetics and plasma adiponectin levels.
RESULTS
Thirty-one patients received efatutazone at doses ranging from 0.10 to 1.15 mg PO twice daily. Dose escalation stopped when maximal impact on PPARγ-related biomarkers had been reached before any protocol-defined maximum-tolerated dose level. On the basis of a population pharmacokinetic/pharmacodynamic analysis, the recommended phase 2 dose was 0.5 mg PO twice daily. A majority of patients experienced peripheral edema (53.3%), often requiring diuretics. Three episodes of dose-limiting toxicities, related to fluid retention, were noted in the 0.10-, 0.25-, and 1.15-mg cohorts. Of 31 treated patients, 27 were evaluable for response. A sustained partial response (PR; 690 days on therapy) was observed in a patient with myxoid liposarcoma. Ten additional patients had stable disease (SD) for ≥60 days. Exposures were approximately dose proportional, and adiponectin levels increased after 4 weeks of treatment at all dose levels. Immunohistochemistry of archived specimens demonstrated that PPARγ and retinoid X receptor expression levels were significantly greater in patients with SD for ≥60 days or PR (P = .0079), suggesting a predictive biomarker.
CONCLUSIONS
Efatutazone demonstrates acceptable tolerability with evidence of disease control in patients with advanced malignancies.
Keywords: efatutazone, CS-7017, PPARγ, phase 1, retinoid, biomarker
INTRODUCTION
Peroxisome proliferator-activated receptors (PPARs) are members of the nuclear hormone receptor family of ligand-activated transcription factors.1–4 There are 3 PPAR isoforms, α, β/δ, and γ, all of which heterodimerize with the retinoid-X receptors (RXRs) to modulate DNA transcription. The PPARs play a variety of roles in cellular metabolism and inflammation, but the profound prodifferentiation and proapoptotic effects of the PPARγ agonists led to further exploration of their potential as anticancer agents.5–7 PPARγ agonists reduce cell growth and induce differentiation in several cancer cell lines.3–11 In vivo, PPARγ agonists slow the growth of tumors in rodents, both in carcinogen-induced tumor models and in ectopically implanted cancer cell lines.4,12
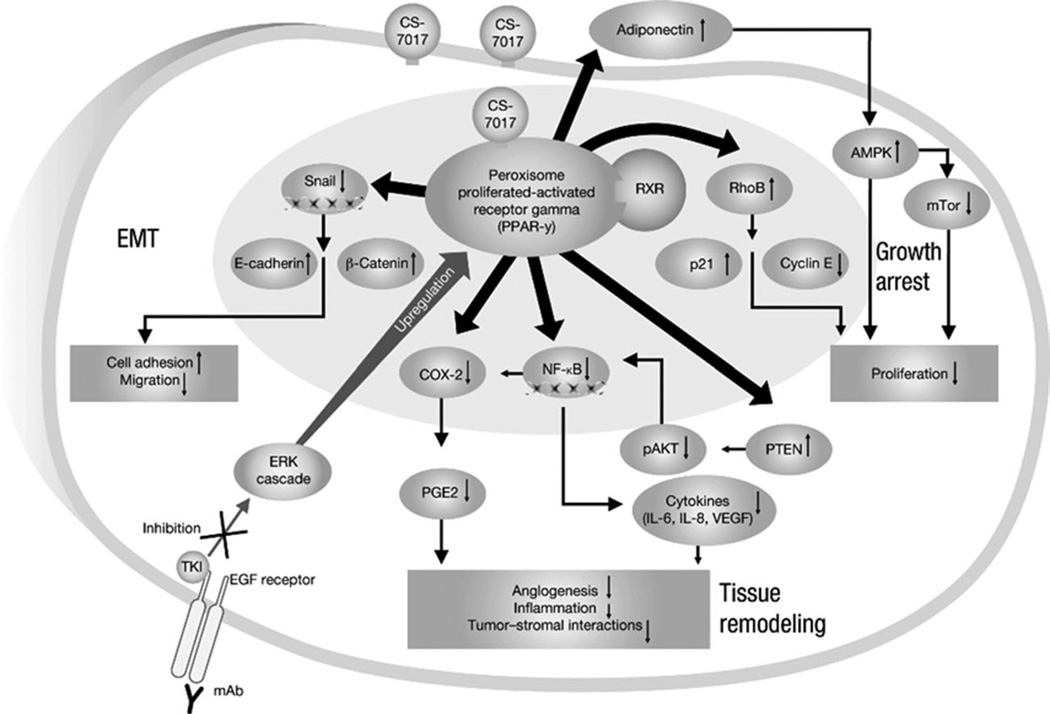
Mechanistically, PPARγ agonists inhibit tumorigenesis through several pathways (Fig. 1). They prevent cell-cycle progression via up-regulation of cell cycle inhibitors (eg, p18, p21, p27)13–19; decrease angiogenesis and inflammation via the cyclooxygenase 2 and prostaglandin E2 pathway20; induce autophagy via the adenosine mono-phosphate-activated protein kinase and mammalian target of rapamycin complex 1 pathway21; reduce production of cytokines such as interleukin (IL)-6 and IL-8 via nuclear factor kappa B22; disrupt tumor-stromal interactions required for metastasis through phosphatase and tensin homologue (PTEN) and phosphorylated protein kinase B (pAKT)20,22; prevent cell migration by suppressing Snail and upregulating E-cadherin22; and inhibit cell growth through inhibition or down-regulation of the mitogen-activated protein extracellular regulated kinase/extracellular signal-regulated kinase (ERK) cascade.23
Figure 1.
Multiple antitumor mechanisms of peroxisome proliferator-activated receptor gamma (PPARγ) agonists are shown. AMPK, adenosine monophosphate-activated protein kinase; COX-2, cyclooxygenase 2; EGF, epidermal growth factor; EMT, epithelial-mesenchymal transition; ERK, extracellular signal-regulated kinase; IL, interleukin; NF-κB, nuclear factor kappa B; PGE2, prostaglandin E2; PTEN, phosphatase and tensin homologue; RXR, retinoid-X receptor; TKI, tyrosine kinase inhibitor; VEGF, vascular endothelial growth factor; mAb, monoclonal antibody; mTor, mammalian target of rapamycin; pAKT, phospho-protein kinase B.
Endogenous PPAR ligands include fatty acids and eicosanoids,3 but their normal biological function is not well defined. Several synthetic ligands,2–4 including the thiazolidinediones (eg, rosiglitazone, pioglitazone), are potent PPARγ agonists. Rosiglitazone (Avandia, GSK) and pioglitazone (Actos, Takeda) are US Food and Drug Administration-approved treatments, used extensively by patients with diabetes because of their effects of enhancing glucose metabolism; however, clinical data on the use of the PPARγ agonists as anticancer agents are limited. In a small percentage of prostate cancer patients, rosiglitazone either decreased or prolonged the stabilization of prostate-specific antigen levels.24 Patients with recurrent metastatic liposarcoma treated with pioglitazone had prolonged disease stabilization.25 In a large epidemiologic study of 87,678 patient records, a statistically significant 33% reduction in lung cancer risk among thiazolidinedione users versus nonusers was observed.26
Efatutazone (CS-7017) is a novel third-generation thiazolidinedione that selectively activates PPARγ-mediated transcription with little effect on other PPAR subtypes. Efatutazone is at least 50 × more potent than rosiglitazone and 500 × more potent than troglitazone at PPAR response element activation and inhibition of cancer cell growth.27 Efatutazone inhibits proliferation of human pancreatic and anaplastic thyroid tumor-cell cultures, as well as growth of human colorectal tumor xeno-grafts in nude rodents.28 The antitumor activity of efatutazone in vivo may be enhanced in combination with cytotoxic agents including gemcitabine, paclitaxel, and irinotecan.27 A phase 1 study evaluating pharmacokinetics and safety of single-dose efatutazone concluded that doses of 0.04 mg and 0.08 mg were well tolerated (data on file, Daiichi Sankyo Pharmaceutical Development). On the basis of these data, we have conducted a phase 1 dose-escalation study of oral efatutazone administered by continuous twice-daily dosing. The objectives were to determine the recommended phase 2 dose for efatutazone, the safety profile, preliminary antitumor effects, and pharmacokinetics, and to explore potential predictive biomarkers of efatutazone activity and clinical benefit.
MATERIALS AND METHODS
Patients
Eligible patients had histologic or cytologic evidence of metastatic or advanced solid malignancy that had either progressed on standard therapies and/or for which no curative therapy exists. Patients were aged ≥ 18 years, had an Eastern Cooperative Oncology Group performance status score of ≤2, and had adequate organ and bone marrow function (hemoglobin ≥9.0 g/dL, absolute neutrophil count ≥1.5 × 10⁹/L, platelet count ≥100 × 109 /L, serum creatinine level <1.5 mg/dL, total bilirubin level ≤1.5 × upper limit of normal [ULN], and alanine aminotransferase (ALT), aspartate aminotransferase (AST), and alkaline phosphatase (AP) levels within normal limits of patients with no liver metastases and ≤1.5 × ULN in patients with liver metastases). Patients were excluded if they had any of the following: pre-existing fluid retention (defined as clinically significant pleural or pericardial effusions, as determined by the investigators); prior treatment with efatutazone or other thiazolidinediones; chemotherapy, hormonal therapy, radiotherapy, any investigational agent, or minor surgery within 4 weeks before study entry; or mitomycin C, immunotherapy, biological therapy, or major surgery within 6 weeks before study entry. In the final protocol, amended after the third patient was enrolled, patients with diabetes mellitus were also excluded. The study protocol, amendments, informed consent/assent form(s), and information sheets were approved by the appropriate and applicable independent ethics committees or institutional review boards. Investigators obtained informed consent from each participant or their guardian.
Study Design and Treatment Schedule
This was a 2-center, phase 1, open label, dose-escalation study of oral efatutazone administered twice daily for 21 days per cycle. Patients were treated in cohorts of 3 to 6 at dose levels of 0.10, 0.15, 0.25, 0.35, 0.50, 0.75, and 1.15 mg twice daily. Initial dosing was based on animal toxicology studies and set to target an area under the curve (AUC) of 1% of the lethal AUC in monkeys (data on file, Daiichi-Sankyo Pharmaceutical Development). Safety assessments were performed weekly, and dose escalation was continued until determination of the maximum tolerated dose (MTD; defined as 1 dose level below the dose that induced a drug-related dose-limiting toxicity [DLT] during the first 3 weeks of therapy in ≥2 of 6 patients) or until the recommended phase 2 dose was established by the investigators. DLTs were defined by the National Cancer Institute Common Terminology Criteria for Adverse Events (CTCAE) version 3.0 as follows: grade ≥3 pleural effusion or pericardial effusion; grade ≥3 peripheral edema or ascites that is unresponsive to therapy; other grade 3 or 4 nonhematologic toxicities except alopecia, fatigue, anorexia, nausea, or fever without neutropenia; failure to recover to baseline toxicity (except alopecia) after delaying the next dose by >2 weeks; 3 × ULN for AST/ALT in combination with a total bilirubin ≥2 × ULN; grade 3 or 4 neutropenia complicated by fever ≥38.5°C or infection, or grade 4 neutropenia of ≥7 days duration; and grade 4 thrombocytopenia, or grade 3 thrombocytopenia complicated by hemorrhage. Tumor response was assessed radiographically every 2 cycles using Response Evaluation Criteria in Solid Tumors (RECIST) version 1.0. Electrocardiograms were performed at screening and after each cycle per protocol, and echocardiograms were performed at baseline, at the end of cycle 1 (week 3), and at the end of cycle 2 (study week 6), then every 6 weeks, to assess for any evidence of cardiac dysfunction. Study treatment was continued without interruption in the absence of unacceptable toxicity or progressive disease (PD).
Pharmacokinetic and Activity Biomarker Analysis
Blood samples for pharmacokinetics were obtained at baseline and 0.5, 1, 2, 3, 4, 6, and 8 to 10 hours after the first dose on day 1 of cycles 1 and 2. A validated liquid chromatography-tandem mass spectrometry method was used to measure efatutazone (R-150033) plasma concentrations. Pharmacokinetic parameters included AUC, maximum observed plasma drug concentration (Cmax), and time of maximum plasma drug concentration. Phar-macokinetic variables were computed using WinNonlin Professional or other appropriate software.
Adiponectin is a marker of PPARγ activation. Blood samples for adiponectin measurement were obtained at baseline (before cycle 1) and every 3 weeks thereafter. Adiponectin levels were measured using a solid phase quantitative sandwich enzyme immunoassay kit (Quantikine; R&D Systems, Minneapolis, Minn).
Immunohistochemical Analysis
Freshly cut slides were used to perform immunohistochemical analysis of several key proteins, including PPARc, RXR, ERK1, ERK2, phospho-ERK, AKT, phospho-AKT, survivin, and PTEN using validated assays. The immunohistochemical staining was performed and validated for detecting PPARγ or RXRγ protein expression at a central laboratory (Esoterix, Austin, Tex). The PPARγ or RXRγ assays were developed using a PPARγ-specific mouse monoclonal antibody (Santa Cruz Biotechnology, Santa Cruz, Calif) or an RXRγ-specific rabbit antibody (Spring Bioscience, Pleasanton, Calif) on the Ventana Benchmark XT automated staining platform, using the ultraVIEW Universal DAB detection system (Vantana Medical Systems, Inc.). The verification of staining performance was confirmed on a series of cancer tissue samples. In addition, a series of normal, nontumor tissues were evaluated to establish immunoreactivity and assay specificity. Intra-assay and interassay performance were also evaluated as components of the validation procedure. Staining for each biomarker was described as strong (3+), moderate (2+), weak (1+), or absent (0), and the percentage of positively stained tumor cells was also reported. Patients were grouped into those showing clinical benefit (those with stable disease [SD] for ≥60 days or a partial response [PR]) versus those showing no clinical benefit (those with PD or SD for <60 days).
RESULTS
Patient Characteristics
A total of 32 patients were enrolled in the study, 31 patients were treated, and 27 were evaluable for response; 1 patient withdrew before starting therapy. Baseline characteristics are summarized in Table 1. Colorectal carcinoma was the most common tumor type among patients (n = 12). Most patients (84%) had received prior cancer therapy, with an average of 5.2 lines of prior therapy (range, 0–15). Thirty patients received prior surgery, and 16 received prior radiation.
Table 1.
Demographics and Baseline Characteristics (Safety Population), N = 31
| Characteristic | Value |
|---|---|
| Gender, No. (%) | |
| Male | 22 (71.0) |
| Female | 9 (29.0) |
| Race, No. (%) | |
| Asian | 3 (9.7) |
| African American | 2 (6.5) |
| Hispanic | 2 (6.5) |
| White | 24 (77.4) |
| Age, y | |
| Mean | 58.1 |
| Range | 40–72 |
| ECOG performance status score, No. (%) | |
| 0 | 13 (41.9) |
| 1 | 16 (51.6) |
| 2 | 2 (6.5) |
| Tumor type, No. (%) | |
| Colorectal | 12 (38.7) |
| Liposarcoma | 5 (16.1) |
| Leiomyosarcoma | 2 (6.5) |
| Other | 12 (38.7) |
Abbreviation: ECOG, Eastern Cooperative Oncology Group.
Safety
All 31 treated patients were evaluable for safety analysis. Dosing with efatutazone was overall tolerable, with fluid retention as a common adverse event (AE), manageable by diuretics. All treated patients experienced at least 1 AE, regardless of attribution. Table 2 summarizes efatutazone-related treatment-emergent AEs (TEAEs) observed in ≥5% of patients. Overall, 31 patients (100%) experienced at least 1 treatment-related AE, the most common being peripheral edema (51.6%), weight increase (54.8%), anemia (38.7%), and fatigue (45.2%). No patient experienced grade ≥4 edema. Three DLTs related to fluid retention were observed, but were not dose dependent.
Table 2.
TEAEs Experienced by ≥5% of Patients and Reported as Possibly, Probably, or Definitely Related to Efatutazone Treatment (N = 31)
| System Organ Class | NCI-CTCAE Grade, No. (%) | Overall, No. (%) | |||
|---|---|---|---|---|---|
| Grade 1 | Grade 2 | Grade 3 | Grade 4 | ||
| At least 1 related TEAE | 13 (41.9) | 11 (35.5) | 6 (19.4) | 1 (3.2)a | 31 (100) |
| Blood and lymphatic disorders | |||||
| Anemia | 5 (16.1) | 3 (9.7) | 4 (12.9) | 0 | 12 (38.7) |
|
General disorders and administration site conditions |
|||||
| Chest discomfort | 1 (3.2) | 0 | 1 (3.2) | 0 | 2 (6.5) |
| Edema | 1 (3.2) | 0 | 2 (6.5)b | 0 | 3 (9.7) |
| Face edema | 2 (6.5) | 0 | 0 | 0 | 2 (6.5) |
| Fatigue | 10 (32.3) | 2 (6.5) | 2 (6.5) | 0 | 14 (45.2) |
| Peripheral edema | 8 (25.8) | 7 (22.6) | 1 (3.2) | 0 | 16 (51.6) |
| Constitutional signs and symptoms | 0 | ||||
| Weight increase | 17 (54.8) | 0 | 0 | 0 | 17 (54.8) |
| Gastrointestinal disorders | |||||
| Abdominal distension | 1 (3.2) | 1 (3.2) | 0 | 0 | 2 (6.5) |
| Constipation | 2 (6.5) | 0 | 0 | 0 | 2 (6.5) |
| Dyspepsia | 2 (6.5) | 0 | 0 | 0 | 2 (6.5) |
| Nausea | 5 (16.1) | 1 (3.2) | 0 | 0 | 6 (19.4) |
| Vomiting | 2 (6.5) | 1 (3.2) | 0 | 0 | 3 (9.7) |
| Metabolism and nutrition disorders | |||||
| Anorexia | 3 (9.7) | 0 | 0 | 0 | 3 (9.7) |
| Fluid retention | 2 (6.5) | 1 (3.2) | 0 | 0 | 3 (9.7) |
| Increased appetite | 3 (9.7) | 0 | 0 | 0 | 3 (9.7) |
|
Musculoskeletal and connective tissue disorders |
|||||
| Muscle spasms | 1 (3.2) | 1 (3.2) | 0 | 0 | 2 (6.5) |
| Myalgia | 2 (6.5) | 0 | 0 | 0 | 2 (6.5) |
|
Respiratory, thoracic, and mediastinal disorders |
|||||
| Cough | 3 (9.7) | 1 (3.2) | 0 | 0 | 4 (12.9) |
| Dyspnea | 4 (12.9) | 0 | 1 (3.2) | 0 | 5 (16.1) |
| Pleural effusion | 1 (3.2) | 1 (3.2) | 1 (3.2)b | 0 | 3 (9.7) |
| Psychiatric disorders | |||||
| Insomnia | 1 (3.2) | 1 (3.2) | 0 | 0 | 2 (6.5) |
| Skin and subcutaneous disorders | |||||
| Rash | 2 (6.5) | 0 | 0 | 0 | 2 (6.5) |
Abbreviations: NCI-CTCAE, National Cancer Institute Common Terminology Criteria for Adverse Events; TEAE, TEAE, treatment-emergent adverse event. Multiple occurrences of a specific adverse event for a patient were counted once at the highest grade.
This patient experienced hypercholesterolemia and hypertriglyceridemia probably related to efatutazone.
Signifies a dose-limiting toxicity.
One patient in the 0.10-mg cohort, with a history of pleural effusion, edema, congestive heart failure, and current insulin-dependent diabetes mellitus experienced increased pleural effusion and dyspnea requiring treatment suspension. The effusion resolved upon withholding efatutazone dosing, but recurred with resumed efatutazone dosing despite a dose reduction. On the basis of the increased risk of clinically significant fluid retention for patients on thiazolidinediones with concurrent insulin therapy, the protocol was amended after the DLT in Patient 3 to exclude patients with diabetes mellitus. One patient each in the 0.25- and 1.15-mg cohorts also experienced grade 3 edema requiring treatment to be discontinued. Serial electrocardiograms and echocardiograms did not reveal any evidence of cardiac dysfunction. Approximately 16 months after the first patient enrollment, study sites were requested to immediately administer diuretics if a patient experienced a ≥2-kg weight increase from baseline. Treatment included 20 mg/d of furosemide and 25mg/d of spironolactone. Dosages were doubled for each 2-kg weight gain from baseline, up to maximum dosages of 80 mg/d for furosemide and 100 mg/d for spironolactone.
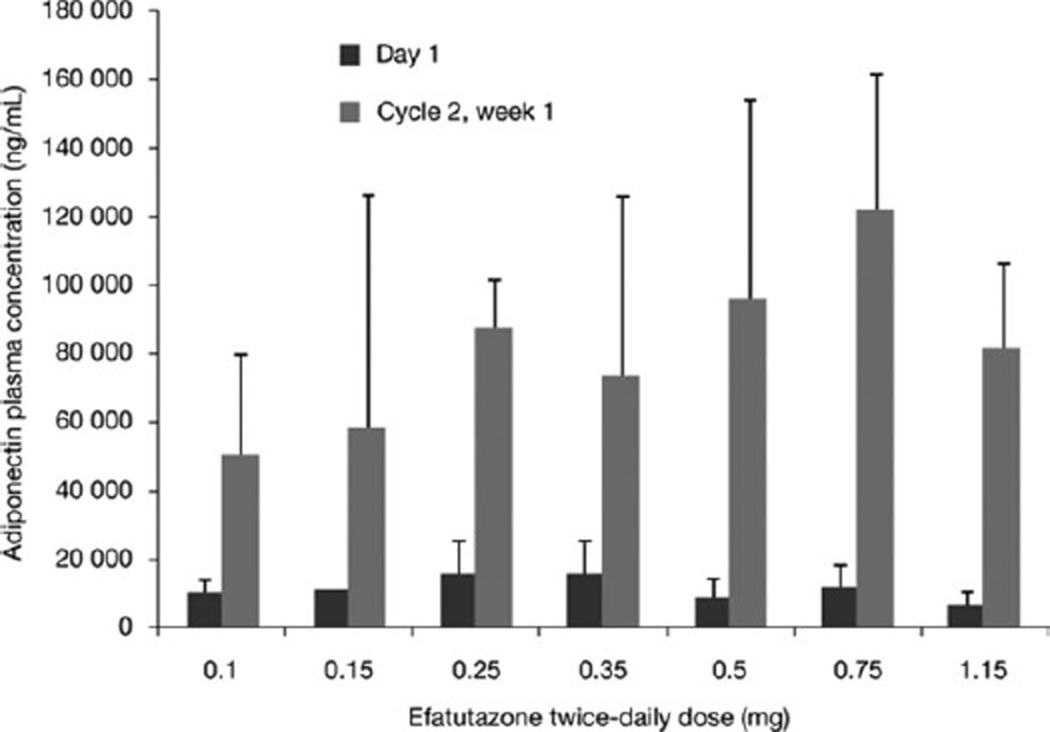
Two patients experienced grade 4 TEAEs; 1 patient experienced bronchospasm not likely to be related to efatutazone, and 1 patient experienced hypercholesterolemia and hypertriglyceridemia probably related to efatutazone. There was no apparent relation between treatment dose level and grade 3 or 4 TEAE (no grade 5 events) incidence, and the MTD was not reached. Dose escalation was stopped at 1.15 mg of efatutazone because data indicated no additional dose-related effect on serum adiponectin levels, a sensitive biomarker of PPARγ activity (Fig. 2). Thus, the recommended phase 2 oral dose was determined to be 0.5 mg twice daily, the dose at which biomarker activity (ie, plasma adiponectin levels) plateaued.
Figure 2.
Adiponectin plasma levels are shown.
Pharmacokinetics
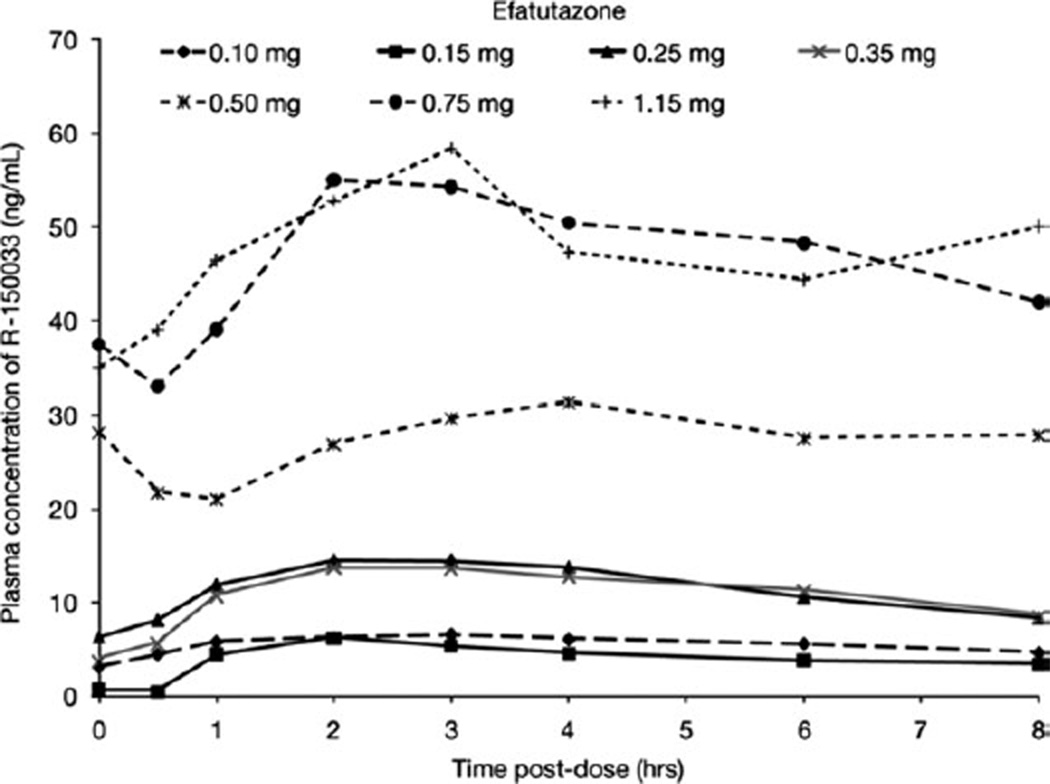
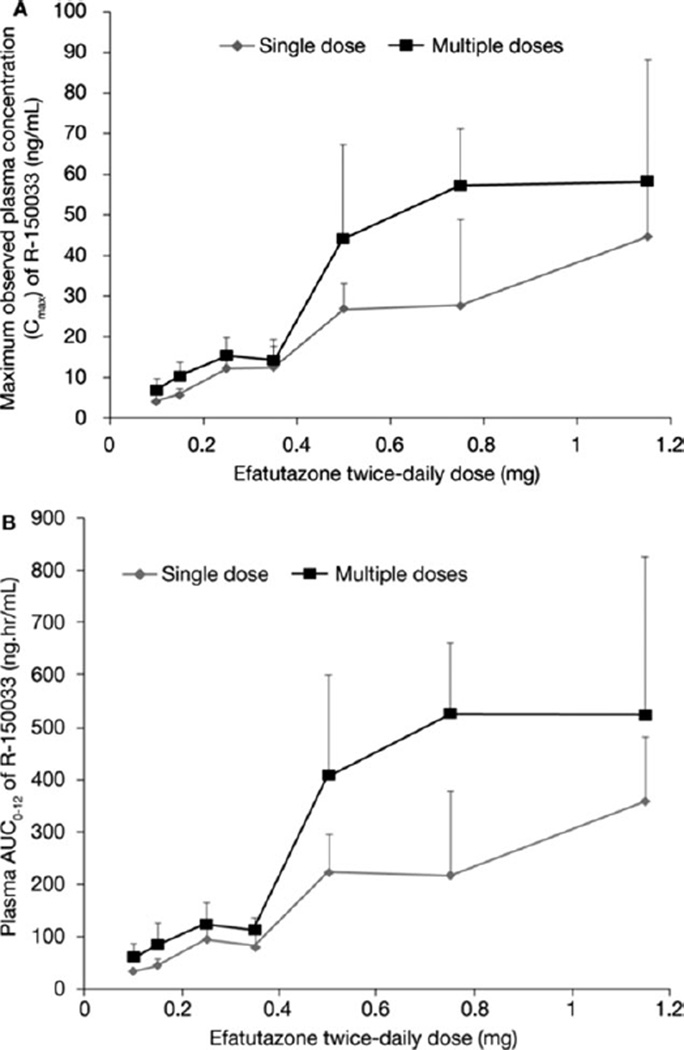
After oral administration of efatutazone, the drug is converted to the active metabolite R-150033. In plasma, the peak concentrations of R-150033 were observed at 2 to 3 hours postdose (Fig. 3). The mean apparent half-life ranged from 5.7 to 14 hours and appeared to be similar across all dose levels. After single and multiple doses of efatutazone, the increase in exposure (AUC and Cmax) of R-150033 appears to be dose proportional over the investigated dose range of 0.10 to 1.15 mg twice daily (Fig. 4 and Table 3). On the basis of trough plasma concentrations, efatutazone twice daily appeared to reach steady-state levels by week 1 of cycle 2. Accumulation with multiple dosing to steady-state was approximately 140% to 180% across all doses, which is consistent with the half-life and dosing regimen.
Figure 3.
Observed plasma concentration and time profile of R-150033 on day 1, cycle 2 is shown.
Figure 4.
(A) Observed maximum plasma concentration and (B) area under the curve (AUC) of R-150033 are shown.
Table 3.
Pharmacokinetic Parameters After a Single Dose of Efatutazone, Cycle 1 and Cycle 2
| Cycle | Efatutazone Dose Level, mg | ||||||
|---|---|---|---|---|---|---|---|
| 0.10 | 0.15 | 0.25 | 0.35 | 0.50 | 0.75 | 1.15 | |
| Cycle 1 | |||||||
| AUC0-t, ng/h/mL | 23.05 ±6.108(6) | 32.05 ± 7.753 (3) | 68.33 ±24.613(6) | 59.72 ± 32.582 (3) | 159.2 ±45.10(6) | 159.14 ± 126.314(3) | 256.3 ± 93.31 (4) |
| AUC0–12, ng/h/mL | 32.96 ± 6.904 (6) | 44.14 ± 12.152 (3) | 91.24 ±36.157(6) | 80.80 ± 40.739 (3) | 220.9 ± 74.42 (6) | 214.38 ± 163.811 (3) | 356.8 ± 127.69 (4) |
| Cmax, ng/mL | 4.213 ±0.9253(6) | 5.763 ± 1.5282 (3) | 12.193 ±3.0014(6) | 12.263 ±7.0980(3) | 26.92 ± 6.358 (6) | 27.637 ±21.4373(3) | 44.73 ± 15.050 (4) |
| aTmax, h | 3.000 [2.00–6.00] (6) | 2.000 [1.00–2.00] (3) | 1.584 [1.00–4.00] (6) | 3.000 [1.00–3.00] (3) | 2.000 [1.00–4.00] (6) | 3.000 [2.00–4.00] (3) | 2.500 [2.00–4.00] (4) |
| t1/2, h | 8.509 ±3.9178(5) | 13.782 ±6.9182 (3) | 11.481 ± 11.2970 (6) | 12.486 ±7.3517(2) | 5.743 ± 2.5637 (5) | 9.078 ± 2.7871 (3) | 11.659 ± 3.4494 (4) |
| Cycle 2 | |||||||
| AUC0-t, ng/h/mL | 44.03 ± 18.820(5) | 61.19 ±27.945 (3) | 88.64 ±25.019(5) | 81.09 ±23.117(3) | 289.9 ± 140.06(3) | 363.2 ± 105.39(3) | 342.3 ± 189.48 (4) |
| AUCtau, ng/h/mL | 61.14 ±24.901 (5) | 83.35 ± 42.444 (3) | 123.75 ±40.124(5) | 114.88 ±21.714(3) | 406.5 ± 195.76(3) | 526.8 ± 133.42 (3) | 525.9 ± 300.09 (4) |
| Cmax,ss, ng/mL | 6.878 ± 2.9560 (5) | 10.173 ±3.5419(3) | 15.30 ±4.491 (5) | 14.20 ±3.601 (3) | 44.07 ± 23.343 (3) | 57.03 ± 14.451 (3) | 58.33 ±30.173(4) |
| aTmax, h | 2.000 [0.917–3.00] (5) | 2.000 [1.00–3.00] (3) | 3.000 [2.00–4.00] (5) | 2.000 [2.00–3.00] (3) | 2.000 [2.00–4.00] (3) | 2.000 [2.00–3.00] (3) | 3.000 [3.00–3.00] (4) |
| t1/2, h | 11.631 ± 4.5931 (5) | 14.047 ± 14.7104(3) | 6.344 ± 1.9370 (4) | 7.560 ± 3.4744 (3) | 5.150(1) | 9.656 ± 2.4826 (3) | 12.58 ±0.276(2) |
| bAcc | 1.808 ± 0.4098 (5) | 1.825 ± 0.4439 (3) | 1.722 ± 0.8371 (5) | 1.613 ±0.5924(3) | 1.531 ±0.1826(3) | 6.452 ± 7.8442 (3) | 1.4981 ± 0.57875 (4) |
Abbreviations: AUC, area under the concentration versus time curve; Cmax, maximum plasma concentration; max, ss, maximum plasma concentration, steady state; Tmax, time of maximum plasma concentration; t1/2, plasma half-life.
Values are mean ± standard deviation (No.) or [range].
Tmax is presented as median [range] (No.).
Acc = AUC0-tau/AUC0–12.
Activity Biomarker Analyses
Efatutazone administration increased plasma adiponectin levels 6- to 14-fold at all dose levels of 0.10 to 1.15 mg twice daily (Fig. 2). Although the increase in adiponectin appeared to be dose dependent, because of the small sample size (3–6 patients) and high interpatient variability, a definitive conclusion is not possible, and statistical analysis revealed no significant dose-dependent effect on the efatutazone-mediated increase in plasma adiponectin levels.
Clinical Antitumor Activity
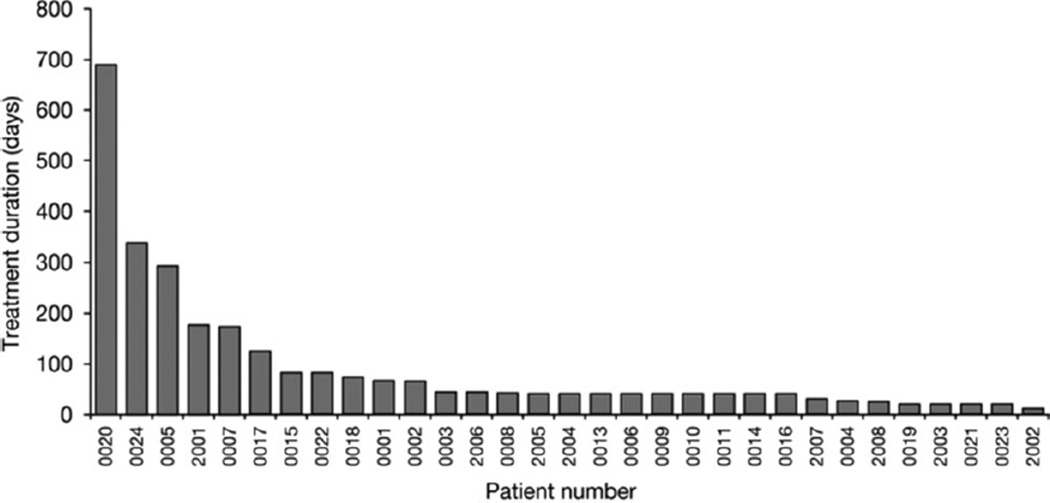
Of 31 treated patients, 27 were evaluable for response. One patient (#20) with metastatic myxoid liposarcoma had a sustained PR and received efatutazone on study for 690 days. Ten patients (37%) had SD lasting for ≥60 days (Fig. 5 and Table 4). The median treatment duration for patients with SD or PR was 126 days (range, 66–690 days). There was no relation between duration of SD and dose level (Table 5). The median overall survival and time to disease progression were 283 days and 51 days, respectively.
Figure 5.
Treatment duration is shown for all patients.
Table 4.
Treatment Duration of Patients With Stable Disease and Partial Response
| Patient No. | Tumor Type | Efatutazone Dose Level, mg |
Treatment Duration, d |
|---|---|---|---|
| 0001 | Thymoma | 0.10 | 67 |
| 0002 | Carcinoma of unknown origin | 0.10 | 66 |
| 0005 | Cancer of the peritoneum | 0.10 | 294 |
| 0007 | Colorectal carcinoma | 0.15 | 173 |
| 2001 | Leiomyosarcoma | 0.15 | 178 |
| 0015 | Carcinoma of unknown origin | 0.35 | 84 |
| 0017 | Colorectal carcinoma | 0.50 | 126 |
| 0018 | Colorectal carcinoma | 0.50 | 74 |
| 0024 | Carcinoma of unknown origin | 0.50 | 336 |
| 0020 | Myxoid liposarcoma | 0.75 | 690 (partial response) |
| 0022 | Cancer of the appendix | 1.15 | 84 |
Table 5.
Summary of Treatment Duration in Patients With Stable Disease and Partial Response by Cohort
| Duration | Efatutazone Dose Level, mg | |||||||
|---|---|---|---|---|---|---|---|---|
| 0.10 (n = 6) |
0.15 (n = 3) |
0.25 (n = 4) |
0.35 (n = 3) |
0.50 (n = 6) |
0.75 (n = 3) |
1.15 (n = 3) |
Overall (N = 27) |
|
| No. | 3 | 2 | 0 | 1 | 3 | 1 | 1 | 11 |
| Median, d | 67.0 | 176.0 | — | 84.0 | 126.0 | 690.0 | 84.0 | 126.0 |
| Minimum, d | 66 | 173 | — | 84 | 74 | 690 | 84 | 66 |
| Maximum, d | 294 | 178 | — | 84 | 336 | 690 | 84 | 690 |
This table only includes patients whose best overall response was stable disease. Number, minimum, and maximum are calculated based on observed durations only. Total number and median are calculated based on both observed and censored durations.
Patient 20 is a 44-year-old man with metastatic myxoid liposarcoma with a confirmed rearrangement of the DDIT3 gene at chromosome 12ql3 (Mayo Medical Laboratories, Rochester, Minn) who was initially diagnosed in July 2006, and had 2 prior major resections and stereotactic radiosurgery at 3 sites of recurrence. He was started on oral efatutazone at 0.75 mg twice daily in April 2008, and exhibited a RECIST-defined PR to therapy by July 2008, with further decrease in tumor volume and a nadir reduction in tumor size of approximately 49% in June 2009. A positron emission tomography/computed tomography scan performed in November 2008 revealed no fluorodeoxyglucose uptake in the remaining tumors. Interestingly, this patient, who had no prior history of hypercholesterolemia/triglyceridemia, by cycle 3, day 1 had a dramatic increase (to CTCAE grade 4) in serum cholesterol (peak 515 mg/dL) and triglycerides (peak 4525 mg/dL). His dose of efatutazone was held, and his hypercholesterolemia/triglyceridemia recovered to baseline. However, upon restarting therapy and later despite dose reduction to 0.5 mg twice daily, he had a renewed increase to grade 3 requiring the addition of pravastatin (ultimately up to 80 mg daily). He was finally able to tolerate a dose of efatutazone of 0.5 mg daily by cycle 7, and remained on study (with a continued decrease in tumor volume despite dose reduction) for 690 days. Of note, no other patient in this trial had an increase in serum cholesterol or triglycerides. The patient subsequently underwent surgical resection of his 4 residual tumors; 3 demonstrated no evidence of viable disease, whereas the fourth demonstrated persistent myxoid liposarcoma. The patient remains alive and without any evidence of disease recurrence as of June 2011.
Pretreatment Immunohistochemical Analysis
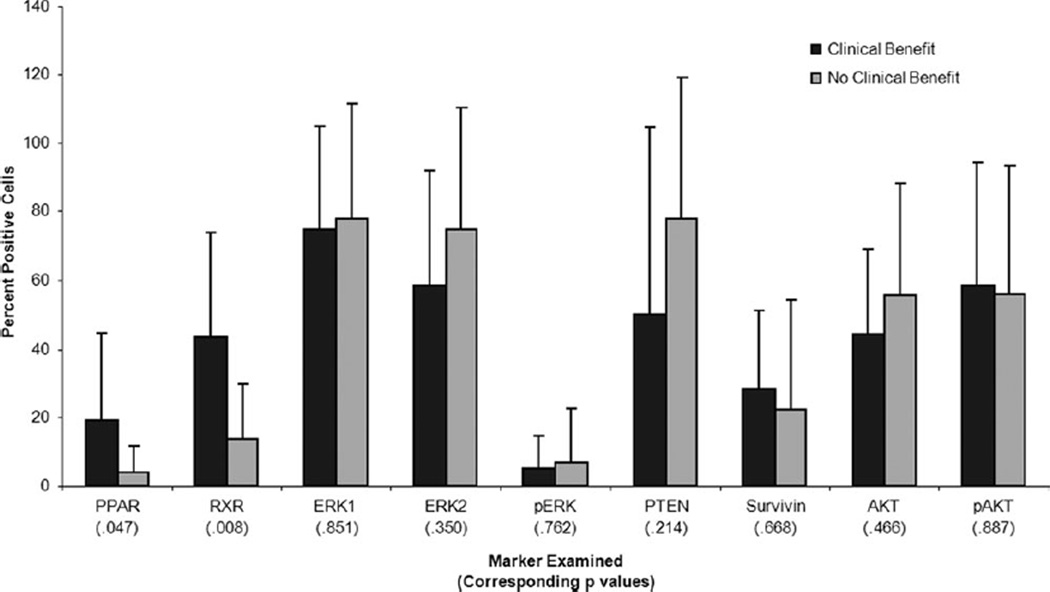
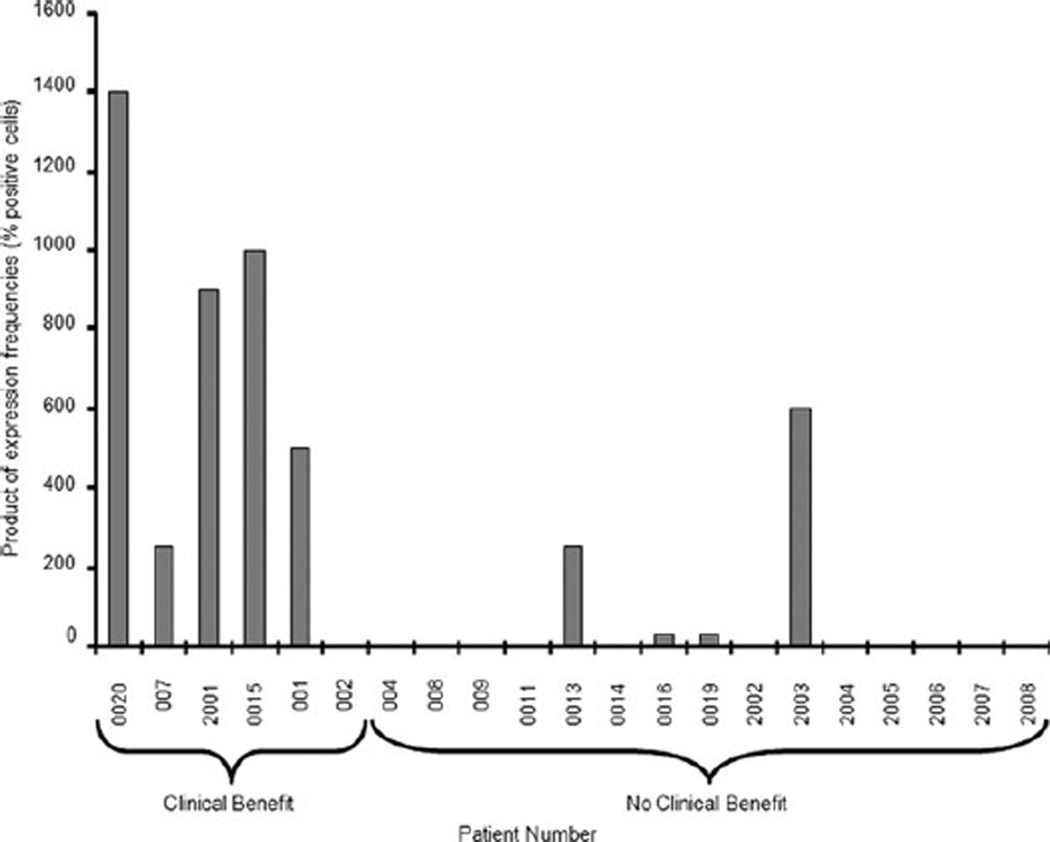
Archived tumor tissue was available for 21 of the 31 study patients. Freshly cut slides were used to perform immunohistochemical analysis of several key proteins (Fig. 6). Recognizing that the formation of a bimolecular complex of PPARγ and RXR requires both analytes to be present in the same cell, we compared the product of the expression frequencies (determined as the percentage positive cells) of PPARγ and RXR in tumor specimens (an indirect approximation to the percentage of cells actually expressing both receptors) in those who received clinical benefit versus those who did not (Fig. 7). When comparing samples demonstrating increased expression frequencies of both PPARγ and RXR, the difference in outcome was highly statistically significant (nonparametric 1-sided version of O’Brien test, P = .0079).
Figure 6.
Tumor marker expression levels are shown. Percentage of positive cells in archival or pretherapy biopsy specimens of study patients are determined by immunohistochemical analysis. For each marker, patients who benefited from therapy (stable disease for >60 days or partial response) are compared with those who did not. These analyses are intended to be exploratory and hypothesis-generating only, and the P values are not adjusted for multiple statistical comparisons. AKT, protein kinase B; ERK, extracellular signal-regulated kinase; PPAR, peroxisome proliferator-activated receptor; PTEN, phosphatase and tensin homologue; RXR, retinoid-X receptor; p, phosphorylated.
Figure 7.
Estimated product of peroxisome proliferator-activated receptor gamma and retinoid X receptor expression frequencies is based on product of percentage positive cells.
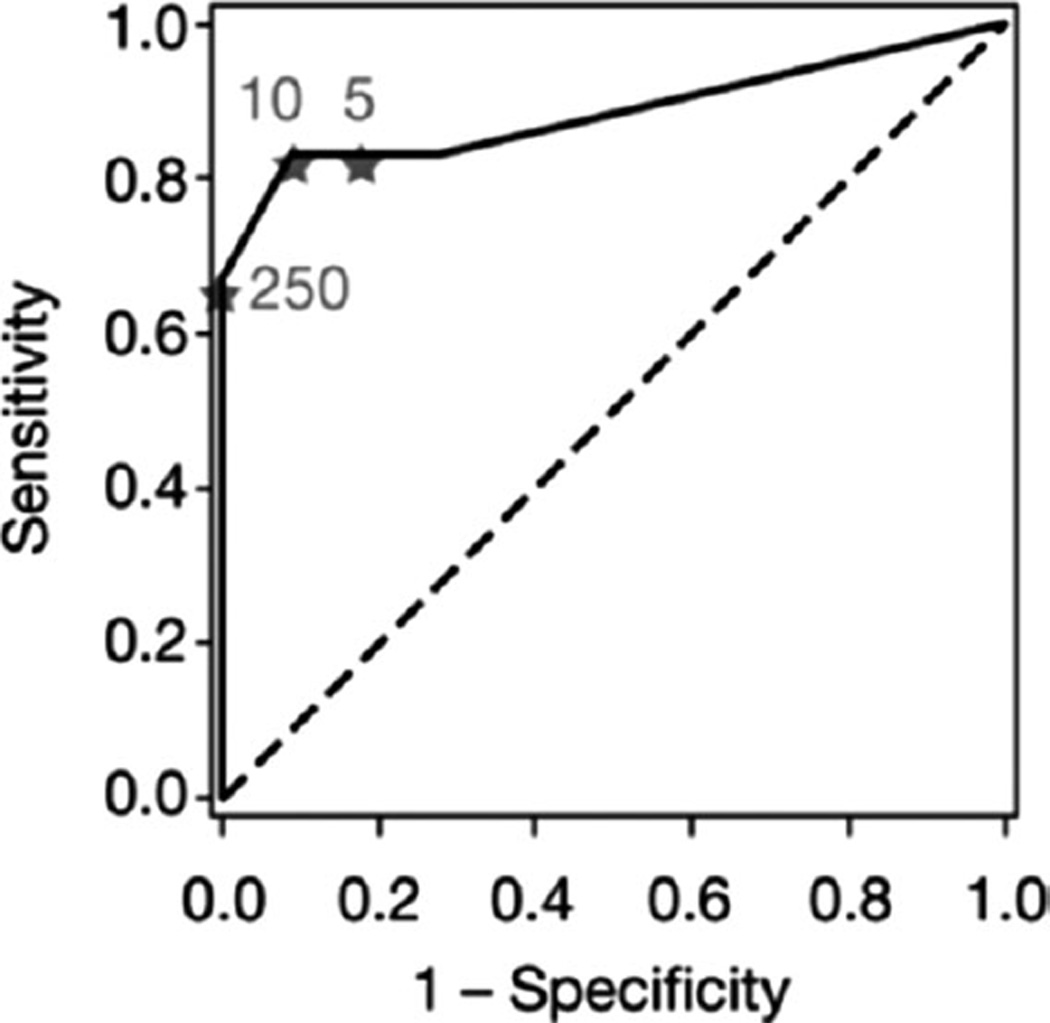
Finally, to provide a preliminary indication of the performance characteristics that such a comparison might have, we performed a receiver operating characteristic (ROC) analysis of sensitivity versus specificity of the comparison, as a function of the cutoff value between predicted clinical benefit and lack of clinical benefit. On the basis of limited data, the optimal cutoff (closest distance to the point of 100% sensitivity and 100% specificity) is 10, corresponding to a sensitivity of 0.83 and a specificity of 0.91. The area under the ROC curve was 0.89, indicating a statistically significant difference from the null line (P = .0003; Fig. 8).
Figure 8.
Receiver operating curve analysis presents sensitivity and specificity of a classifier based on the product of percentage positive cells for peroxisome proliferator-activated receptor gamma and retinoid X receptor, as a function of the cutoff between clinical benefit and no clinical benefit. Marked points correspond to cutoff values of 5, 10, and 250.
DISCUSSION
For years, preclinical evidence has suggested that PPARγ agonists may have activity as anticancer agents. In preclinical models and in vitro, thiazolidinedione and nonthiazo-lidinedione PPARγ agonists have demonstrated significant anticancer activity.3–12 The activation of PPARγ results in cell-cycle arrest, inhibition of angiogenesis, induction of apoptosis, and, in some cases, cellular redifferentiation. These effects are typically induced by direct modulation of gene transcription through activation of peroxisome proliferator response elements in the promoter regions of several key genes. PPARγ-activation results in cell-cycle arrest through direct transcriptional down-regulation of cyclin D1 expression and up-regulation of the cell cycle inhibitors p18, p21, and p27.13–19 Also, nontranscriptional mechanisms for the activity of PPARγ exist, including the proteosomal degradation of β-catenin.29 Despite these pleiotropic effects, as in the case with other nuclear hormone receptor agonists such as the vitamin D analogs and the retinoids, the promise of the PPARγ agonists as effective anticancer agents in humans has yet to be realized. Several clinical trials have failed to demonstrate any substantial anticancer benefit with thiazolidinediones,24,30 although a large retrospective study suggests benefit with the thiazolidinediones as chemopreventative agents.26 In this context, efatutazone may have greater anticancer activity than previously studied thiazolidinediones, perhaps as a result of increased potency and specificity as a PPARγ agonist.
This study demonstrates that efatutazone can be administered safely in doses at which PPARγ-responsive gene expression is induced. Efatutazone was tolerated and no measurable cardiotoxicity was recorded. Fluid retention, an expected thiazolidinediones class effect, was a common side effect but was manageable with diuretics. A protocol for controlling fluid retention, including the addition of the diuretics furosemide and spironolactone, was added after it was noted that several patients experienced rapid weight gain. Anemia was another common side effect, typically associated with the thiazolidinedione class of drugs. Traditionally this class effect was believed to be a result of the increased intravascular volume causing a relative hemodilution. However, this prevailing view has been questioned,31 and no definitive mechanism has yet been established.
An effect of efatutazone on the PPARγ-regulated gene product adiponectin was observed. Adiponectin gene activation occurred even at lower dose levels of efatutazone, with maximal activation occurring in the range of 0.35 to 1.15 mg twice daily. A population-based pharmacokinetic/adiponectin modeling analysis, using data from every patient, established a dose-response relation, and identified an optimal dose corresponding to a predicted >90% increase in adiponectin expression levels relative to pretreatment. On the basis of these results, oral efatutazone 0.5 mg twice daily was chosen as the recommended phase 2 dose.
Efatutazone also showed signs of possible antitumor activity. In particular, 1 patient with metastatic myxoid liposarcoma had a sustained PR. Myxoid liposarcomas are characterized by the chromosomal translocation t(12;16)(q13;p11), which produces the chimeric FUS-DDIT3 oncogene.32 Expression of this fusion oncoprotein results in a block of adipocyte differentiation that can be overcome by increasing expression of PPARγ, resulting in terminal differentiation. We speculate that efatutazone, as a highly potent PPARγ agonist, was able to activate even the very low levels of PPARγ expressed in this patient’s myxoid liposarcoma sufficiently to induce terminal differentiation of the tumor cells. Furthermore, it is unlikely that there was any combined anticancer efficacy with pravastatin, because the patient had a PR before starting pravastatin.
In addition to 1 sustained PR, demonstration of prolonged SD occurred in 10 patients (37%). Importantly, disease stabilization was observed in the diverse tumor histologies accrued to this phase 1 trial, suggesting a benefit of PPARγ agonism across tumor types. PPARγ and RXR expression frequencies may predict clinical benefit for efatutazone treatment. The product of the percentage of cells that express PPARγ and RXR may be the best classifier, but classifiers that include expression levels and/ or direct measures of coexpression should also be evaluated. These data, although preliminary, fit with the proposed mechanism of action of PPARγ agonists. Subsequent validation of PPARγ and RXR expression frequency as a predictive marker is warranted in large trials.
Finally, preclinical data with PPARγ agonists as single agents most often demonstrate disease stabilization, which was also primarily observed in this phase 1 study. Significant tumor regression is typically seen in combination with other anticancer agents, including traditional cytotoxic and newer molecularly targeted therapies. For this reason, several disease-specific trials of efatutazone in combination with other agents have been initiated.
Acknowledgments
We thank Slawomir Wojtowicz-Praga, Maryland, from Oncology Clinical Research and Development, Roger Luo, PhD from Translational Medicine and Clinical Pharmacology, and Reinhard von Roemeling, Maryland, from Oncology Clinical Research and Development, all from Daiichi Sankyo Pharmaceutical Development, for their major contributions to study design and execution, biomarker development, and study leadership, respectively, at the beginning of the study; NanXiang Ge, PhD from Biostatistics, Daiichi Sankyo Pharmaceutical Development, for providing helpful counsel on statistical methods; and Rosalie Gadiot, PhD and Remon van den Broek, PhD from Excerpta Medica for editorial support.
FUNDING SOURCES
This study and editorial support were sponsored by Daiichi Sankyo Pharmaceutical Development.
Footnotes
Presented in part at the 20th European Organization for Research and Treatment of Cancer-National Cancer Institute-American Association for Cancer Research symposium on Molecular Targets and Cancer Therapeutics; October 21–24, 2008; Geneva, Switzerland; and at the 46th Annual Meeting of the American Society of Clinical Oncology; June 4–8, 2010; Chicago, IL.
CONFLICT OF INTEREST DISCLOSURES
M.J.P. received honoraria from Daiichi Sankyo Pharmaceutical Development. J.L.M. is a member of the data and safety monitoring committee for Daiichi Sankyo Pharmaceutical Development. A.-B.H. is a stockholder in Daiichi Sankyo, Inc. and a full-time employee of Daiichi Sankyo Pharmaceutical Development. H.Z. is a full-time employee of Daiichi Sankyo Pharmaceutical Development. C.C. is a stockholder in Daiichi Sankyo, Inc. and a full-time employee of Daiichi Sankyo Pharmaceutical Development. K.L. is a stockholder in Daiichi Sankyo, Inc. and a full-time employee of Daiichi Sankyo Pharmaceutical Development. R.A.B. is a stockholder in Johnson & Johnson, Merck & Co., Inc., and Daiichi Sankyo, Inc. and a full-time employee of Daiichi Sankyo Pharmaceutical Development. G.D.D. is a consultant to Daiichi Sankyo Pharmaceutical Development, as well as Glaxo Smith Kline, Millenium/Takeda, Johnson & Johnson, PharmaMar, Merck, Ariad, ZioPharm, Novartis, Genentech/Roche, and Pfizer, with research support for this trial from Daiichi Sankyo Pharmaceutical Development to the Dana-Farber Cancer Institute, and has also served on the Scientific Advisory Board (with equity) of Kolltan Pharmaceuticals before its acquisition by Daiichi-Sankyo.
REFERENCES
- 1.Kersten S, Desvergne B, Wahli W. Roles of PPARs in health and disease. Nature. 2000;405:421–424. doi: 10.1038/35013000. [DOI] [PubMed] [Google Scholar]
- 2.Rosen ED, Spiegelman BM. PPARgamma: a nuclear regulator of metabolism, differentiation, and cell growth. J Biol Chem. 2001;276:37731–37734. doi: 10.1074/jbc.R100034200. [DOI] [PubMed] [Google Scholar]
- 3.Berger J, Moller DE. The mechanisms of action of PPARs. Annu Rev Med. 2002;53:409–435. doi: 10.1146/annurev.med.53.082901.104018. [DOI] [PubMed] [Google Scholar]
- 4.Kopelovich L, Fay JR, Glazer RI, Crowell JA. Peroxisome proliferator-activated receptor modulators as potential chemopreventive agents. Mol Cancer Ther. 2002;1:357–363. [PubMed] [Google Scholar]
- 5.Tontonoz P, Singer S, Forman BM, et al. Terminal differentiation of human liposarcoma cells induced by ligands for peroxisome proliferator-activated receptor gamma and the retinoid X receptor. Proc Natl Acad Sci U S A. 1997;94:237–241. doi: 10.1073/pnas.94.1.237. [DOI] [PMC free article] [PubMed] [Google Scholar]
- 6.Tontonoz P, Hu E, Spiegelman BM. Stimulation of adipogenesis in fibroblasts by PPAR gamma 2, a lipid-activated transcription factor. Cell. 1994;79:1147–1156. doi: 10.1016/0092-8674(94)90006-x. [DOI] [PubMed] [Google Scholar]
- 7.Demetri GD, Fletcher CD, Mueller E, et al. Induction of solid tumor differentiation by the peroxisome proliferator-activated receptor-gamma ligand troglitazone in patients with liposarcoma. Proc Natl Acad Sci U S A. 1999;96:3951–3956. doi: 10.1073/pnas.96.7.3951. [DOI] [PMC free article] [PubMed] [Google Scholar]
- 8.Brockman JA, Gupta RA, Dubois RN. Activation of PPARgamma leads to inhibition of anchorage-independent growth of human colorectal cancer cells. Gastroenterology. 1998;115:1049–1055. doi: 10.1016/s0016-5085(98)70072-1. [DOI] [PubMed] [Google Scholar]
- 9.Sarraf P, Mueller E, Jones D, et al. Differentiation and reversal of malignant changes in colon cancer through PPARgamma. Nat Med. 1998;4:1046–1052. doi: 10.1038/2030. [DOI] [PubMed] [Google Scholar]
- 10.Gupta RA, Tan J, Krause WF, et al. Prostacyclin-mediated activation of peroxisome proliferator-activated receptor delta in colorectal cancer. Proc Natl Acad Sci U S A. 2000;97:13275–13280. doi: 10.1073/pnas.97.24.13275. [DOI] [PMC free article] [PubMed] [Google Scholar]
- 11.Sato H, Ishihara S, Kawashima K, et al. Expression of peroxisome proliferator-activated receptor (PPAR)gamma in gastric cancer and inhibitory effects of PPARgamma agonists. Br J Cancer. 2000;83:1394–1400. doi: 10.1054/bjoc.2000.1457. [DOI] [PMC free article] [PubMed] [Google Scholar]
- 12.Kubota T, Koshizuka K, Williamson EA, et al. Ligand for peroxisome proliferator-activated receptor gamma (troglitazone) has potent antitumor effect against human prostate cancer both in vitro and in vivo. Cancer Res. 1998;58:3344–3352. [PubMed] [Google Scholar]
- 13.Clay CE, Atsumi GI, High KP, Chilton FH. Early de novo gene expression is required for 15-deoxy-Delta 12,14-prostaglandin J2-induced apoptosis in breast cancer cells. J Biol Chem. 2001;276:47131–47135. doi: 10.1074/jbc.C100339200. [DOI] [PubMed] [Google Scholar]
- 14.Diep QN, El Mabrouk M, Cohn JS, et al. Structure, endothelial function, cell growth, and inflammation in blood vessels of angiotensin II-infused rats: role of peroxisome proliferator-activated receptor-gamma. Circulation. 2002;105:2296–2302. doi: 10.1161/01.cir.0000016049.86468.23. [DOI] [PubMed] [Google Scholar]
- 15.Goke R, Goke A, Goke B, El-Deiry WS, Chen Y. Pioglitazone inhibits growth of carcinoid cells and promotes TRAIL-induced apoptosis by induction of p21waf1/cip1. Digestion. 2001;64:75–80. doi: 10.1159/000048843. [DOI] [PubMed] [Google Scholar]
- 16.Guan YF, Zhang YH, Breyer RM, Davis L, Breyer MD. Expression of peroxisome proliferator-activated receptor gamma (PPARgamma) in human transitional bladder cancer and its role in inducing cell death. Neoplasia. 1999;1:330–339. doi: 10.1038/sj.neo.7900050. [DOI] [PMC free article] [PubMed] [Google Scholar]
- 17.Kitamura S, Miyazaki Y, Hiraoka S, et al. PPARgamma agonists inhibit cell growth and suppress the expression of cyclin D1 and EGF-like growth factors in ras-transformed rat intestinal epithelial cells. Int J Cancer. 2001;94:335–342. doi: 10.1002/ijc.1470. [DOI] [PubMed] [Google Scholar]
- 18.Rumi MA, Sato H, Ishihara S, Ortega C, Kadowaki Y, Kinoshita Y. Growth inhibition of esophageal squamous carcinoma cells by peroxisome proliferator-activated receptor-gamma ligands. J Lab Clin Med. 2002;140:17–26. doi: 10.1067/mlc.2002.125055. [DOI] [PubMed] [Google Scholar]
- 19.Shao J, Sheng H, DuBois RN. Peroxisome proliferator-activated receptors modulate K-Ras-mediated transformation of intestinal epithelial cells. Cancer Res. 2002;62:3282–3288. [PubMed] [Google Scholar]
- 20.Bren-Mattison Y, Meyer AM, Van Putten V, et al. Antitumorigenic effects of peroxisome proliferator-activated receptor-gamma in non-small-cell lung cancer cells are mediated by suppression of cyclooxy-genase-2 via inhibition of nuclear factor-kappaB. Mol Pharmacol. 2008;73:709–717. doi: 10.1124/mol.107.042002. [DOI] [PubMed] [Google Scholar]
- 21.Fogarty S, Hardie DG. Development of protein kinase activators: AMPK as a target in metabolic disorders and cancer. Biochim Biophys Acta. 2010;1804:581–591. doi: 10.1016/j.bbapap.2009.09.012. [DOI] [PubMed] [Google Scholar]
- 22.Nemenoff RA, Weiser-Evans M, Winn RA. Activation and molecular targets of peroxisome proliferator-activated receptor-gamma ligands in lung cancer. PPAR Res. 2008;2008:156875. doi: 10.1155/2008/156875. [DOI] [PMC free article] [PubMed] [Google Scholar]
- 23.Burgermeister E, Seger R. PPARgamma and MEK interactions in cancer. PPAR Res. 2008;2008:309469. doi: 10.1155/2008/309469. [DOI] [PMC free article] [PubMed] [Google Scholar]
- 24.Mueller E, Smith M, Sarraf P, et al. Effects of ligand activation of peroxisome proliferator-activated receptor gamma in human prostate cancer. Proc Natl Acad Sci U S A. 2000;97:10990–10995. doi: 10.1073/pnas.180329197. [DOI] [PMC free article] [PubMed] [Google Scholar]
- 25.Degli Esposti R, Scopece L, Cavallo G, et al. Medical management of unresectable, recurrent retroperitoneal liposarcoma (LS) with peroxisome proliferator-activated receptor (PPAR-c) ligands [abstract] Proc Am Soc Clin Oncol. 2003;22 Abstract 3338. [Google Scholar]
- 26.Govindarajan R, Ratnasinghe L, Simmons DL, et al. Thiazolidine-diones and the risk of lung, prostate, and colon cancer in patients with diabetes. J Clin Oncol. 2007;25:1476–1481. doi: 10.1200/JCO.2006.07.2777. [DOI] [PubMed] [Google Scholar]
- 27.Copland JA, Marlow LA, Kurakata S, et al. Novel high-affinity PPARgamma agonist alone and in combination with paclitaxel inhibits human anaplastic thyroid carcinoma tumor growth via p21WAF1/CIP1. Oncogene. 2006;25:2304–2317. doi: 10.1038/sj.onc.1209267. [DOI] [PubMed] [Google Scholar]
- 28.Shimazaki N, Togashi N, Hanai M, et al. Anti-tumour activity of CS-7017, a selective peroxisome proliferator-activated receptor gamma agonist of thiazolidinedione class, in human tumour xeno-grafts and a syngeneic tumour implant model. Eur J Cancer. 2008;44:1734–1743. doi: 10.1016/j.ejca.2008.04.016. [DOI] [PubMed] [Google Scholar]
- 29.Sharma C, Pradeep A, Wong L, Rana A, Rana B. Peroxisome proliferator-activated receptor gamma activation can regulate beta-catenin levels via a proteasome-mediated and adenomatous polyposis coli-independent pathway. J Biol Chem. 2004;279:35583–35594. doi: 10.1074/jbc.M403143200. [DOI] [PubMed] [Google Scholar]
- 30.Richards DA, Oettle H, Vervenne WL, et al. Randomized double-blind phase II trial comparing gemcitabine (GEM) plus LY293111 vs. GEM plus placebo in advanced adenocarcinoma of the pancreas [abstract] J Clin Oncol. 2005;23(16s) doi: 10.1097/PPO.0b013e3181b36264. Abstract 4092. [DOI] [PubMed] [Google Scholar]
- 31.Berria R, Glass L, Mahankali A, et al. Reduction in hematocrit and hemoglobin following pioglitazone treatment is not hemodilutional in type II diabetes mellitus. Clin Pharmacol Ther. 2007;82:275–281. doi: 10.1038/sj.clpt.6100146. [DOI] [PubMed] [Google Scholar]
- 32.Perez-Mancera PA, Bermejo-Rodriguez C, Sanchez-Martin M, Abollo-Jimenez F, Pintado B, Sanchez-Garcia I. FUS-DDIT3 prevents the development of adipocytic precursors in liposarcoma by repressing PPARgamma and C/EBPalpha and activating eIF4E. PLoS One. 2008;3:e2569. doi: 10.1371/journal.pone.0002569. [DOI] [PMC free article] [PubMed] [Google Scholar]


