

Abstract
Interstitial fluid pressurization plays an important role in cartilage biomechanics and is believed to be a primary mechanism of load support in synovial joints. The objective of this study was to investigate the effects of enzymatic degradation on the interstitial fluid load support mechanism of articular cartilage in unconfined compression. Thirty-seven immature bovine cartilage plugs were tested in unconfined compression before and after enzymatic digestion. The peak fluid load support decreased significantly (p<0.0001) from 84±10% to 53±19% and from 80±10% to 46±21% after 18-hours digestion with 1.0 u/mg-wet-weight and 0.7 u/mg-wet-weight of collagenase, respectively. Treatment with 0.1 u/ml of chondroitinase ABC for 24 hours also significantly reduced the peak fluid load support from 83±12% to 48±16% (p<0.0001). The drop in interstitial fluid load support following enzymatic treatment is believed to result from a decrease in the ratio of tensile to compressive moduli of the solid matrix.
Introduction
Articular cartilage is the soft connective tissue that covers the bone ends in synovial joints. Its main functions are to distribute loads and provide a low-friction bearing surface. The composition and organization of its extracellular matrix provide it with remarkable mechanical and tribological properties. The tensile properties of articular cartilage are primarily regulated by the collagen fibrils, while proteoglycans regulate its compressive behavior [1].
Interstitial water constitutes 68% to 85% of articular cartilage by wet weight [1]. This fluid pressurizes under loading, contributing to the load support mechanism of articular cartilage. This interstitial fluid load support can be quantified as follows: In a biphasic material [2] the total stress is given by σ=−pI + σe, where p is the interstitial fluid pressure, σe is the effective stress resulting from solid matrix strains, and I is the identity tensor. The normal contact force at a contact interface is given by W=∫An · σndA, where n is the unit outward normal at the interface, n · σn is the normal traction (or contact stress), and A is the apparent contact area. Integrating the fluid pressure over the contact interface produces Wp=−∫ApdA, and the ratio Wp/W is called the interstitial fluid load support.
Under physiological loading conditions, joints are typically subjected to contact stresses in the range of 2-12 MPa. Most of this normal traction is supported by cartilage interstitial fluid pressurization, which increases the dynamic compressive modulus and shields the solid matrix from excessive deformation. Theoretical and experimental studies have shown that under various loading conditions the interstitial fluid load support can be in excess of 90% at the articular surface [3-6]. It has also been hypothesized that this interstitial fluid pressurization is a primary mechanism regulating the joint frictional response [7-9], a mechanism which has been verified experimentally in our recent studies [10, 11].
Recent studies have hypothesized that cartilage interstitial fluid pressurization is enhanced by the inequality of the tensile and compressive properties of its solid matrix [12-15], whose tensile modulus may be as much as two orders of magnitude greater than its compressive modulus. Consequently it is reasonable to expect that alterations in these material properties, as observed in osteoarthritic degeneration, may adversely affect interstitial fluid pressurization. Changes in structure and composition of articular cartilage that mimic osteoarthritic degeneration can be induced by enzymatic digestion to help investigate structure-function relationships. Collagenase and chondroitinase ABC are two widely used enzymes that selectively degrade different components of the extracellular matrix of articular cartilage. Collagenase is used to degrade collagen fibrils and chondroitinase ABC specifically digests proteoglycans. The effect of these enzymes on the mechanical properties of articular cartilage has been previously investigated. Lyyra et al. [16] showed that the compressive Young's modulus obtained form an indentation test decreases significantly after treatment with collagenase and chondroitinase ABC. Proteoglycan removal with chondroitinase ABC and other proteolytic enzymes increases the tissue's permeability [17], decreases the compressive stiffness [18] and the shear modulus [19] and affects the kinetic creep response in tension [20]. In a recent study by Korhonen et al. [21], experimental results showed a slight decrease in the modulus of the fibril network (tensile modulus) and a more pronounced drop in the non-fibrillar matrix modulus (compressive modulus) after treatment with chondroitinase ABC, while digestion with collagenase caused a similar drop in both moduli. Since treatment with these enzymes is unlikely to maintain a constant ratio of tensile to compressive moduli, this approach may also be useful for investigating the influence of matrix degradation on interstitial fluid load support in unconfined compression.
Hence, the objective of this study was to investigate the effects of enzymatic treatment with collagenase and chondroitinase ABC on the fluid load support mechanism of bovine articular cartilage in unconfined compression. The related hypothesis is that enzymatic treatment will significantly alter the peak value of interstitial fluid load support.
Methods
Specimen Preparation
Thirty-seven cylindrical plugs (Ø8 mm) were harvested from the femoral condyles of five 1-3 month-old healthy bovine knee joints obtained from a local abattoir and stored at −20°C in phosphate-buffered saline (PBS, no protease inhibitors). On the day of testing, specimens were thawed at room temperature and the subchondral bone and part of the deep zone of each plug were removed using a sledge microtome (2400; Leica Microsystems, Inc., IL) to produce a uniform thickness (average final thickness: 1.55±0.23 mm), leaving the articular surface intact. Ø6 mm specimens were further cored out from the microtomed plugs and the remaining rings were frozen in PBS for subsequent determination of the biochemical composition of each plug prior to enzymatic treatment.
Testing Device and Loading Protocol
Each cartilage sample was placed with its articular surface down in a testing chamber similar to that of our recent study [12], having a Ø 4.78 mm × 1.5 mm recess holding a free-draining stainless steel porous filter (Figure 1). A piezoresistive microchip pressure transducer (NPC-1210-100G-3N, range 0-0.69 MPa; Lucas Novasensor, CA) was bonded to the bottom of the chamber to allow for measurement of the interstitial fluid pressure at the articular surface, across the porous filter. The chamber was filled with PBS throughout the experiment and replaced fresh for every specimen. Loading was applied via an impermeable glass platen using a voice coil load actuator (LA17-28-00A; BEI Kimco Magnetics, CA) and the normal reaction force was measured with a load cell (8523, range ±200N; Burster, Germany) placed underneath the chamber.
Figure 1.
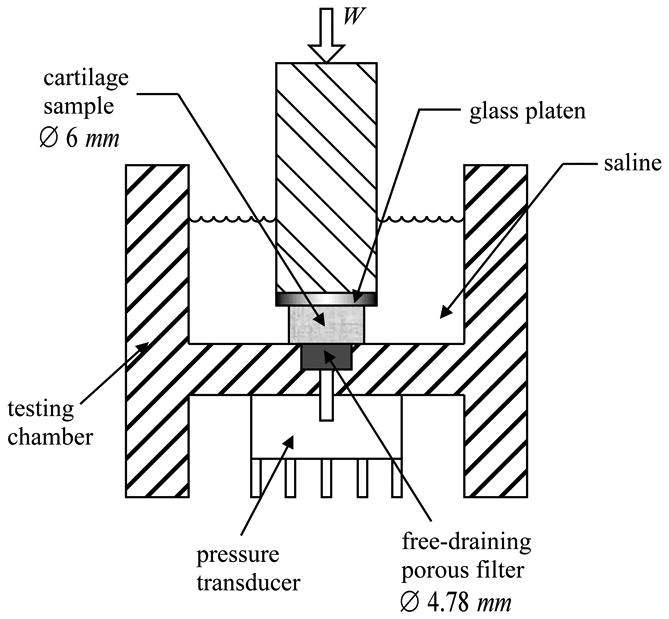
Diagram of the unconfined compression testing chamber
The testing protocol employed in this study is based on that of Park et al. [12]. A tare load that reached 15 N in 20 s was first applied to prime the pressure transducer and overcome the delay occasioned by transducer impedance [12]. Immediately thereafter, a total compressive strain of 10% was imposed at a rate of 0.2%/s, followed by unloading at the same rate. The time-varying total load across the specimen, W(t), was recorded as a function of time. The corresponding time-varying load supported by interstitial fluid at the articular surface, Wp(t), was determined from the pressure transducer measurement, taking into account the smaller diameter of the porous filter relative to the specimen as described in our recent study [12]. The peak interstitial fluid load support, Wp/W, was then determined from the constant slope of Wp(t) versus W(t) during the 50 s loading phase.
Enzymatic Treatment
Following the first mechanical test, specimens were subjected to different enzymatic treatments to digest the tissue. Wet weight was first determined in all cylindrical specimens (M220 digital balance 0-200 gr., 0.1 gr. accuracy; Denver Instruments, CO). Specimens to be treated with collagenase (loaded collagenase treatment groups) were then incubated under gentle agitation for 18 hours at 37°C in 3 ml of a PBS solution containing 1.0 (n=18) or 0.7 (n=11) units of collagenase type IV (Sigma, MO) per mg of tissue wet weight. Control specimens (n=11) were incubated in PBS under the same conditions (loaded collagenase control group). An additional group of specimens (n=8) was digested with 0.7 u/mg wet weight of collagenase but not subjected to any mechanical testing (unloaded collagenase treatment group). This group was used to determine whether mechanical testing might cause any additional changes in biochemical composition.
Specimens treated with chondroitinase ABC (loaded chondroitinase treatment group, n=11) were digested with 0.1 u/ml of chondroitinase ABC (Sigma, MO) in a buffer solution containing 50 mM Tris-HCl, 60 mM sodium acetate pH 8.0 and 0.02% bovine serum albumin at 37°C for 24 hours under gentle agitation. The respective control specimens (loaded chondroitinase control group, n=9) were incubated in PBS without enzyme under the same conditions. Finally, an unloaded chondroitinase treatment group (n=6), using the same concentration of enzyme, was also included to investigate the potential influence of mechanical loading on biochemical composition.
The choice of incubation time for both enzymatic treatments was determined from preliminary studies, with the aim of achieving detectable degradation in the tissue while maintaining sufficient tissue integrity for subsequent mechanical testing.
Following enzymatic treatment, specimens were rinsed twice with PBS. Peak fluid load support was determined for specimens in the loaded treatment and loaded control groups using the same loading protocol described above.
Biochemical and histological analyses
After the second mechanical test, specimens were equilibrated in PBS for one hour to allow recovery from mechanical testing, then cut in half and stored. One half was used to determine biochemical composition after enzymatic treatment, while the other half was frozen for subsequent histological analyses. For biochemistry, specimen halves and their corresponding outer rings were thawed and equilibrated in PBS at room temperature. After measuring wet weights, they were lyophilized overnight and reweighed dry to obtain the water content. Following 16-hour digestion with papain (Sigma; MO), the glycosaminoglycan (GAG) content was determined using a 1,9 dimethylmethylene blue assay [22] with chondroitin-6-sulfate (Sigma, MO) as the standard. The hydroxyproline content was obtained using a colorimetric procedure [23], which was converted into collagen content using a mass ratio of collagen to hydroxyproline of 7.25 [24]. GAG and collagen contents were normalized by the tissue wet weight.
The immunohistochemical staining protocol is a modification of that previously described by Waggett et al. [25]. Specimens intended for histological analysis were fixed in acid-formalin-ethanol [26] (70% absolute ethanol, 5% acetic acid, 10% formaldehyde (37% stock), and 15% distilled water), dehydrated in a graded series of alcohol, and embedded in paraffin (Polysciences, Warrington, PA). Paraffin blocks were sectioned (8 μm thickness) using a rotary microtome (Leica model 2030, Germany), and the sections were affixed to glass slides. For type II collagen immunohistochemical staining, slides were deparaffinized, rehydrated, briefly digested with 0.5 mg/ml hyaluronidase for 30 minutes at 37°C, and swelled for 4 hours in 0.5 M acetic acid at 4°C. The slides were then rinsed with PBS, treated with 3% hydrogen peroxide in methanol for 10 minutes at room temperature to block endogenous peroxidase activity, rinsed with PBS, and incubated with blocking solution (10% horse serum in PBS) for 10 minutes at room temperature. After blocking, samples were incubated with a monoclonal antibody to type II collagen (II-II6B3, Developmental Studies Hybridoma Bank, University of Iowa) at a 1:3 dilution of supernatant overnight at 4°C. Slides were then incubated with a biotin-conjugated horse-derived broad spectrum IgG secondary antibody (Vector Labs, Burlingame, CA) for 20 minutes at room temperature. Following a PBS rinse, the samples were visualized using streptavidin-conjugated horseradish peroxidase and DAB as the substrate chromagen, employing the Vectastain ABC kit (Vector Labs) as directed by the supplier. Non-immune control specimens were incubated with blocking solution (10% horse serum in PBS) in place of primary antibody.. Specimens were visualized using a Zeiss Axioscope 40 light microscope and images were captured using Zeiss Axiovision software under identical settings (i.e., exposure time, objective magnification) with a high resolution Axiocam HRC 14-bit cooled color digital camera
Statistical Analyses
Statistical analyses were performed using the SAS v.8 software package (SAS Institute Inc., Carey, NC). Two-way ANOVA (α=0.05) and post hoc Bonferroni-corrected pair-wise least-squares testing of the means, was used to detect differences in interstitial fluid load support between the first and second mechanical test (repeated measures) and among the various loaded treatment and loaded control groups. A two-way ANOVA with repeated measures (α=0.05), followed by Bonferroni post-hoc testing of the means, was also used to detect differences in biochemical composition before treatment (measured in outer ring tissue samples) and after treatment (collagenase 1.0 and 0.7 u/mg-wet-weight, chondroitinase ABC, and their respective loaded and unloaded controls) and among the various treatment and control groups.
Results
A typical response for the total load W and the fluid load Wp as a function of time is presented in Figure 2a. In most cases there is an initial drop in both W and Wp which occurs because the immediately preceding tare load application occurs at a higher rate of compression, resulting in a slight stress relaxation before the displacement control test is initiated. After this initial drop, both quantities increase in magnitude during the loading phase. During the unloading phase, the total load W rapidly reduces to zero because of platen lift-off, as the rate of unloading exceeds the rate of tissue recovery. Similarly, Wp rapidly decreases and in some cases it becomes slightly negative as the specimen is re-imbibing interstitial fluid lost during the loading phase. Only the data from the loading phase were used to determine interstitial fluid load support.
Figure 2.

Typical response of (a) W(t) and Wp(t) and (b) plot of Wp(t) versus W(t) during the loading phase before enzymatic treatment
A parametric plot of Wp(t) versus W(t) for 0 ≤ t ≤ 50 s is shown for the same specimen in Figure 2b. This relationship, which represents how much Wp increases with W, was observed to be consistently linear over this relatively short loading duration in all specimens, as assessed by the coefficient of determination from standard linear regression (Table 1). The constant slope dWp/dW, determined from the regression, corresponds to the peak interstitial fluid load support. For the specimen shown in this figure, the slope was 0.79, which means that interstitial fluid pressurization is supporting 79% of the total applied load. After digestion of that same specimen with 0.1 u/ml of chondroitinase ABC for 24 hours, its response to loading was altered as shown in Figure 3. Enzymatic treatment led to a slower rise in Wp relative to W. In this case for example, the slope of Wp(t) versus W(t) was 0.35, indicating a reduction of interstitial fluid load support to 35%. Similar plots were obtained for specimens treated with collagenase.
Table 1.
Mean and standard deviation of the coefficient of determination, R2, from the linear regression of Wp versus W, for all loaded groups before and after incubation.
| R2 | Before | After |
|---|---|---|
| 1.0 u/mg-wet-weight loaded collagenase treatment group | 0.998 ± 0.001 | 0.994 ± 0.004 |
| 0.7 u/mg-wet-weight loaded collagenase treatment group | 0.998 ± 0.001 | 0.998 ± 0.001 |
| PBS loaded collagenase control group | 0.997 ± 0.001 | 0.997 ± 0.003 |
| 0.1 u/ml loaded chondroitinase treatment group | 0.999 ± 0.001 | 0.997 ± 0.004 |
| PBS loaded chondroitinase control group | 0.999 ± 0.001 | 0.997 ± 0.003 |
Figure 3.

Typical response of (a) W(t) and Wp(t) and (b) plot of Wp(t) versus W(t) during the loading phase after treatment with chondroitinase ABC
Averages and standard deviations of the peak interstitial fluid load support for all loaded treatment and loaded control groups are presented in Figure 4, including statistically significant differences. Treatment with 1.0 and 0.7 u/mg-wet-weight of collagenase for 18 hours significantly decreased the maximum fluid load support, however no difference was found between the two enzyme concentrations. Similarly, treatment with 0.1 u/ml of chondroitinase ABC for 24 hours caused a significant drop in the peak fluid load support. No significant change in the fluid load support of loaded control groups was found after incubation in PBS for 18 or 24 hours.
Figure 4.

Summary of peak fluid load support for loaded treatment groups and their respective controls: a) Collagenase groups; b) chondroitinase ABC groups.
Results from the biochemical analyses are presented in Table 2 and Table 3 and statistical outcomes are summarized here. The water, GAG and collagen content for all specimens before any enzymatic treatment are within normal values for young bovine cartilage [24]. There was a significant increase in water content after treatment with 1.0 u/mg-wet-weight of collagenase (p=0.022), but no change after treatment with 0.7 u/mg-wet-weight of collagenase or chondroitinase, or after incubation in PBS for 18 or 24 hours.
Table 2.
Biochemical composition of collagenase treated specimens. Statistically significant differences between “Before” and “After” are denoted with * (p<0.0001) and † (p<0.05).
| Water (%) | GAG (% wet weight) | Collagen (% wet weight) | ||||
|---|---|---|---|---|---|---|
| Before | After | Before | After | Before | After | |
| 1.0 u/mg-wet-weight loaded collagenase treatment group | 81.4 ± 2.9 | 87.1± 4.7† | 3.8 ± 0.8 | 1.4 ± 0.6* | 11.1 ± 2.7 | 9.5 ± 1.7 |
| 0.7 u/mg-wet-weight loaded collagenase treatment group | 85.3 ± 2.2 | 88.6 ± 4.3 | 3.0 ± 0.4 | 1.2 ± 0.4* | 9.2 ± 2.7 | 7.1 ± 1.2 |
| 0.7 u/mg unloaded collagenase treatment group | 83.0 ± 3.1 | 88.0 ± 2.6 | 3.6 ± 0.9 | 1.5 ± 0.6* | 9.9 ± 2.1 | 6.7 ± 0.4 |
| PBS loaded collagenase control group | 83.3 ± 5.0 | 82.4 ± 2.9 | 3.2 ± 0.4 | 2.7 ± 1.4 | 11.8 ± 2.1 | 9.6 ± 1.7 |
Table 3.
Biochemical composition of chondroitinase ABC treated specimens. Statistically significant differences between “Before” and “After” are denoted with * (p<0.0001)
| Water (%) | GAG (% wet weight) | Collagen (% wet weight) | ||||
|---|---|---|---|---|---|---|
| Before | After | Before | After | Before | After | |
| 0.1 u/ml loaded chondroitinase treatment group | 84.8±5.7 | 86.3±3.2 | 2.7 ± 0.9 | 0.8 ± 0.4* | 9.3 ± 4.0 | 11.2 ± 3.0 |
| 0.1 u/ml unloaded chondroitinase treatment group | 84.5±4.2 | 86.4±3.3 | 2.8 ± 0.5 | 0.8 ± 0.5* | 10.0 ± 2.7 | 12.4 ± 3.8 |
| PBS loaded chondroitinase control group | 83.7±7.7 | 84.6±4.3 | 3.3 ± 0.7 | 2.4 ± 1.2 | 12.6 ± 3.2 | 10.7 ± 3.8 |
Digestion with both enzymes significantly reduced the GAG content in the loaded and unloaded treatment groups (p<0.0001), but this decrease was more dramatic after treatment with chondroitinase ABC (Table 3). The reduction in GAG content after collagenase treatment was likely due to a release of proteoglycans into the digestion media as a result of the collagen matrix disruption. Incubation in PBS for 24 hours (loaded chondroitinase control group) or 18 hours (loaded collagenase control group) caused no change in GAG content.
Treatment with either concentration of collagenase appeared to have had no significant measurable effect on the total collagen content (Table 2). However histological results showed evidence of loss of staining for type II collagen in collagenase treated samples in comparison with controls incubated in PBS (Figure 5). The loss in type II collagen was also more dramatic in the group treated with 1.0 u/mg-wet-weight of collagenase, compared to 0.7 u/mg-wet-weight (Figure 5b versus Figure 5c). Incubation in PBS for 18 hours (loaded collagenase control group) or 24 hours (loaded chondroitinase control group) produced no significant change in collagen content. Collagen content was also not affected by treatment with chondroitinase ABC.
Figure 5.

Histological sections stained for type II collagen (magnification 10×) for (a) a PBS loaded control specimen, and specimens treated with (b) 0.7 u/mg wet-weight and (c) 1.0 u/mg wet-weight of collagenase (bar=100 μm)
No statistical difference was found between the loaded treatment groups and their respective unloaded treatment groups, suggesting that changes in biochemical composition in the loaded treatment groups was primarily due to the enzymatic treatment and not to the mechanical test.
Discussion
The main objective of this study was to investigate the effects of enzymatic digestion on the interstitial fluid load support mechanism of articular cartilage in unconfined compression. The results presented in Figure 4 confirm our hypothesis that degradation of the collagen-proteoglycan matrix of articular cartilage by enzymatic treatment with collagenase or chondroitinase ABC leads to a significant alteration in peak interstitial fluid load support in articular cartilage.
In an earlier theoretical study [14], it was shown that the peak fluid load support in unconfined compression is dependent on the ratio of the tensile and compressive moduli of the solid matrix according to the relation:
| (1) |
where H−A is the aggregate modulus in compression, H+A is the corresponding modulus in tension and λ2 is the off-diagonal modulus. This formula predicts the peak interstitial fluid load support immediately upon loading, for any loading history, including creep or stress-relaxation [27]. For example, experimentally, the ratio (H+A−λ2)/(H−A−λ2) for human patellofemoral cartilage has been reported to be 36:1 in the surface zone and 9.4:1 in the deep zone [28], which would imply a higher fluid load support at the articular surface. This disparity in interstitial fluid load support between the surface and deep zones was recently confirmed experimentally in human and bovine articular cartilage [12]. These results support the hypothesis that tension-compression non-linearity is an essential functional property of the tissue that contributes significantly to the load support mechanism.
It is noteworthy that the above formula is not a function of tissue permeability. While this may seem surprising at first, it should be kept in mind that the formula only reports the peak interstitial fluid load support, strictly achieved immediately upon loading (t=0+ in Figure 2a and Figure 3a). However, our recent direct experimental measurements of interstitial fluid load support (Figure 4a in [12]) have shown that the peak value achieved in the early time response decreases only slowly during the early response to the ramp loading phase of a stress-relaxation test, even over a period of 500 seconds, in agreement with theoretical predictions (Appendix). Over several thousand seconds this load support will decrease to zero with increasing matrix consolidation, and the rate of decrease will indeed depend on the permeability, as well as the tensile modulus and radial dimension of the tissue sample [12, 14]. Based on the linear response of Wp versus W over the entire duration of loading in Figure 2b and Figure 3b (and R2 values in Table 1), it is evident that the 50 s duration of loading used in this study was significantly shorter than the characteristic time for tissue consolidation, both for normal and degraded tissue samples. This response yielded a constant slope Wp/W, taken to be the maximum interstitial fluid load support. A theoretical analysis (Appendix) shows that the results of this study would remain essentially unchanged if different ramp times had been selected, as long as the slope of Wp(t) versus W(t) was obtained for t much smaller than the characteristic time constant for the tissue response.
The tensile response of cartilage is regulated mainly by its collagenous matrix, and collagen degradation has been shown to decrease the tensile modulus [21]. However, collagenase has also been shown to decrease the compressive modulus of cartilage [29]. Similarly, since proteoglycans are responsible for the osmotic pressure of cartilage, they contribute significantly to its compressive properties, and chondroitinase ABC digestion has been shown to reduce the compressive modulus of cartilage [18, 21, 29]. Proteoglycan degradation has also been shown to reduce the tensile modulus of cartilage under certain loading conditions [20, 21]. Based on these prior literature findings, it can be anticipated that collagenase digestion, which is likely to reduce the tensile modulus of cartilage much more than its compressive modulus, should lead to a decrease in the ratio of tensile to compressive moduli. This would lead to a reduction in interstitial fluid load support according to Eq. (1), as was indeed observed in the current study. Hence the reduction in interstitial fluid load support following collagenase digestion may be explained by a reduction in the ratio of tensile to compressive moduli.
In contrast, the prior literature would suggest that chondroitinase ABC digestion should produce a more significant decrease in the compressive modulus than in the tensile modulus [21]. The resulting increase in the ratio of tensile to compressive moduli would thus be expected to produce a higher interstitial fluid load support in chondroitinase digested specimens, contrary to the experimental findings of this study. However this apparent contradiction can be resolved by a closer analysis of the nonlinearities in the stress-strain response of normal and enzymatically degraded cartilage.
In a recent study we investigated the effect of chondroitinase ABC digestion on the frictional response of bovine articular cartilage in unconfined compression stress-relaxation. Experiments were conducted by first applying a tare load (1.8 ± 0.4 N) to ensure proper contact for frictional measurements, followed by a ramp compression to 10% strain, both with continuous reciprocal sliding (±1.5 mm at 1 mm/s). For purposes of comparison with the current study, the load response in stress-relaxation was curve-fitted to the biphasic-CLE model [14], to obtain the material properties for the normal and digested specimens. Average values of these parameters, as well as the GAG content, are summarized in Table 4. These results show a statistically significant decrease of the tensile modulus H+A, a slight increase in the compressive modulus H−A, and no change in λ2 or the permeability k following chondroitinase digestion. The slight increase observed in H−A differs from the decrease reported in the prior literature [21] and can be explained by the choice of testing configuration. In our study [30], the application of a tare load produced a higher compressive strain in the digested tissue samples, confirming that GAG loss leads to an initial reduction in the compressive modulus; however, due to the nonlinear nature of the equilibrium stress-strain response of cartilage at higher compressive strains [31][32], the subsequent stress-relaxation test produced a slightly higher equilibrium modulus in digested specimens when compared to controls. Consequently, the peak fluid load support predicted from Eq. (1) actually demonstrates a significant reduction following chondroitinase digestion (Table 4). Note that the reduction in predicted peak fluid load support in Table 4 is not as great as in the current study, but neither is the relative loss of GAG following digestion. This result suggests that the nonlinear behavior of cartilage at higher compressive strains can produce non-intuitive outcomes.
Table 4.
Material parameters, theoretical peak fluid load support (using Eq.(1)), and GAG content obtained from an unconfined compression friction test of chondroitinase ABC treated samples [30].
|
| |||
|---|---|---|---|
| Control (n=12) | Chondroitinase Treated (n=11) | p-value | |
| H+A (MPa) | 9.59±1.59 | 7.41±1.50 | 0.0035 |
| H−A (MPa) | 0.51±0.28 | 0.75±0.34 | 0.0924 |
| λ2 (MPa) | 0.31±0.26 | 0.39±0.30 | 0.5316 |
| k (10-15 m4/N.s) | 1.08±055. | 1.22±0.58 | 0.5596 |
| Peak Wp/W (%) | 95.8±0.02 | 89.7±0.06 | 0.0155 |
| GAG content (% wet-weight) | 3.3±0.8 | 1.7±0.8 | 0.0001 |
|
| |||
Since the current study employed an even higher tare load (15 N), these nonlinear effects are likely exacerbated. Consequently, the experimental finding that chondroitinase ABC digestion reduces the peak interstitial fluid load support in cartilage may still be explained by a reduction in the ratio of tensile to compressive moduli, albeit in a complex nonlinear manner.
The results of this study differ from those of Oloyede and Broom [33], who measured interstitial fluid pressurization in confined compression after proteoglycan removal with hyaluronidase and reported an increase in peak fluid pressure at the center of the specimen during creep. There may be several factors responsible for these different outcomes, including differences between the testing configurations of confined versus unconfined compression, and creep versus stress relaxation. In confined compression the theoretical upper bound for interstitial fluid load support is always 100% according to biphasic porous media theories, regardless of the difference between tensile and compressive properties, as verified in our previous experimental measurements [4]. Cartilage degradation may alter the rate at which fluid load support changes with time, but not the value of the peak load support. In addition to finding a higher fluid pressure after hyaluronidase treatment, these authors also observed a faster pressure rise to the peak value (i.e., a smaller delay in pressurization), suggesting altered fluid transport properties in the degraded tissue. In a recent analysis, we have shown that the delay in pressurization is affected by the pressure transducer impedance relative to the characteristic velocity of cartilage interstitial fluid flow [12]. Since the study of Oloyede and Broom [33] does not report 100% fluid load support in the early time response, in contradiction with theory and our previous experimental measurements, it is possible that their results were compromised by a complex interaction between altered cartilage transport properties and pressure transducer impedance. In the current study, a tare loading protocol was employed to prime the pressure transducer and eliminate any delays at the initiation of the stress-relaxation test, as evidenced by the constant slope in Wp versus W over the entire duration of loading in Figure 2b and Figure 3b. (In contrast, during the application of the tare load, Wp initially lagged behind W, exhibiting an initial nonlinear region.)
There are several potential limitations to this study. First, despite the fact that interstitial fluid pressure was measured directly at the articular surface of cartilage specimens, the pressure was known only over a circular footprint 4.78 mm in diameter, whereas the tissue sample diameter was 6 mm. This disparity was necessary in order to produce a good seal between the specimen and the filter. It was estimated that, over the remaining annular peripheral footprint (Figure 1), the interstitial fluid pressure reduced linearly, from its measured mean value at the center to zero (atmospheric pressure) at the radial edge. For the given dimensions, this was equivalent to multiplying the actual measured pressure by a constant factor of 0.81 (as described in greater detail in [12]). Without this factor, the measured peak interstitial fluid load support would be higher than reported in Figure 4, even slightly exceeding 100% in the case of some of the undigested specimens. A theoretical analysis of unconfined compression, using the biphasic-CLE model of cartilage where the radial and temporal distribution of interstitial fluid pressure can be fully characterized, suggests that the multiplication factor required to estimate the mean pressure over the entire Ø6 mm footprint from the mean pressure over the Ø4.78 mm footprint is not truly constant; it starts out at unity immediately upon loading and decreases with time in a manner dependent on the intrinsic material properties and dimensions of the tissue sample. Consequently, the interstitial fluid load support reported in this study, based on the use of a constant multiplication factor smaller than unity, is a conservative measure likely to underestimate the actual peak fluid load support.
A second potential limitation was the difficulty involved with the degradation of articular cartilage with collagenase. In preliminary studies we noted that degradation occurred more severely in the outer periphery of the sample. With too much degradation, mechanical loading or even simple handling could cause loss of tissue from these outer layers. (This outcome helped motivate the inclusion of an unloaded collagenase treatment group to help assess the potential detrimental effect of mechanical loading on tissue biochemical composition.) Consequently, relatively low concentrations of collagenase were employed, together with gentle agitation during incubation, to minimize this problem. Despite this approach, most treated specimens in the loaded collagenase treatment groups did not recover their initial thickness at the completion of mechanical testing, and tissue debris was observed in the bathing solution. Since collagen content was measured from the remaining specimens, without accounting for the debris lost in solution, results may be biased to underestimate the amount of collagen digestion. These experimental difficulties may account for the lack of statistically significant collagen compositional differences found before and after treatment with collagenase, or between the two dosages of collagenase employed in this study (Figure 4), despite the histological evidence of collagen loss (Figure 5).
The difficulties encountered in the collagenase treatment groups did not occur in the chondroitinase treatment groups, where treated specimens maintained their structural integrity, recovered their thickness after loading, and exhibited significant decrease in GAG content relative to controls.
Results from this study have an important impact on the understanding of the frictional response of articular cartilage. It has been proposed that an elevated interstitial fluid load support is a primary mechanism for reducing the friction coefficient in articular cartilage by shifting most of the applied load to the fluid and reducing the frictional force between opposing cartilage matrices [7-9]. This hypothesized mechanism was verified experimentally in our recent studies which showed a very high correlation between decreasing interstitial fluid load support and increasing friction coefficient [10, 11]. Under a constant applied load, cartilage exhibits its smallest friction coefficient immediately upon loading, when the interstitial fluid pressure achieves its peak value. The fact that enzymatic digestion decreases the peak fluid load support in unconfined compression suggests that it might also affect the frictional response by increasing the minimum achievable friction coefficient, as was indeed confirmed in our recent study [30].
The integrity of the collagen network and proteoglycan aggregates plays a critical role in the mechanical and tribological properties of cartilage. Osteoarthritis is a degenerative process characterized by a decrease in proteoglycan content, increase in water content and fibrillation, all of which compromise this integrity [1]. Osteoarthritic degeneration has commonly been modeled in vitro using enzymatic degradation. Hence, the findings from this study suggest that a loss in the fluid load support mechanism due to tissue degeneration might occur in osteoarthritis. This could subject the solid matrix of the tissue to greater stresses that could further advance the degenerative process.
Acknowledgments
This study was supported by the National Institute of Arthritis and Musculoskeletal and Skin Diseases of the National Institutes of Health (AR 43628, AR46532). The monoclonal antibody, II-II6B3, developed by Thomas F. Linsenmayer, was obtained from the Developmental Studies Hybridoma Bank developed under the auspices of the NICHD and maintained by The University of Iowa, Department of Biological Sciences, Iowa City, IA 52242.
Appendix
The formula of Eq. (1) is strictly valid for the immediate response (t=0+) of a biphasic-CLE model of cartilage upon loading, in unconfined compression, regardless of the loading history [27]. It can be shown however that the short-term response to a ramp-compression displacement profile produces a ratio Wp/W which is very close to the limiting value of Wp/W|max reported in Eq. (1), regardless of the compression velocity, as long as the ratio is evaluated from the responses W(t) and Wp(t) over a duration much shorter than the characteristic time constant for interstitial fluid flow in the tissue.
The mathematical proof for this observation can be derived from the analytical solution to the unconfined compression problem. The solution in the Laplace transform domain was provided in our earlier study (Eqs.(13)-(14) of [27], for the special case when c=0). An asymptotic expansion of the Laplace transform solution can be evaluated and inverted into the time domain using the method described by Armstrong et al. [34]. The resulting asymptotic expansion for the unconfined compression response to a ramp compression is given by
In these expressions, r0 is the cylinder radius and h is its thickness, and V0 is the ramp velocity (thus V0 /h is the strain rate). These expressions are valid in the limit when . Both Wp(t) and W(t) are clearly dependent on V0, however the interstitial fluid load support,
is not. Furthermore, in the limit as t → 0+, this expression reduces to
which is the same as Eq.(1). Similarly,
which tends to the same limit as t → 0+. This result proves that, as long as the slope of Wp(t) versus W(t) is evaluated for t much smaller than the characteristic time constant , the result produces very nearly the peak interstitial fluid load support, regardless of the choice of ramp velocity.
Representative time constants for cartilage can be evaluated from Table 4, for a specimen radius r0=3 mm, yielding 869 s for normal cartilage and 996 s for chondroitinase ABC treated cartilage. For collagenase treated cartilage, the time constant can be estimated from the material properties reported by Korhonen et al. [21], with H+A ∼2.53 MPa and k=3.84×10⁻¹⁵ m4/N.s, yielding 926 s. These estimates suggest that the time constant tends to increase slightly with digestion. Consequently, determining the magnitude of fluid load support from the slope of Wp(t) versus W(t) for t ≤50 s, as performed in this study, satisfies the theoretical constraint , and is insensitive to the ramp velocity.
References
- 1.Mow VC, Ratcliffe A. Structure and Function of Articular Cartilage and Meniscus. In: Mow VC, Hayes W, editors. Basic Orthopaedic Biomechanics. Lippincot-Raven Publishers; Philadelphia: 1997. pp. 113–177. [Google Scholar]
- 2.Mow VC, Kuei SC, Lai WM, Armstrong CG. Biphasic Creep and Stress Relaxation of Articular Cartilage in Compression? Theory and Experiments. J Biomech Eng. 1980;102:73–84. doi: 10.1115/1.3138202. [DOI] [PubMed] [Google Scholar]
- 3.Macirowski T, Tepic S, Mann RW. Cartilage Stresses in the Human Hip Joint. J Biomech Eng. 1994;116:10–18. doi: 10.1115/1.2895693. [DOI] [PubMed] [Google Scholar]
- 4.Soltz MA, Ateshian GA. Experimental Verification and Theoretical Prediction of Cartilage Interstitial Fluid Pressurization at an Impermeable Contact Interface in Confined Compression. J Biomech. 1998;31:927–934. doi: 10.1016/s0021-9290(98)00105-5. [DOI] [PubMed] [Google Scholar]
- 5.Ateshian GA, Lai WM, Zhu WB, Mow VC. An Asymptotic Solution for the Contact of Two Biphasic Cartilage Layers. J Biomech. 1994;27:1347–1360. doi: 10.1016/0021-9290(94)90044-2. [DOI] [PubMed] [Google Scholar]
- 6.Oloyede A, Broom N. Stress-Sharing between the Fluid and Solid Components of Articular Cartilage under Varying Rates of Compression. Connect Tissue Res. 1993;30:127–141. [PubMed] [Google Scholar]
- 7.McCutchen CW. The Frictional Properties of Animal Joints. Wear. 1962;5:1–17. [Google Scholar]
- 8.Ateshian GA. A Theoretical Formulation for Boundary Friction in Articular Cartilage. J Biomech Eng. 1997;119:81–86. doi: 10.1115/1.2796069. [DOI] [PubMed] [Google Scholar]
- 9.Forster H, Fisher J. The Influence of Loading Time and Lubricant on the Friction of Articular Cartilage. Proc Inst Mech Eng [H] 1996;210:109–119. doi: 10.1243/PIME_PROC_1996_210_399_02. [DOI] [PubMed] [Google Scholar]
- 10.Ateshian GA, Wang H, Lai WM. The Role of Interstitial Fluid Pressurization and Surface Porosities on the Boundary Friction of Articular Cartilage. J Tribology. 1998;120:241–251. [Google Scholar]
- 11.Krishnan R, Kopacz M, Ateshian GA. Experimental Verification of the Role of Interstitial Fluid Pressurization in Cartilage Lubrication. J Orthop Res. 2004;22:565–570. doi: 10.1016/j.orthres.2003.07.002. [DOI] [PMC free article] [PubMed] [Google Scholar]
- 12.Park S, Krishnan R, Nicoll SB, Ateshian GA. Cartilage Interstitial Fluid Load Support in Unconfined Compression. J Biomech. 2003;36:1785–1796. doi: 10.1016/s0021-9290(03)00231-8. [DOI] [PMC free article] [PubMed] [Google Scholar]
- 13.Cohen B, Lai WM, Mow VC. A Transversely Isotropic Biphasic Model for Unconfined Compression of Growth Plate and Chondroepiphysis. J Biomech Eng. 1998;120:491–496. doi: 10.1115/1.2798019. [DOI] [PubMed] [Google Scholar]
- 14.Soltz MA, Ateshian GA. A Conewise Linear Elasticity Mixture Model for the Analysis of Tension-Compression Nonlinearity in Articular Cartilage. J Biomech Eng. 2000;122:576–586. doi: 10.1115/1.1324669. [DOI] [PMC free article] [PubMed] [Google Scholar]
- 15.Soulhat J, Buschmann MD, Shirazi-Adl A. A Fibril-Network-Reinforced Biphasic Model of Cartilage in Unconfined Compression. J Biomech Eng. 1999;121:340–347. doi: 10.1115/1.2798330. [DOI] [PubMed] [Google Scholar]
- 16.Lyyra T, Arokoski JP, Oksala N, Vihko A, Hyttinen M, Jurvelin JS, Kiviranta I. Experimental Validation of Arthroscopic Cartilage Stiffness Measurement Using Enzymatically Degraded Cartilage Samples. Phys Med Biol. 1999;44:525–535. doi: 10.1088/0031-9155/44/2/017. [DOI] [PubMed] [Google Scholar]
- 17.Lotke PA, Granda JL. Alterations in the Permeability of Articular Cartilage by Proteolytic Enzymes. Arthritis Rheum. 1972;15:302–308. doi: 10.1002/art.1780150312. [DOI] [PubMed] [Google Scholar]
- 18.Bonassar LJ, Frank EH, Murray JC, Paguio CG, Moore VL, Lark MW, Sandy JD, Wu JJ, Eyre DR, Grodzinsky AJ. Changes in Cartilage Composition and Physical Properties Due to Stromelysin Degradation. Arthritis Rheum. 1995;38:173–183. doi: 10.1002/art.1780380205. [DOI] [PubMed] [Google Scholar]
- 19.Zhu W, Mow VC, Koob TJ, Eyre DR. Viscoelastic Shear Properties of Articular Cartilage and the Effects of Glycosidase Treatments. J Orthop Res. 1993;11:771–781. doi: 10.1002/jor.1100110602. [DOI] [PubMed] [Google Scholar]
- 20.Schmidt MB, Mow VC, Chun LE, Eyre DR. Effects of Proteoglycan Extraction on the Tensile Behavior of Articular Cartilage. J Orthop Res. 1990;8:353–363. doi: 10.1002/jor.1100080307. [DOI] [PubMed] [Google Scholar]
- 21.Korhonen RK, Laasanen MS, Toyras J, Lappalainen R, HJ H, Jurvelin Js. Fibril Reinforced Poroelastic Model Predicts Specifically Mechanical Behavior of Normal, Proteoglycan Depleted and Collagen Degraded Articular Cartilage. Journal of Biomechanics. 2003 doi: 10.1016/s0021-9290(03)00069-1. In press. [DOI] [PubMed] [Google Scholar]
- 22.Farndale RW, Sayers CA, Barrett AJ. A Direct Spectrophotometric Microassay for Sulfated Glycosaminoglycans in Cartilage Cultures. Connect Tissue Res. 1982;9:247–248. doi: 10.3109/03008208209160269. [DOI] [PubMed] [Google Scholar]
- 23.Stegeman H, Stalder K. Determination of Hydroxyproline. Clin Chim Acta. 1967;19:267–273. doi: 10.1016/0009-8981(67)90167-2. [DOI] [PubMed] [Google Scholar]
- 24.Williamson AK, Chen AC, Sah RL. Compressive Properties and Function-Composition Relationships of Developing Bovine Articular Cartilage. J Orthop Res. 2001;19:1113–1121. doi: 10.1016/S0736-0266(01)00052-3. [DOI] [PubMed] [Google Scholar]
- 25.Waggett AD, Ralphs JR, Kwan AP, Woodnutt D, Benjamin M. Characterization of Collagens and Proteoglycans at the Insertion of the Human Achilles Tendon. Matrix Biol. 1998;16:457–470. doi: 10.1016/s0945-053x(98)90017-8. [DOI] [PubMed] [Google Scholar]
- 26.Lin W, Shuster S, Maibach HI, Stern R. Patterns of Hyaluronan Staining Are Modified by Fixation Techniques. J Histochem Cytochem. 1997;45:1157–1163. doi: 10.1177/002215549704500813. [DOI] [PubMed] [Google Scholar]
- 27.Huang CY, Mow VC, Ateshian GA. The Role of Flow-Independent Viscoelasticity in the Biphasic Tensile and Compressive Responses of Articular Cartilage. J Biomech Eng. 2001;123:410–417. doi: 10.1115/1.1392316. [DOI] [PubMed] [Google Scholar]
- 28.Krishnan R, Park S, Eckstein F, Ateshian GA. Inhomogeneous Cartilage Properties Enhance Superficial Interstitial Fluid Support and Frictional Properties, but Do Not Provide a Homogeneous State of Stress. J Biomech Eng. 2003;125:569–577. doi: 10.1115/1.1610018. [DOI] [PMC free article] [PubMed] [Google Scholar]
- 29.Toyras J, Rieppo J, Nieminen MT, Helminen HJ, Jurvelin JS. Characterization of Enzymatically Induced Degradation of Articular Cartilage Using High Frequency Ultrasound. Phys Med Biol. 1999;44:2723–2733. doi: 10.1088/0031-9155/44/11/303. [DOI] [PubMed] [Google Scholar]
- 30.Basalo IM, Raj D, Krishnan R, Chen FH, Hung CT, Ateshian GA. Effects of Enzymatic Degradation on the Frictional Response of Articular Cartilage in Stress Relaxation. J Biomech. doi: 10.1016/j.jbiomech.2004.05.045. In Press. [DOI] [PMC free article] [PubMed] [Google Scholar]
- 31.Kwan MK, Lai WM, Mow VC. A Finite Deformation Theory for Cartilage and Other Soft Hydrated Connective Tissues--I. Equilibrium Results. J Biomech. 1990;23:145–155. doi: 10.1016/0021-9290(90)90348-7. [DOI] [PubMed] [Google Scholar]
- 32.Ateshian GA, Warden WH, Kim JJ, Grelsamer RP, Mow VC. Finite Deformation Biphasic Material Properties of Bovine Articular Cartilage from Confined Compression Experiments. J Biomech. 1997;30:1157–1164. doi: 10.1016/s0021-9290(97)85606-0. [DOI] [PubMed] [Google Scholar]
- 33.Oloyede A, Broom N. Complex Nature of Stress inside Loaded Articular Cartilage. Clinical Biomechanics. 1994;9:149–156. doi: 10.1016/0268-0033(94)90014-0. [DOI] [PubMed] [Google Scholar]
- 34.Armstrong CG, Lai WM, Mow VC. An Analysis of the Unconfined Compression of Articular Cartilage. J Biomech Eng. 1984;106:165–173. doi: 10.1115/1.3138475. [DOI] [PubMed] [Google Scholar]