Abstract
During the recognition of soluble antigens B cell receptors (BCR) are known to form signaling clusters that can crucially modulate intracellular activation pathways and B cell response. Little is known about the precise nature of receptor cluster and its formation mechanism for the case of soluble antigens. Initial experiments have shown that B cell receptors first micro-cluster upon ligation with soluble antigens, and then, coarsen into a macroscopic cap structure at one pole of a B cell. Such mutual receptor-receptor attraction can arise locally due to cross-linking by soluble antigens among other possibilities. We develop an energy based Monte Carlo model to investigate the mechanism of B-cell receptor clustering upon ligation with soluble antigens. Our results show that mutual attraction between nearest neighbor receptor pairs can lead to micro-clustering of B cell receptors but it is not sufficient for receptor macro-clustering. A simple model of biased diffusion where BCR molecules experience a biased directed motion towards the largest cluster is then applied, which results in a single macro cluster of receptor molecules. The various types of receptor clusters are analyzed using the developed network-based metrics such as the average distance between any pairs of receptors.
Keywords: B-cell activation, B-cell receptor, receptor clustering, cell signaling, Monte Carlo simulation
INTRODUCTION
Clustering of membrane bound receptor molecules can be taken as a signaling motif that help recognize external stimuli and crucially modulates cellular response through the activation of intracellular signaling pathways.1-3 In immune cells such receptor clustering can be crucial to antigen recognition and immune activation.4-6 In B and T lymphocytes, for example, it has been shown that immune receptors cluster in the form of an immunological synapse pattern during the recognition of membrane bound antigens.7-10 A lot of recent experimental and theoretical efforts have been devoted to elucidate the mechanisms of such pattern formation for the case of membrane-bound antigens.8-16 In contrast, little is known about the mechanism of B cell receptor (BCR) clustering during the recognition of soluble antigens. It is known that B cell receptors cluster in the form of a cap at one pole of a cell during the recognition of soluble antigens.17 It has also been shown that B cell receptors first micro-cluster upon cross-linking by soluble antigens and then at a later stage those micro-clusters coalesce into a large macroscopic cluster in the form of a cap.11 Membrane domains (or rafts) that are enriched in sphingolipids and cholesterol have been implicated in such receptor “capping”.18
Lack of a large number of experimental studies on B cell receptor clustering, during the recognition of soluble antigens, makes its mechanistic exploration challenging. In this article we study a model of BCR clustering that is mediated by mutual attraction between BCR molecules. Such mutual receptor-receptor attraction can arise due to antigen cross-linking, increased raft association of BCRs upon antigen binding, or by some other biophysical mechanisms. 11, 19-21 We use an energy-function based Monte Carlo algorithm to study receptor clustering due to mutual attraction between receptors. We vary the strength of the attractive interaction as well as the density of molecules in our simulations. Nearest neighbor attraction among receptors placed on a square lattice is shown to be enough for receptor micro-clustering. Very high density of receptors also leads to receptor macro-clustering but such high receptor density may not be physiological. We simulate a mechanism of directed diffusion where BCR molecules move towards the largest micro-cluster with a diffusion bias. Such biased diffusion readily macro-cluster B cells receptors as seen in cap formation.
Based on the spatial organization of receptors networks on the cell surface we develop some quantitative criteria to characterize different types of B cell receptor clustering. We first consider the average pair wise distance among all the receptors, which shows some simple functional relationship with the number of receptors for the extreme cases of receptor random distribution and receptor macro-clustering. An alternative metric, which is based on the total number of nearest neighbor receptor pairs, also shows simple scaling with the total number of receptors. Our Monte Carlo simulations verify the receptor network based quantitative relations, which are derived using simple geometrical arguments.
METHODS
We carry out energy-based Monte Carlo simulations to model mutual receptor-receptor attraction on B cell surface. The total energy (Hamiltonian) of the system is given by
S can take two values 0 (no receptor) and 1 (receptor occupied). (i,j) are nearest neighbor sites for which mutual receptor attractions are considered. The constant parameter K in the energy function represents the strength of an attractive interaction that is varied in our simulations. A total of four/eight neighboring sites are included in evaluating the energy.3
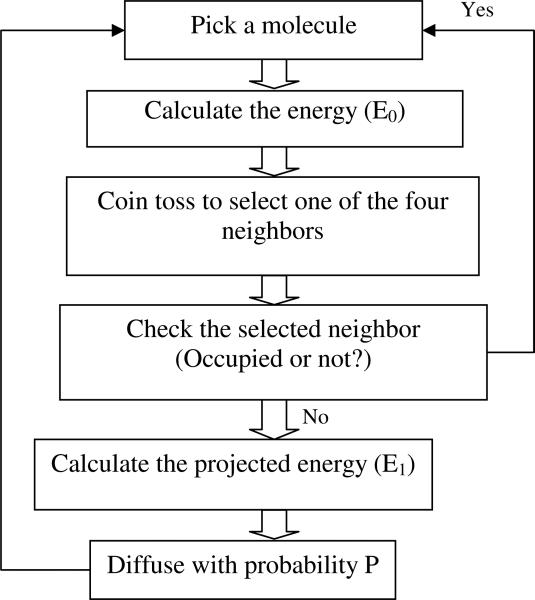
Initially the cell receptor molecules are placed randomly on a cell surface. We pick up a molecule randomly on the cell surface and attempt a diffuse move to any of the four neighboring sites. In each Monte Carlo move, neighboring sites of a molecule are chosen with equal probability and a diffusion move can be made only when the chosen site is not already occupied by another molecule. Finally, the diffusion move to a new neighboring site is accepted with an energy-based criterion (as depicted in Figure 1). One Monte Carlo time step consists of N repeated single molecule moves where N is the total number of molecules.
Figure 1.
Flow chart depicting the used Monte Carlo algorithm
When a receptor is moved to a new site with a bigger number of neighboring receptors the total energy is lowered and such a move is preferred. When we used Metropolis algorithm with probability (P) = min (1, eβ*ΔE), it showed little or no micro-clustering for a long time. This happen as most diffusion moves in this Metropolis scheme do not result in an increase in the number of neighbor receptors thus making the algorithm slow to reach a micro-clustered state. To remedy this problem we devised a novel energy-based scheme that can make the system move faster to equilibrium configurations. In this proposed algorithm, we sampled the energy landscape with Monte Carlo moves that gives a higher weight to moves that decreases the energy more. Thus diffusion moves that result in bigger change in energy is preferred. In this scheme, molecules are moved to a new position with a probability max (0, e½*βΔE/ e½*βΔEmax). This proposed Monte Carlo algorithm satisfies the dual criteria of ergodicity and detailed balance.22 This Monte Carlo scheme also satisfies the detailed balance condition
Hence, the move that leads to the maximum lowering in energy is performed with probability 1 thus it is the most preferred move in this algorithm. Other moves are carried out with probability smaller than 1 and depends on the change in energy of the system. Diffusion moves that will result in zero energy change will also be carried out with a probability lower than 1 (scaled by Emax).
RESULTS
Mutual receptor-receptor attraction leads to receptor micro-clustering
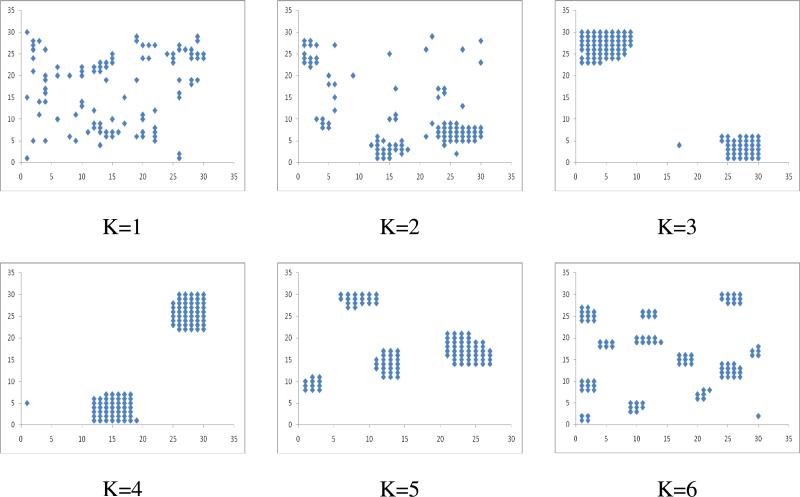
Mutual attraction among neighboring B cell receptors can arise due to antigen cross-linking, increased raft association upon antigen ligation, and other factors. We have simulated mutual attraction using a simple energy function given in the methods section. The interaction energy is varied by changing the constant parameter K in the energy function. Receptor micro-clustering is observed for a wide range of parameter values and receptor concentrations. All the simulations were performed for 108 time MC steps.
When we vary the K value for various receptor concentrations, lower K values did not lead to considerable micro clustering. For high K values (K≥2), we observed small numbers of micro clusters formed due to the intrinsic attractions among the receptor molecules (Figures 2, S1 (supporting information)). Although, at K=1 small micro clusters of 4-5 molecules are formed, they are transient in nature (Figure S1). Qualitatively similar results are also obtained with eight neighboring nodes (Figures S4). Interestingly for K=3 considering 4 neighboring nodes (Figure S2c) and at K=2 considering 8 neighboring nodes (Figures S4b), a single macro cluster of receptor molecules is formed irrespective of the receptor concentration in most repeats (trials) of our MC simulations. Thus considering 4 neighboring nodes, K=3 might be an optimal attraction energy that can lead to the formation of a very few large-macro-clusters. Below that attractive interaction strength, receptors attraction is too weak for a few large macro-clusters to form that is stable over a long time. Above that value of the attractive interaction parameter, strong attraction among receptors within micro-clusters will make the micro-clusters quite stable over a long time so that the system is stuck in a meta-stable state of micro-clustered receptors.
Figure 2.
Micro-clustering of 100 cell receptor molecules with various K values in the lattice of 30 and after 108 Monte Carlo time steps (N=100; L=30; T=108).
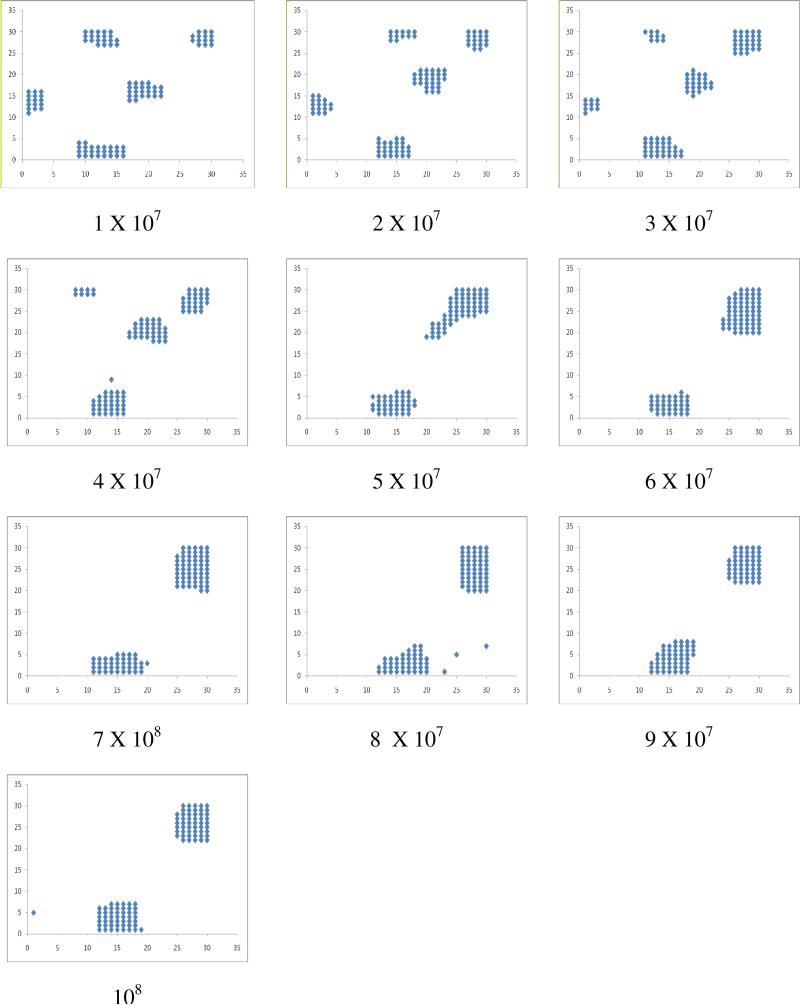
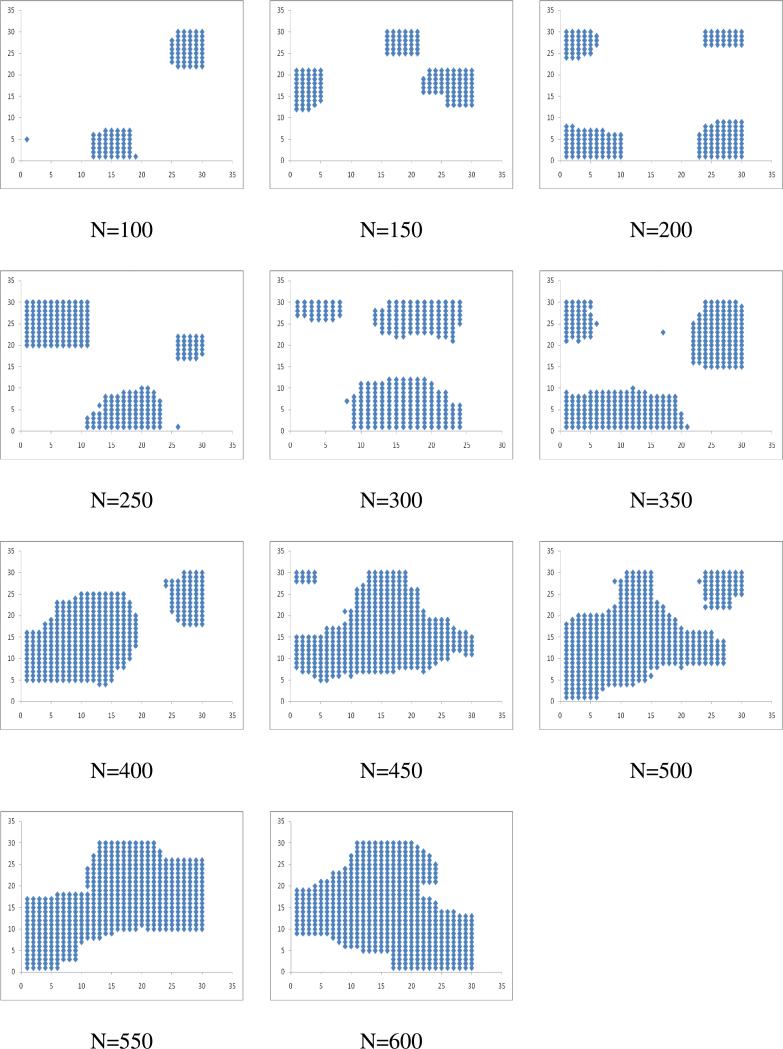
We report all the simulations obtained at K=4 to understand the effect of receptor concentration. The micro clusters once formed are stable over time as depicted in Figure 3. With the increase of 107 time steps for N=100 and L=30, initially formed 5 micro clusters merged into two micro clusters at 5 X 10⁷ time steps and they are stable till the end of simulation. With the increase in the number of receptor molecules, the micro clusters grow in size by accommodating increasingly larger number of receptor molecules (Figure 4). When the receptor density is low, it leads to the micro clustering. However, when we gradually increase the concentration of receptor molecules, fewer numbers of micro clusters formed with increasing size and beyond a threshold concentration, a single macro cluster is formed. We also tested the nature of clustering with the increasing size of lattice from 15-75 for a give receptor number (N=100) at different K values varied from 1 to 4. Results in this study were similar to that observed when we increased the number of receptors keeping the lattice size fixed.
Figure 3.
Snapshots of the receptor molecules at the regular time intervals (1 X 10⁷ time steps) of the clustering simulations (N=100; L=30; T=108; K=4).
Figure 4.
Snapshots of micro-clustering for various sets of receptor concentrations increasing the number of receptor molecules from 100 to 600 (L=30; T=108; K=4).
For very high receptor concentration local attraction between receptors can lead to receptor aggregation in a large macro-cluster. However, such high receptor concentration may not be physiological. The radius of a typical B cell is 6 microns and its surface area is 452.57 micron2. The approximate number of B cell receptors per cell is 105. Each micron2 surface area can have 221 molecules. We considered a grid of length 0.3 micron (area: 0.9 micron2) with the grid spacing of 0.01microns. Hence the approximate physiological concentration would be ~200 molecules on the full lattice.12 Hence directed transport based mechanism is necessary for clustering on a larger scale.
Directed bias towards the largest micro-cluster leads to receptor macro-clustering
Mutual attraction among neighboring receptors may not be not enough to create macro-clustering of B cell receptors such as seen in cap formations. We do not consider receptor attraction between receptor pairs that are spatially separated by large distances as we do not find any direct biological mechanisms for such long-range attractions. Directed bias has been implicated in receptor clustering in the form of immune synapses in the case of T and B cells.23-24 In those studies, for the case of membrane bound antigens receptor diffusion is thought to be biased towards the cell-cell contact region. In the case of soluble antigens there is no cell-cell contact point and thus no such obvious preferred region towards which receptors would diffuse in a directed manner. This poses a challenge in selecting a direction for biased diffusion of B cell receptors. We assume that the largest micro-cluster that is formed at early times would trigger strongest signaling inside a B cell and thus induce a directed transport towards that largest cluster. When we introduced such a biased diffusion toward the largest cluster receptors aggregated in the form of a large micro-cluster (Figure S3).
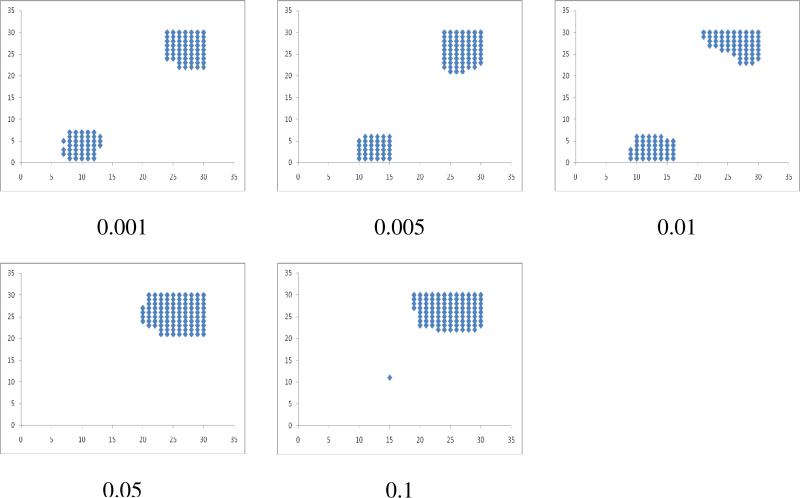
We also varied the probability (Pbias) with which the small micro clusters move towards largest micro cluster. As depicted in Figure 5, for N=100 and L=30 when Pbias is less than 0.05, there was no macro clustering observed even if we run the simulation for a long time of 108 time steps. The minimum probability required for the formation of macro cluster depends on the receptor concentration.
Figure 5.
Snapshots of mirco/macro clustering at different probabilities of diffusion (Pbias) for directed diffusion (N=100; L=30; T=108; K=4).
Network based criterion to characterize receptor micro- and macro- clustering
Spatial organization of B cell receptors on the cell surface can be considered as a dynamic network of receptors that changes during the course of receptor clustering and pattern formation. We show how a network-based metric can be used to quantitatively characterize various forms of receptor clustering: (i) random and uniform distribution of receptors, (ii) receptor micro-clustering, and (iii) receptor macro-clustering.
Average Distance Between Any Two-Receptor Pairs
We propose that the average distance between any two pairs of receptors can be taken as a measure of receptor clustering. We derive two simple scaling relations for the two extreme cases (i) and (iii). The intermediate micro-clustering is found to be a linear combination of the two extreme cases. Clearly, receptor macro-clustering (from an initial random distribution) would decrease the average distance between pairs of receptors rendering this a quantitative measure of clustering. Interestingly, this average inter-pair distance also shows a simple scaling relation in terms of number of receptor molecules but it is independent of other details such as the affinity of antigens.
(i) Random distribution of receptors: We can approximate the random receptor distribution as if the molecules are placed on a fully occupied two-dimensional square (Euclidean) lattice. The average separation distance between two neighboring receptors gives the node-to-node distance. In this approximation, the average distance between pairs of receptors is proportional to the lattice size L.25
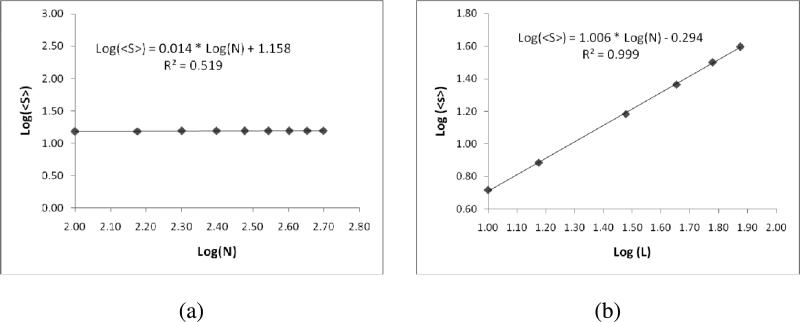
Hence, the average separation distance does not decrease with an increase in the number of molecules. This is explained as decrease in distance between neighboring receptors due to an increase in the number of molecules is compensated by increase in number of molecules that are separated by large distances. However, any increase in system size L, i.e., the cell surface area on which receptors are clustered will lead to an increase in the average separation distance between receptor pairs. This is verified in our simulations as shown in Figure 6. (a) When the lattice size is fixed at 30 and increase the number of molecules from 100 to 500, the average inter-pair distance <S> did not depend on the number of molecules. (b) Whereas when the number of molecules is fixed at 100 and the lattice size is varied from 15-75, we observed the linear relationship between the average inter-pair distance and the lattice size with a slope value of 1.006±0.0117.
Figure 6.
The plot depicting the change of average inter-pair distance <S> with the (a) change in the number of receptor molecules when lattice size is 30 (b) with the lattice size when the number of molecules is 100.
(ii) Receptor micro-clustering: This is an intermediate state of clustering where a set of receptor clusters are developed each containing a few receptor molecules. An approximate estimation for cases with a small number of micro-clusters (2-3) shows the average inter-pair distance <S> to be a linear combination of two extreme cases of receptor clustering. (iii) Receptor macro-clustering: In this case we can again assume that the molecules are placed on a fully occupied two-dimensional square (Euclidean) lattice. However, the size of this occupied lattice increases with an increase in the number of molecules as the clustering is limited by an intrinsic cut-off distance l0 for neighboring receptor molecules. Physical exclusion of two B cell receptor molecules will set this cut-off distance l0. In this regime of macro-clustering the average distance between any pairs of receptors is given by
Thus the proposed metric shows a power-law increase with the number of receptor molecules. To check the validity of our results we varied the number of receptor molecules in our simulations.
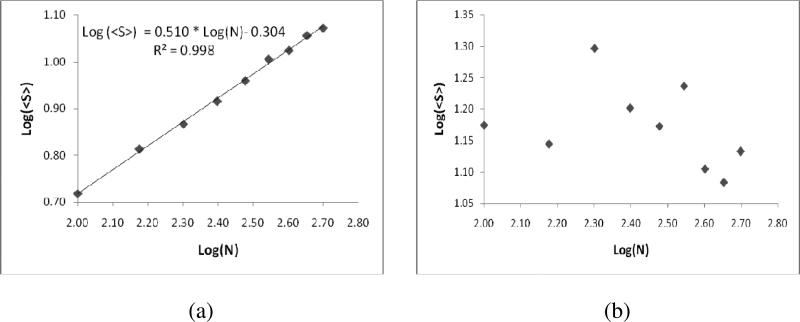
Once the macro clusters are obtained from micro clusters due to biased diffusion, the average inter-pair distance (<S>) is plotted against the number of molecules (Figure 7 (a)), and observed that <S> is directly proportional to the square root of number of receptor molecules. The graph plotted on a log-scale confirms the power-law increase with an exponent of alpha = 0.510± 0.0138 (Figure 7 (a)). Even though we develop this network based metric of receptor clustering to specifically describe clustering of BCRs, the scaling relations obtained do not depend on the details of the system such as the antigen affinity. The average inter-pair distance <S> could not capture the micro-clustering as depicted in Figure 7(b). So we introduce a different measure which could capture the quantitative estimation of both macro and micro clustering.
Figure 7.
The plot depicting the change of average inter-pair distance <S> with the number of receptor molecules, when the receptor molecules are (a) macro clustered (b) micro clustered.
Number of Adjacent Pairs <P>
The number of adjacent molecular pairs also shows a simple scaling relation in terms of the number of molecules. As mentioned before we can assume that the molecules are placed on a fully occupied two-dimensional square (Euclidean) lattice of size n. The number of molecular pairs, except for the pairs where both molecules are residing on the boundary, is given by 2(n-2)(n-1). Number of molecular pairs at the boundary is 4(n-1). Hence, the total number of pairs is given by 2(n-2)(n-1) + 4(n-1) = 2(n2 – n) = 2(N – N1/2). N is the total number of molecules thus N = n2.
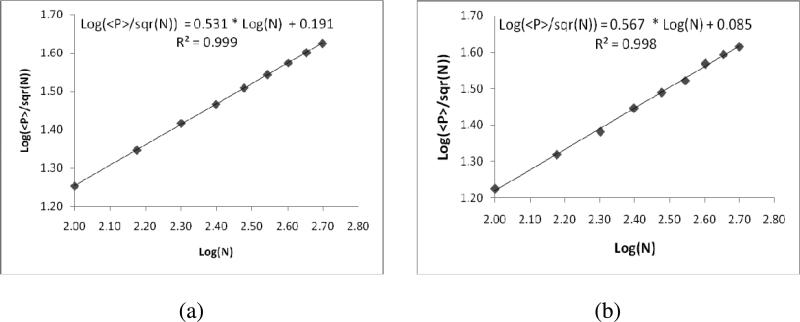
The same is observed from our simulations when we plotted <P>/Sqrt (N) against the number of receptor molecules on logarithmic scale (Figure 8), in case of macro clustering a linear relationship with a slope of 0.531±0.005 is obtained. Similarly, for micro clustering also, a linear curve is obtained with a slope value of 0.567±0.011.
Figure 8.
The plot depicting the change of adjacent number of pairs (<P>) with the number of receptor molecules, when the receptor molecules are (a) macro clustered (b) micro clustered.
DISCUSSION
In the present study, we have developed a simple model of B cell receptor clustering that occurs due to intrinsic attractions between spatially close receptor pairs and an additional late-time biased diffusion. A more detailed model with explicit cross-linking of B cell receptors by multivalent antigens is currently under investigation. In order to study receptor clustering in our effective mutual receptor attraction model, we developed a novel energy function based Monte Carlo technique. This proposed algorithm is biased towards large energy change moves so that the receptors clusters in a reasonable simulation time scale. The Monte Carlo study demonstrates the formation mechanism of the micro clusters as we vary the strength of receptor-receptor attraction as well as the receptors / antigen density.
However, microclusters formed due to such receptor-receptor attractions do not coarsen into a large macrocluster except for very specific parameter values such as very high antigen concentrations. When the formed micro clusters are directed towards the largest micro cluster it leads to a cap formation (macro cluster). Even though formation of a receptor macro cluster under biased diffusion directed towards a specific region on the cell surface is somewhat obvious, the initial choice of that preferred location on a spherically symmetric cell surface is far from being obvious. For the case of receptor clustering at the intracellular junction, between two cells in contact, the obvious choice for directed transport is the cell-cell contact region. In contrast, for receptor clustering in B cells, upon ligation with soluble antigens, the preferred location of receptor transport is difficult to determine, especially due to lack of suitable experimental studies.11 We are currently exploring different possible mechanisms of directed diffusion using the above-mentioned detailed model of BCR clustering that simulates BCR cross-linking by multivalent antigens.
The designed receptor-network based measures: (a) average distance between receptor pairs <S> and (b) number of adjacent Pairs <P> could effectively yield quantitative estimates for different types of receptor clustering. The same network-based measures can be used to analyze experimental data on B cell receptor clustering that could thus connect experimental results with our computational studies. Imaging studies could yield position information B cell receptors on the cell surface in a dynamic manner as they organize into clusters. Such position information can be used to estimate both average distance and number of adjacent pairs. In addition, recent FRET experiments that used either (i) Ig-α GFP and Ig-β YFP or (ii) Ig-α GFP and Ig-α YFP can both indicate receptor clustering and can be well correlated with the number of adjacent pairs of receptors calculated in our theoretical modeling study.
Supplementary Material
Acknowledgment
SR acknowledges support from National Institutes of Health grant AI074022.
Footnotes
Supporting Information Available. The results obtained with different binding strength values (K), and considering the 8 neighboring nodes are reported in supporting information. This information is available free of charge via the Internet at http://pubs.acs.org
References
- 1.Ashkenazi A, Dixit VM. Science. 1998;281:1305. doi: 10.1126/science.281.5381.1305. [DOI] [PubMed] [Google Scholar]
- 2.Humphries MJ. Curr. Opin. Cell. Biol. 1996;8:632. doi: 10.1016/s0955-0674(96)80104-9. [DOI] [PubMed] [Google Scholar]
- 3.Guo C, Levine H. Biophysical Journal. 1999;77:2358. doi: 10.1016/S0006-3495(99)77073-6. [DOI] [PMC free article] [PubMed] [Google Scholar]
- 4.Unanue ER, Karnovsky MJ. J Exp. Med. 1974;140:1207. doi: 10.1084/jem.140.5.1207. [DOI] [PMC free article] [PubMed] [Google Scholar]
- 5.Schamel WW, Reth M. Adv. Exp. Med. Biol. 2008;640:64. doi: 10.1007/978-0-387-09789-3_6. [DOI] [PubMed] [Google Scholar]
- 6.Yokosuka T, Saito T. Immunol. Rev. 2009;229:27. doi: 10.1111/j.1600-065X.2009.00779.x. [DOI] [PubMed] [Google Scholar]
- 7.Monks CR, Freiberg BA, Kupfer H, Sciaky N, Kupfer A. Nature. 1998;395:82. [PubMed] [Google Scholar]
- 8.Grakoui, Bromley SK, Sumen C, Davis MM, Shaw AS, Allen PM, Dustin ML. Science. 1999;285:221. [Google Scholar]
- 9.Batista FD, Iber D, Neuberger MS. Nature. 2001;411:489. doi: 10.1038/35078099. [DOI] [PubMed] [Google Scholar]
- 10.Batista FD, Harwood NE. Nat. Rev. Immunol. 2009;9:15. doi: 10.1038/nri2454. [DOI] [PubMed] [Google Scholar]
- 11.Tolar P, Sohn HW, Pierce SK. Immunol. Rev. 2008;221:64. doi: 10.1111/j.1600-065X.2008.00583.x. [DOI] [PubMed] [Google Scholar]
- 12.a Tsourkas PK, Longo ML, Raychaudhuri S. Biophysical Journal. 2008;95:1118. doi: 10.1529/biophysj.107.122564. [DOI] [PMC free article] [PubMed] [Google Scholar]; b Tsourkas PK, Baumgarth N, Simon SI, Raychaudhuri S. Biophysical Journal. 2007;92:4196. doi: 10.1529/biophysj.106.094995. [DOI] [PMC free article] [PubMed] [Google Scholar]
- 13.Treanor B, Batista FD. Curr. Opin. Immunol. 2007;19:476. doi: 10.1016/j.coi.2007.05.009. [DOI] [PubMed] [Google Scholar]
- 14.Dustin ML. Immunity. 2009;30:482. doi: 10.1016/j.immuni.2009.03.010. [DOI] [PMC free article] [PubMed] [Google Scholar]
- 15.Goldstein B, Faeder JR, Hlavacek WS. Nat. Rev. Immunol. 2004;4:445–56. doi: 10.1038/nri1374. [DOI] [PubMed] [Google Scholar]
- 16.Schreiner GF, Fujiwara K, Pollard TD, Unanue ER. J. Exp Med. 1977;145:1393. doi: 10.1084/jem.145.5.1393. [DOI] [PMC free article] [PubMed] [Google Scholar]
- 17.Dykstra M, Cherukuri A, Sohn HW, Tzeng S-J, Pierce SK. Annu. Rev. Immunol. 2003;21:457. doi: 10.1146/annurev.immunol.21.120601.141021. [DOI] [PubMed] [Google Scholar]
- 18.Schmidt C, Kim D, Ippolito GC, Naqvi HR, Probst L, Mathur S, Rosas-Acosta G, Wilson VG, Oldham AL, Poenie M, Webb CF, Tucker PW. EMBO J. 2009;28:711. doi: 10.1038/emboj.2009.20. [DOI] [PMC free article] [PubMed] [Google Scholar]
- 19.Depoil D, Fleire S, Treanor BL, Weber M, Harwood NE, Marchbank KL, Tybulewicz VLJ, Batista FD. Nat.Immnology. 2008;9:63. doi: 10.1038/ni1547. [DOI] [PubMed] [Google Scholar]
- 20.Tolar P, Hanna J, Krueger PD, Pierce SK. Immunity. 2009;30:44. doi: 10.1016/j.immuni.2008.11.007. [DOI] [PMC free article] [PubMed] [Google Scholar]
- 21.Sohn HW, Tolar P, Jin T, Pierce SK. Proc. Natl. Acad. Sci. USA. 2006;103:8143. doi: 10.1073/pnas.0509858103. [DOI] [PMC free article] [PubMed] [Google Scholar]
- 22.Newman MEJ, Barkema GT. Oxford University Press; USA: 1999. [Google Scholar]
- 23.Wulfing C, Davis MM. Science. 1998;282:2266. doi: 10.1126/science.282.5397.2266. [DOI] [PubMed] [Google Scholar]
- 24.Fleire SJ, Goldman JP, Carrasco YR, Weber M, Bray D, Batista FD. Science. 2006;312:738. doi: 10.1126/science.1123940. [DOI] [PubMed] [Google Scholar]
- 25.Newman MEJ. J. Stat. Phys. 2000;101:819. [Google Scholar]
Associated Data
This section collects any data citations, data availability statements, or supplementary materials included in this article.


