

Abstract
We describe a general methodology for designing an empirical scoring function and provide smina, a version of AutoDock Vina specially optimized to support high-throughput scoring and user-specified custom scoring functions. Using our general method, the unique capabilities of smina, a set of default interaction terms from AutoDock Vina, and the CSAR (Community Structure-Activity Resource) 2010 dataset, we created a custom scoring function and evaluated it in the context of the CSAR 2011 benchmarking exercise. We find that our custom scoring function does a better job sampling low RMSD poses when crossdocking compared to the default AutoDock Vina scoring function. The design and application of our method and scoring function reveal several insights into possible improvements and the remaining challenges when scoring and ranking putative ligands.
Introduction
A scoring function that accurately represents and predicts ligand-protein interactions is necessary for molecular docking, energy minimization, molecular dynamics simulations, and hit identification/lead optimization in structure-based drug discovery. 1–9 Docking is a common method of structure-based virtual screening that seeks to predict the orientation and conformation, or pose, of a ligand within a protein receptor. 4–16 A central limitation of docking is the long-standing and unsolved problem of scoring: accurately predicting the binding affinity of a small molecule from receptor-ligand interactions. 3,9,17–20
Docking can conceptually be broken down into two main challenges. The first is sampling the correct pose of the molecule and the second is correctly ranking and selecting the correct pose (scoring). There are a number of methods for sampling that can rapidly explore the conformational space of the small molecule, 5,6 but as the amount of flexibility in the ligand and the receptor increases, the complexity of sampling increases exponentially. Scoring functions are used both to guide sampling and to rank the sampled poses. For instance, the scores of putative poses may guide a Monte Carlo sampling method, as with AutoDock Vina, 10 or determine the fitness of a population in a genetic algorithm, as with AutoDock 4. 21 In any case, an accurate scoring function is required to successfully rank and select the sampled poses.
The form and parametrization of scoring functions varies widely across implementations. Force-field based scoring functions 7,22–27 seek to quantify the actual molecular forces that exist between a protein and a small molecule. Van der Waals interactions, electrostatic interactions, and hydrogen bonding interactions are common components of force-field based scoring functions. These terms are ideally parametrized from first principles. Force-field scoring functions are often designed for use in molecular dynamics simulations 23–26 and may require explicit treatment of water or an implicit solvent model. 28
Knowledge-based scoring functions 29–33 seek to derive simplified potentials directly from databases of structural data. For example, the PMF 30 scoring function consists of a pairwise summation over all the atom-type specific interactions between the protein and ligand. This approach seeks to approximate complex, difficult to characterize physical interactions using large numbers of simple terms. However, the resulting scoring function lacks an immediate physical interpretation, and the large number of terms increases the risk of overfitting, necessitating a rigorous validation protocol.34,35
Empirical scoring functions 36–40 incorporate elements of both force-field based and knowledge-based scoring functions. They consist of physically meaningful terms that are parameterized to reproduce binding affinities or binding poses. Empirical scoring functions may have similar terms to force-field based scoring functions, and they may also contain more complex, heuristic, terms, such as hydrophobic and desolvation interactions, that are not easily addressed by force-field based scoring functions. Empirical scoring functions are typically trained on a set of selected cocrystal structures with known binding affinities, and their tunable parameters are fit to the data using techniques such as linear regression. Like knowledge-based scoring functions, the performance of empirical scoring functions depends upon, and improves with, the quantity and quality of the training data. Empirical scoring functions are typically less prone to overfitting due to the constraints imposed by the physical terms and can provide insight into the individual contributions of different molecular interactions to binding affinity.
No matter the goal, be it affinity prediction, pose prediction, or discrimination of binders and non-binders, one must have high quality structural and affinity training data in order to develop and validate a scoring function. The Community Structure-Activity Resource (CSAR) is a response to this need (http://csardock.org). The 2010 CSAR benchmark exercise resulted in the creation of the CSAR-NRC HiQ 2010 dataset. 41 This high-quality dataset consists of 343 curated structures from the Binding MOAD 42 database. We developed an empirical scoring function for docking and scoring using this dataset and submitted the results for evaluation in the 2011 CSAR benchmark exercise.
Methods
Using the CSAR-NRC HiQ 2010 dataset, 41 we designed and implemented a custom empirical scoring function within smina. The workflow for the design of our scoring function is shown in Figure 1.
Figure 1.

The design process for our empirical scoring functions. A variety of features computed by AutoDock Vina were evaluated for both crystal and docked training structures. Clustered cross-validation, where complexes with high sequence identity are not split between the training and test sets, is used to drive feature selection. The selected features are then used to train a linear regression model on the entire training set.
smina
We used smina to design our custom scoring function. We created smina as a fork of AutoDock Vina10 to provide enhanced support for minimization and scoring. It is available under a GPL2 license at http://smina.sf.net. AutoDock Vina provides an open source, modular, and easy to modify code base. To create smina we have modified the source code to support custom scoring functions and improve the performance of scoring and minimization workflows. For instance, smina can automatically calculate partial charges of ligands using OpenBabel, 43 process multi-conformer files, such as sdf files, is 10–20x faster when minimizing large sets of ligands, and supports user-specified scoring functions. We are continuing to work on smina to improve the robustness and performance of the minimization algorithms and provide additional options for custom scoring function development.
Training Dataset
We used the CSAR-NRC HiQ 2010 dataset 41 to cross-validate and train our scoring function. These structures comprise 208 distinct protein families, as determined by a 90% sequence identity threshold. OpenBabel 43 version 2.3.1 was used to convert between file formats. Protein and ligand structures are preprocessed with the prepare_receptor4.py and prepare_ligand4.py scripts from AutoDock Tools 21 to compute partial charges and protonation states. The provided “pK” affinity values were used for training.
We prepared two sets of structures for training from the CSAR 2010 dataset. The crystal training set consists of crystal structures taken directly from the CSAR 2010 dataset. The docked training set consists of docked structures. To create these docked structures, we regenerated each ligand conformation from a SMILES string using OpenEye omega44 and re-docked the ligand to the receptor using smina, which performs equivalently to AutoDock Vina, with the options --exhaustiveness=32 --seed=0. The axis-aligned box used for docking was centered around the bound ligand pose with each dimension extended 8Å from the ligand with a minimum length of 22.5Å for each dimension. Of the nine poses returned by smina, we retain the pose that is the closest, as measured by the heavy-atom root mean squared deviation (RMSD), to the crystal ligand pose.
This process resulted in 293 docked structures where the docked ligand was within 2Å RMSD of the crystal pose. We created this training set of docked structures since we felt that these imperfect poses, which are minimized with respect to the default Vina energy function, might be a better representation of the prospective docked structures we ultimately wanted to score. In order to maintain consistency between the two training sets, we only included the corresponding set of 293 structures in the crystal training set.
Interaction Terms
The default AutoDock Vina scoring function was trained to simultaneously optimize pose prediction, affinity prediction, and speed. 10 It consists of three steric terms, a hydrogen bond term, a hydrophobic term, and a torsion count factor. However, a larger space of energetic terms were considered in the design of AutoDock Vina and these terms remain accessible within the source code. These terms are shown in Figure 2. In addition to the Gaussian, repulsion, hydrogen bonding, and hydrophobic terms that compose the default scoring function, there are an assortment of simple property counts, an electrostatic term, an AutoDock 4 desolvation term, 45 a non-hydrophobic contact term, and a Lennard-Jones 4–8 van der Waals term. For scoring purposes, only heavy atom interactions between the ligand and protein are considered (when docking, intra-molecular heavy-atom interactions are also used). All these terms are made available and fully parameterizable in smina. In the design of our custom scoring function we considered these terms and their pre-existing parameterizations, shown in Table 1, for a total of 58 distinct terms. The goal of our training protocol is to identify the most useful linear combination of these terms.
Figure 2.

The interaction terms implemented in AutoDock Vina. d is the distance between two atoms, a1 and a2. dopt(a1, a2) is the optimal distance between atoms (the sum of the van der Waals radii). ddiff (a1, a2) is d − dopt (a1, a2). o, w, x, b, and q are parameters that are varied as shown in Table 1 to produce different terms. o offsets the optimal position of the term. w specifies the width of a Gaussian. x is the exponent of the electrostatic term. b specifies where the piecewise linear terms become zero. q determines to what extent the desolvation term is charge dependent.
Table 1.
Parameter values for the distant dependent AutoDock Vina terms shown in Figure 2. These values are those corresponding to the 58 terms already defined within the AutoDock Vina source code.
| Term | Parameters | Values |
|---|---|---|
| gauss | o, w | (0,0.3), (0.5,0.3), (1,0.3), (1.5,0.3), (2,0.3), (2.5,0.3), (0,0.5), (1,0.5), (2,0.5), (0,0.7), (1,0.7), (2,0.7), (0,0.9), (1,0.9), (2,0.9), (3,0.9), (0,1.5), (1,1.5), (2,1.5), (3,1.5), (4,1.5), (0,2), (1,2), (2,2), (3,2), (4,2), (0,3), (1,3), (2,3), (3,3), (4,3) |
| repulsion | o | 0.4, 0.2, 0, −0.2, −0.4, −0.6, −0.8, −1 |
| electrostatic | x | 1, 2 |
| hydrogen_bond | b | 0, 0.2, 0.4 |
| hydrophobic | b | 1, 1.5, 2, 3 |
| ad4_solvation | q | 0, 0.01097 |
Training Protocol
Our training protocol is implemented as RapidMiner 46 workflows which are included in the Supplementary Materials.
Although we ultimately trained our empirical scoring function on the entire set of 293 structures from the CSAR 2010 dataset, in order to properly parameterize the scoring function and gain an estimate of its accuracy, we used clustered cross-validation. Cross-validation assesses the accuracy of a model by training the model on a subset of the data and then evaluating it on the remaining data. With clustered cross-validation, we clustered targets in the CSAR set by 90% sequence identity and partitioned these clusters into a training set and test set. We also considered a more typical bootstrapping cross-validation where structures are randomly selected (with replacement) to make up the training set. In both cases we constructed a training set that is approximately 2/3 the size of the full set. This process is repeated 100 times with different random selections of clusters/structures.
For a given set of interaction terms, we used linear regression to fit coefficients to these terms. We evaluated the performance of a scoring function using the Pearson correlation coefficient (R) between the predicted affinities and the experimental affinities. The performance of clustered cross-validation, Rccv, is the average of all 100 test set correlations. We observed similar trends and feature selections when the root mean square error (RMSE) of the affinity predictions was used instead of correlation (data not shown).
We combined our cross-validation procedure with forward selection to identify the smallest set of informative interaction terms for our scoring function. Forward selection is an iterative greedy algorithm where terms are added one at a time to the scoring function based on their performance. The first term selected is the single term that maximizes the correlation, the next term is the term that when combined with the first term produces the maximum correlation, and so on. The effect on the performance of the scoring function as terms are added is shown in Figure 3. We show the performance of forward selection when selecting and evaluating terms using full regression, bootstrap cross-validation, and clustered cross-validation. The performance of the full linear regression can only increase as more terms are added, but cross-validation performance levels off after five terms and then decreases, indicating that more terms only overfit the data. Unlike previous efforts,34 we do not observe a large over-estimate in performance using bootstrap cross-validation instead of clustered cross-validation. We suspect the similarity between the two cross-validations is due to the diverse nature of the CSAR 2010 training set: there is only one cluster (HIV proteases) of structures with more than 10 members. Nonetheless, we suspect the larger errors computed using clustered cross-validation provide a more realistic estimate of the predictive capabilities of the model and we use Rccv as our primary means of assessing the predictive properties of a model.
Figure 3.
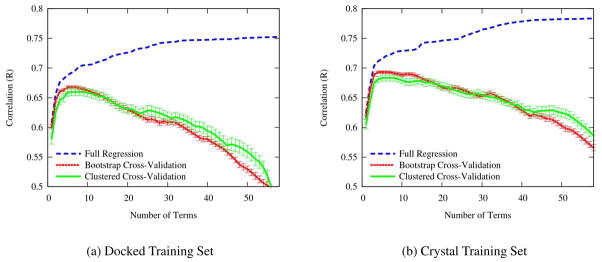
The change in the Pearson correlation as more features are added to the scoring function using forward selection. Cross-validations are shown with the standard error of the mean. Although the correlation of the full regression can only improve as more terms are added, cross-validation performance levels off after five terms, indicating that additional terms overfit the data.
Unsurprisingly, using crystal structures (Figure 3(b)) as opposed to docked structures (Figure 3(a)) results in slightly higher values of Rccv. The docked structures provide a noisier training set since the structures are not necessarily ideally positioned, but these structures are also a better representation of the quality of structure the scoring function will be required to properly rank. Consequently, it is reassuring that there is not a large difference in Rccv between the docked and crystal sets. The peak Rccv on crystal structures is 0.683 using five terms. This compares favorably with the results of the original CSAR 2010 exercise 8 where only two out of seventeen scoring function achieved a higher correlation, although all but the lowest ranked scoring functions have overlapping 95% confidence intervals.
Scoring Function
The first five terms identified by forward selection are shown in Table 2. The coefficients for these terms when simultaneously fit to the full training set are shown in Table 3(a). The first and most significant term is a steric Gaussian that rewards shape complementarity. The term selected using docked structures features an offset of 1.5Å while the crystal selected term has an offset of 1.0Å. Both terms prefer a narrow width of 0.3Å. The preference for an offset indicates that, empirically, the ideal distance between ligand and protein atoms is at least 1Å farther than the sum of the van der Waals radii. This is somewhat surprising given that the docked structures are minimized with respect to the default Vina scoring function where the steric terms have no offset. This may indicate a need to reparameterize the default van der Waals radii. Alternatively, this introduced offset may be indicative of the inherent approximation of using implicit hydrogens.
Table 2.
The results of forward selection and manual selection of scoring function terms. The average clustered cross-validation (Rccv) is shown as a measure of performance. Correlations are shown as terms are added to the scoring function.
| Forward Selection with Rccv | Manual Selection | ||||||
|---|---|---|---|---|---|---|---|
| Docked Structures | Crystal Structures | Term | Docked Rccv | Crystal Rccv | |||
| Term | Rccv | Term | Rccv | ||||
| 1 | gauss(o=1.5,w=0.3) | 0.581 | gauss(o=1,w=0.3) | 0.605 | vdw | 0.579 | 0.588 |
| 2 | ad4_solvation(q=1) | 0.626 | ad4_solvation(q=1) | 0.643 | ad4_solvation(q=1) | 0.623 | 0.638 |
| 3 | repulsion(o=0.4) | 0.646 | repulsion(o=−0.4) | 0.675 | hydrogen_bond(b=0) | 0.625 | 0.640 |
| 4 | #torsions2 | 0.650 | #torsions2 | 0.680 | #torsions2 | 0.642 | 0.657 |
| 5 | #hydrophobic_atoms | 0.659 | #hydrophobic_atoms | 0.683 | — | — | — |
Table 3.
Coefficients of terms when fit using linear regression to the entire CSAR training set for (a) terms choosen by forward selection and for (b) the manually optimized terms. Terms are shown with the sign of typical values. Coefficients were trained against pK binding affinities so larger, more positive values are desirable. For instance, negative vdw values are preferred and the corresponding coefficient is also negative resulting a positive contribution to binding affinity.
| Term | Regression Coefficient |
|---|---|
| gauss(o=1.5,w=0.3) (+) | 0.01727 |
| ad4_solvation(q=1) (+) | −0.03179 |
| repulsion(o=0.4) (+) | 0.09099 |
| #torsions2 (+) | −0.288426 |
| #hydrophobic_atoms (+) | 0.06194 |
| constant | 2.72787 |
| (a) | |
| Term | Regression Coefficient | |
|---|---|---|
| Docked | Crystal | |
| vdw (−) | −0.00990 | −0.01002 |
| ad4_solvation(q=1) (+) | −0.04893 | −0.04999 |
| hydrogen_bond(b=0) (+) | 0.15305 | 0.14281 |
| #torsions2 (+) | −0.31726 | −0.32854 |
| constant | 2.46902 | 2.52622 |
| (b) | ||
The next term selected is the charge-dependent AutoDock 4 desolvation term (ad4_solvation), followed by a repulsion term. The sign of the coefficient of the repulsion term, shown in Table 3(a), is unexpected: the more two atoms overlap, the higher the predicted affinity. Such a term would be of limited utility when performing minimization since it can be maximized by burying the ligand in the center of the protein. The contributions to this term in the training data come almost exclusively from atoms that form hydrogen bonds. Hence, this term is actually representing the contributions of hydrogen bonds to the binding affinity. The final two terms are simple counts: the square of the number of internal torsions and the number of hydrophobic atoms.
Given the results of forward selection, we manually selected terms to create a scoring function with similar performance that can still be used for energy minimization. Since the Gaussian steric term does not penalize overlapping atoms, we replaced it with a van der Waals term with nearly as good correlation, as shown in Table 2. Since the repulsion term, when trained on the data, actually rewarded overlapping atoms, we replaced it with the best performing hydrogen bond term. The remaining two terms, #torsions2 and #hydrophobic_atoms, are conformation independent properties of the ligand and so play no role in docking or energy minimization. We chose to omit the final #hydrophobic_atoms term to reduce the chance of overfitting and keep the focus of the scoring function on the conformation-dependent terms. The #torsions2 term may be loosely correlated with configurational entropy, and we submitted predictions to the CSAR exercise both with and without this term. Unless stated otherwise, when referencing our custom scoring function we assume the presence of this term. The final regression coefficients are shown in Table 3(b).
Results
We contributed a total of four submissions to the CSAR 2011 exercise. We evaluated our docked-trained scoring function with and without the #torsions2 term and also considered the addition of two terms that attempted to measure the solvation state of hydrogen bonds. These additional terms turned out to be improperly calculated and will not be discussed further.
The exercise consisted of ligands for four targets: chk1, erk2, lpxc, and urokinase. A single reference receptor with co-ligand was provided for each target. We docked each ligand into the binding site defined by the provided co-ligand using AutoDock Vina with --exhaustiveness=16 --seed=0 --energy_range=3 --num_modes=20. We scored only the pose that was ranked best by Vina. Time constraints prevented us from exploring alternative docking and pose selection approaches for the benchmark exercise, but other approaches are evaluated below with respect to the full dataset.
Using these docked poses, our custom scoring function (with #torsions2) achieved R values of 0.205, 0.397, 0.525, and 0.506, while omitting #torsions2 changes these values to 0.220, 0.409, 0.514, and 0.469 for chk1, erk2, lpxc, and urokinase, respectively. Overall, this placed our ranking ability at the median of all submissions, and these correlations are significantly less than the 0.642 correlation predicted by clustered cross-validation. An analysis of the ligands with known crystal structure (made available after the conclusion of the exercise) revealed that the scored ligand pose was within 2Å RMSD of the crystal pose for only 7 out of 31 structures. They were distributed as 1/12 for chk1, 0/11 for erk2, 4/4 for lpxc, and 2/4 for urokinase.
We next use the full 2012 CSAR dataset to consider the effect of alternative docking strategies and evaluate the efficacy of our custom scoring function on crystal structures.
Dataset
We use the updated November 16th, 2012 CSAR dataset, which is a superset of the compounds used in the benchmarking exercise, as an independent test set. This dataset was not available when the scoring function was created. For evaluation purposes, we limit ourselves to those ligands that have both an available structure and a reported binding affinity. The resulting test set contains 54 structures from five protein targets, the details of which are shown in Table 4. We excluded CDK2/CyclinA from the analysis as it had only one crystal structure and so does not support intra-target analyses such as crossdocking. Test set structures are prepared as with the training set.
Table 4.
The details of our independent test set derived from the CSAR 2012 November Release. We include only those ligands with both affinity and structure information. The CDK2/CyclinA target is omitted since only one ligand for this target meets these criteria.
| Name | Structures | Affinity Measure |
|---|---|---|
| cdk2 | 14 | pKd (OctetRed) |
| chk1 | 16 | pKi (if available), pIC50 |
| erk2 | 12 | pKi |
| lpxc | 5 | pKd (Thermofluor) |
| urokinase | 7 | pKi |
Docking Results
We consider four methods of docking and ranking compounds using our docked-trained custom scoring function and the default Vina scoring function. We distinguish between the scoring function used for docking, which guides the Monte Carlo stochastic sampling and local optimization,1 and the scoring function used for ranking, which selects the top pose from the poses generated by docking. The resulting “dock-rank” methods are then Vina-Vina, Vina-custom, custom-Vina, and custom-custom. Docking was performed using smina with the options --num_modes=40 --seed=0, and the bounding box was determined using the same method as with the docked training data. This deterministically generates up to 40 poses for ranking using a random seed of zero. We docked using two other random seeds and found the results to be qualitatively similar. We use the default exhaustiveness level, which controls the amount of stochastic sampling, but found that docking performance, with the exception of docking chk1, was generally similar even at much higher exhaustiveness levels (see Supplemental Figures 41 and 42).
Ligands were docked to both the single reference receptor that was provided by CSAR for each target (crossdocking) and to the cocrystal receptor of the ligand (redocking). There was no provided reference structure for cdk2 so we chose cdk2_260 as the reference. For our analysis, the cocrystal receptor was aligned to the reference receptor using PyMOL’s 47 align command, and then the crystal ligand was aligned using the matrix_copy command. The heavy-atom RMSD is calculated against this reference-aligned crystal ligand.
Crossdocking
The overall performance of crossdocking using the two scoring functions is shown in Figure 4 with more detailed, per-target, results shown in Figure 5. We consider poses to be successful if they are under 2Å RMSD. In general, our custom scoring function performs better than Vina at sampling low RMSD poses among any of the returned poses, but Vina is better at selecting the correct pose.
Figure 4.

A summary of docking performance across all 54 compounds and 5 targets for the Vina-Vina and custom-custom dock-rank methods. The “first pose” RMSD is the RMSD to the crystal ligand of just the top-ranked pose while the “any pose” RMSD is the best RMSD of any of the 40 poses returned by docking. Our custom scoring function does a better job of sampling low RMSD poses when crossdocking, as indicated by the “any pose” results, but Vina does better at selecting low RMSD poses as the top-ranked poses.
Figure 5.

The docking results for all protein targets using Vina and our custom scoring function. In (a) and (c) there are four bars for each target, one for each dock-rank method. For each target the bars are, in order left to right: Vina-Vina, Vina-custom, custom-Vina, and custom-custom. (a) The RMSD for the top ranked (by predicted affinity) pose of each compound when crossdocking using each dock-rank method. (b) The RMSD of the lowest RMSD pose of all returned poses for a compound when crossdocking. (c) and (d) The same as (a) and (b) but for redocking.
A cursory inspection of Figure 5(a) shows different levels of performance across targets and dock-rank methods. For example, lpxc was docked and ranked with 100% success for three of the four dock-rank methods. Compared to lpxc, chk1 and erk2 were much more difficult to dock and rank. As shown in Figure 5(a), none of the dock-rank methods were able to predict a top ranked pose with low RMSD for more than 20% of the compounds for these targets. This could be due to two reasons: either the docking did not sample low RMSD poses (problem with sampling), or low RMSD poses were sampled, but were poorly scored (problem with scoring). We observe examples of both types of failures. Figure 6 shows the complete docking and scoring results for a selected set of compounds (two per target) for two dock-rank methods: Vina-Vina and custom-custom. Full results for each dock-rank method are shown in Supplemental Figures 1–40. An example of a failure in sampling is chk1_115 in Figure 6(a), where the lowest RMSD pose is >8Å. In comparison, our custom scoring function was able to dock a low RMSD structure and rank it as the top hit (Figure 6(b)). There are many examples of scoring failures with both scoring functions. For example, neither scoring function was able to correctly rank the low RMSD poses that were found for cdk2_20 and for urokinase_8 (Figure 6).
Figure 6.

Representative results for crossdocking using (a) Vina-Vina and (b) custom-custom. Each plot shows all the results of docking, cross-minimization, and self minimization of a compound with respect to RMSD (y-axis) and deviation from the experimental affinity (x-axis). The horizontal line indicates the 2Å RMSD cutoff for a successful pose. For each set of plots, all docking, scoring, and minimization was done in the context of the indicated scoring function. Vina scores, which are energies, are converted to ‘pK’ values using a temperature of 298K.
Sampling Problems
Successful docking for chk1 and erk2 was limited primarily by sampling. This is shown in Figure 5(b), where for more than half the compounds neither of the docking methods generated any pose with ≤2Å RMSD. Docking erk2 compounds with Vina finds a low RMSD pose for only a single compound, compared to docking with our custom scoring function which found a low RMSD pose for 5/12 compounds. For chk1, a low RMSD pose is sampled for 2/16 compounds with Vina and 7/16 compounds with our custom scoring function. Increasing the amount of stochastic search by setting the exhaustiveness level to 50 while scoring with Vina significantly improves chk1 (7/16 low RMSD poses are found), but gives only a small improvement for erk2 (2/12 low RMSD poses are found). Interestingly, when scoring with our custom scoring function, increasing the search exhaustiveness did not improve our sampling performance, which was already significantly better than with Vina scoring (details are provided in Supplemental Figure 42). This demonstrates that modifying the scoring function used to guide docking may be a more efficient means of improving sampling compared to simply increasing the number of random trials in a stochastic method.
Scoring Problems
While pose selection of chk1 and erk2 appears to be limited by sampling, cdk2 appears to be mostly limited by scoring. A low RMSD structure was sampled for 10/14 compounds using Vina and 14/14 compounds using our custom scoring function, and the best dock-rank method (Vina-custom) is able to predict a low RMSD pose as top-ranked for 8/14 of the compounds (Figure 5(a)). While docking with our custom scoring function sampled a low RMSD pose for all of the cdk2 compounds, neither custom-custom or custom-Vina could rank a low RMSD pose as the top-ranked pose for more than 25% of the compounds. Similarly, crossdocking urokinase compounds also suffered from scoring problems. Both docking methods sampled a low RMSD pose for all of the compounds, but none of the dock-rank methods were able to predict a low RMSD pose as the top ranked for more than 50% of the compounds.
Receptor Flexibility
Our docking methods assume a rigid receptor structure. We assess the impact of protein flexibility on the crossdocking results in three ways: structural comparison, redocking, and minimization. For simplicity, in the main text we will only discuss two dock-rank methods, Vina-Vina and custom-custom. The full results can be found in the Supplemental Information.
Structural Comparison
The successful crossdocking of lpxc and urokinase and the unsuccessful crossdocking of chk1 and erk2 can be rationalized by comparing the structures of the provided reference receptor and the cocrystal receptors. The receptor structures of cdk2 also help to explain its middling crossdocking results. Figure 7 shows the crystal binding pose of a representative ligand for each target in an overlay of the reference and cocrystal receptor structures.
Figure 7.

Surface overlay of reference (solid) and cocrystal (translucent) receptor structures of a selected compound for each target. The aligned crystal pose is shown in sticks.
There is little rearrangement of the binding sites for lpxc, Figure 7(d), and urokinase, Figure 7(e). Correspondingly, both lpxc and urokinase consistently sample low RMSD poses when crossdocking and redocking. Cdk2 has some receptor rearrangement that results in an apparent tightening of the cocrystal binding site. Comparing the binding site of the reference and the cocrystal receptors, the binding site of the cocrystal is slightly smaller (vertically in Figure 7(a)) and the reference structure is more open. These relatively minimal changes appear to be reflected in the similarity of the sampling in crossdocking and redocking (Figure 5(b)).
We find there are more prominent differences in receptor structure for erk2 and chk1. A comparison of the binding site of the reference and cocrystal receptors of erk2, Figure 7(c), shows a significant change in the binding site. In the reference receptor the bottom of the binding pocket is filled in while the top of the pocket is more open and less constrained. The binding site of chk1, Figure 7(b), is also more open in the reference receptor. These more open binding pockets place fewer restrictions on ligand positioning and increase the complexity of the sampling problem.
Redocking
Figures 5(c) and 5(d) show sampling and scoring performance for redocking. The starting ligand structure for redocking was the bound ligand structure provided by CSAR. Unsurprisingly, the sampling obtained from redocking, shown in Figure 5(d), was significantly improved over crossdocking, shown in Figure 5(b). For all targets, both docking methods were able to sample a low RMSD pose for >90% of the compounds, with the exception of docking erk2 with our custom scoring function. Figure 5(c) shows the performance of each dock-rank method at selecting low RMSD top-ranked poses. Consistent with the crossdocking results, lpxc was comparatively easy to redock and rank. However, optimal pose selection was still not achieved for the other four targets.
The significant improvements in redocking versus crossdocking shown in Figure 5 suggest a pivotal role for receptor flexibility in docking. It is clearly easier to redock a compound into its native structure. However, as we show in the next section, failures in crossdocking are not necessarily solely the result of intrinsic incompatibilities between the reference receptor and the ligand.
Minimization
We place the crystal ligand pose into the reference receptor to create a cross-unminimized pose and minimize the pose with a scoring function to create a cross-minimized pose. The --local_only option of smina was used to perform minimizations. Similarly, we refer to the native crystal structure as the self-unminimized pose and the result after minimization as the self-minimized pose. These poses and their predicted affinities provide insight into the theoretical performance of docking given a ‘perfect’ sampling where the crystal pose is sampled. In fact, for every ligand the cross-minimized pose had a lower RMSD than any of the found crossdocked poses.
The difference in predicted affinity between the self-unminimized and cross-unminimized poses provides some insight to the extent that changes in receptor structure change the native interactions of the crystal pose. Targets with significant changes in receptor structure, such as erk2, have large average differences while targets with more rigid receptors, such as urokinase, have smaller differences. This can be seen in Figure 6 and Supplemental Figures 1–40 as the spread between the squares indicating unminimized poses. Average values are provided in Supplemental Table 1. However, large differences in unminimized predicted affinity do not mean that a reasonable cross-docked pose that has a low RMSD to the crystal pose cannot be found.
As shown in the first line of Table 5, only a few cross-minimized poses (5 for Vina, 2 for custom scoring) deviate by more than 2Å RMSD from the crystal pose. These are cases where the reference receptor structure is simply incompatible with the crystal pose of the ligand. An additional handful of cross-minimized poses remain within 2Å RMSD, but score more poorly than any docked structure (second line of Table 5). The remaining cross-minimized poses (48 for Vina, 50 for custom scoring) are scored such that, had they been sampled, they would have been included in the docking results. However, simply increasing the amount of stochastic sampling is only partially effective (see Supplemental Figure 41) at improving docking performance suggesting that the interplay between scoring and sampling is also important. Even with ‘perfect’ sampling, the scoring problem of correctly ranking poses remains a challenging problem. As shown in the last row of Table 5, Vina was able to top-rank only 10/54 cross-minimized poses and our custom scoring function top-ranked none of these lowest RMSD poses.
Table 5.
The relative ranking of cross-minimized poses compared to docked poses. Most cross-minimized poses remain within 2Å RMSD of the crystal pose and have a predicted affinity that is either higher than the docked poses or in the same range (lower half of table). Scoring and docking are all performed using the indicated scoring function.
| cdk2 | chk1 | erk2 | lpxc | urokinase | ||||||
|---|---|---|---|---|---|---|---|---|---|---|
| Vina | Custom | Vina | Custom | Vina | Custom | Vina | Custom | Vina | Custom | |
| Above 2Å RMSD | 1 | 0 | 1 | 0 | 3 | 2 | 0 | 0 | 0 | 0 |
| Lower score than docked poses, <2Å | 0 | 0 | 0 | 0 | 1 | 2 | 0 | 0 | 0 | 0 |
|
| ||||||||||
| Similar score to docked poses, <2Å | 7 | 14 | 13 | 16 | 7 | 8 | 5 | 5 | 6 | 7 |
| Higher score than docked poses, <2Å | 6 | 0 | 2 | 0 | 1 | 0 | 0 | 0 | 1 | 0 |
Scoring Results
We now consider the performance of our custom scoring function independent of docking performance by directly scoring the crystal poses of the independent test set. The affinities predicted by both our custom, docked-trained, scoring function and the default Vina scoring function are shown relative to the experimental affinities in Figure 8. The predictions of the crystal-trained scoring function was virtually identical to the docked-trained function with an average absolute difference in predicted affinity of 0.05. Our docked-trained custom scoring function achieves correlation coefficients of 0.690, 0.685, 0.565, 0.800, and 0.833 for cdk2, chk1, erk2, lpxc, and urokinase respectively. However, when the dataset is considered as a whole, the correlation is 0.531. As can be seen in Figure 8, this is due to different predictive trends between targets. For example, cdk2 tends to be over-predicted while chk1 tends to be under-predicted.
Figure 8.

Correlation between predicted and experimental affinities when scoring the crystal structures of the CSAR 2012 test set. The crystal-trained custom scoring function (not shown) performs similarly to the docked-trained scoring function.
The root mean squared errors (RMSE) of our predictions and of the Vina scoring function are shown in Table 6. Again, the crystal-trained and docked-trained scoring function perform similarly. In all cases our custom scoring function outperforms Vina. Interestingly, despite being an easy docking target, the Vina scoring function had particular difficulty scoring the lpxc ligands.
Table 6.
The root mean squared error (RMSE) between predicted and experimental affinities.
| RMSE | Total | cdk2 | chk1 | erk2 | lpxc | urokinase |
|---|---|---|---|---|---|---|
| Docked Trained | 0.893 | 1.034 | 1.101 | 0.729 | 0.270 | 0.537 |
| Crystal Trained | 0.896 | 1.080 | 1.058 | 0.753 | 0.272 | 0.523 |
| Vina | 1.031 | 0.827 | 1.170 | 0.869 | 1.307 | 1.091 |
Finally, we compare the correlations of our custom scoring function with Vina and molecular weight in Figure 9. In each case our custom scoring function outperforms Vina, but for chk1 and erk2 molecular weight correlates better with the experimental affinity than our predictions. Unfortunately, as suggested by the 95% confidence intervals shown in Figure 9, the only comparison that is statistically significant (p< 0.05) is the improvement in correlation of our scoring function relative to Vina when evaluating lpxc. For this target, which has only 5 ligands in the test set, the predictions of Vina anti-correlate with the experimental affinities.
Figure 9.

Pearson correlation (R) of the docked-trained custom scoring function, the default Vina scoring function, and molecular weight with respect to experimental affinities. Error bars indicate the 95% confidence interval. The custom scoring function achieves better correlations and tighter confidence intervals than Vina. However, the difference is only statistically significant (p < 0.05) for lpxc. In this case, Vina predicts values that anti-correlate with the experimental values (R=−0.56). The crystal-trained scoring function achieved virtually identical correlations as the docked-trained function (not shown).
Discussion
For the purposes of the CSAR exercise we limited ourselves to those interaction terms already present in the Vina code base. However, our analysis reveals some potential areas for improvement. Given the preference for a narrow Gaussian at an offset over the optimal van der Waals distance, we suspect a 6–12 van der Waals potential with an offset might result in an enhanced steric term for scoring purposes. Alternatively, a reparameterization of the van der Waals radii or the inclusion of explicit hydrogens may also be effective. The Vina linear hydrogen bond potential does not perform as well as the initially selected repulsion term. An alternative non-linear hydrogen bond term, such as a 10–12 Lennard-Jones potential, that is still appropriate for minimization would be worth exploring.
We explored the differences between using a docked training set, which is representative of structures generated during virtual screening, and a crystal training set, which is physically accurate. The feature selection process applied to these two distinct sets revealed a bias in the docked structures against the close contacts preferred by crystal structures. However, when the same set of features was used in the parameterization of the scoring function, the results were largely insensitive to the choice of training structures. This suggests that training on docked structures may be more useful as a validation of the ability of the docking scoring function to mimic the preferences of crystal structures than as a means of generating a more informative scoring function.
Our custom scoring function was better at sampling low RMSD poses when crossdocking compared to Vina, as shown in Figure 5(b). However, it was generally less successful than Vina at correctly selecting the lowest RMSD pose, as shown in Figure 5(a). The performance of dock-rank methods varied across targets: Vina performed better at choosing the best pose for cdk2 and urokinase, and our custom scoring function performed marginally better for chk1 and erk2.
We used several methods to evaluate the effect of receptor flexibility on docking. In general, there is little variability between the receptor structures of lpxc and urokinase and these were the most successful targets when crossdocking. When comparing crossdocking to redocking, we found that redocking with the two scoring functions performed comparably at sampling a low RMSD pose, but Vina was much better at selecting a low RMSD pose as the top ranked pose. Furthermore, the ability of our scoring function to sample a low RMSD pose when crossdocking was significantly better than Vina: 10 additional < 2Å RMSD poses were sampled. This is likely the result of how the two scoring functions were trained. Vina was specifically optimized to maximize redocking performance on the PDBBind database, 10 whereas our custom scoring function was only trained for affinity prediction and featured a “softer” 4–8 Lennard-Jones steric potential.
When crossdocking with the Vina scoring function and our custom scoring function, a < 2Å RMSD pose was not sampled for 26 and 16 ligands, respectively. However, there were a total of only 6 ligands with Vina and 4 ligands with our custom scoring function where the cross-minimized ligand would not have been included in the docking results had it been sampled. This suggests that there is still room to improve docking performance, even without removing the simplifying assumption of a rigid receptor.
There is some evidence that using a consensus method for docking and ranking poses, namely the Vina-custom and custom-Vina dock-rank methods, improves overall docking performance as shown in Figure 5(a). However, the benefits of doing so are inconsistent across targets. Re-ranking the Vina docked compounds with our custom scoring function maintained or improved performance for 4/5 of the targets compared to ranking them with Vina. Scoring the poses docked with our custom scoring function with Vina gave marginally better predictions for only 2/5 targets which does not include the easy to dock lpxc.
The above methods were applied and discussed only in the context of the specified datasets, namely the CSAR 2010 and CSAR 2012 datasets. However, the methods and subsequent analysis could easily be applied to other datasets. As more high-quality structure and affinity data is made available, we can regenerate a custom scoring function and reasonably expect to observe an improvement in the agreement between predicted and actual binding affinity. However, improvements in affinity prediction do not necessarily correlate with improvements in docking performance, as demonstrated by Figures 9 and 4. This may be because our method, unlike others, 10,48 does not incorporate negative training data about inactive compounds and incorrect poses. Expanding our method to include such data will be the subject of future investigations.
Conclusion
We have presented a general and robust method for the design of an empirical scoring function given a set of potential terms (here, the pre-existing terms of AutoDock Vina) and a high quality dataset of structures and affinities (here, the CSAR 2010 set). Our results are inline with the best performing scoring functions of the CSAR 2010 exercise and provide insights into potential areas of improvement. Our scoring function exhibits improvements in sampling when crossdocking, but the challenge of selecting the correct docked pose remains. Finally, we provide smina, a fork of AutoDock Vina specially designed for scoring function development and minimization workflows. The source code for smina and prebuilt binaries are available under the GNU Public License v2.0 from http://smina.sf.net.
Supplementary Material
Acknowledgments
This work was supported by grant R01GM097082-01 from the National Institutes of Health.
Footnotes
The version of smina used in this study was not able to include charge-dependent terms in the scoring used to guide Monte Carlo search; they were included when performing local optimization.
Supporting Information Available
We provide our RapidMiner workflows and the complete set of docking performance graphs (as in Figure 6) as Supplementary Information. This material is available free of charge via the Internet at http://pubs.acs.org/.
References
- 1.DeWitte RS, Shakhnovich EI. SMoG: de Novo design method based on simple, fast, and accurate free energy estimates. 1. Methodology and supporting evidence. J Am Chem Soc. 1996;118:11733–11744. [Google Scholar]
- 2.McInnes C. Virtual screening strategies in drug discovery. Curr Opin Chem Biol. 2007;11:494–502. doi: 10.1016/j.cbpa.2007.08.033. [DOI] [PubMed] [Google Scholar]
- 3.Charifson PS, Corkery JJ, Murcko MA, Walters WP. Consensus scoring: A method for obtaining improved hit rates from docking databases of three-dimensional structures into proteins. J Med Chem. 1999;42:5100–9. doi: 10.1021/jm990352k. [DOI] [PubMed] [Google Scholar]
- 4.Wang R, Lu Y, Wang S. Comparative evaluation of 11 scoring functions for molecular docking. J Med Chem. 2003;46:2287–303. doi: 10.1021/jm0203783. [DOI] [PubMed] [Google Scholar]
- 5.Kitchen DB, Decornez H, Furr JR, Bajorath J. Docking and scoring in virtual screening for drug discovery: methods and applications. Nat Rev Drug Discov. 2004;3:935–49. doi: 10.1038/nrd1549. [DOI] [PubMed] [Google Scholar]
- 6.Warren GL, Andrews CW, Capelli AM, Clarke B, LaLonde J, Lambert MH, Lindvall M, Nevins N, Semus SF, Senger S, Tedesco G, Wall ID, Woolven JM, Peishoff CE, Head MS. A critical assessment of docking programs and scoring functions. J Med Chem. 2006;49:5912–31. doi: 10.1021/jm050362n. [DOI] [PubMed] [Google Scholar]
- 7.Cheng T, Li X, Li Y, Liu Z, Wang R. Comparative assessment of scoring functions on a diverse test set. J Chem Inf Model. 2009;49:1079–93. doi: 10.1021/ci9000053. [DOI] [PubMed] [Google Scholar]
- 8.Smith RD, Dunbar JB, Ung PM-U, Esposito EX, Yang C-Y, Wang S, Carl-son HA. CSAR Benchmark Exercise of 2010: Combined Evaluation Across All Submitted Scoring Functions. J Chem Inf Model. 2011;51:2115–2131. doi: 10.1021/ci200269q. [DOI] [PMC free article] [PubMed] [Google Scholar]
- 9.Huang S-Y, Zou X. Scoring and lessons learned with the CSAR benchmark using an improved iterative knowledge-based scoring function. J Chem Inf Model. 2011;51:2097–106. doi: 10.1021/ci2000727. [DOI] [PMC free article] [PubMed] [Google Scholar]
- 10.Trott O, Olson AJ. AutoDock Vina: improving the speed and accuracy of docking with a new scoring function, efficient optimization, and multithreading. J Comput Chem. 2010;31:455–61. doi: 10.1002/jcc.21334. [DOI] [PMC free article] [PubMed] [Google Scholar]
- 11.Jorgensen WL. Efficient drug lead discovery and optimization. Acc Chem Res. 2009;42:724–33. doi: 10.1021/ar800236t. [DOI] [PMC free article] [PubMed] [Google Scholar]
- 12.Jorgensen WL. The Many Roles of Computation in Drug Discovery. Science. 2004;303:1813–1818. doi: 10.1126/science.1096361. [DOI] [PubMed] [Google Scholar]
- 13.McGann M. FRED pose prediction and virtual screening accuracy. J Chem Inf Model. 2011;51:578–96. doi: 10.1021/ci100436p. [DOI] [PubMed] [Google Scholar]
- 14.McGaughey GB, Sheridan RP, Bayly CI, Culberson JC, Kreatsoulas C, Lindsley S, Maiorov V, Truchon JF, Cornell WD. Comparison of topological, shape, and docking methods in virtual screening. J Chem Inf Model. 2007;47:1504–19. doi: 10.1021/ci700052x. [DOI] [PubMed] [Google Scholar]
- 15.Novikov FN, Stroylov VS, Stroganov OV, Chilov GG. Improving performance of docking-based virtual screening by structural filtration. J Mol Model. 2010;16:1223–30. doi: 10.1007/s00894-009-0633-8. [DOI] [PubMed] [Google Scholar]
- 16.Cheng T, Li Q, Zhou Z, Wang Y, Bryant SH. Structure-based virtual screening for drug discovery: a problem-centric review. AAPS J. 2012;14:133–41. doi: 10.1208/s12248-012-9322-0. [DOI] [PMC free article] [PubMed] [Google Scholar]
- 17.DesJarlais RL, Sheridan RP, Seibel GL, Dixon JS, Kuntz ID, Venkataragha-van R. Using shape complementarity as an initial screen in designing ligands for a receptor binding site of known three-dimensional structure. J Med Chem. 1988;31:722–9. doi: 10.1021/jm00399a006. [DOI] [PubMed] [Google Scholar]
- 18.Hsieh J-H, Yin S, Liu S, Sedykh A, Dokholyan NV, Tropsha A. Combined application of cheminformatics- and physical force field-based scoring functions improves binding affinity prediction for CSAR data sets. J Chem Inf Model. 2011;51:2027–35. doi: 10.1021/ci200146e. [DOI] [PMC free article] [PubMed] [Google Scholar]
- 19.Rarey M, Kramer B, Lengauer T, Klebe G. A Fast Flexible Docking Method using an Incremental Construction Algorithm. J Mol Biol. 1996;261:470–489. doi: 10.1006/jmbi.1996.0477. [DOI] [PubMed] [Google Scholar]
- 20.Wang R, Liu L, Lai L, Tang Y. SCORE: A New Empirical Method for Estimating the Binding Affinity of a Protein-Ligand Complex. J Mol Model. 1998;4:379–394. [Google Scholar]
- 21.Morris GM, Huey R, Lindstrom W, Sanner MF, Belew RK, Goodsell DS, Olson AJ. AutoDock4 and AutoDockTools4: Automated docking with selective receptor flexibility. J Comput Chem. 2009;30:2785–91. doi: 10.1002/jcc.21256. [DOI] [PMC free article] [PubMed] [Google Scholar]
- 22.Case DA, Cheatham TE, Darden T, Gohlke H, Luo R, Merz KM, Onufriev A, Simmerling C, Wang B, Woods RJ. The Amber biomolecular simulation programs. J Comput Chem. 2005;26:1668–1688. doi: 10.1002/jcc.20290. [DOI] [PMC free article] [PubMed] [Google Scholar]
- 23.Ewing TJ, Makino S, Skillman AG, Kuntz ID. DOCK 4.0: search strategies for automated molecular docking of flexible molecule databases. J Comput Aided Mol Des. 2001;15:411–28. doi: 10.1023/a:1011115820450. [DOI] [PubMed] [Google Scholar]
- 24.Brooks BR, Bruccoleri RE, Olafson BD. CHARMM: A program for macromolecular energy, minimization, and dynamics calculations. J Comput Chem. 1983;4:187–217. [Google Scholar]
- 25.Lindahl E, Hess B, Van Der Spoel D. GROMACS 3.0: a package for molecular simulation and trajectory analysis. J Mol Model. 2001;7:306–317. [Google Scholar]
- 26.Jorgensen WL, Maxwell DS, Tirado-Rives J. Development and testing of the OPLS all-atom force field on conformational energetics and properties of organic liquids. J Am Chem Soc. 1996;118:11225–11236. [Google Scholar]
- 27.Jones G, Willett P, Glen RC, Leach AR, Taylor R. Development and validation of a genetic algorithm for flexible docking. J Mol Biol. 1997;267:727–48. doi: 10.1006/jmbi.1996.0897. [DOI] [PubMed] [Google Scholar]
- 28.Knight JL, Brooks CL. Surveying implicit solvent models for estimating small molecule absolute hydration free energies. J Comput Chem. 2011;32:2909–2923. doi: 10.1002/jcc.21876. [DOI] [PMC free article] [PubMed] [Google Scholar]
- 29.Huang SY, Zou X. Mean-Force Scoring Functions for Protein-Ligand Binding. Annu Rep Comp Chem. 2010;6:280–296. [Google Scholar]
- 30.Muegge I, Martin YC. A general and fast scoring function for protein-ligand interactions: a simplified potential approach. J Med Chem. 1999;42:791–804. doi: 10.1021/jm980536j. [DOI] [PubMed] [Google Scholar]
- 31.Gohlke H, Hendlich M, Klebe G. Knowledge-based scoring function to predict protein-ligand interactions. J Mol Biol. 2000;295:337–356. doi: 10.1006/jmbi.1999.3371. [DOI] [PubMed] [Google Scholar]
- 32.Zhou H, Skolnick J. GOAP: a generalized orientation-dependent, all-atom statistical potential for protein structure prediction. Biophys J. 2011;101:2043–52. doi: 10.1016/j.bpj.2011.09.012. [DOI] [PMC free article] [PubMed] [Google Scholar]
- 33.Mooij WT, Verdonk ML. General and targeted statistical potentials for protein-ligand interactions. Proteins. 2005;61:272–87. doi: 10.1002/prot.20588. [DOI] [PubMed] [Google Scholar]
- 34.Kramer C, Gedeck P. Leave-Cluster-Out Cross-Validation Is Appropriate for Scoring Functions Derived from Diverse Protein Data Sets. J Chem Inf Model. 2010;50:1961–1969. doi: 10.1021/ci100264e. [DOI] [PubMed] [Google Scholar]
- 35.Huang SY, Zou X. An iterative knowledge-based scoring function to predict protein-ligand interactions: II. Validation of the scoring function. J Comput Chem. 2006;27:1876–1882. doi: 10.1002/jcc.20505. [DOI] [PubMed] [Google Scholar]
- 36.Böhm HJ. The development of a simple empirical scoring function to estimate the binding constant for a protein-ligand complex of known three-dimensional structure. J Comput-Aided Mol Des. 1994;8:243–256. doi: 10.1007/BF00126743. [DOI] [PubMed] [Google Scholar]
- 37.Wang R, Lai L, Wang S. Further development and validation of empirical scoring functions for structure-based binding affinity prediction. J Comput-Aided Mol Des. 2002;16:11–26. doi: 10.1023/a:1016357811882. [DOI] [PubMed] [Google Scholar]
- 38.Korb O, Stützle T, Exner TE. Empirical scoring functions for advanced protein-ligand docking with PLANTS. J Chem Inf Model. 2009;49:84–96. doi: 10.1021/ci800298z. [DOI] [PubMed] [Google Scholar]
- 39.Eldridge MD, Murray CW, Auton TR, Paolini GV, Mee RP. Empirical scoring functions: I. The development of a fast empirical scoring function to estimate the binding affinity of ligands in receptor complexes. J Comput Aided Mol Des. 1997;11:425–45. doi: 10.1023/a:1007996124545. [DOI] [PubMed] [Google Scholar]
- 40.Friesner RA, Banks JL, Murphy RB, Halgren TA, Klicic JJ, Mainz DT, Repasky MP, Knoll EH, Shelley M, Perry JK, Shaw DE, Francis P, Shenkin PS. Glide: a new approach for rapid, accurate docking and scoring. 1. Method and assessment of docking accuracy. J Med Chem. 2004;47:1739–49. doi: 10.1021/jm0306430. [DOI] [PubMed] [Google Scholar]
- 41.Dunbar JB, Smith RD, Yang C-Y, Ung PM-U, Lexa KW, Khazanov NA, Stuckey JA, Wang S, Carlson HA. CSAR Benchmark Exercise of 2010: Selection of the Protein-Ligand Complexes. J Chem Inf Model. 2011;51:2036–2046. doi: 10.1021/ci200082t. [DOI] [PMC free article] [PubMed] [Google Scholar]
- 42.Hu L, Benson ML, Smith RD, Lerner MG, Carlson HA. Binding MOAD (mother of all databases) Proteins: Struct Funct Bioinf. 2005;60:333–340. doi: 10.1002/prot.20512. [DOI] [PubMed] [Google Scholar]
- 43.O’Boyle NM, Banck M, James CA, Morley C, Vandermeersch T, Hutchi-son GR. Open Babel: An open chemical toolbox. Journal of Cheminformatics. 2011;3:33. doi: 10.1186/1758-2946-3-33. [DOI] [PMC free article] [PubMed] [Google Scholar]
- 44.Omega version 246. OpenEye Scientific Software Inc; Santa Fe, New Mexico: 2012. [Google Scholar]
- 45.Huey R, Morris GM, Olson AJ, Goodsell DS. A semiempirical free energy force field with charge-based desolvation. J Comput Chem. 2007;28:1145–52. doi: 10.1002/jcc.20634. [DOI] [PubMed] [Google Scholar]
- 46.RapidMiner version 5.1.017; Rapid-I. http://rapid-i.com.
- 47.The PyMOL Molecular Graphics System, Version 1.5.0.1. Schrödinger, LLC; 2010. http://www.pymol.org/ [Google Scholar]
- 48.Pham TA, Jain AN. Customizing scoring functions for docking. J Comput Aided Mol Des. 2008;22:269–86. doi: 10.1007/s10822-008-9174-y. [DOI] [PMC free article] [PubMed] [Google Scholar]
Associated Data
This section collects any data citations, data availability statements, or supplementary materials included in this article.