

Abstract
Protein S-nitrosylation is a dynamic post-translational modification (PTM) of specific cysteines within a target protein. Both proteins and small molecules are known to regulate the attachment and removal of this PTM, and proteins exhibiting such a function are transnitrosylase or denitrosylase candidates. With the advent of the biotin switch technique coupled to high-throughput proteomics workflows, the identification and quantification of large numbers of S-nitrosylated proteins and peptides is now possible. Proper analysis and interpretation of high throughout and quantitative proteomics data will help identify specific transnitrosylase and denitrosylase target peptide sequences and contribute to an understanding of the function and regulation of specific S-nitrosylation events. Here we describe the application of a quantitative proteomics approach using isotope-coded affinity tags (ICAT) in the biotin switch approach for the identification of transnitrosylation and denitrosylation targets of thioredoxin 1, an enigmatic protein with both reported transnitrosylase and denitrosylase activities.
Keywords: Biotin switch, ICAT, proteomics, S-nitrosylation, thioredoxin
1. Introduction
S-nitrosylation and denitrosylation are the covalent addition or removal of a nitric oxide (NO) to or from a cysteine thiol within proteins. Similar to phosphorylation, it has increasingly assumed importance as a ubiquitous PTM, known to regulate diverse cellular processes including signal transduction, DNA repair and neurotransmission. Protein S-nitrosylation requires either small molecule NO donors or putative protein transnitrosylases, a yet to be clearly defined class of enzymes (Table 1). This PTM is reversible. Denitrosylation is carried out by putative denitrosylases (Table 1) and small molecule NO recipients. Not all cysteines in proteins are equally accessible to transnitrosylases or denitrosylases, therefore S-nitrosylated cysteine (SNO-Cys) site modifications can display exquisite specificity, e.g. the ryanodine receptor [1]. Identification of SNO-Cys sites and quantification of the relative changes among S-nitrosylated peptides (SNO-peptides) is crucial to understanding the biological significance of this PTM in modulating the function of a particular protein.
Table 1.
Examples of proteins with transnitrosylase and denitrosylase activities.
| S-transnitrosylase | Targets | Reference |
|---|---|---|
| Caspase 3 | XIAP | [32] |
| GAPDH | DNA-PK, HDAC2, SIRT1 | [33] |
| Hemoglobin | AE1 | [34] |
| Protein disulfide isomerase | N-dansylhomocysteine | [35] |
| Thioredoxin 1 | Procaspase 3 | [36] |
| Denitrosylase | Targets | Reference |
|
| ||
| Alcohol dehydrogense III | GSNO | [37] |
| Carbonyl reductase | GSNO | [38] |
| Flavohemoglobin | NO | [39] |
| Protein disulfide isomerase | SNO-PDI | [40] |
| Thioredoxin 1 | SNO-Caspase 3 | [2] |
| Thioredoxin 2 | SNO-Caspase 3 | [2] |
An increasing awareness of the physiological and pathophysiological significance of S-nitrosylation has grown within the scientific and medical fields over the past decade. Specific protein dependent-denitrosylation studies have provided the most recent evidence of this PTM being a highly regulated, enzymatic-dependent biological process [2]. S-nitrosylation was previously described as a non-enzymatic process [3], but several lines of evidence now suggest that numerous proteins, including members of the thioredoxin (Trx) family can catalyze the specific transnitrosylation and/or denitrosylation of target proteins [4–6]. As such, the Trx system comprised of Trx1 or Trx2, cytosolic Trx reductase (TrxR), mitochondrial TrxR and NADPH, are part of a newly defined class of enzymes with denitrosylase activities (Table 1) [7]. Trx1 has also been shown to transnitrosylate select proteins under cell-free conditions in the absence of TrxR or in cells expressing Trx1C32,C35S, a mutant with attenuated Trx1 disulfide reductase or denitrosylase functions [4]. Hence, Trx1 regulation of protein transnitrosylation is likely to be important in highly oxidizing cellular microenvironments, e.g., when Cys32 and 35 disulfide bond oxidized Trx1 (oTrx1) accumulates in cells due to either down modulation of TrxR or upregulation of thioredoxin interacting protein (Txnip), an endogenous Trx1 reductase/denitrosylase inhibitor. For example, the over expression of Txnip has been shown to elevate cellular protein nitrosylation levels [8], presumably due to Txnip’s inhibition of Trx1’s reductase/denitrosylase activities, which may in turn lead to an accumulation of SNO-Trx1 and downstream S-nitrosylated proteins (SNO-proteins). Indeed, oTrx1 has been observed in several normal animal tissues, including kidney and lung, and increased oTrx1 in cells is correlated with increased SNO-protein [6]. Importantly, animal models for cardiovascular disorders including hypertension and ventricular remodeling that originate from dysregulation of the Trx system could be caused, in part, by an imbalance in denitrosylation/transnitrosylation [9]. For example, transgenic mice over-expressing Trx1C32,C35S mutant in the heart exhibit cardiac hypertrophy, which may be due to increased oxidative PTMs including disulfides and nitrosylation among specific proteins [10]. Therefore, it becomes crucial to determine whether these aberrant S-nitrosylation patterns and related pathologies are due to decreased denitrosylation or increased transnitrosylation. With this view, identification of the SNO-Cys sites within specific target SNO-peptides is crucial for understanding the biological significance of S-nitrosylation in modulating the function of signaling proteins.
Due to its labile nature this PTM has been classically difficult to study, but several indirect methods have been developed. They include the use of a SNO-Cys-specific antibody to detect in situ protein S-nitrosylation by immunohistochemistry [11], and the use of the biotin-switch technique (BST) coupled with immunoblotting and 2D gel electrophoresis [12–14]. However, none of these methods can readily identify specific SNO-Cys sites within proteins. To this end, BST coupled with tandem mass spectrometry (MS/MS) identification of protein SNO-Cys sites (SNOSID) method was developed [15]. In this method, SNO-Cys in peptides are converted into more stable biotinylated cysteines, which can be analyzed by LC/MS/MS methods, either with matrix-assisted laser desorption ionization (MALDI) or electrospray ionization (ESI) techniques [4, 6, 16].
Quantitative approaches have an inherent advantage over qualitative methods, such as direct MS detection [17–19] and SNOSID [15], which rely on identifying proteins with dramatically elevated S-nitrosylation. The exclusion of an SNO-peptide from downstream analysis may occur simply because it is not found solely in the biological sample; this may miss important regulatory events whose function is manifested by gradual changes in SNO-peptide levels. Therefore, we believe that the ICAT method described below, isobaric tag for relative and absolute quantitation (iTRAQ), stable isotope labeling by amino acids in cell culture (SILAC) [20], S-nitrosothiol capture (SNO-CAP) [21], S-nitrosothiols resin-assisted capture (SNO-RAC) [22] and Tandem Mass Tags (TMT) [23] methods used by others, as well as the Multiple Reaction Monitoring (MRM) method [24], will provide crucial quantitative information essential to understanding the function of regulated S-nitrosylation in diverse biological systems. However, it is necessary to understand the advantages and disadvantages of each method when applied to a specific biological sample (Table 2). Direct MS detection enables the rapid and specific analysis of SNO-peptides or proteins without possible confounding artifacts from the indirect method involving BST [17, 19]. However, this method is not always suitable for the analysis of very complex protein mixtures derived from biological sources. Furthermore, direct MS detection often fails to localize SNO-Cys sites on SNO-peptides with multiple cysteines, due to the labile nature of the S-NO bond, which is liable to fragment more readily than the peptide backbone [25]. All other quantitative methods discussed in Table 2 involve the use of BST, which enables the localization of the exact SNO-Cys and are amenable to multidimensional LC separations for analysis of very complex protein mixtures. However, due to the relatively large size of the biotin group, MS/MS analyses of biotinylated peptides usually produces spectra that are not as easily interpretable as those of the corresponding unmodified peptides. Typically, there are numerous and dominant biotin-derived fragment ions in the MS/MS spectra, which hinder both manual and search engine-based data interpretation. By comparison, both SNO-RAC and TMT methods monitor peptides without attached biotins; these methods are likely to produce richer MS/MS spectra for peptide sequence interpretation and SNO-Cys assignments. However, for SNO-RAC, the reductants used for the elution of the SNO-peptides from capture resins may also reduce the disulfide bonds at MMTS blocking sites or other oxidatively modified cysteines, increasing false SNO-Cys identification on SNO-peptide quantification. One distinct advantage of the TMT method over most other quantitative proteomics methods for the comparison of two to three sample groups is its design to allow for up to six samples to be compared in one experiment. On the other hand, the specificity of the commercial antibody used for the enrichment of TMT-conjugated peptides is low; resulting in futile LC-limited MS/MS data acquisition time on the fragmentation of non-SNO-peptides. Compared to these methods, ICAT has its unique advantages: ICAT tags contain biotin, which can be used to directly enrich the SNO-peptides, after BST, and the biotin group can be cleaved off from the ICAT-enriched peptides before LC/MS/MS analysis, which generates much “cleaner” MS/MS spectra for the identification and quantification of SNO-peptides.
Table 2.
Proteomics methods for SNO-peptide and SNO-protein quantification.
| Method | Starting Materials | Advantages | Disadvantages | References |
|---|---|---|---|---|
| Direct MS Detection | Purified peptides and proteins | Rapid and direct detection of protein S-nitrosylation without the sample loss and artifacts from complicated derivatization steps. |
|
[17–19] |
| ICAT | Proteins extracted from HeLa Cells & cerebellum |
|
|
[6, 18, 21] |
| SILAC coupled with biotin switch | Proteins extracted from Jurkat cells |
|
|
[20] |
| SNO-CAP | Proteins extracted from rat cerebellum |
|
|
[21] |
| SNO-RAC | Proteins extracted from human embryonic kidney cells |
|
|
[22] |
| TMT | Proteins extracted from human pulmonary arterial endothelial cells |
|
|
[23] |
This study applies the ICAT reagents to BST and in so doing modifies an existing qualitative technology to yield quantitative information on SNO-Cys-containing peptides. Here we outline recent application of quantitative proteomics techniques in our lab to resolve the denitrosylation and transnitrosylation targets of Trx1, a 12-kDa multifunctional protein involved in cell growth, death, protein reduction, and tissue development.
2. Rationale
We previously revealed a disulfide redox status-dependent mechanism of toggling Trx1 from a transnitrosylase into a denitrosylase, and vice versa [4, 6]. When its catalytic Cys32 and Cys35 are both reduced into dithiols, Trx1 serves as a denitrosylase. On the other hand, when a Cys32 and Cys35 disulfide is formed, Trx1 acts as a transnitrosylase. In this report we outline the in vitro methods previously used to identify and quantify Trx1 transnitrosylation and subsequent Trx1 denitrosylation target peptides, a task that is rather challenging to delineate from in vivo systems [6]. Most steps of this method are equally applicable to the identification of any transnitrosylase and denitrosylase target isolated from cells and tissues. We have included additional discussions on how to apply this method for more physiologically relevant systems.
3. Material and methods
3.1 Preparation of transnitrosylating S-nitrosylated Trx1 (SNO-Trx1)
Recombinant human Trx1 and chemical reagents were purchased from Sigma (St. Louis, MO, USA) unless otherwise indicated. Acetonitrile (ACN) and HPLC-grade water were obtained from J. T. Baker (Phillipsburg, NJ, USA). Formic acid was purchased from EMD Chemicals (Merck KGaA, Darmstadt, Germany). To produce transnitrosylase-active SNO-Trx1, Cys32 and Cys35 oxidized human Trx1 (100 μg) (Sigma, St. Louis, MO USA) was mixed with a 25-fold molar excess of S-nitrosoglutathione (GSNO) in 50 μl of S-nitrosylation buffer (NB, 50 mM Tris, pH 7.5, 1 mM EDTA and 0.1 mM neocuproine) at 37 °C for 30 min in the dark. The resulting SNO-Trx1 was precipitated with cold acetone at −20 °C for 1 h. To separate GSNO from SNO-Trx1, the protein pellet was washed four times with cold acetone at −20 °C and dissolved in NB, and adjusted to 2 μg/μl to be used as transnitrosylase. Since Trx1 is a small protein, acetone precipitation did not affect the refolding of SNO-Trx1 and its ability to transnistrosylate target proteins. Alternatively, in order to minimize the possibility of protein denaturation, SNO-Trx1 or other transnitrosylases prepared in vitro can be separated from excessive GSNO or other NO donors by using ultrafiltration or microdialysis.
3.2 Cell lysates preparation
A cell line or tissue with physiological relevance to the dynamic changes of SNO-proteins or their regulatory factors is preferable; here we employed the neuroblastoma cell line SH-SY5Y (ATCC; CRL-2266). SH-SY5Y cells were grown at 37 °C in DMEM/F12 media containing 10% FBS in a 5% CO2 atmosphere, as recommended by ATCC. The cells were harvested via centrifugation at 500×g for 5 min and washed with PBS. Cells were lysed in a lysis buffer (LB, 50 mM Tris, pH 7.5, 150 mM NaCl, 1% Triton X-100, 1 mM EDTA and 0.1 mM neocuproine) supplemented with a protease inhibitor cocktail (Sigma). After the removal of cell debris from the lysate via centrifugation, protein concentrations were measured using the bicinchoninic acid (BCA) method (Pierce, Rockford, IL, USA) and adjusted to 1 μg/μl with LB.
3.3 In vitro transnitrosylation and denitrosylation of cellular proteins
Freshly made SNO-Trx1 (100 μg) was used as a specific transnitrosylase to transnitrosylate 1 mg of proteins extracted from SH-SY5Y cells in 1 ml LB at 37 °C for 30 min in the dark. Similarly, GSNO treatment of cellular proteins can be performed as a positive control. Negative controls, such as un-nitrosylated oTrx1 or buffer alone treatment of cellular proteins can be included. Following transnitrosylation treatment, proteins were precipitated with cold acetone, washed 3 times in cold acetone and processed by BST (Section 3.4). In a separate experiment for the identification of Trx1 denitrosylase targets that were initially S-nitrosylated by SNO-Trx1, 300 μg SNO-Trx1 treated proteins were incubated with 5 μM Trx1, 100 nM TrxR and 200 μM NADPH in a total volume of 0.5 ml LB at 37 °C for 30 min [20].
3.4 BST using ICAT labeling for quantitative determination of SNO-proteins
S-nitrosylation is very labile. Although direct detection by MS is possible for synthetic peptides [19], SNO-proteins are typically captured by the BST in which NO is replaced with a biotinylated thiol reaction reagent, e.g. N-[6-(Biotinamido)hexyl]-3′-(2′-pyridyldithio)-propionamide (biotin-HPDP) [12]. ICAT reagent is conventionally used for quantitative proteomic research by alkylating cysteines in proteins. There is a biotin tag in the ICAT reagent for affinity capture and detection. In the following experiments, we used the ICAT reagent instead of biotin-HPDP in BST. In brief, the modified BST can be performed in the following steps:
3.4.1. Free thiol blockage
Proteins (1 mg) were denatured in 1 ml LB buffer with additional 2.5% SDS, and free thiols were alkylated using 20 mM methyl methanethiosulfonate (MMTS) (Pierce, Rockford, IL, USA) with frequent mixing on a vortexer at 50 °C for 30 min. Excess MMTS was removed by cold acetone precipitation of the proteins.
3.4.2. SNO-Cys reduction
Protein pellets were reconstituted in an HEN buffer (25 mM HEPES, pH 7.7, 1 mM EDTA and 0.1 mM neocuproine) containing 1% (w/v) SDS to a final concentration of 1 μg/μl. SNO-Cys’s were reduced with 10 mM ascorbate for 1 h at RT in the dark; a condition that does not reduce disulfide bonds [Li lab, unpublished data]. The inclusion of proper controls to ensure specific detection of SNO-protein signals is essential [26]. It is recommended that a negative control reaction should be also performed; in which ascorbate is omitted and thus no SNO-Cys-derived free thiols are available for subsequent biotinylation and detection.
3.4.3. Biotinylation
The method for biotinylation using ICAT reagents was modified from Paige et al. 2008 [21]. Briefly, newly exposed free thiols in 600 μg of proteins reduced by ascorbate were differentially labeled with either 240 μg light (ICAT-L) or heavy (ICAT-H) ICAT reagent. Two independent ICAT-modified BST experiments were performed to detect Trx1 transnitrosylation and denitrosylation targets, respectively. First, SNO-Trx1 transnitrosylated proteins were labeled with ICAT-H, buffer treated proteins were labeled with ICAT-L. In a second experiment, SNO-Trx1 transnitrosylated proteins were first treated with Trx1/TrxR/NADPH and labeled with ICAT-L and subsequently compared with ICAT-H labeled SNO-Trx1 transnitrosylated proteins [6]. The ICAT labeling reactions were performed following ascorbate reduction of SNO-Cys’s described in section 3.4.2 and incubated in the dark for 1 h at RT. Excess ICAT reagents were removed from labeled proteins by cold acetone precipitation of the proteins. Mixtures of different combinations of SNO-Trx1 transnitrosylated proteins (ICAT-H) with untreated proteins (ICAT-L) or Trx1/TrxR/NADPH denitrosylated proteins (ICAT-L) were produced to allow relative quantification of SNO-peptides changes (section 3.7).
3.5 Visualization of SNO-proteins by 1D Western blotting
To confirm proper ICAT labeling of SNO-proteins following BST (section 3.4), ICAT-labeled proteins can be visualized by Western blotting without affinity enrichment. Protein pellets (15 μg) were solubilized in a SDS-PAGE loading buffer (100 mM Tris, pH 6.8, 2% SDS, 15% glycerol, 0.01% bromophenol blue) and separated by a SDS-PAGE gel. Resolved proteins were transferred to a nitrocellulose membrane (0.45 μm; BioRad, Benicia, CA, USA), and the nonspecific antibody binding sites in the membrane were blocked with 5% milk and 0.1% Tween 20. The membrane was probed with an anti-biotin antibody (1:3,000) (Vector Laboratories, Burlingame, CA, USA) and ICAT labeled proteins were visualized with enhanced chemiluminescent substrate (PerkinElmer, Waltham, MA, USA).
3.6 Visualization of SNO-proteins by 2D Western blotting and Sypro Ruby staining
In order to improve protein resolution for global quantitative analysis, two-dimensional gel electrophoresis (2DE) can be performed. 2DE-resolved total proteins can be blotted using the anti-biotin antibody to evaluate for the changes in global SNO-protein levels. Alternatively, ICAT-labeled proteins can be enriched by an avidin column, and proteins recovered from the affinity column can be resolved by 2DE for mass spectrometry identification of SNO-proteins. For 2D Western analysis, ICAT labeled protein pellets (100 μg) were first dissolved in the 2DE buffer (7 M urea, 2 M thiourea, 4% CHAPS, 65 mM DTT, 0.2% BioLyte, pH 3–10, and 0.01% bromophenol blue). For the isoelectric focusing (IEF) step, the protein solutions were loaded onto 11 cm IPG strips (pH 3–10 NL, BioRad, Benicia, CA, USA). IEF was performed with a Protean IEF Cell (BioRad, Benicia, CA, USA) at 20 °C, using the following settings: 12 h rehydration at 50 V, 0.5 h ramping to 250 V, 3 h ramping to 8,000 V and held at 8,000 V for 6 h. After IEF, the proteins on the IPG strips were reduced with DTT (2% w/v) for 15 min and then alkylated with iodoacetamide (2.5% w/v) in an equilibration buffer (6 M urea, 375 mM Tris-HCl, pH 8.8, 2% SDS and 20% glycerol) for 15 min. The second dimension separation was performed on 12.5% SDS-PAGE gels at 120 V. Subsequently, the proteins in each gel were either visualized by Sypro Ruby staining or transferred onto a nitrocellulose membrane (0.45 μm; BioRad, Benicia, CA, USA); ICAT labeled SNO-proteins were detected by an anti-biotin antibody as described above. Differentially labeled proteins determined by Sypro Ruby staining or from Western blotting can be identified by tandem mass spectrometry methods described below.
3.7 ICAT labeling for quantitative determination of SNO-peptides
Although 2DE coupled with tandem MS is effective at identifying proteins whose S-nitrosylation status is altered by the activities of transnitrosylases or denitrosylases, this approach typically does not reveal the precise sites of modification. Therefore quantitative ICAT analysis by LC/MS/MS can bridge this gap. Depending on its redox state, Trx1 can act as transnitrosylase or as a denitrosylase; the latter when Trx1 is engaged with the Trx reducing system (Trx1/TrxR/NADPH)(6, 20). To delineate which proteins are targets of the two opposite functions of Trx1, SNO-proteins can be labeled with either ICAT-L or -H instead of the conventional biotin-HPDP reagent in BST.
3.7.1
For ICAT-based quantification of SNO-Trx1 transnitrosylase target peptides (section 3.3), 300 μg of SNO-Trx1 treated proteins were processed via BST and labeled with 240 μg of ICAT-H, while buffer treated control proteins were labeled with 240 μg of ICAT-L.
3.7.2
Alternatively, for the identification of Trx1 denitrosylase targets that were initially S-nitrosylated by SNO-Trx1, 300 μg SNO-Trx1 transnitrosylated proteins were denitrosylated by incubation with 5 μM Trx1, 100 nM TrxR and 200 μM NADPH (the latter are needed to maintain Trx1 denitrosylase activity) in a total volume of 0.5 ml LB [20] at 37 °C for 30 min. The resulting proteins were labeled with 240 μg ICAT-L during BST. An equal amount of SNO-Trx1 transnitrosylated proteins were labeled with 240 μg ICAT-H for comparison.
3.7.3
Following ICAT labeling, excess ICAT reagents were removed from each reaction mixture by ice-cold acetone precipitation and the protein pellets were dissolved in 8M urea. For each pair-wise comparison, the corresponding ICAT-H and ICAT-L labeled proteins were mixed at a 1:1 mass ratio, diluted 10-fold with 50 mM NH4HCO3 (pH 8.3) and subjected to trypsin digestions at a 50:1 protein/trypsin ratio at 37 °C overnight.
3.8 Affinity capture of ICAT-labeled peptides
Mixtures of ICAT-H and ICAT-L labeled peptides were enriched by the biotin affinity chromatography procedures using an avidin column provided in the cleavable ICAT kit according to the manufacturer’s (AB Sciex, Foster City, CA, USA) protocol outlined below:
3.8.1
Dilute the mixture of ICAT-L and -H labeled peptides by adding 500 μl or more of the Loading Buffer (LB, 2x PBS, pH 7.2), to adjust the pH to 7.0.
3.8.2
Slowly inject (~1 drop/second) the peptides onto the avidin cartridge and collect the flow-through. Inject 500 μl of the LB onto the cartridge and collect the eluate.
3.8.3
Inject 1 ml of the Wash Buffer 1 (1 × PBS, pH 7.2) followed by 1 ml of the Wash Buffer 2 (50 mM NH4HCO3 and 20% methanol) and 1 ml of distilled water to clean the cartridge and remove nonspecifically bound peptides.
3.8.4
To elute the ICAT-labeled peptides, slowly inject (~1 drop/second) 750 μl of the Elute Buffer (30% acetonitrile (ACN) and 0.4% trifluoroacetic acid (TFA)) onto the cartridge and collect the eluate. Evaporate the affinity-captured eluate to dryness in a speed vac.
3.8.5
Add 90 μl of the freshly prepared Cleaving Reagent (95% TFA and 5% scavenger to minimize side reactions) to the sample tube, vortex to mix, and incubate the mixture for 2 h at 37 °C.
3.8.6
The cleaved peptides were completely dried in a speed vac, desalted by on a C18 spin column (Thermo Fisher Scientific Rockford, IL, USA) and reconstituted in 5 μl of 2% ACN and 0.1% formic acid for LC/MS/MS analysis (Section 3.9).
3.9 Identification of SNO-peptides and mapping of SNO-Cys sites
For LC/MS/MS analysis, ICAT-labeled peptides were first separated by a Dionex UltiMate® 3000 reversed phase liquid chromatography system, using a PepMap 100 C18 column (75 μm × 150 mm, 3 μM, 100 Å, Dionex, Sunnyvale, CA, USA). The LC-resolved peptides were analyzed using a Waters API-US QTOF MS system with a nano-ESI source (New Objectives, Boston, USA). MS spectra (m/z 400–1,900) were acquired in the positive ion mode. Argon was used as the collision gas. The collision energy was set from 16 to 60 V, depending on the precursor ion charge state and mass to charge ratios (m/z). MS/MS spectra were acquired in the Data-Dependent Analysis (DDA) mode, in which the three most abundant precursors with two to five charges from each MS survey scan were selected for MS/MS analysis. Following data acquisition, PKL files were generated with ProteinLynx (v2.1). Peptide identification and SNO-Cys localization was accomplished by searching the PKL files against a human Swissprot protein database (containing 20,258 entries, 08/10/2010) using the Mascot search engine (v2.2); the following search parameters were used: trypsin was selected with 1 missed cleavage; mass tolerance of 200 ppm was set for precursor mass and 0.6 Da for MS/MS mass; either ICAT-C (ICAT-L) or ICAT-C:13C(9) (ICAT-H)-modified or MMTS-modified cysteines and oxidized methionines were set as variable modifications. For MS/MS identification of the peptides’ S-nitrosylation site, a Mascot score threshold was set > 29, corresponding to a confidence interval of 95% or better. The matched spectra were also manually validated for the precise location of the ICAT-modified cysteines. The peptide and protein identification false discovery rates (FDRs) were evaluated with a target-decoy database search strategy [27], with all protein and peptide FDR values from the different experiments calculated to be ≤0.5%. Alternatively, the LC-resolved ICAT-labeled peptides were analyzed using a LTQ-Orbitrap Velos tandem MS system with a nano-ESI source (Thermo Fisher Scientific Rockford, IL, USA). MS spectra (m/z, 400–2,000) were acquired in the positive ion mode with a resolution of 60,000 for the precursor ion scan. MS/MS spectra were acquired in the DDA mode, in which the top 10 most abundant precursor ions with at least a 300 ion count threshold from each MS survey scan were selected for MS/MS analysis. Collision-induced dissociation (CID) was used for fragmentation with a 2 Da isolation window, at a normalized collision energy of 35%. The resulting raw spectral files were submitted to the Proteome Discoverer/Mascot (Thermo Fisher Scientific, V 1.3) for SNO-peptide identification, SNO-Cys localization and ICAT-based peptide quantification.
3.10 Quantitative data analysis
Once an ICAT-L or ICAT-H labeled peptide was identified by Mascot search, the extracted ion chromatograms for the corresponding ICAT-L and -H pairs were used to calculate the relative ratios between ICAT-H to ICAT-L labeled peptides. To estimate the analytical variation of ICAT-based peptide quantification, SH-SY5Y cell lysate was incubated with GSNO, and equal amounts of the resulting SNO-proteins were labeled using either ICAT-L or -H reagent with the modified BST protocol described above, and then mixed in a 1:1 ratio. After tryptic digestion, ICAT-labeled peptides were enriched and detected by LC/MS/MS for peptide identification (same as section 3.9) and quantification. Since ICAT-L or -H reagent labeled proteins were mixed in a 1:1 ratio, the expected ICAT (H/L) ratio was one. The experiment was repeated three times to calculate the standard deviation of the ICAT ratios to estimate analytical variation, and to establish a statistical benchmark of ICAT fold change of <0.78 for protein denitrosylation or >1.22 for transnitrosylation, both with a 95% confidence interval. Alternatively, Proteome Discoverer software can be used for automatic identification and quantification of ICAT-labeled peptides. The raw spectrum file ws imputed for peptide identification using Spectrum Selector and Mascot, and Events Detector and Precursor Ions Quantifier were used for peptide quantification. In the Spectrum Selectors, the minimum and maximum precursor masses were set as 350 Da and 10,000 Da, respectively. Mascot search parameters were set up the same as described in section 3.9 except that the precursor mass tolerance was set at 10 ppm. For quantification, the mass precision was set at 2 ppm for event detection. A factory preset ICAT quantification method was used as the Precursor Ions Quantifier; the areas of the extracted ion chromatograms of ICAT-labeled peptides were used for calculating the ratios of ICAT-H/L. No normalization was applied for calculating SNO-peptide ratios. Quantitative data were expressed as mean±standard error (SEM). Statistical analysis was performed using the two-tailed unpaired Student’s t-test with Microsoft Excel. Differences were considered significant with P<0.05 and ICAT ratios of >1.22 or <0.78 were considered significant for transnitrosylation or denitrosylation, respectively.
4. Results and Discussion
4.1 ICAT modified BST can effectively label SNO- proteins
In order to quantitatively detect changes in SNO-proteins from the activation of transnitrosylases and denitrosylases, we used ICAT reagents instead of biotin-HPDP during the application of the BST. The BST method involves three steps: free cysteine thiols are first alkylated with MMTS (Fig. 1A); SNO-Cys are then reduced by ascorbate without also reducing disulfide bonds or other oxidative cysteine PTMs (Fig. 1B), and lastly, the newly-exposed cysteine free thiols are alkylated by either the “light” or “heavy” version of the ICAT reagents (Fig. 1C). ICAT reagents have been proved to be good replacements for biotin-HPDP in BST [28, 29]. Labeling of SNO-peptides with the ICAT reagent provide a means to accurately quantify the extent of S-nitrosylation (Fig. 1, D to K).
Figure 1. BST/ICAT work flow for the quantification of Trx1 transnitrosylase and denitrosylase target SNO-peptides.

There are nine steps involved in this procedure; A: Free thiols in proteins are first blocked with MMTS; B: Nitrosothiol reduction by ascorbate; C: Labeling of the newly formed free thiols with ICAT; D: Mixing ICAT light and heavy reagents-labeled proteins; E: Trypsin digestion of the protein mixtures; F: Enrichment of ICAT-labeled peptides using an avidin cartridge; G: TFA cleavage of biotins from ICAT-labeled peptides; H: Desalting of the cleaved peptides; I: Identification of SNO-Cys site and quantification of SNO-peptides by LC/MS/MS. J: An example MS spectrum of SNO-GAPDH [235-248] quantification by ICAT. K: An example MS spectrum of the identification of SNO-GAPDH [235-248] and localization of SNO-Cys247 by MS/MS. Modified from Wu et al., 2011 (6).
To illustrate the application of ICAT-based BST for the quantification of SNO-peptide changes catalyzed by transnitrosylases, we first utilized SNO-Trx1 as a transnitrosylase to increase S-nitrosylation of proteins isolated from SH-SY5Y cells. Subsequently, we performed ICAT-based BST to label free thiols derived from the SNO-Cys sites with either light or heavy ICAT reagent; SNO-Trx1 transnitrosylated proteins were labeled with ICAT-H and buffer-treated proteins were labeled with ICAT-L (Fig. 1C). Equal amounts of ICAT-H and ICAT-L labeled proteins were mixed together for subsequent proteomics analysis of SNO-peptide increases as the result of SNO-Trx1 transnitrosylation (Fig. 1, D–K).
In a separate experimental design, in order to demonstrate the utility of ICAT-based BST for the quantification SNO-peptide changes catalyzed by denitrosylases, an aliquot of SNO-Trx1 transnitrosylated proteins was treated with the Trx1/TrxR/NADPH denistrosylase system and the remaining SNO-proteins were labeled with ICAT-L following BST (Fig. 1C). A mixture of ICAT-H and –L labeled proteins was processed to identify and quantify the decrease of SNO-peptides following the denitrosylation reaction (Fig. 1, D–K).
4.2 Gel-based analysis of ICAT-labeled proteins revealed the presence of specific Trx1 transnitrosylation and denitrosylation targets
As each ICAT reagent has a biotin tag, the ICAT-labeled proteins can be detected by Western blotting to verify proper protein labeling during the BST procedures, using an anti-biotin antibody. Following SNO-Trx1 treatment, overall SNO-protein levels were increased over untreated protein extracts (Supplemental Fig. 1, first two lanes). Subsequent addition of TrxR/NADPH activated Trx1 demonstrated denitrosylation activity towards many SNO-Trx1 transnitrosylated proteins, reducing their S-nitrosylation levels (Supplemental Fig. 1, last two lanes). It is also apparent that not all SNO-protein signals are equally affected by the treatments with SNO-Trx1 and the Trx1 denitrosylation system, suggesting that not all proteins are transnitrosylation or denitrosylation targets of Trx1.
In order to better resolve and detect SNO-Trx1 transnitrosylation target proteins, we also analyzed the ICAT-labeled SNO-proteins by Western blotting following 2DE separations of ICAT-labeled protein. Although there are a few SNO-proteins in the untreated extracts, substantially more SNO-proteins were detected from SNO-Trx1 transnitrosylated proteins compared to buffer treatment alone (Fig. 2, A and B), with proteins in the 40 and 60 kd acidic region of 2DE being especially sensitive to SNO-Trx1 transnitrosylation.
Figure 2. Anti-biotin Western blotting of 2DE-resolved and ICAT-labeled proteins following SNO-Trx1 transnitrosylation.
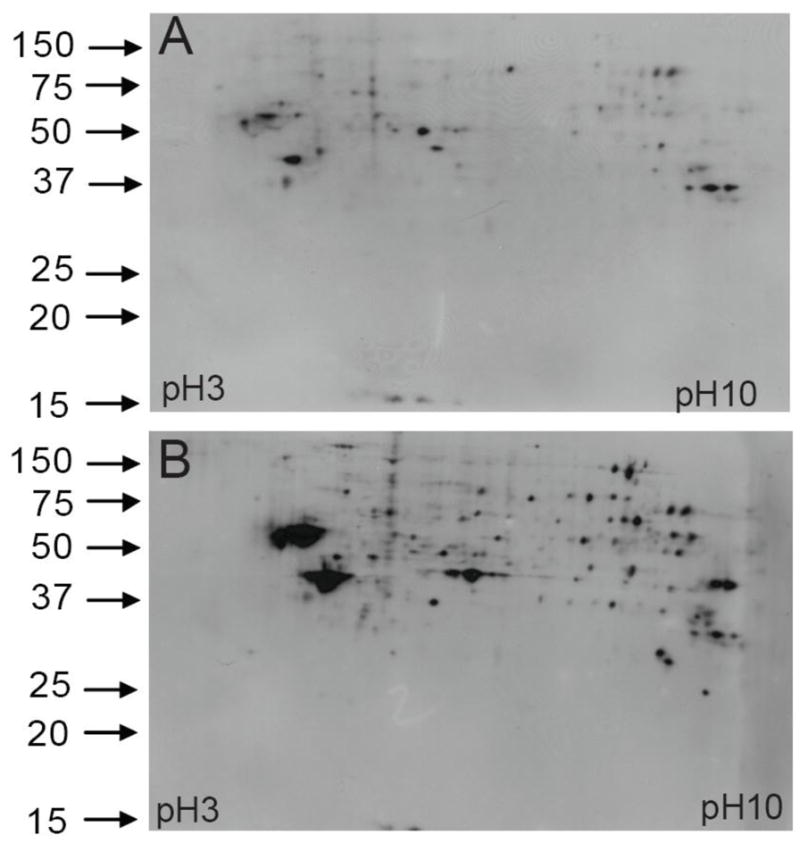
ICAT labeled protein pellets (100 μg) were first dissolved in a 2DE buffer and loaded onto IPG strips for isoelectric focusing (IEF). After IEF, the proteins on the IPG strips were reduced with DTT and alkylated with iodoacetamide, followed by the second dimension of separation in SDS gels. Subsequently, the proteins in each gel were transferred onto a nitrocellulose membrane. ICAT labeled SNO-proteins were detected by an anti-biotin antibody. A: Endogenous SNO-proteins isolated from SH-SY5Y cells. B: Increase of select SNO-proteins following SNO-Trx1 treatment, as seen from both the number and levels of SNO-protein signals detected.
4.3 Quantification of Trx1 transnitrosylation and denitrosylation target peptides by ICAT
The biological significance of Trx1 as a transnitrosylase or denitrosylase is its ability to modulate specific SNO-Cys modification sites within target proteins. However, the global SNO-protein quantification information obtained by 1D or 2D gel is inadequate at providing site-specific modification information. ICAT-based BST and other proteomics methods are needed to provide such essential data for downstream functional determination of the significance of dynamically regulated SNO-Cys residues in Trx1 target proteins. In the methods outlined here, we first quantified SNO-peptides increased by the incubation of neuroblastoma cell proteins with SNO-Trx1. Following the BST procedures, SNO-proteins were labeled with ICAT-H and buffer-treated proteins were labeled with ICAT-L. Both samples were mixed at a 1:1 ratio; the increase of SNO-peptides in SNO-Trx1 transnitrosylation targets was quantified by the ICAT ion signals in the LC/MS spectra, and the SNO-Cys sites were identified by MS/MS as described below. In a separate experiment setup to detect denitrosylation target SNO-peptides of Trx1, the SNO-Trx1 transnitrosylated samples were treated with the Trx1/TrxR/NADPH system, and labeled with ICAT-L in the BST. Transnitrosylated (ICAT-H labeled) and denitrosylated (ICAT-L labeled) proteins were also mixed in a 1:1 ratio. After obtaining the two mixtures of ICAT-H and -L labeled proteins, proteins were digested by trypsin and the ICAT-labeled peptides enriched by an avidin column. SNO-peptides were identified and quantified by LC/MS/MS [6]. For the quantification of ICAT labeled peptides, we used the LC extracted ion chromatogram areas of each ICAT-labeled peptide for calculating ICAT peptide abundance ratios. A significantly higher ICAT-H to ICAT-L ratio in repeat transnitrosylation experiments suggested a SNO-peptide to be a putative SNO-Trx1 transnitrosylation target. On the other hand, for the Trx1/TrxR/NADPH denitrosylation reactions, a lower ICAT-L over ICAT-H labeled MS peak measured the degree of Trx1 denitrosylase activity towards a SNO-peptide. For example, a tryptic peptide (amino acid 17-31) derived from 60S ribosomal protein L12 (RL12_HUMAN) with a SNO-Cys17 was among the target sequences sensitive to both transnitrosylation and denitrosylation by Trx1 (Fig. 3, A–C). MS/MS analysis revealed the SNO-Cys site to be labeled with an extra mass corresponding to an ICAT-H (Fig. 3A). Following SNO-Trx1 transnitrosylation, LC/MS analysis indicated an ICAT-H/ICAT-L peptide ratio of 2.5 for RL12 peptide 17-31, suggesting that Cys17 is very sensitive to transnitrosylation by SNO-Trx1 (Fig. 3B). By comparison, an ICAT-H/ICAT-L peptide ratio of 1.6 for the same peptide following Trx1/TrxR/NADPH denitrosylation, suggests that SNO-Cys17 can be denitrosylated by Trx1 (Fig. 3C).
Figure 3. Identification and quantification of Trx1 target SNO-peptides.

A: Example MS/MS spectrum of RL12_HUMAN peptide 17-C*TGGEVGATSALAPK-31 (M2+ 799.44, C*: ICAT-H-labeled cysteine). B: Dramatic increase of SNO-RL12 [Cys17-Lys31] from the MS spectrum of ICAT-L (control) and ICAT-H (SNO-Trx1 treated) ion signals indicates the degree of transnitrosylation. C: Dramatic decrease of SNO-RL12 [Cys17-Lys31] from MS spectrum of ICAT-H (control) and ICAT-L (Trx1/TrxR/NADPH treated) ion signals indicates the degree of denitrosylation. D: MS/MS spectrum of SNO-Trx1 peptide 73-C*MPTFQFFK-81 (M2+ 692.85, C*: ICAT-H-labeled cysteine). E: Dramatic decrease of SNO-Trx1 [Cys73-Lys81] from the MS spectrum of ICAT-L (control) and ICAT-H (SNO-Trx1 treated) ion signals indicates the degree of NO transfer from SNO-Trx1 onto the target proteins. F: Dramatic decrease of SNO-Trx1 [Cys73-Lys81] from MS spectrum of ICAT-H (control) and ICAT-L (Trx1/TrxR/NADPH treated) ion signals indicates the degree of denitrosylation of SNO-Trx1 by reacting with Trx1/TrxR/NADPH.
As expected, SNO-Trx1 was detected by ICAT analysis in both transnitrosylation and denitrosylation ICAT mixtures (Fig. 3D–F). Once SNO-Trx1 was mixed with target proteins in the transnitrosylation reaction, ICAT analysis indicated an 80% decrease of a SNO-Cys73-containing Trx1 tryptic peptide (Fig. 3D–E), supporting the role of SNO-Trx1 transfer of its NO onto the recipient peptides. Furthermore, SNO-Trx1 itself is also sensitive to Trx1/TrxR/NADPH denitrosylation, as indicated by a 70% decrease of the SNO-Cys73-containing Trx1 tryptic peptide (Fig. 3F). In this experiment we used relatively large amounts of SNO-Trx1 and Trx1/TrxR/NAPDH in the in vitro transnitrosylation and denitrosylation experiments, in order to observe SNO-peptide changes for lower abundant SNO-proteins, which otherwise might not be able to compete with other proteins for the transfer of NO. However, like any proteomics experiments, the presence of higher amount of proteins could hinder the detection of lower abundant proteins. Therefore, one way to minimize the impact of interference of large amounts of transnitrosylase or denitrosylase is to use enzymes immobilized on beads that can be easily separated from the target SNO-proteins prior to tryptic digestion.
4.4 Quantitative data validation
Many of the proteins discovered from this in vitro study were previously reported to be either transnitrosylated or denitrosylated by Trx1 (or related oxidoreductases) in vivo [6, 20], supporting the effectiveness of the current quantitative proteomics approach. However, given the complexity of biological experimental systems, it is important that once an ICAT-L or ICAT-H labeled peptide is quantified, the extent of transitrosylase or denitrosylase-mediated SNO-peptide change should be validated by repeat experiments and alternative approaches, using biotin-HPDP or other biotinylating reagents, instead of ICAT reagents. Typically, the validation is carried out by using BST processing of the SNO-proteins isolated from cells with activated transnitrosylase, denitrosylase and relevant control conditions, followed by Western Blotting of specific target proteins enriched by avidin affinity column [4, 6]. Alternatively, fluorescently-labeled and biotinylated Cye-dyes can be used, in a method referred to as SNO-DIGE [30]. The SNO-protein changes quantified by Western blotting or similar methods should match the direction of SNO-peptide changes by ICAT quantification. As discussed previously, global protein-based quantification may not capture site-specific changes if multiple sites within a protein are differentially regulated by different transnitrosylases or denitrosylases. Site-specific nitrosylation changes can be validated by Western blotting if SNO-Cys-specific antibodies are available. On the other hand, a mass spectrometric methods called selected reaction monitoring (SRM) or the multiple-reaction monitoring (MRM) approach can be developed to quantify SNO-Cys containing peptide changes among a large number of biological samples [31].
5. Conclusions
Here we present a protocol for quantitative identification of in vitro Trx1 transnitrosylase and denitrosylase target peptides using a modified biotin switch method, with ICAT regents replacing conventional biotin-HPDP. Combining this method with LC/MS/MS techniques, the SNO-Cys within target peptides can be identified and the relative changes of SNO-peptides following transnitrosylase and denitrosylase treatment can be easily determined by ICAT ratios. With this approach, we were able to identify putative Trx1-mediated transnitrosylation and denitrosylation targets in neuroblastoma cells. The results from this study have provided direct evidence that Trx1 is an enigmatic protein with both transnitrosylase and denitrosylase activities. Use of the described ICAT method coupled to BST for studying other cell and biological systems will likely provide a more comprehensive understanding of the precise role of both transnitrosylases and denitrosylases in regulating target proteins in specific physiological or pathological signal transduction pathways.
Supplementary Material
A SH-SY5Y cell lysate was incubated with or without SNO-Trx1. Subsequently, an aliquot of SNO-Trx1 transnitrosylated lysate was further denitrosylated with Trx1/TrxR/NADPH, followed by BST processing. SNO-proteins in the lysates treated with SNO-Trx1 were labeled with ICAT-H, while the untreated lysate and denitrosylated proteins were independently labeled with ICAT-L. Proteins were then resolved by a SDS-PAGE gel and ICAT-labeled proteins were detected by Western blotting with an anti-biotin antibody. Adapted from Wu et al., 2011 [6].
Highlights.
Quantitative proteomics methods can measure changes of peptide S-nitrosylation status.
Transnitrosylases catalyze increased S-nitrosylation of specific peptides
Denitrosylases catalyze decreased S-nitrosylation of specific peptides
Quantitative proteomics information can be used to characterize transnitrosylase and denitrosylase activities
Acknowledgments
The authors are grateful for funding support from NIH grant NS046593 to H.L and for the continued support of the NINDS NeuroProteomics Core Facility at UMDNJ-New Jersey Medical School.
Abbreviations
- 2DE
two-dimensional gel electrophoresis
- ACN
acetonitrile
- BCA
bicinchoninic acid
- Biotin-HPDP
N-[6-(Biotinamido)hexyl]-3′-(2′-pyridyldithio)-propionamide
- BST
biotin-switch technique
- CID
collision induced dissociation
- DDA
data-dependent analysis
- ESI
electrospray ionization
- ENOA
human α-enolase
- FDR
false discovery rate
- GAPDH
glyceraldehyde 3-phosphate dehydrogenase
- GSNO
S-nitrosoglutathione
- ICAT
isotope-coded affinity tags
- ICAT-H
ICAT heavy reagent
- ICAT-L
ICAT light reagent
- IEF
isoelectric focusing
- iTRAQ
isobaric tag for relative and absolute quantitation
- LB
lysis buffer
- MALDI
matrix-assisted laser desorption ionization
- MMTS
methyl methanethiosulfonate
- MRM
multiple-reaction monitoring
- MS/MS
tandem mass spectrometry
- NADPH
nicotinamide adenine dinucleotide phosphate
- NB
S-nitrosylation buffer
- PTM
post-translational modification
- RB
resuspension buffer
- SILAC
stable isotope labeling with amino acids in cell culture
- SNO-Cys
S-nitrosylated cysteine
- SNOSID
SNO-site identification
- SNO-Trx1
S-nitrosylated thioredoxin 1
- TFA
trifluoroacetic acid
- TMT
Tandem Mass Tags
- Trx
thioredoxin
- TrxC32S/C35S
Cys32 and Cys35 to Ser Trx1 mutant
- TrxR
Trx reductase
Footnotes
Publisher's Disclaimer: This is a PDF file of an unedited manuscript that has been accepted for publication. As a service to our customers we are providing this early version of the manuscript. The manuscript will undergo copyediting, typesetting, and review of the resulting proof before it is published in its final citable form. Please note that during the production process errors may be discovered which could affect the content, and all legal disclaimers that apply to the journal pertain.
References
- 1.Xu L, Eu JP, Meissner G, Stamler JS. Science. 1998;279:234–237. doi: 10.1126/science.279.5348.234. [DOI] [PubMed] [Google Scholar]
- 2.Benhar M, Forrester MT, Hess DT, Stamler JS. Science. 2008;320:1050–1054. doi: 10.1126/science.1158265. [DOI] [PMC free article] [PubMed] [Google Scholar]
- 3.Duan S, Chen C. Cell Mol Immuno. 2007;14:353–358. [PubMed] [Google Scholar]
- 4.Wu C, Liu T, Chen W, Oka S, Fu C, Jain MR, Parrott AM, Baykal AT, Sadoshima J, Li H. Mol Cell Proteomics. 2010;9:2262–2275. doi: 10.1074/mcp.M110.000034. [DOI] [PMC free article] [PubMed] [Google Scholar]
- 5.Wu C, Parrott AM, Fu C, Liu T, Marino SM, Gladyshev VN, Jain MR, Baykal AT, Li Q, Oka S, Sadoshima J, Beuve A, Simmons WJ, Li H. Antioxid Redox Signal. 2011;15:2565–2604. doi: 10.1089/ars.2010.3831. [DOI] [PMC free article] [PubMed] [Google Scholar]
- 6.Wu C, Parrott AM, Liu T, Jain MR, Yang Y, Sadoshima J, Li H. J Proteomics. 2011;74:2498–2509. doi: 10.1016/j.jprot.2011.06.001. [DOI] [PMC free article] [PubMed] [Google Scholar]
- 7.Benhar M, Forrester MT, Stamler JS. Nat Rev Mol Cell Biol. 2009;10:721–732. doi: 10.1038/nrm2764. [DOI] [PubMed] [Google Scholar]
- 8.Forrester MT, Seth D, Hausladen A, Eyler CE, Foster MW, Matsumoto A, Benhar M, Marshall HE, Stamler JS. J Biol Chem. 2009;284:36160–36166. doi: 10.1074/jbc.M109.057729. [DOI] [PMC free article] [PubMed] [Google Scholar]
- 9.Ago T, Sadoshima J. J Mol Cell Cardiol. 2006;41:41, 762–773. doi: 10.1016/j.yjmcc.2006.08.006. [DOI] [PMC free article] [PubMed] [Google Scholar]
- 10.Yamamoto M, Yang G, Hong C, Liu J, Holle E, Yu X, Wagner T, Vatner SF, Sadoshima J. J Clin Invest. 2003;112:1395–1406. doi: 10.1172/JCI17700. [DOI] [PMC free article] [PubMed] [Google Scholar]
- 11.Gow AJ, Davis CW, Munson D, Ischiropoulos H. Methods Mol Biol. 2004;279:167–172. doi: 10.1385/1-59259-807-2:167. [DOI] [PubMed] [Google Scholar]
- 12.Jaffrey SR, Snyder SH. Sci STKE. 2001;86:pl1. doi: 10.1126/stke.2001.86.pl1. [DOI] [PubMed] [Google Scholar]
- 13.Sun J, Morgan M, Shen RF, Steenbergen C, Murphy E. Circ Res. 2007;101:1155–1163. doi: 10.1161/CIRCRESAHA.107.155879. [DOI] [PubMed] [Google Scholar]
- 14.Kuncewicz T, Sheta EA, Goldknopf IL, Kone BC. Contrib Nephrol. 2004;141:221–230. doi: 10.1159/000074600. [DOI] [PubMed] [Google Scholar]
- 15.Hao G, Derakhshan B, Shi L, Campagne F, Gross SS. Proc Natl Acad Sci USA. 2006;103:1012–1017. doi: 10.1073/pnas.0508412103. [DOI] [PMC free article] [PubMed] [Google Scholar]
- 16.Sayed N, Baskaran P, Ma X, van den Akker F, Beuve A. Proc Natl Acad Sci USA. 2007;104:12312–12317. doi: 10.1073/pnas.0703944104. [DOI] [PMC free article] [PubMed] [Google Scholar]
- 17.Barglow KT, Knutson CG, Wishnok JS, Tannenbaum SR, Marletta MA. Proc Natl Acad Sci USA. 2011;108:E600–6. doi: 10.1073/pnas.1110736108. [DOI] [PMC free article] [PubMed] [Google Scholar]
- 18.Chen YY, Chu HM, Pan KT, Teng CH, Wang DL, Wang AH, Khoo KH, Meng TC. J Biol Chem. 2008;283:35265–35272. doi: 10.1074/jbc.M805287200. [DOI] [PMC free article] [PubMed] [Google Scholar]
- 19.Wang Y, Liu T, Wu C, Li H. J Am Soc Mass Spectrom. 2008;19:1353–1360. doi: 10.1016/j.jasms.2008.06.001. [DOI] [PMC free article] [PubMed] [Google Scholar]
- 20.Benhar M, Thompson JW, Moseley MA, Stamler JS. Biochemistry. 2010;49:6963–6969. doi: 10.1021/bi100619k. [DOI] [PMC free article] [PubMed] [Google Scholar]
- 21.Paige JS, Xu G, Stancevic B, Jaffrey SR. Chem Biol. 2008;15:1307–1316. doi: 10.1016/j.chembiol.2008.10.013. [DOI] [PMC free article] [PubMed] [Google Scholar]
- 22.Forrester MT, Thompson JW, Foster MW, Nogueira L, Moseley MA, Stamler JS. Nat Biotechnol. 2009;27:557–559. doi: 10.1038/nbt.1545. [DOI] [PMC free article] [PubMed] [Google Scholar]
- 23.Murray CI, Uhrigshardt H, O’Meally RN, Cole RN, Van Eyk JE. Mol Cell Proteomics. 2012;11:M111.013441. doi: 10.1074/mcp.M111.013441. [DOI] [PMC free article] [PubMed] [Google Scholar]
- 24.Held JM, Danielson SR, Behring JB, Atsriku C, Britton DJ, Puckett RL, Schilling B, Campisi J, Benz CC, Gibson BW. Mol Cell Proteomics. 2010;9:1400–1410. doi: 10.1074/mcp.M900643-MCP200. [DOI] [PMC free article] [PubMed] [Google Scholar]
- 25.Knipp M, Braun O, Gehrig PM, Sack R, Vasak M. J Biol Chem. 2003;278:3410–3416. doi: 10.1074/jbc.M209088200. [DOI] [PubMed] [Google Scholar]
- 26.Forrester MT, Foster MW, Benhar M, Stamler JS. Free Radic Biol Med. 2009;46:119–126. doi: 10.1016/j.freeradbiomed.2008.09.034. [DOI] [PMC free article] [PubMed] [Google Scholar]
- 27.Fu C, Hu J, Liu T, Ago T, Sadoshima J, Li H. Quantitative analysis of redox-sensitive proteome with DIGE and ICAT. J Proteome Res. 2008;7:3789–3802. doi: 10.1021/pr800233r. [DOI] [PMC free article] [PubMed] [Google Scholar]
- 28.Aracena-Parks P, Goonasekera SA, Gilman CP, Dirksen RT, Hidalgo C, Hamilton SL. J Biol Chem. 2006;281:40354–40368. doi: 10.1074/jbc.M600876200. [DOI] [PubMed] [Google Scholar]
- 29.Zhang X, Huang B, Zhou X, Chen C. Protein Cell. 2010;1:675–687. doi: 10.1007/s13238-010-0087-x. [DOI] [PMC free article] [PubMed] [Google Scholar]
- 30.Chouchani ET, Hurd TR, Nadtochiy SM, Brookes PS, Fearnley IM, Lilley KS, Smith RAJ, Murphy MP. Biochem J. 2010;430:49–59. doi: 10.1042/BJ20100633. [DOI] [PMC free article] [PubMed] [Google Scholar]
- 31.Held JM, Gibson BW. Mol Cell Proteomics. 2012;(11):R111.013037. doi: 10.1074/mcp.R111.013037. [DOI] [PMC free article] [PubMed] [Google Scholar]
- 32.Nakamura T, Wang L, Wong CC, Scott FL, Eckelman BP, Han X, Tzitzilonis C, Meng F, Gu Z, Holland EA, Clemente AT, Okamoto S, Salvesen GS, Riek R, Yates JR, 3rd, Lipton SA. Mol Cell. 2010;39:184–195. doi: 10.1016/j.molcel.2010.07.002. [DOI] [PMC free article] [PubMed] [Google Scholar]
- 33.Kornberg MD, Sen N, Hara MR, Juluri KR, Nguyen JV, Snowman AM, Law L, Hester LD, Snyder SH. Nat Cell Biol. 2010;12:1094–1100. doi: 10.1038/ncb2114. [DOI] [PMC free article] [PubMed] [Google Scholar]
- 34.Pawloski JR, Hess DT, Stamler JS. Nature. 2001;409:622–626. doi: 10.1038/35054560. [DOI] [PubMed] [Google Scholar]
- 35.Ramachandran N, Root P, Jiang XM, Hogg PJ, Mutus B. Proc Natl Acad Sci USA. 2001;98:9539–9544. doi: 10.1073/pnas.171180998. [DOI] [PMC free article] [PubMed] [Google Scholar]
- 36.Mitchell DA, Morton SU, Fernhoff NB, Marletta MA. Proc Natl Acad Sci USA. 2007;104:11609–11614. doi: 10.1073/pnas.0704898104. [DOI] [PMC free article] [PubMed] [Google Scholar]
- 37.Liu L, Hausladen A, Zeng M, Que L, Heitman J, Stamler JS. Nature. 2001;410:490–494. doi: 10.1038/35068596. [DOI] [PubMed] [Google Scholar]
- 38.Bateman RL, Rauh D, Tavshanjian B, Shokat KM. J Biol Chem. 2008;283:35756–35762. doi: 10.1074/jbc.M807125200. [DOI] [PMC free article] [PubMed] [Google Scholar]
- 39.Hausladen A, Gow AJ, Stamler JS. Proc Natl Acad Sci USA. 1998;95:14100–14105. doi: 10.1073/pnas.95.24.14100. [DOI] [PMC free article] [PubMed] [Google Scholar]
- 40.Sliskovic I, Raturi A, Mutus B. J Biol Chem. 2005;280:8733–8741. doi: 10.1074/jbc.M408080200. [DOI] [PubMed] [Google Scholar]
Associated Data
This section collects any data citations, data availability statements, or supplementary materials included in this article.
Supplementary Materials
A SH-SY5Y cell lysate was incubated with or without SNO-Trx1. Subsequently, an aliquot of SNO-Trx1 transnitrosylated lysate was further denitrosylated with Trx1/TrxR/NADPH, followed by BST processing. SNO-proteins in the lysates treated with SNO-Trx1 were labeled with ICAT-H, while the untreated lysate and denitrosylated proteins were independently labeled with ICAT-L. Proteins were then resolved by a SDS-PAGE gel and ICAT-labeled proteins were detected by Western blotting with an anti-biotin antibody. Adapted from Wu et al., 2011 [6].