Abstract
Calcineurin B-like protein-interacting protein kinases (CIPKs) have been found to be responsive to abiotic stress. However, their precise functions and the related molecular mechanisms in abiotic stress tolerance are not completely understood, especially in wheat. In the present study, TaCIPK29 was identified as a new member of CIPK gene family in wheat. TaCIPK29 transcript increased after NaCl, cold, methyl viologen (MV), abscisic acid (ABA) and ethylene treatments. Over-expression of TaCIPK29 in tobacco resulted in increased salt tolerance, which was demonstrated by higher germination rates, longer root lengths and better growth status of transgenic tobacco plants compared to controls when both were treated with salt stress. Physiological measurements indicated that transgenic tobacco seedlings retained high K+/Na+ ratios and Ca2+ content by up-regulating some transporter genes expression and also possessed lower H2O2 levels and reduced membrane injury by increasing the expression and activities of catalase (CAT) and peroxidase (POD) under salt stress. Moreover, transgenic lines conferred tolerance to oxidative stress by increasing the activity and expression of CAT. Finally, TaCIPK29 was located throughout cells and it preferentially interacted with TaCBL2, TaCBL3, NtCBL2, NtCBL3 and NtCAT1. Taken together, our results showed that TaCIPK29 functions as a positive factor under salt stress and is involved in regulating cations and reactive oxygen species (ROS) homeostasis.
Introduction
Soil salinity, as a severe abiotic stress factor, limits the growth of most plant species and can cause significant losses in crop yield. Salt stress can affect photosynthesis, growth, energy metabolism, lipid metabolism and protein synthesis [1]. However, plants develop a variety of sophisticated mechanisms to protect themselves from salt stress. The major factors of plant responses to salt stress include perception and transduction of stress signals.
Calcium, as a second messenger, plays an important role in various signal transduction pathways [2]. Several classes of calcium-sensing proteins, including calmodulin (CaM), calmodulin-like (CML), calcineurin B-like (CBL) proteins, and calcium-dependent protein kinases (CDPKs), have been identified in plants [3]. Calcineurin B-like protein-interacting protein kinases (CIPKs) belong to a Ca2+ mediated CBL-CIPK network in response to stress [4]–[7]. Genome-wide analysis has identified 26 CIPKs in Arabidopsis [8], 33 CIPKs in rice [6], [8], 27 CIPKs in poplar [9] and 43 CIPKs in maize [10].
In plants, several CIPKs have been reported to be involved in salt stress responses. Notably, the salt overly sensitive (SOS) pathway is one of the most important signaling pathways in salinity signal transduction [11]–[14]. AtCIPK24/AtSOS2 can interact with AtCBL4/AtSOS3 to function on the Na+/H+ antiporter, AtSOS1/AtNHX7, enhancing salt stress tolerance in roots [15], whereas the AtCBL10-AtCIPK24 complex protects the shoot tissue from salt stress [16]. AtCIPK24/AtSOS2 has also been found to interact with nucleoside triphosphate kinase 2 (NDPK2) as well as AtCAT2/AtCAT3, which are involved in reactive oxygen species (ROS) signaling and scavenging [17]. This evidence indicated that AtCIPK24/AtSOS2 is a crucial regulator in the salt stress signaling network, which can mediate both Na+ homeostasis and the oxidative stress response. Most of the CIPK genes enhancing salt tolerance are similar to AtCIPK24/AtSOS2 such as MdSOS2, MdCIPK6L and ZmCIPK16 [7], [18], [19]. Meanwhile, AtCIPK6, AtCIPK9, HbCIPK2, SlSOS2 and AtCIPK23 have been reported to be involved in K+ homeostasis, in which AtCIPK6 and AtCIPK23 can increase the activity of the plasma membrane K+ transporter such as AKT1 [5], [20], [21], [22], [23]. Therefore, further investigations are necessary to understand whether wheat CIPKs can regulate K+/Na+ homeostasis and ROS scavenging under salt stress. In addition, the interaction between CBLs and CIPKs in wheat is yet to be elucidated.
Internationally, wheat production is affected by many environmental stresses, such as drought, salinity and extreme temperatures. Genetic improvement of stress resistance in wheat is highly desired and understanding the molecular mechanisms of abiotic stress responses is therefore necessary. CIPK genes play an important role in regulating abiotic stress tolerance in plants. In comparison to other species, however, little is known about CIPKs in wheat. Only one CIPK gene, WPK4, has been characterized in wheat, which is involved in light, nutrient deprivation and cytokinin signaling [24], [25]. The main function of the CBL-CIPK network in response to abiotic stress has not been characterized in wheat. In this work, we reported a wheat CIPK gene TaCIPK29 that conferred salt tolerance not only by improving the K+/Na+ ratios and Ca2+ content but also by decreasing H2O2 accumulation and membrane damage.
Results
Cloning and Sequence Analysis of the Full-length TaCIPK29 cDNA
To obtain salt stress responsive CIPK genes in wheat, we referred to the highly similar orthologs in rice. Twelve rice CIPKs (OsCIPK7, OsCIPK8, OsCIPK9, OsCIPK10, OsCIPK11, OsCIPK15, OsCIPK16, OsCIPK17, OsCIPK21, OsCIPK22, OsCIPK29 and OsCIPK30) were reported to be up-regulated by salt stress, whereas only OsCIPK15 was further studied for salt tolerance in rice [26]. Then, we performed TBLASTN analysis in the DFCI database (http://compbio.dfci.harvard.edu/tgi/) using salt-induced rice CIPK protein sequences and found several wheat tentative consensuses (TCs) of these rice CIPK genes (data not shown). Among the wheat CIPK-like TCs, TC371359, which shared 86% similarity and 79% identity with OsCIPK29 in amino acids, encodes a peptide of 306 amino acids that lacked more than 100 amino acid residues in the N-terminal. Importantly, this TC371359 consisted of six expressed sequence tags (ESTs), in which BQ753202 was identified from a salt-stressed root cDNA library (TA065E1X) [27]. These data indicated that TC371359 might be a salt stress responsive CIPK gene in wheat.
Employing the rapid amplification of cDNA ends (RACE) technique, we successfully amplified the full-length cDNA designated as TaCIPK29 (accession no. JX243013). The obtained cDNA of TaCIPK29 was 1862 bp with an ORF of 1311 bp. The TaCIPK29 protein consists of 436 amino acid residues with a predicted relative molecular mass of 47.4 kDa. Multiple sequence alignment suggested that the deduced TaCIPK29 protein contained an N-terminal highly conserved kinase domain, the FISL domain and the PPI domain located in the C-terminal [28] (Fig. S1). Phylogenetic analysis of TaCIPK29 with other CIPKs from Arabidopsis, tobacco, rice and barley indicated that TaCIPK29 was close to OsCIPK29, HvCIPK29, AtCIPK14 and NtCIPK14 in the intron-less subgroup (Fig. S2). To confirm whether TaCIPK29 contained an intron in the wheat genome, we cloned TaCIPK29 by using cDNA and the genomic DNA of wheat as template. The resulted sequences showed TaCIPK29 harbored no intron (data not shown). These results indicated that TaCIPK29 obtained in this study is a member of the CIPK family in wheat.
TaCIPK29 is Expressed in Different Wheat Tissues
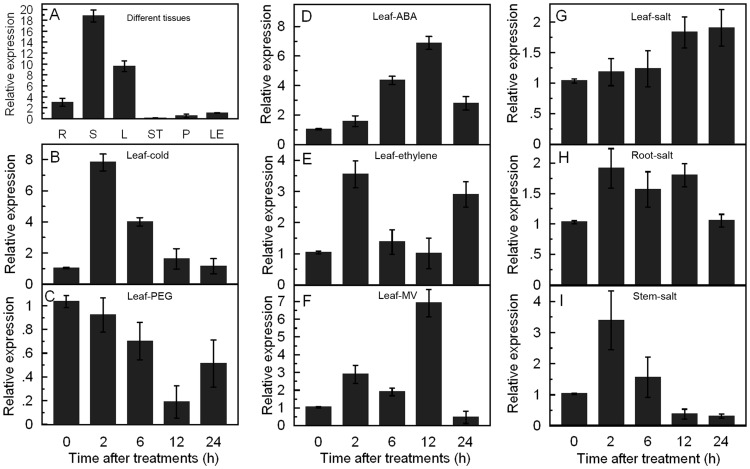
To assess the expression of TaCIPK29 in various wheat tissues, mRNAs were isolated from different tissues of wheat including root, stem, leaf, stamen, pistil and lemma. Quantitative real-time polymerase chain reaction (qRT-PCR) analysis revealed that TaCIPK29 was expressed in all the above tissues, of which the stem and leaf had higher expression levels compared to the other tissues examined (Fig. 1A).
Figure 1. Expression patterns of TaCIPK29 in different tissues in wheat and changes in expression after treatments with PEG6000, NaCl, MV, ABA, and ethylene by qRT-PCR analysis.
A: different organs (R: root; S: stem; L: leaf; ST: stamen; P: pistil; LE: lemma); B: low temperature treatment; C: 20% PEG treatment; D: 100 µM ABA treatment; E: 100 µM ethylene treatment; F: 30 µM MV treatment; G–I: 200 mM NaCl treatment. B–G: leaves samples; H: roots samples; I: stems samples. Vertical bars indicate ±SE of four replicates on one sample. Three biological experiments were performed with similar results.
TaCIPK29 Transcript is Responsive to Abiotic Stress, ABA and Ethylene
To determine the response of TaCIPK29 to abiotic stress, wheat leaves were sampled to determine TaCIPK29 transcript levels after PEG6000, NaCl, low temperature and MV treatment. The results suggested that the transcript of TaCIPK29 was strongly up-regulated by low temperature and MV treatment, marginally induced by NaCl treatment and inhibited by PEG6000 treatment in leaves (Figs. 1B, 1C, 1F and 1G). To further confirm the upregulation of TaCIPK29 under NaCl treatment, qRT-PCR was performed with wheat roots and stems as samples. The results suggested that the expression of TaCIPK29 was obviously induced in stems and marginally induced in roots under NaCl treatment (Figs. 1H and 1I). Various signal molecules play important roles in response to abiotic stress, especially for ABA and ethylene. Thus, the effects of ABA and ethylene on TaCIPK29 transcription were also examined, which indicated that the TaCIPK29 transcript increased after ABA and ethylene treatments (Figs. 1D and 1E).
Generation of Transgenic Tobacco Plants Overexpressing TaCIPK29
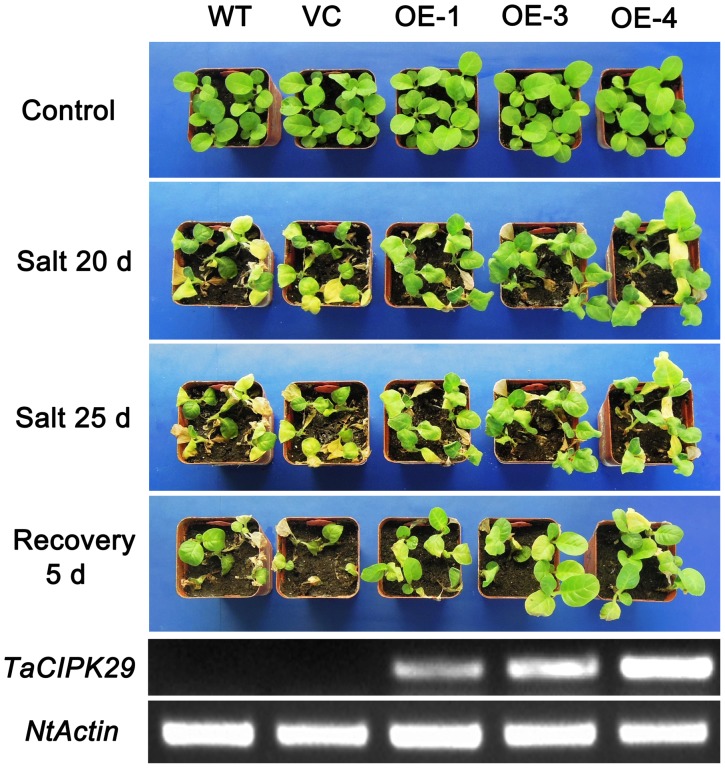
To further detect the function of TaCIPK29 in abiotic stress tolerance, transgenic tobacco plants over-expressing TaCIPK29 under the control of the Cauliflower Mosaic Virus (CaMV) 35S promoter were generated. A total of 18 transgenic lines (T1) were identified by kanamycin-resistant and PCR analysis using primers specific to TaCIPK29 and the green fluorescence protein (GFP) gene (data not shown). Among the T1 lines, three (OE-1, OE-3 and OE-4) exhibited a ratios of ∼3∶1 segregation on the basis of kanamycin resistance. Moreover, seedlings from all three transgenic T2 lines grew well on Murashige and Skoog (MS) medium with 150 mg/L of kanamycin. In addition, tobacco plants transformed with empty vector alone were also subjected to similar analysis. Expression of TaCIPK29 was also determined by RT-PCR, which indicated that TaCIPK29 mRNA was present in all three transgenic lines but not in the vector control (VC) lines and wild-type (WT). Among the T2 lines, OE-3 and OE-4 had higher TaCIPK29 expression levels (Fig. 2).
Figure 2. The analysis of salt tolerance in transgenic lines and controls (VC and WT).
The phenotype of the four-week-old seedlings of transgenic tobacco plants and controls (VC and WT) grown in pots were recorded when plants grown in the absence (control) or in the presence of 300 mM NaCl for 20 and 25 d as well as plants subjected to a 5 d recovery after a treatment with 300 mM NaCl for 25 d. The whole two-week-old seedlings of transgenic plants and control plants (VC and WT) were used to extract RNA to detect TaCIPK29 expression by RT-PCR with NtActin as an internal control. Three biological experiments were carried out with similar results.
Over-expression of TaCIPK29 Enhances Salt Tolerance in Transgenic Tobacco
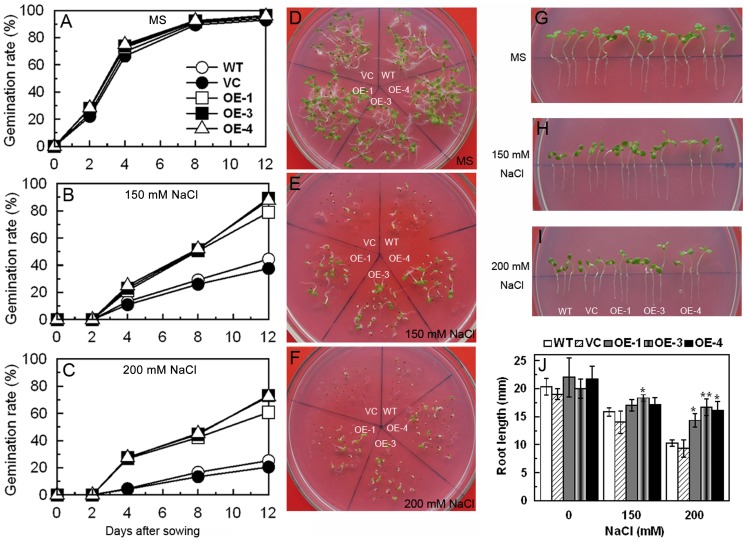
Four-week-old tobacco seedlings grown in pots were treated with 300 mM NaCl to characterize the performance of TaCIPK29 transgenic lines under salt stress in soil. After 20 days or 25 days NaCl treatment, TaCIPK29 transgenic plants survived better with less leaf wilting compared to WT and VC tobacco plants (Fig. 2). Moreover, after recovery, the transgenic lines exhibited stronger survival than WT and VC plants (Fig. 2). In a second experiment, seeds from all three transgenic lines and control lines (WT and VC) were germinated on MS or MS with 150 mM or 200 mM NaCl for 12 d. TaCIPK29-overexpressing lines showed a significantly higher germination rate on the MS medium containing 150 mM and 200 mM NaCl although little difference was observed between controls and transgenic lines under normal conditions (Figs. 3A–F). In addition, tobacco seedlings from transgenic lines and the controls (VC and WT) were cultured on MS for one week, and then were transplanted to MS or MS with 150 mM or 200 mM NaCl for one week to examine the root length. Results showed that transgenic lines displayed lesser suppression of root elongation than the controls (VC and WT) under 150 mM or 200 mM NaCl treatment (Figs. 3G–J). There were no significant differences between controls and the transgenic lines grown on MS. These data suggested that tobacco plants overexpressing TaCIPK29 enhanced salt stress tolerance.
Figure 3. The analysis of salt tolerance in TaCIPK29-overexpressing plants and controls (VC and WT) at early developmental stage.
A total of 200 surface-sterilized seeds of each transgenic line, WT or VC germinated for 12 days on MS medium containing 0 (A, D), 150 (B, E) or 200 mM (C, F) NaCl. Panels A, B and C show the seed germination rates. Panels D, E and F show photographs of plants after 12 days of germination. One-week-old tobacco seedlings were transplanted to MS or MS supplied with 150 or 200 mM NaCl for one week. Panels G, H and I show photographs of seedlings treated or not with NaCl Panel J shows root length measurements Vertical bars indicate ±SD calculated from four replicates (with 3 seedlings per replicate). Three biological experiments were done with similar results.
Over-Expression of TaCIPK29 Maintains high K+/Na+ Ratios and Ca2+ Content Under Salt Stress
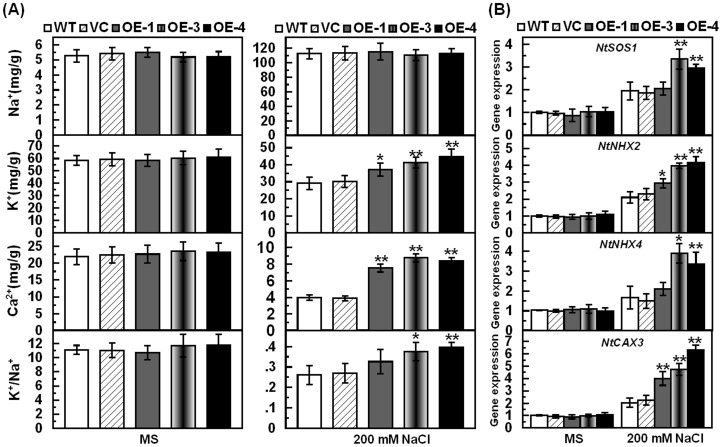
To detect the accumulation of Na+, K+ and Ca2+ in the controls (WT and VC) and transgenic lines, the concentration of these cations was measured in tobacco plants under normal and salt stress conditions. Under normal conditions, there were no significant differences in the content of Na+, K+ and Ca2+ nor in the K+/Na+ ratios in the whole seedlings of the controls (WT and VC) and transgenic lines (Fig. 4A). However, under salt stress conditions, transgenic lines had elevated K+ and Ca2+ content compared to the two controls although no difference was detected between the transgenic lines and the two controls in Na+ contents (Fig. 4A). Further analysis indicated that the transgenic lines retained higher K+/Na+ ratios than the controls under salt stress (Fig. 4A). These results suggested that over-expression of TaCIPK29 had an effect on regulating the contents of these cations, which were involved in maintaining higher K+/Na+ ratios and Ca2+ content in transgenic tobacco plants under salt stress.
Figure 4. Ion content and expression analysis of transporter genes in transgenic lines and controls (VC and WT) under normal and salt stress conditions.
Two-week-old seedlings were transplanted to MS or MS with 200 mM NaCl for one week. Whole seedlings were sampled to measure the content of Na+, K+, Ca2+ and the ratio of K+/Na+ was calculated (A). Two-week-old tobacco seedlings were transplanted to MS or MS with 200 mM NaCl for two days and the whole seedlings were used to measure the expression of transporter genes (B). Data are means ±SD calculated from four replicates. Asterisks indicate significant difference between the WT and the three transgenic lines (*p<0.05; **p<0.01). Three different experiments were performed with similar results.
Over-expression of TaCIPK29 Elevates the Expression of NtSOS1, NtNHX2, NtNHX4 and NtCAX3
AtSOS1, which is activated by AtSOS2/AtCIPK24, is responsible for Na+ export from the cell and enhancing salt stress tolerance [29]. Additionally, both LeNHX2 and LeNHX4 function in K+ compartmentalization and Na+ and K+ transport from the cytosol to cell compartments and are induced in SlSOS2/SlCIPK24-overexpressing transgenic tomato under salt stress [23], [30]. The Arabidopsis vacuolar H+/Ca2+ antiporter CAX3 is required for Ca2+ homeostasis and salt stress tolerance under NaCl treatment [31], [32]. To identify the tobacco orthologs of AtSOS1, LeNHX2, LeNHX4 and AtCAX3, BLASTP, TBLASTN and phylogenetic analysis were carried out. The results showed that NtSOS1, NtNHX2, NtNHX4 and NtCAX3 shared high similarity and identity with AtSOS1, LeNHX2, LeNHX4 and AtCAX3, respectively (Table S2). Additionally, on the evolutionary timescale, NtSOS1, NtNHX2, NtNHX4 and NtCAX3 were very close to AtSOS1, LeNHX2, LeNHX4 and AtCAX3 respectively (Figs. S4 and S5). These results suggested that NtSOS1, NtNHX2, NtNHX4 and NtCAX3 from tobacco are true orthologs of AtSOS1, LeNHX2, LeNHX4 and AtCAX3, respectively. To gain a deeper understanding of TaCIPK29 function in salt stress tolerance, transcript levels of these transporter genes were detected in the controls (VC and WT) and the transgenic lines under normal and salt stress conditions. The results showed that the expression levels of NtSOS1, NtNHX2, NtNHX4 and NtCAX3 were higher in transgenic lines than that in controls under salt conditions although there was no significant difference between transgenic lines and the two controls under normal conditions (Fig. 4B).
Over-expression of TaCIPK29 Improves Antioxidant Enzyme Activities and Reduces the Content of H2O2 and Malonaldehyde (MDA) and Ion Leakage (IL) Under Salt Stress
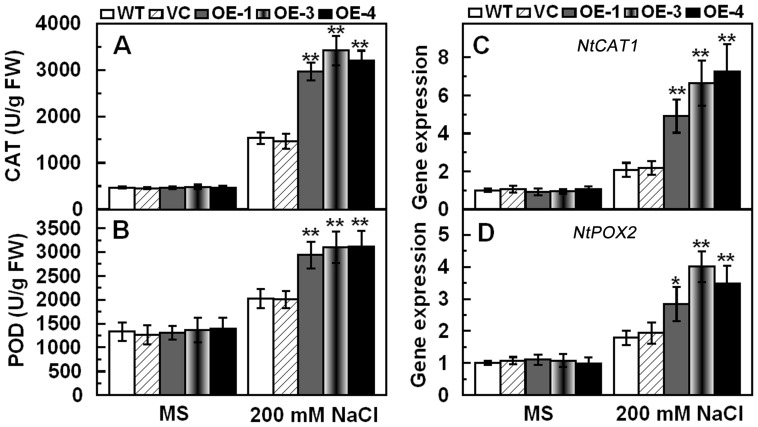
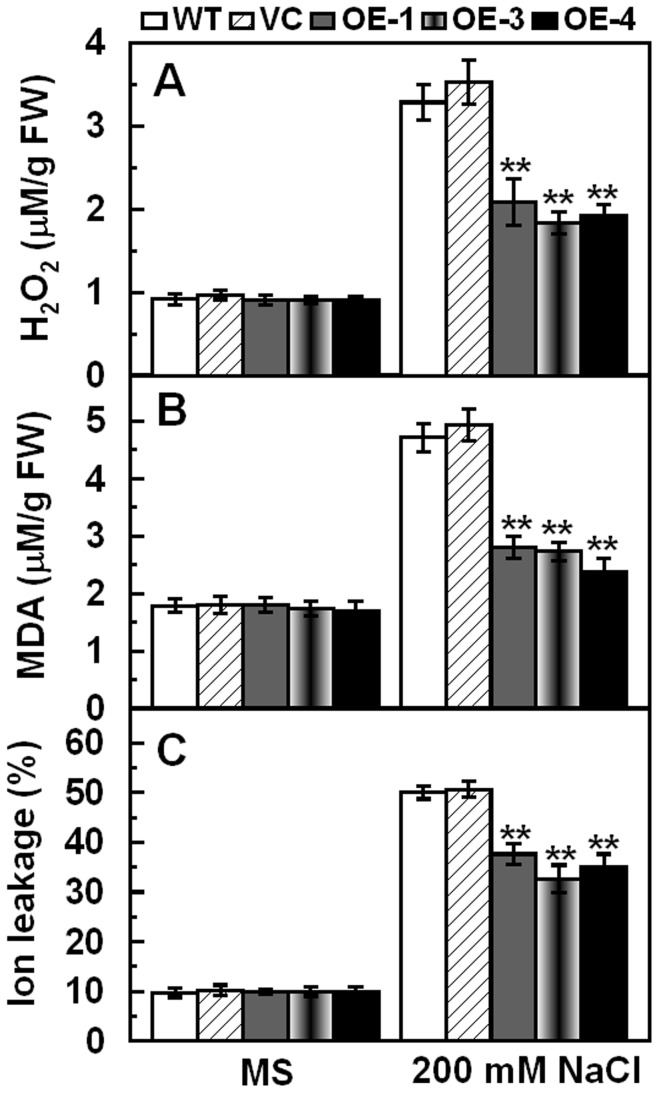
Because Na+, K+ and Ca2+ were involved in cell metabolism, enzyme activation and protein biosynthesis, activities of antioxidantive enzymes such as catalase (CAT; EC 1.11.1.6) and peroxidase (POD; EC 1.11.1.7) were detected under normal conditions and salt treatment. After 7 days salt treatment, the three transgenic lines maintained higher activities of POD and CAT than WT and VC (Figs. 5A and 5B). Accordingly, NtCAT1 and NtPOX2 transcripts were also higher in transgenic lines than in WT and VC under salt conditions (Figs. 5C and 5D). The activity and expression of SOD was similar in the controls (VC and WT) and transgenic lines under normal and salt stress conditions (data not shown). Antioxidative enzymes play crucial roles in ROS scavenging and thereby relieve membrane lipid peroxidation. Therefore, IL and the contents of H2O2 and MDA were further examined, which indicated that transgenic lines showed lower H2O2 accumulation, IL and MDA contents than the controls (VC and WT) under salt stress conditions (Figs. 6A, 6B and 6C). These results suggested that over-expression of TaCIPK29 improved expression and activities of POD and CAT, and reduced H2O2 accumulation and membrane damage under salt stress.
Figure 5. Activities and expression of CAT and POD in the controls (WT and VC) and transgenic plants grown under normal and salt stress conditions.
Two-week-old tobacco seedlings were transplanted to MS or MS with 200 mM NaCl for one week. Whole seedlings were sampled to measure activities of CAT and POD (A, B). Two-week-old tobacco seedlings were transplanted to MS or MS with 200 mM NaCl for two days and the whole seedlings were used to examine the expression of NtCAT1 and NtPOX2 (C, D). Data are means ±SD calculated from four replicates. Asterisks indicate significant difference between the WT and the three transgenic lines (*p<0.05; **p<0.01). Three different experiments were performed with similar results.
Figure 6. Analysis of H2O2, MDA and IL in the controls (WT and VC) and transgenic lines under normal and salt stress conditions.
Two-week-old tobacco seedlings were transplanted to MS or MS supplied with 200 mM NaCl for one week. Whole seedlings were sampled to measure H2O2 (A), MDA (B) and IL (C). Data are means ±SD calculated from four replicates. Asterisks indicate significant difference between the WT and the three transgenic lines (*p<0.05; **p<0.01). Three biological experiments were done with similar results.
Over-expression of TaCIPK29 Enhances Oxidative Stress Tolerance in Transgenic Tobacco
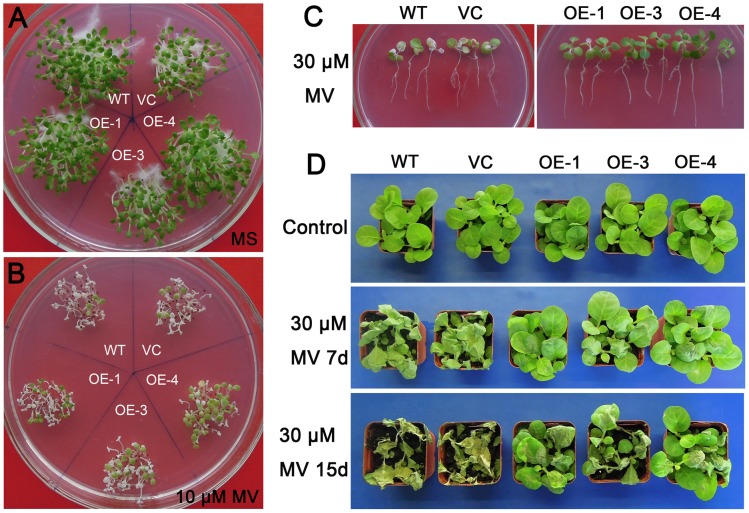
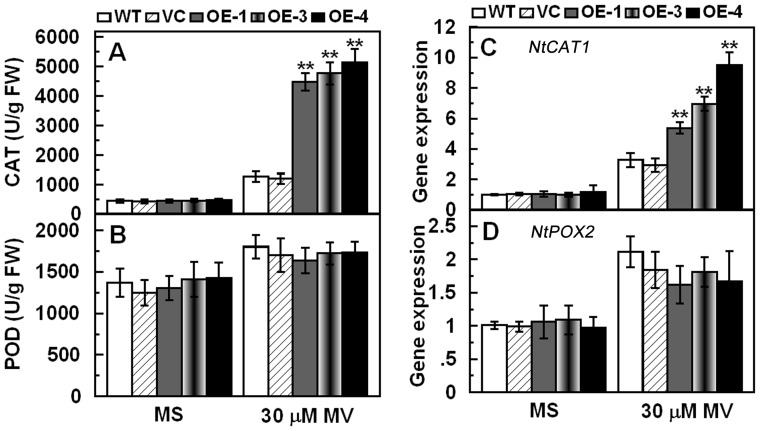
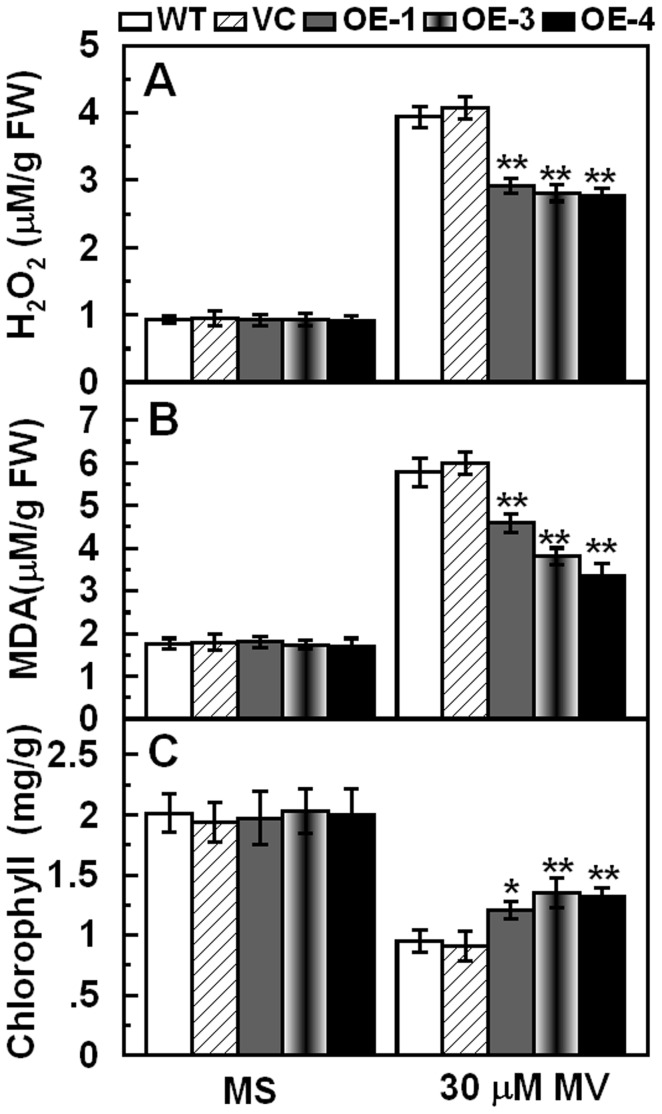
To further assess the role of TaCIPK29 in regulating antioxidant mechanisms, the correlation between TaCIPK29 and oxidative stress was explored. Tobacco seeds were germinated on MS or MS with 10 µM MV for two weeks, which showed that chlorosis was more severe in WT and VC than in transgenic lines (Figs. 7A and 7B). In the second experiment, two-week-old tobacco seedlings were transferred to MS with 30 µM methyl viologen for one week. The cotyledon bleaching was also more severe in WT and VC than in transgenic lines (Fig. 7C). Moreover, after 7 days or 15 days MV treatment, transgenic lines exhibited more tolerance to oxidative stress than WT and VC in soil (Fig. 7D). Analysis of activities and expression of antioxidant enzymes indicated that two controls (VC and WT) exhibited lower CAT activities and expression than the transgenic lines under MV treatment (Fig. 8). Furthermore, physiological investigation indicated that transgenic tobacco plants contained higher chlorophyll and lower H2O2 and MDA contents than the two controls (VC and WT) under MV treatment (Fig. 9). These results suggested that over-expression of TaCIPK29 reduced H2O2 accumulation by enhancing the antioxidant system under oxidative stress.
Figure 7. Analysis of the enhanced oxidative stress tolerance in transgenic lines.
Tobacco seeds germinated on MS for two weeks (A). Tobacco seeds germinated on MS with 10 µM MV for two weeks (B). Two-week-old tobacco plants were transferred to MS supplied with 30 µM MV for one week (C). Five-week-old tobacco plants were subjected to 30 µM MV treatment for 7 days or 15 days (D). Three biological experiments were conducted with similar results.
Figure 8. Activities and expression of CAT and POD in the controls (WT and VC) and transgenic lines grown under normal and oxidative stress conditions.
Two-week-old tobacco seedlings were transplanted to MS or MS supplied with 30 µM MV for one week. Whole seedlings were sampled to detect activities of CAT and POD (A, B). Two-week-old tobacco seedlings were transplanted to MS or MS supplied with 30 µM MV for two days and the whole seedlings were used to measure the transcript levels of NtCAT1 and NtPOX2 (C, D). Data are means ±SD calculated from four replicates. Asterisks indicate significant difference between the WT and the three transgenic lines (*p<0.05; **p<0.01). Three different experiments were performed with similar results.
Figure 9. Analysis of H2O2, MDA and chlorophyll contents in the controls (WT and VC) and transgenic lines grown under normal and oxidative stress conditions.
Two-week-old tobacco seedlings were transplanted to MS or MS supplied with 30 µM MV for one week. Whole seedlings were sampled to measure H2O2 (A), MDA (B) and chlorophyll (C). Data are means ±SD calculated from four replicates. Asterisks indicate significant difference between the WT and the three transgenic lines (*p<0.05; **p<0.01). Three different experiments were performed with similar results.
TaCIPK29 Interacts with TaCBL2, TaCBL3, NtCBL2, NtCBL3 and NtCAT1 in Yeast Two-hybrid Assays
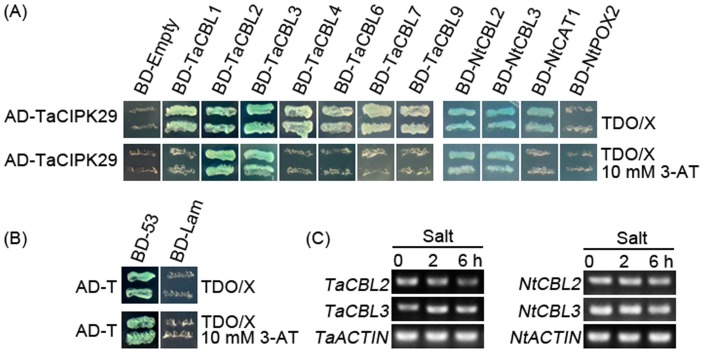
To further understand the regulating mechanism of TaCIPK29, yeast two-hybrid analysis was performed. TaCIPK29 was fused to the activation domain vector (pGADT7) as prey, whereas the TaCBLs were fused to the binding domain vector (pGBKT7) as bait. The yeast cells co-transformed with the AD-TaCIPK29 and distinct BD vectors were spared in the selective medium TDO/X (Figs. 10A and 10B). The results showed that TaCIPK29 could interact with TaCBL1, TaCBL2, TaCBL3 and TaCBL4, but very weakly with TaCBL6 and TaCBL7. In addition, 3-ami-notriazole (3-AT), as an inhibitor of His synthetase, was often used to identify the strong interaction through inhibiting the weak interaction of the pray and the bait [33]. When we supplied the selective medium with 10 mM 3-AT and 20 µM X-α-gal, we found that only the yeast cell with the AD-TaCIPK29 and BD-TaCBL2 or AD-TaCIPK29 and BD-TaCBL3 grew and exhibited blue color. The results suggested that TaCIPK29 had strong interactions with TaCBL2 and TaCBL3. Furthermore, NtCBL2 and NtCBL3 shared high similarity with TaCBL2 and TaCBL3 (Fig. S3) were also cloned and introduced into the BD vector, and showed their capability to interact with TaCIPK29 in the yeast two-hybrid assays (Fig. 10). Because the expression of NtPOX2 and NtCAT1 was higher in TaCIPK29-overexpressing tobacco plants than that in the controls (WT and VC) under salt stress, NtPOX2 and NtCAT1 were also introduced into BD vector to detect their interaction with TaCIPK29. The results indicated that there were no interactions between TaCIPK29 and NtPOX2, whereas TaCIPK29 could interact with NtCAT1 (sharing high similarity with AtCAT2) (Fig. 10). The interactions between TaCIPK29 and NtSOS1/NtNHX2/NtNHX4/NtCAX3 were not conducted because of the lack of complete sequences for the four tobacco genes. These results suggested TaCIPK29 interacted with NtCAT1 and CBL2/CBL3 preferentially.
Figure 10. Interaction between TaCIPK29 and CBLs/CAT and expression analysis of CBLs.
TaCIPK29 was fused to the GAL4 activation domain (AD) and TaCBLs/NtCBLs/NtCAT1/NtPOX2 were fused to the GAL4 DNA-binding domain (BD). The interactions between TaCIPK29 and TaCBLs/NtCBLs/NtCAT1/NtPOX2 were examined in the triple dropout medium containing 20 µg/ml X-α-gal (SD/−His/−Leu/−Trp plus X-α-gal, TDOX) or TDOX adding 10 mM 3-AT (A). The interaction between SV40 large T-antigen (AD-T) and murine p53 (BD-53) used as positive control and the interaction between SV40 large T-antigen and human lamin C (BD-Lam) used as negative control were tested on the same TDOX medium and TDOX medium containing 10 mM 3-AT (B). Two-week-old wheat and tobacco seedlings were treated with 200 mM NaCl to detect the expression of CBLs (C). Three different experiments were performed with similar results.
Both TaCIPK29 and TaCBL3 Expressions are Induced by Salt Treatment
RT-PCR was applied to investigate the expression of TaCIPK29-CBL2/CBL3 components under salt stress (Fig. 10C). The results showed that TaCBL3 were induced by NaCl treatment, while the expression of TaCBL2 was inhibited by NaCl treatment. In addition, NtCBL2 and NtCBL3 displayed constant expression levels under NaCl treatment. These results implied that TaCBL3-TaCIPK29 components may be involved in salt stress response in wheat.
TaCIPK29 is Located in the Nucleus, Cytoplasm, and Plasma Membrane
Subcellular localization of the TaCIPK29 protein was investigated in a transient expression assay with 35S::TaCIPK29-GFP (PBI121- TaCIPK29-GFP) translational fusion in onion epidermal cells using particle bombardment. The results showed that the fluorescence of cells transformed with TaCIPK29-GFP was distributed throughout the cell, including the nucleus, cytoplasm and plasma membrane, when these cells were in normal conditions (Fig. 11G) or after plasmolysis (Figs. 11D, 11E and 11F). Furthermore, to confirm the plasma membrane localization of TaCIPK29, both plasma membrane marker (PM-RK) and TaCIPK29-GFP fusion protein were expressed in the onion epidermis cells [34]. The red PM-RK and green fluorescence were both observed in the plasma membrane (Figs. 11G, 11H and 11I). In addition, fluorescent signals were found throughout cells when expressing GFP alone (Figs. 11A, 11B and 11C). These results indicated that the TaCIPK29-GFP fusion protein located to the nucleus, plasma membrane and cytoplasm.
Figure 11. Subcellular localization analysis of TaCIPK29-GFP fusions in onion epidermal cells.
(A) p35S::GFP fluorescence; (B) bright-field image of p35S::GFP; (C) overlapped image of p35S::GFP; (D) p35S::TaCIPK29-GFP fluorescence; (E) bright-field image of p35S::TaCIPK29-GFP; (F) overlapped image of p35S::TaCIPK29-GFP; (G) p35S::TaCIPK29-GFP fluorescence; (H) pm-rk (plasma membrane-localized maker) red fluorescence; (I) merged image of (G) and (H). (D-F) are images of onion epidermal cells after plasmolysis induced by 50% sucrose solution.
Discussion
As is already known, Na+ has an adverse effect on cell metabolism and its uptake and distribution strongly affect the salt sensitivity of plants [1]. However, plants have developed some biochemical and molecular mechanisms to cope with the negative effects of salinity. Well-characterized genes include Na+/H+ antiporter SOS1, the Na+ influx transporter family HKT and the tonoplast Na+/H+ antiporter family NHX [1], [35]. In addition, a large number of CIPKs have been characterized to play important roles in salt stress tolerance, such as AtSOS2, AtCIPK6, AtCIPK9, AtCIPK23, AtCIPK24, OsCIPK15 and SlCIPK24 etc. However, these studies mainly focused on the model plants Arabidopsis, rice and tomato. The precise role of CIPKs in salt stress tolerance has not been completely understood, especially for crops. Although more than 35 CIPK genes have been identified to date in the wheat genome, only the function of WPK4 was reported. In this study, a CIPK gene, designated as TaCIPK29, was cloned and characterized from wheat.
TaCIPK29 Plays a Positive Role Under Salt Stress
A number of studies have demonstrated the function of CIPKs in salt stress tolerance. The expression of TaCIPK29 was induced after treatment with NaCl, implying that it may be involved in the response to salt stress (Fig. 1). Therefore, to further assess the function of TaCIPK29 under salt stress, transgenic tobacco plants overexpressing TaCIPK29 were generated. As indicated in Figures 2 and 3, one week old and four weeks old tobacco plants overexpressing TaCIPK29 had enhanced tolerance to salt stress relative to WT and VC. These results were in line with some previous studies on CIPK genes improving salt stress tolerance in transgenic plants.
Improved Tolerance to Salt Stress is Associated with Higher K+/Na+ Ratios and Ca2+ content through regulating transporter genes
The functions of CIPKs on modulating Na+ and K+ homeostasis under salt stress have been characterized in previous studies. AtCIPK24/AtSOS2 can interact with AtCBL4/AtSOS3 to function on the Na+/H+ antiporter, AtSOS1/AtNHX7, enhancing salt stress tolerance in roots [15]. Meanwhile, AtCIPK6, AtCIPK9, HbCIPK2, SlSOS2 and AtCIPK23 have been reported to function in K+ homeostasis, in which AtCIPK6 and AtCIPK23 can increase the activity of the plasma membrane K+ transporter such as AKT1 [5], [20], [21], [22], [23]. In addition, Ca2+, which is crucial for plants to combat abiotic stress, mediates the CBL-CIPK network in response to stress [4]–[7]. Thus, in the present study, the content of these cations in the whole seedlings of the controls (WT and VC) and transgenic lines were measured under normal conditions and salt stress. The results showed that over-expression of TaCIPK29 elevated K+/Na+ ratios and Ca2+ content under salt stress (Fig. 4A). NtSOS1, NtNHX2, NtNHX4 and NtCAX3 are orthologs of AtSOS1, LeNHX2, LeNHX4 and AtCAX3 respectively as shown in Figures S4 and S5 and Table S2. Moreover, the transgenic plants exhibited higher expression of NtSOS1, NtNHX2, NtNHX4 and NtCAX3 compared to the WT and VC under salt stress (Fig. 4B). AtSOS1 and SlSOS1 are membrane-bound Na+/H+ antiporters that function in the enhancement of salt stress tolerance by exporting Na+ [15], [29]. However, the endosomal K+, Na+/H+ antiporter LeNHX2 and the vacuolar Na+, K+/H+ antiporter LeNHX4 were related to K+ compartmentalization and to Na+ and K+ transport from the cytosol to cell compartments [23], [30]. Therefore, it is concluded that the up-regulation of NtSOS1 is beneficial for exporting Na+, while the increased expression of NtNHX2 and NtNHX4 leads to Na+ compartmentalization, avoiding its toxicity in the cytosol. As a result, the transgenic lines contained similar total Na+ content to the two controls under salt conditions. In addition, the upregulation of NtNHX2 and NtNHX4 in transgenic lines compared to WT and VC may contribute to K+ absorption for transgenic plants. The Arabidopsis vacuolar H+/Ca2+ antiporter CAX3 is required for Ca2+ homeostasis and salt stress tolerance under NaCl treatment [31], [32]. The expression of NtCAX3 was upregulated in TaCIPK29-overexpressing plants compared to the two controls, implying that it was associated with elevated Ca2+ content in transgenic plants. Thus, the improved tolerance to salt stress was related to higher K+/Na+ ratios and Ca2+ content through regulating transporter genes in transgenic tobacco plants.
The Antioxidative System is Involved in TaCIPK29 Improving Tolerance to Salt Stress
Plant photosynthesis is often affected by excess Na+ via generating excess ROS, which destroys cell membrane. However, plant cells can accumulate K+ to combat the harmful influence of excess Na+ under salt stress because K+ is necessary for protection of cellular enzymes including the antioxidant enzymes [36], [37]. Therefore, higher K+/Na+ ratios maintained in plants under salt stress contribute to the cellular ROS homeostasis. Moreover, Ca2+ is also involved in activating the antioxidative defense system to reduce the H2O2 levels in plants [38]–[42]. Antioxidative enzymes were also reported to have positive effect on salt stress tolerance in plants [1], [43]. In this study, analysis of the antioxidant enzymes indicated that the transgenic lines had higher expression levels and enzyme activities of POD and/or CAT than the two controls under salt and MV treatment (Figs. 5 and 8). Moreover, TaCIPK29 could also interact with NtCAT1 directly (Fig. 10). These results suggested that over-expression of TaCIPK29 improved the activation of the antioxidant defense system, which was benefit for preventing transgenic lines from ROS-mediated injury under salt or oxidative stress. AtCIPK24/AtSOS2 was also reported to interact with NDPK2 as well as with AtCAT2 and AtCAT3, which are involved in ROS signaling and scavenging [17]. Most of the CIPK genes enhancing salt tolerance are similar to SOS2 such as MdSOS2, MdCIPK6L and ZmCIPK16 [7], [18], [19]. Here, we found that there was an interaction between TaCIPK29 and NtCAT1 (Fig. 10), indicating that the increased expression and activities of CAT may be due to the TaCIPK29 function on NtCAT1 directly.
TaCBL3-TaCIPK29 Components may be Involved in Salt Stress Tolerance
CBLs, a kind of Ca2+ sensor, can perceive and decode the Ca2+ signature generated under specific stress. CIPK complexes were activated by CBLs to regulate the downstream effectors [44]. An interaction between TaCIPK29 and TaCBLs was detected, which indicated that TaCIPK29 had a strong interaction with TaCBL2 and TaCBL3 (Fig. 10). Further, tobacco CBLs, NtCBL2 and NtCBL3 were confirmed to have a strong interaction with TaCIPK29. Therefore, the function of TaCIPK29 is mainly regulated by CBL2/3 in wheat and tobacco. Moreover, both TaCBL3 and TaCIPK29 expression were upregulated by NaCl, implying that TaCBL3-TaCIPK29 components may be involved in response to salt stress in wheat. AtCBL2 and AtCBL3 were confirmed to strongly interact with AtCIPK14 (homologs of TaCIPK29) [45]. However, the roles of these interactions in salt stress signaling transduction are still unclear. Although OsCBL3 and OsCIPK29 were strongly induced by salt [4], [46], the interaction between OsCBL3 and OsCIPK29 and their function has not yet been identified. Here, we established that TaCBL3-TaCIPK29 components may be involved in salt stress tolerance.
In conclusion, the findings of this study demonstrated that TaCIPK29 plays a positive role in salt stress tolerance. TaCIPK29 conferred tolerance to salt stress not only by increasing K+/Na+ ratios and Ca2+ content through up-regulating some transporter genes but also by decreasing H2O2 accumulation and membrane injury through enhancing the expression and activities of antioxidant enzymes.
Materials and Methods
Plant Materials and Treatments
The sterilized wheat seeds were germinated in an incubator (25oC, 200 µM m−2s−1, 16 h light/8 h dark cycle). The two-week-old seedlings were transferred to an incubator at 4oC for cold stress treatment and sampled at 0 h, 2 h, 6 h, 12 h and 24 h after treatment. PEG and salt treatments were applied by irrigating the two-week-old seedlings with 20% PEG6000 or 200 mM NaCl, respectively, and sampled at 0 h, 2 h, 6 h, 12 h and 24 h after treatment. Plant hormones and oxidative stress treatments were conducted by spraying the seedlings with different chemicals (including 100 µM ABA, 100 µM ethylene and 30 µM MV) and were sampled at 0 h, 2 h, 6 h, 12 hand 24 h after treatment. To detect the expression profile in different tissues, various tissues of wheat (including roots, stems, leaves, pistils, stamens and lemma) were harvested. The samples were stored at −70°C for further analysis.
Gene Cloning and Sequence Analysis
The wheat ESTs were acquired by searching DFCI and NCBI databases. In order to identify putative salt-responsive CIPK genes in wheat, a BLASTN search was performed with the amino acid sequences of 12 salt related OsCIPKs (OsCIPK7, OsCIPK8, OsCIPK9, OsCIPK10, OsCIPK11, OsCIPK15, OsCIPK16, OsCIPK17, OsCIPK21, OsCIPK22, OsCIPK29 and OsCIPK30) to identify the tentative consensus sequences (TCs) of the putative CIPKs. Among the TCs, TC371359 showed high identity of amino acid sequence with OsCIPK29 and contained an EST sequence (BQ753202) isolated from a salt-stressed wheat root cDNA library. Thus, TC371359 was seen as a candidate in response to salt stress and was chosen for further functional investigation. Sequence analysis showed that the 5′- and 3′- ends were missing. Then RACE technique was conducted to isolate the 5′- and 3′- ends of TaCIPK29 using the 5′ RACE primers (P1 and P2, Table S1) and 3′ RACE primers (P3 and P4, Table S1). The cDNA templates for the RACE reaction were acquired from leaves of wheat seedlings that were treated with 20% PEG6000, 200 mM NaCl and cold (4°C) for 2 h. The full-length cDNA sequence of TaCIPK29 was amplified by PCR with the primers (P5, Table S1). The 5′end of NtCBL2 was missing and isolated by 5′RACE reaction based on the sequence of the EST (EB440776) with the 5′ RACE primer (P13, Table S1). The full length sequence of NtCBL2 gene was also obtained by PCR with the specific primers (P14, Table S1). The NtCBL3, NtCAT1 and NtPOX2 genes were isolated from tobacco by PCR reaction with the primers (P17, P19, and P20, Table S1). Amino acid sequence alignments and the construction of a phylogenetic tree were performed using the Clustalx 2.0 and MEGA 4.0 software, respectively.
Identification of Tobacco Orthologs of AtSOS1, LeNHX2, LeNHX4 and AtCAX3
TBLASTN was performed in Sol Genomisc Network database (http://solgenomics.net/) and NCBI database (http://blast.ncbi.nlm.nih.gov/Blast.cgi) on the basis of the amino acid sequences of AtSOS1, LeNHX2, LeNHX4 and AtCAX3. Four tobacco orthologs that shared the highest similarity with AtSOS1, LeNHX2, LeNHX4 and AtCAX3 were identified and designated as NtSOS1 (SGN-E793961), NtNHX2 (FG179556), NtNHX4 (EB438297) and NtCAX3 (TC135005) respectively. Tobacco amino acid sequences NtSOS1, NtNHX2, NtNHX4 and NtCAX3 were further confirmed by BLASTP or TBLASTN alignment in NCBI database and phylogenetic analysis with other NHXs or CAXs from Arabidopsis and tomato.
Gene Expression Assay
Total RNA extraction was performed by using a RNAprep pure plant total RNA extraction kit (TIANGEN, Beijing, China). The RNA was then transcribed into cDNA using a RevertAid™ First Strand cDNA Synthesis kit (Fermentas, Canada). Expression of TaCIPK29 in different wheat tissues with or without treatments and stress-associated genes in tobacco were analyzed by qRT-PCR. The primers (P6-P7, P21-P27, Table S1) used in qRT-PCR were designed after excluding the highly conserved protein domains. These primers had high specificity and efficiency, which were determined by agarose gel electrophoresis and melting curve analysis using the Opticon monitor 2 qRT-PCR software. PCR products amplified by the primer pairs were sequenced to confirm specificity. The qRT-PCR assay was conducted with three replicates using the SYBR Green PCR master mix kit (ToYoBo, Japan). The relative level of gene expression was detected using the 2–ΔΔCt method (Livak and Schmittgen 2001) [47]. In this method, ΔΔCt = (CT, Target - CT, Actin) Time x - (CT, Target - CT, Actin) Time 0. The CT (cycle threshold) values for both the target and internal control genes were the means of the triplicate PCRs. For the tissue specific assay, the expression of TaCIPK29 in lemma was regarded as standard. For the expression analysis in wheat after various treatments, untreated samples were determined as calibrators. For gene expression in transgenic tobacco, WT samples under normal conditions were used as calibrators. Amplification efficiencies for the primer pairs were between 0.92 and 1.17. The semi RT-PCR reaction was used to assess the expression of TaCBL2 (P11, Table S1) and TaCBL3 (P12, Table S1) as well as NtCBL2 (P15, Table S1) and NtCBL3 (P16, Table S1) under salt stress. TaActin (P7, Table S1) or NtACTIN (P27, Table S1) were used as the internal control for wheat and tobacco, respectively.
Yeast Two-hybrid Assays
A Matchmaker Gold Yeast Two-Hybrid System (Clontech) was used to examine the interaction between TaCIPK29 and CBLs/NtCAT/NtPOD in vivo. The coding sequences of TaCIPK29 and different candidate genes were amplified by PCR with specific primers (P8, P16, P17, P19, P20, Table S1) harboring restriction sites were cloned into the yeast two-hybrid pGADT7 vector (prey) and the pGBKT7 vector (bait), respectively. The yeast strain Y2HGold was co-transformed with pAD-TaCIPK29 and each pBD (TaCBL1, TaCBL2, TaCBL3, TaCBL4, TaCBL6, TaCBL7 and TaCBL9 as well as NtCBL2, NtCBL3, NtCAT1 and NtPOX2) with the lithium acetate method according to the protocol (Clontech). The co-transformants were screened on triple dropout medium (TDO/X medium, SD/−His/−Leu/−Trp/X-α-gal) without 3-ami-notriazole (3-AT) and with 10 mM 3-AT, respectively. All the yeast two-hybrid studies were performed in triplicate.
Subcellular Localization Assay
The recombinant plasmid pBI121-TaCIPK29-GFP was constructed containing the coding sequence of TaCIPK29 (P9, Table S1) with a XbaI/BamHI restriction site and was used for a sublocalization assay. The pBI121-TaCIPK29-GFP and pBI121-GFP were transferred into onion epidermal cells by using gene gun bombardment (PDS-1000, BIO-RAD). Fluorescence was examined by a microscope (OLYMPUS IX71, Japan) after 24 h incubation. The fluorescence in onion epidermal cells after plasmolysis induced by 50% sucrose was also recorded. To confirm the localization of TaCIPK29 in the plasma membrane (PM), the PM marker (PM-RK) was applied.
Generation of Transgenic Tobacco Plants
The plasmid pBI121-TaCIPK29-GFP was transformed into tobacco plants using Agrobacterium tumefaciens strain LBA4404 according to the transformation method [48]. Positive transgenic plants overexpressing TaCIPK29 were first screened on MS containing 150 mg/L of kanamycin and then identified by PCR with the primers for TaCIPK29 (P10, Table S1). The expression of TaCIPK29 in the 3 independent T2 transgenic lines was detected by using RT-PCR with primers (P10 for TaCIPK29 and P27 for NtACTIN, Table S1).
Stress Tolerance Analysis of the VC, WT and Transgenic Lines
Tobacco seeds (about 200) were surface-sterilized and germinated on MS medium containing different concentrations of NaCl (0 mM, 150 mM or 200 mM) in the incubator (25oC) for 12 d and then the germination rate was assessed. For root length assessment, the two controls and transgenic lines grown on MS without NaCl for one week were transferred to MS or MS with 150 mM and 200 mM NaCl for one week in the vertical position. For phenotype assay under salt stress, the sterilized seeds were sown in MS medium and grown for one week and then transferred to the soil container for another three weeks of growth. Then, the four-week-old tobacco seedlings were exposed to 300 mM NaCl for 20 d and 25 d salt stress, and the plants were subsequently recovered for 5 d. For oxidative stress assay, the sterilized seeds germinated on MS medium with 10 µM MV for two weeks. The sterilized seeds grew on MS medium for two weeks and then the seedlings were transferred to MS plates containing 30 µM MV for one week. Five-week-old plants in soil were exposed to 30 µM MV solution for 15 d and the phenotype was recorded.
Physiological Indices Measurement
The activities of SOD and CAT were spectrophotometrically measured by using Detection Kit (A001 and A007, Jiancheng, Nanjing, China) following the protocols. POD activity measurement was performed according to Polle et al. (1994) [49]. H2O2 content was determined as described in a previous study [50]. MDA content was measured based on the method described by Heath and Packer (1968) [51]. Chlorophyll was measured by using UV spectrophotometry in accordance with the protocol of Yang et al. (2009) [52]. IL was detected according to the method as described by Jiang and Zhang (2001) with slight modification using a conductivity meter (DDBJ-350, Shanghai, China) instrument. The whole seedlings were firstly washed with distilled water for three times and then incubated in 30 ml distilled water at 25oC for 12 h followed by a measurement of the initial conductivity (C1). Then, the samples were boiled for 30 min. After cooling down to the room temperature, the measurement of the final conductivity (C2) was then performed. The relative ion leakage (IL) was calculated using the formula: IL (%) = C1/C2×100. Ion content measurements followed the methods described by Li et al. [5]. Two-week-old tobacco seedlings were transplanted on MS or MS with 200 mM NaCl for one week. The whole seedlings were dried at 80°C for 3 d, and then about 50 mg samples were digested with 6 mL concentrated HNO3 overnight. The samples were mixed with 2 mL 30% H2O2 and heated at 180°C for 15 min. Then the digested samples were diluted to 50 mL and analyzed by inductively coupled plasma-mass spectrometry (ICP-MS).
Statistical Analysis
Statistical analyses were conducted using Microsoft Excel and SPSS (Chicago, IL, USA). An analysis of variance was employed to compare statistical differences on the basis of Student’s t test.
Supporting Information
Amino acid sequence alignment of TaCIPK29 with closer homologs from rice and barley. Black shadings indicate identical residues, while grey shadings represent similar residues. The activation loop, FISL domain and PPI domain are underlined. Sequences of OsCIPK29 (Q7XIW5) and HvCIPK29 (BAJ95612) were acquired from Uniprot database.
(TIF)
Phylogenetic analysis of TaCIPK29 with other known CIPKs from Arabidopsis, tobacco, rice and barely. The phylogenetic tree is generated with amino acid sequences by using MEGA4.0 software. The distinct subgroups of CIPK are depicted with the vertical line. The CIPKs sharing high homology with TaCIPK29 are depicted on gray background. The accession numbers of 26 AtCIPKs from Arabidopsis thaliana in NCBI database (http://www.ncbi.nlm.nih.gov/) are as follows: AtCIPK06 (AAF8650), AtCIPK07 (AAK16682), AtCIPK08 (AAK16683), AtCIPK09 (AAK16684), AtCIPK10(AAK16685), AtCIPK11(AAK16686), AtCIPK12 (AAK16687), AtCIPK13 (AAK16688), AtCIPK14 (AAK16689), AtCIPK15 (AAK16692), AtCIPK16 (AAF19215), AtCIPK17 (AAK64513), AtCIPK18 (AAK59695), AtCIPK19 (AAK50347), AtCIPK20 (AAK61493), AtCIPK21 (AAK59696), AtCIPK22 (AAL47845), AtCIPK23 (AAK61494), AtCIPK24 (AAK72257), AtCIPK25 (AAL41008), AtCIPK26 (NP_850861 ). Other sequences used: OsCIPK29 (Q7XIW5), HvCIPK29 (BAJ95612.1), NtCIPK14 (KC429561).
(TIF)
Amino acid alignment and domain analysis of wheat TaCBL2 and TaCBL3 with tobacco NtCBL2 and NtCBL3. All the CBLs have four calcium binding EF-hand and a FPSF motif. The FPSF motif and the EF-hand (E-helix, F-helix and calcium binding loop) are underlined. The asterisk represents the highly conserved Ser residue (S) that can be phosphorylated in the FPSF motif.
(TIF)
Phylogenetic analysis of tobacco NHXs with NHXs from Arabidopsis and tomato. The phylogenetic tree was generated using ClustalX2.0 and MEGA4.0 softwares. Their accession numbers in uniprot database (http://www.uniprot.org/) are as follows: AtNHX1(Q68KI4);AtNHX2(Q56XP4);AtNHX3(Q84WG1);AtNHX4(Q8S397);AtNHX5(Q8S396);AtNHX6(Q8RWU6);AtNHX7/AtSOS1(Q9LKW9);LeNHX1(Q93YH2);LeNHX2(Q93YH1);LeNHX3(Q1JRA3);LeNHX4(Q1JRA2); SlSOS1(Q4W3B5).
(TIF)
Phylogenetic analysis of NtCAX3 with CAXs from Arabidopsis and tomato. The phylogenetic tree was generated using ClustalX2.0 and MEGA4.0 softwares. AtCAXs are obtained from uniprot database (http://www.uniprot.org/). SlCAXs are obtained from plantGDB database (http://www.plantgdb.org/SlGDB/or ftp://ftp.plantgdb.org/download/Genomes/SlGDB/). Their accession numbers are as follows:AtCAX1(Q39253);AtCAX2(Q39254);AtCAX3(Q93Z81);AtCAX4(Q945S5);AtCAX5(Q8L783);AtCAX6(Q9LFZ8);AtCAX7(Q9FKP1);AtCAX8(Q9FKP2);AtCAX9(Q9LJI2);AtCAX10(Q9SYG9);AtCAX11(O04034);Solyc01g098800;Solyc02g069710; Solyc03g032240; Solyc03g123790; Solyc06g006110; Solyc06g009130; Solyc07g006370; Solyc07g042000; Solyc07g056110; Solyc07g062700; Solyc09g005260 (SlCAX3); Solyc09g072690; Solyc12g011070; Solyc12g014110; Solyc12g055750.
(TIF)
Primers used for PCR analysis.
(DOC)
Sequence analysis of tobacco antiporters with the corresponding orthologs in Arabidopsis and tomato.
(DOC)
Acknowledgments
We thank Analytical and Testing Center of Huazhong University of Science and Technology (HUST) for detecting the ion contents. We are grateful to Dr. Huw Jones (Department of Plant Science, Rothamsted Research, Harpenden, Herts AL5 2JQ, UK) for help with revising the paper.
Funding Statement
International S & T Cooperation Key Projects of MoST (Grant No.2009DFB30340), National Genetically Modified New Varieties of Major Projects of China (2013ZX08002-004, 2013ZX08010-004), Key Projects of S & T Research of MoE of China (Grant No. 109105) and Wuhan Municipal S & T research project (Grant No. 201320922286), Open Research Fund of State Key Laboratory of Hybrid Rice of Wuhan University (KF201302). The funders had no role in study design, data collection and analysis, decision to publish, or preparation of the manuscript.
References
- 1. Ruiz-Lozano (2012) Regulation by arbuscular mycorrhizae of the integrated physiological response to salinity in plants: new challenges in physiological and molecular studies. J Exp Bot 63: 4033–4044. [DOI] [PubMed] [Google Scholar]
- 2. Asano (2011) Functional characterisation of OsCPK21, a calcium-dependent protein kinase that confers salt tolerance in rice. Plant Mol Biol 75: 179–191. [DOI] [PubMed] [Google Scholar]
- 3. Franz S, Ehlert B, Liese A, Kurth J, Cazalé AC, et al. (2010) Calcium-Dependent Protein Kinase CPK21 Functions in Abiotic Stress Response in Arabidopsis thaliana. Mol Plant 4: 83–96. [DOI] [PubMed] [Google Scholar]
- 4. Xiang Y, Huang YM, Xiong LZ (2007) Characterization of Stress-Responsive CIPK Genes in Rice for Stress Tolerance Improvement. Plant Physiol 144: 1416–1428. [DOI] [PMC free article] [PubMed] [Google Scholar]
- 5. Li RF, Zhang JW, Wu GY, Wang HZ, Chen YJ, et al. (2012) HbCIPK2, a novel CBL-interacting protein kinase from halophyte Hordeum brevisubulatum, confers salt and osmotic stress tolerance. Plant Cell Environ 35: 1582–1600. [DOI] [PubMed] [Google Scholar]
- 6. Piao HL, Xuan YH, Park SY, Je BI, Park SJ, et al. (2010) OsCIPK31, a CBL interacting protein kinase is involved in germination and seedling growth under abiotic stress conditions in rice plants. Mol Cell 30: 19–27. [DOI] [PubMed] [Google Scholar]
- 7. Zhao JF, Sun ZF, Zheng J, Guo XY, Dong ZG, et al. (2009) Cloning and characterization of a novel CBL-interacting protein kinase from maize. Plant Mol Biol 69: 661–674. [DOI] [PubMed] [Google Scholar]
- 8. Kolukisaoglu U, Weinl S, Blazevic D, Batistic O, Kudla J (2004) Calcium sensors and their interacting protein kinases: genomics of the Arabidopsis and rice CBL-CIPK signaling networks. Plant Physiol 134: 43–58. [DOI] [PMC free article] [PubMed] [Google Scholar]
- 9. Yu Y, Xia X, Yin W, Zhang H (2007) Comparative genomic analysis of CIPK gene family in Arabidopsis and Populus. Plant Growth Regul 52: 101–110. [Google Scholar]
- 10. Chen XF, Gu ZM, Xin DD, Hao L, Liu CJ, et al. (2010) Identification and characterization of putative CIPK genes in maize. J Genet Genomics 38: 77–87. [DOI] [PubMed] [Google Scholar]
- 11. Qiu QS, Guo Y, Dietrich MA, Schumaker KS, Zhu JK (2002) Regulation of SOS1, a plasma membrane Na+/H+ exchanger in Arabidopsis thaliana, by SOS2 and SOS3. Proc Natl Acad Sci U S A 99: 8436–8441. [DOI] [PMC free article] [PubMed] [Google Scholar]
- 12. Zhu JK (2003) Regulation of ion homeostasis under salt stress. Curr Opin Plant Biol 6: 441–445. [DOI] [PubMed] [Google Scholar]
- 13. Martinez-Atienza J, Jiang XY, Garciadeblas B, Mendoza I, Zhu JK, et al. (2007) Conservation of the salt overly sensitive pathway in rice. Plant Physiol 143: 1001–1012. [DOI] [PMC free article] [PubMed] [Google Scholar]
- 14. Tang RJ, Liu H, Bao Y, Lv QD, Yang L, et al. (2010) The woody plant poplar has a functionally conserved salt overly sensitive pathway in response to salinity stress. Plant Mol Biol 74: 367–380. [DOI] [PubMed] [Google Scholar]
- 15. Kudla J, Batistic O, Hashimoto K (2010) Calcium signals: the lead currency of plant information processing. Plant Cell 22: 541–563. [DOI] [PMC free article] [PubMed] [Google Scholar]
- 16. Quan R, Lin H, Mendoza I, Zhang Y, Cao W, et al. (2007) SCABP8/CBL10, a putative calcium sensor, interacts with the protein kinase SOS2 to protect Arabidopsis shoots from salt stress. Plant Cell 19: 1415–1431. [DOI] [PMC free article] [PubMed] [Google Scholar]
- 17. Verslues PE, Batelli G, Grillo S, Agius F, Kim YS, et al. (2007) Interaction of SOS2 with Nucleoside Diphosphate Kinase 2 and Catalases Reveals a Point of Connection between Salt Stress and H2O2 Signaling in Arabidopsis thaliana. Mol Cell 27: 7771–7780. [DOI] [PMC free article] [PubMed] [Google Scholar]
- 18. Hu DG, Li M, Luo H, Dong QL, Yao YX, et al. (2011) Molecular cloning and functional characterization of MdSOS2 reveals its involvement in salt tolerance in apple callus and Arabidopsis. Plant Cell Rep 31: 713–22. [DOI] [PubMed] [Google Scholar]
- 19. Wang RK, Li LL, Cao ZH, Zhao Q, Li M, et al. (2012) Molecular cloning and functional characterization of a novel apple MdCIPK6L gene reveals its involvement in multiple abiotic stress tolerance in transgenic plants. Plant Mol Biol 79: 123–135. [DOI] [PubMed] [Google Scholar]
- 20. Lee SC, Lan WZ, Kim BG, Li L, Cheong YH, et al. (2007) A protein phosphorylation/dephosphorylation network regulates a plant potassium channel. Proc Natl Acad Sci U S A 104: 15959–15964. [DOI] [PMC free article] [PubMed] [Google Scholar]
- 21. Lan WZ, Lee SC, Che YF, Jiang YQ, Luan S (2011) Mechanistic Analysis of AKT1 Regulation by the CBL-CIPK-PP2CA Interactions. Mol Plant 4: 527–536. [DOI] [PubMed] [Google Scholar]
- 22. Pandey GK, Cheong YH, Kim BG, Grant JJ, Li L, et al. (2007) CIPK9: a calcium sensor-interacting protein kinase required for low-potassium tolerance in Arabidopsis. Cell Res 17: 411–421. [DOI] [PubMed] [Google Scholar]
- 23. Huertas R, Olías R, Eljakaoui Z, Gálvez FJ, Li J, et al. (2012) Overexpression of SlSOS2 (SlCIPK24) confers salt tolerance to transgenic tomato. Plant Cell Environ 35: 1467–1482. [DOI] [PubMed] [Google Scholar]
- 24. Sano H, Youssefian S (1994) Light and nutritional regulation of transcripts encoding a wheat protein kinase homolog is mediated by cytokinins. Proc Natl Acad Sci U S A 91: 2582–2586. [DOI] [PMC free article] [PubMed] [Google Scholar]
- 25. Ikeda Y, Koizumi N, Kusano T, Sano H (1999) Sucrose and Cytokinin Modulation of WPK4, a Gene Encoding a SNF1-Related Protein Kinase from Wheat. Plant Physiol 121: 813–820. [DOI] [PMC free article] [PubMed] [Google Scholar]
- 26. Zhu JK (2001) Plant salt tolerance. Trends Plant Sci 6: 66–71. [DOI] [PubMed] [Google Scholar]
- 27. Sorrells ME, La Rota M, Bermudez-Kandianis CE, Greene RA, Kantety R, et al. (2003) Comparative DNA Sequence Analysis of Wheat and Rice Genomes. Genome Res 13: 1818–1827. [DOI] [PMC free article] [PubMed] [Google Scholar]
- 28. Sanchez-Barrena MJ, Fujii H, Angulo I, Martinez-Ripoll M, Zhu JK, et al. (2007) The structure of the C-terminal domain of the protein kinase AtSOS2 bound to the calcium sensor AtSOS3. Mol Cell 26: 427–435. [DOI] [PMC free article] [PubMed] [Google Scholar]
- 29. Olías R, Eljakaoui Z, Li J, De Morales PA, Marín-Manzano MC, et al. (2009) The plasma membrane Na+/H+ antiporter SOS1 is essential for salt tolerance in tomato and affects the partitioningof Na+ between plant organs. Plant Cell Environ 32: 904–916. [DOI] [PubMed] [Google Scholar]
- 30. Rodriguez-Rosales MP, Jiang X, Gálvez FJ, Aranda MN, Cubero B, et al. (2008) Overexpression of the tomato K+/H+ antiporter LeNHX2 confers salt tolerance by improving potassium compartmentalization. New phytol 179: 366–377. [DOI] [PubMed] [Google Scholar]
- 31. Zhao J, Barkla BJ, Marshall J, Pittman JK, Hirschi KD (2008) The Arabidopsis cax3 mutants display altered salt tolerance, pH sensitivity and reduced plasma membrane H+-ATPase activity. Planta 227: 659–669. [DOI] [PubMed] [Google Scholar]
- 32. Cheng NH, Pittman JK, Shigaki T, Lachmansingh J, LeClere S, et al. (2005) Functional Association of Arabidopsis CAX1 and CAX3 Is Required for Normal Growth and Ion Homeostasis. Plant Physiol 138: 2048–2060. [DOI] [PMC free article] [PubMed] [Google Scholar]
- 33. Hamada S, Seiki Y, Watanabe K, Ozeki T, Matsui H, et al. (2009) Expression and interaction of the CBLs and CIPKs from immature seeds of kidney bean (Phaseolus vulgaris L.). Phytochemistry 70: 501–507. [DOI] [PubMed] [Google Scholar]
- 34. Nelson BK, Cai X, Nebenführ A (2007) A multicolored set of in vivo organelle markers for co-localization studies in Arabidopsis and other plants. Plant J 51: 1126–1136. [DOI] [PubMed] [Google Scholar]
- 35. Munns R (2005) Genes and salt tolerance: bringing them together. New phytol 167: 645–663. [DOI] [PubMed] [Google Scholar]
- 36. Mahajan S, Tuteja N (2005) Cold, salinity and drought stresses: an overview. Arch Biochem Biophys 444: 139–158. [DOI] [PubMed] [Google Scholar]
- 37. Abogadallah GM (2010) Antioxidative defense under salt stress. Plant Signal Behav 5: 369–374. [DOI] [PMC free article] [PubMed] [Google Scholar]
- 38. Knight H, Knight MR (2001) Abiotic stress signaling pathways: specificity and cross-talk. Trends Plant Sci 6: 262–267. [DOI] [PubMed] [Google Scholar]
- 39. Yang T, Poovaiah BW (2002) Hydrogen peroxide homeostasis: activation of plant catalase by calcium/calmodulin. Proc Natl Acad Sci U S A 99: 4097–4102. [DOI] [PMC free article] [PubMed] [Google Scholar]
- 40. Hu X, Jiang M, Zhang J, Zhang A, Lin F, et al. (2007) Calcium-calmodulin is required for abscisic acid-induced antioxidant defense and functions both upstream and downstream of H2O2 production in leaves of maize (Zea mays) plants. New Phytol 173: 27–38. [DOI] [PubMed] [Google Scholar]
- 41. Xu SC (2010) Abscisic acid activates a Ca2+-calmodulin-stimulated protein kinase involved in antioxidant defense in maize leaves. Acta Biochim Biophys Sin 42: 646–655. [DOI] [PubMed] [Google Scholar]
- 42. Shoresh M, Spivak M, Bernstein N (2011) Involvement of calcium-mediated effects on ROS metabolism in the regulation of growth improvement under salinity. Free Radic Biol Med 51: 1221–1234. [DOI] [PubMed] [Google Scholar]
- 43. Gouiaa S, Khoudi H, Leidi EO, Pardo JM, Masmoudi K (2012) Expression of wheat Na+/H+ antiporter TNHXS1 and H+- pyrophosphatase TVP1 genes in tobacco from a bicistronic transcriptional unit improves salt tolerance. Plant Mol Biol 79: 137–155. [DOI] [PubMed] [Google Scholar]
- 44. Luan S (2009) The CBL-CIPK network in plant calcium signaling. Trends Plant Sci 14: 37–42. [DOI] [PubMed] [Google Scholar]
- 45. Batistic O, Kudla J (2009) Plant calcineurin B-like proteins and their interacting protein kinases. Biochim Biophys Acta 1793: 985–992. [DOI] [PubMed] [Google Scholar]
- 46. Gu Z, Ma B, Jiang Y, Chen Z, Su X, et al. (2008) Expression analysis of the calcineurin B-like gene family in rice (Oryza sativa L.) under environmental stresses. Gene 415: 1–12. [DOI] [PubMed] [Google Scholar]
- 47. Livak KJ, Schmittgen TD (2001) Analysis of relative gene expression data using real-time Quantitative PCR and the 2–ΔΔCt method. Methods 25: 402–408. [DOI] [PubMed] [Google Scholar]
- 48. Horsch RB, Fry JE, Hoffmann NL, Eichholtz D, Rogers SC, et al. (1985) A simple and general method for transferring genes into plants. Science 227: 1229–1231. [DOI] [PubMed] [Google Scholar]
- 49. Polle A, Otter T, Seifert F (1994) Apoplastic peroxidases and lignification in needles of norway spruce (Picea abies L.). Plant Physiol 106: 53–60. [DOI] [PMC free article] [PubMed] [Google Scholar]
- 50. Jiang M, Zhang J (2001) Effect of abscisic acid on active oxygen species, antioxidative defence system and oxidative damage in leaves of maize seedlings. Plant Cell Physiol 42: 1265–1273. [DOI] [PubMed] [Google Scholar]
- 51. Heath RL, Packer L (1968) Photoperoxidation in isolated chloroplasts. I. Kinetics and stoichiometry of fatty acid peroxidation. Arch Biochem Biophys 125: 189–198. [DOI] [PubMed] [Google Scholar]
- 52. Yang Q, Chen ZZ, Zhou XF, Yin HB, Li X, et al. (2009) Overexpression of SOS (Salt Overly Sensitive) Genes Increases Salt Tolerance in Transgenic Arabidopsis. Mol Plant 2: 22–31. [DOI] [PMC free article] [PubMed] [Google Scholar]
Associated Data
This section collects any data citations, data availability statements, or supplementary materials included in this article.
Supplementary Materials
Amino acid sequence alignment of TaCIPK29 with closer homologs from rice and barley. Black shadings indicate identical residues, while grey shadings represent similar residues. The activation loop, FISL domain and PPI domain are underlined. Sequences of OsCIPK29 (Q7XIW5) and HvCIPK29 (BAJ95612) were acquired from Uniprot database.
(TIF)
Phylogenetic analysis of TaCIPK29 with other known CIPKs from Arabidopsis, tobacco, rice and barely. The phylogenetic tree is generated with amino acid sequences by using MEGA4.0 software. The distinct subgroups of CIPK are depicted with the vertical line. The CIPKs sharing high homology with TaCIPK29 are depicted on gray background. The accession numbers of 26 AtCIPKs from Arabidopsis thaliana in NCBI database (http://www.ncbi.nlm.nih.gov/) are as follows: AtCIPK06 (AAF8650), AtCIPK07 (AAK16682), AtCIPK08 (AAK16683), AtCIPK09 (AAK16684), AtCIPK10(AAK16685), AtCIPK11(AAK16686), AtCIPK12 (AAK16687), AtCIPK13 (AAK16688), AtCIPK14 (AAK16689), AtCIPK15 (AAK16692), AtCIPK16 (AAF19215), AtCIPK17 (AAK64513), AtCIPK18 (AAK59695), AtCIPK19 (AAK50347), AtCIPK20 (AAK61493), AtCIPK21 (AAK59696), AtCIPK22 (AAL47845), AtCIPK23 (AAK61494), AtCIPK24 (AAK72257), AtCIPK25 (AAL41008), AtCIPK26 (NP_850861 ). Other sequences used: OsCIPK29 (Q7XIW5), HvCIPK29 (BAJ95612.1), NtCIPK14 (KC429561).
(TIF)
Amino acid alignment and domain analysis of wheat TaCBL2 and TaCBL3 with tobacco NtCBL2 and NtCBL3. All the CBLs have four calcium binding EF-hand and a FPSF motif. The FPSF motif and the EF-hand (E-helix, F-helix and calcium binding loop) are underlined. The asterisk represents the highly conserved Ser residue (S) that can be phosphorylated in the FPSF motif.
(TIF)
Phylogenetic analysis of tobacco NHXs with NHXs from Arabidopsis and tomato. The phylogenetic tree was generated using ClustalX2.0 and MEGA4.0 softwares. Their accession numbers in uniprot database (http://www.uniprot.org/) are as follows: AtNHX1(Q68KI4);AtNHX2(Q56XP4);AtNHX3(Q84WG1);AtNHX4(Q8S397);AtNHX5(Q8S396);AtNHX6(Q8RWU6);AtNHX7/AtSOS1(Q9LKW9);LeNHX1(Q93YH2);LeNHX2(Q93YH1);LeNHX3(Q1JRA3);LeNHX4(Q1JRA2); SlSOS1(Q4W3B5).
(TIF)
Phylogenetic analysis of NtCAX3 with CAXs from Arabidopsis and tomato. The phylogenetic tree was generated using ClustalX2.0 and MEGA4.0 softwares. AtCAXs are obtained from uniprot database (http://www.uniprot.org/). SlCAXs are obtained from plantGDB database (http://www.plantgdb.org/SlGDB/or ftp://ftp.plantgdb.org/download/Genomes/SlGDB/). Their accession numbers are as follows:AtCAX1(Q39253);AtCAX2(Q39254);AtCAX3(Q93Z81);AtCAX4(Q945S5);AtCAX5(Q8L783);AtCAX6(Q9LFZ8);AtCAX7(Q9FKP1);AtCAX8(Q9FKP2);AtCAX9(Q9LJI2);AtCAX10(Q9SYG9);AtCAX11(O04034);Solyc01g098800;Solyc02g069710; Solyc03g032240; Solyc03g123790; Solyc06g006110; Solyc06g009130; Solyc07g006370; Solyc07g042000; Solyc07g056110; Solyc07g062700; Solyc09g005260 (SlCAX3); Solyc09g072690; Solyc12g011070; Solyc12g014110; Solyc12g055750.
(TIF)
Primers used for PCR analysis.
(DOC)
Sequence analysis of tobacco antiporters with the corresponding orthologs in Arabidopsis and tomato.
(DOC)


