

Abstract
A four-region (capillary plasma, endothelium, interstitial fluid, cell) multipath model was configured to describe the kinetics of blood-tissue exchange for small solutes in the lung, accounting for regional flow heterogeneity, permeation of cell membranes and through interendothelial clefts, and intracellular reactions. Serotonin uptake data from the Multiple indicator dilution “bolus sweep” experiments of Rickaby and coworkers (Rickaby DA, Linehan JH, Bronikowski TA, Dawson CA. J Appl Physiol 51: 405–414, 1981; Rickaby DA, Dawson CA, and Linehan JH. J Appl Physiol 56: 1170–1177, 1984) and Malcorps et al. (Malcorps CM, Dawson CA, Linehan JH, Bronikowski TA, Rickaby DA, Herman AG, Will JA. J Appl Physiol 57: 720–730, 1984) were analyzed to distinguish facilitated transport into the endothelial cells (EC) and the inhibition of tracer transport by nontracer serotonin in the bolus of injectate from the free uninhibited permeation through the clefts into the interstitial fluid space. The permeability-surface area products (PS) for serotonin via the inter-EC clefts were ∼0.3 ml·g−1·min−1, low compared with the transporter-mediated maximum PS of 13 ml·g−1·min−1 (with Km = ∼0.3 μM and Vmax = ∼4 nmol·g−1·min−1). The estimates of serotonin PS values for EC transporters from their multiple data sets were similar and were influenced only modestly by accounting for the cleft permeability in parallel. The cleft PS estimates in these Ringer-perfused lungs are less than half of those for anesthetized dogs (Yipintsoi T. Circ Res 39: 523–531, 1976) with normal hematocrits, but are compatible with passive noncarrier-mediated transport observed later in the same laboratory (Dawson CA, Linehan JH, Rickaby DA, Bronikowski TA. Ann Biomed Eng 15: 217–227, 1987; Peeters FAM, Bronikowski TA, Dawson CA, Linehan JH, Bult H, Herman AG. J Appl Physiol 66: 2328–2337, 1989) The identification and quantitation of the cleft pathway conductance from these studies affirms the importance of the cleft permeation.
Keywords: serotonin, endothelium, transport modeling, pulmonary capillary permeability, convection-diffusion, capillary-tissue exchange, hydroxytryptamine receptors
there is continued widespread interest in vasoactive substrates and how they are removed or modified by vascular endothelial cells (EC). An important step in understanding this process is describing the kinetics of the uptake and diffusion of these substrates out of the capillary blood to their sites of action. A vasoactive substrate of exemplary interest is serotonin (5-hydroxytryptamine). It is involved in the constriction-dilation of pulmonary vasculature as well as in promoting platelet aggregation and blood clotting (51). Serotonin uptake into platelets and endothelial cells (with platelets the main reaction pathway) is used to control plasma serotonin levels and changes in Vmax for platelet uptake is linked to hypertension (8). Pulmonary EC uptake of serotonin may be reflective of the health of endothelial barriers in general and could give early evidence of pulmonary disorders (18). This makes an accurate physiological model to assist investigators in understanding the role of serotonin in the lungs essential.
An important aspect of this study is that 100% of the transport of hydrophilic solutes lacking facilitating transporters (sucrose, amino acids, etc.) is via the clefts to reach the parenchymal cells of the organ. The clefts are vital for glucose passage in the heart and probably in the lung, since endothelial uptake is exceedingly small and virtually unmeasurable by the indicator dilution method, e.g., by comparing d- vs. l-glucose (untransported) (29), and therefore must be accounted for.
Serotonin is an intermediate product of tryptophan metabolism in the brain, blood platelets, and kidneys (8, 51). Plasma serotonin must either traverse ECs or diffuse through interendothelial clefts to get to the parenchymal cells. The transport of serotonin into the pulmonary endothelium occurs through a saturable transporter that can be described by first order nonlinear Michaelis-Menten kinetics (10, 41). Sucrose, a hydrophilic solute that cannot cross cell membranes and has molecular weight similar to serotonin, permeates the clefts in the lung, heart, and liver (35, 14, 22). In the myocardium transcapillary serotonin exchange is mainly via the clefts (34). Structural studies of the pulmonary endothelium show that most of the periendothelial cleft length are closed by tight interendothelial gap junctions with only a small fraction being open (11, 20). For a normal lung then transport through the endothelium is the primary path by which serotonin reaches pulmonary parenchymal cells such as the epithelium and pulmonary smooth muscle cells.
But what about an abnormal lung? With the availability of in vivo multiple indicator dilution analysis and in vitro recombinant transporter protein experiments (47) that characterize the receptor and transporter kinetics, it is possible to look in more detail at pulmonary serotonin kinetics. With the proper study it could be possible to characterize the serotonin receptor binding characteristics on the pulmonary ECs and beyond to the epithelial and smooth muscle cells. This detail of understanding may be important when looking at lung pathologies such as hyperoxia and edema (44, 38), which can increase EC clefts, inflammation where thrombin can cause increases in inter-EC clefts through increasing cytosolic Ca2+ concentrations (13), microembolism, and subsequent inflammation, which can block EC transporters (21), pulmonary hypertension (32) and the long term effects of antide pressants on the lungs (47). None of these pathologies can be studied by existing two-region models of pulmonary vascular uptake because they all involve changes in the endothelium that may enlarge interendothelial gaps or inhibit serotonin uptake into the endothelium and do not differentiate between the kinetics of the endothelium and of the surrounding parenchymal cells.
The pioneering analyses of Dawson and colleagues (10, 30, 31, 39, 41) on pulmonary endothelial serotonin uptake kinetics used a two-region blood-tissue exchange model accounting for intracapillary gradients using partial differential equations but did not account for the diffusion of serotonin through clefts into the interstitial space [interstitial fluid (ISF)]. Peeters et al. (39) modeled uptake by two separate carrier-mediated transporters on the luminal side of the EC. The analysis showed that they could not distinguish the possibility that both were saturable processes compared with the possibility that one was saturable and the other was passive. However, they showed that imipramine in high concentrations reduced the total extraction to ∼4% (range 2 to 8%) in their Fig. 3 and chose to consider this extraction so small that cleft permeation was effectively zero. They reported that the secondary transporter, representing passive diffusion, represented, at most, ∼10% of the total uninhibited uptake of serotonin (Table 2 in Ref. 39). Our analysis is based on the complementary assumption, namely there is only one transporter on the luminal endothelial membrane and there is in parallel to it a purely diffusional permeation paracellular route, the cleft.
Fig. 3.

Model fits to Malcorps 1984 methods B and C data (31). The 4-region model is 4PSg free. The outflow ratio is the concentration of intravascular reference to concentration of labeled serotonin at the vascular outflow point. Dashed line is intravascular reference outflow shown for timing only. Method B: ratios shown for constant infusion of 0.12, 0.81, and 4.5 nmol/ml (bolus 6, 7, 8) (A and B). A: 4-region model fit. B: 2-region model fit. Method C: bolus injection of serotonin (C and D). Serotonin dosages of trace, 27, and 110 nmol (bolus 5, 3, 4) are shown. C: 4-region model fit. D: 2-region model fit.
Table 2.
Physiological parameter values used to fit 4- and 2-region models to Rickaby 1981 (41), Malcorps 1984 (31), and Rickaby 1984 data (43)
| Rickaby 1981 | Malcorps 1984 | Rickaby 1984 | |
|---|---|---|---|
| Plasma flow, ml·g−1·min−1 | 2.26 | 2.6 | 3.6 |
| t̄, s | 6.86 | 7.0 | 5.65 |
| Blood volume, ml | 33.86 | 59.2 | 46.0 |
| Plasma volume, ml | 20.32 | 35.5 | 27.6 |
| Lobe weight, g | 44.8 | 95.0 | 35.8 |
| Lobe weight with blood, g | 78.7 | 119.0 | 81.8 |
| Arteriole volume, ml/g, 4 region only | (20%) 0.05 | 0.04 | 0.04 |
| Capillary volume., ml/g | (48%) 0.12 | 0.14 | 0.16 |
| Venule volume., ml/g, 4 region only | (32%) 0.08 | 0.06 | 0.05 |
| Vec volume., ml/g, 4 region only | 0.03 | 0.03 | 0.03 |
| Visf volume, ml/g, 4 region only | 0.2 | 0.2 | 0.2 |
| Vpc volume, ml/g, 4 region only | 0.3 | 0.3 | 0.3 |
| Vxv volume, ml/g, 2 region only | 0.4 | 0.4 | 0.4 |
VXV is extravascular volume of distribution used by 2-region fit. EC, ISF, and PC volumes are used by 4-region fit. Blood volume is based on a hematocrit of 40%; t̄ is the plasma organ mean transit time. Rickaby 1981: capillary volume based on capillary mean transit time of 48% of plasma organ mean transit time (30). See text for more information concerning vascular volumes.
Here we propose to address these issues quantitatively, using a four-region blood tissue model (Fig. 1, with nomenclature defined in Table 1), with vascular heterogeneity, to describe the kinetic interactions between the plasma, pulmonary EC, ISF, and parenchymal cells (PC). It is adapted from the linear exchange model developed by Bassingthwaighte et al. (5) by incorporating saturable Michaelis-Menten transporters and enzyme-facilitated reactions for endothelial and parenchymal cells. There are three bidirectional saturable transmembrane transporters, in the luminal endothelial plasmalemma with permeability surface area product PSecl, the abluminal endothelial plasmalemma, PSeca, and across the plasmalemma of the parenchymal cell, PSpc, which is in this setting the pulmonary alveolar cell or binding to smooth muscle receptor sites. The model has saturable consumption in endothelial and parenchymal cells, Gec and Gpc, and a passive diffusive exchange of serotonin, PSg, via the interendothelial clefts connecting the capillary plasma to the interstitial space. The model is further adapted to account for tracer and nontracer serotonin: these species compete for transporters and enzymes, through concentration-dependent nonlinear competitive binding. This model describes tracer and nontracer serotonin uptake and diffusion over varying serotonin concentrations and handles the competitive transporter fluxes and competitive enzymatic reactions at both steady and during transients in both tracer and nontracer serotonin.
Fig. 1.
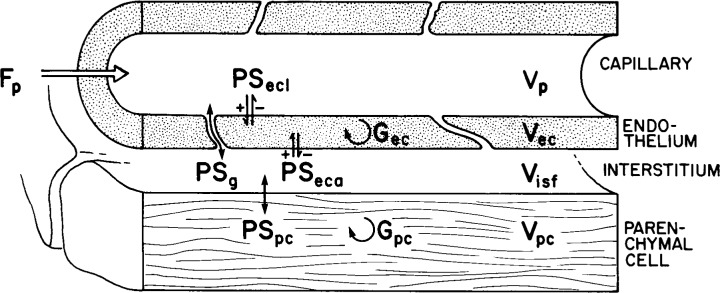
Diagram of a 4-region blood tissue exchange (24). Axial dispersion: Dp = 1 × 10⁻⁴ cm2/s, Dec, Disf, and Dpc = 1 × 10⁻⁶ cm2/s. Gp and Gisf are zero. See text and Table 1 for definitions of symbols and description of model.
Table 1.
Glossary of parameters and variables used in 4- and 2-region kinetic models
| Symbol | Definition | Unit |
|---|---|---|
| 4PSg | Four-region model variant with PSg fixed at 0.5 | |
| 4PSg free | Four-region model variant with PSg a free parameter | |
| Cin(t) | Organ input function | 1/s |
| CMp | Plasma serotonin (mother) conc. | nmol/ml |
| CM_init | Initial conc. of serotonin in capillary | nmol/ml |
| CTp | Plasma serotonin tracer conc. | pmol/ml |
| CRp | Plasma vascular reference conc. | μmol/ml |
| CMec | Endothelial serotonin conc. | nmol/ml |
| CTec | Endothelial serotonin tracer conc | pmol/ml |
| CMisf | ISF serotonin conc. | nmol/ml |
| CMpc | Parenchymal cell serotonin conc. | nmol/ml |
| CTpc | Parenchymal cell serotonin tracer conc. | pmol/ml |
| CMxv | Extravascular conc. (2 reg) | nmol/ml |
| CTxv | Extravascular tracer conc. (2 reg) | pmol/ml |
| Ci | Plasma serotonin inhibitor conc. | nmol/ml |
| Dp | Capillary axial dispersion | cm2/s |
| Dec | Endothelium axial dispersion | cm2/s |
| Disf | Interstitial axial dispersion | cm2/s |
| Dpc | Parenchymal axial dispersion | cm2/s |
| Doset | Dose of labeled serotonin injected | pmol |
| Doser | Dose of intravascular reference injected | μmol |
| Dosem | Dose of serotonin injected | nmol |
| EC | Endothelial cell region (4 reg) | |
| ISF | Interstitial region (4 reg) | |
| P | Capillary region | |
| PC | Parenchymal cell region (4 reg) | |
| XV | Extravascular region (2 reg) | |
| Fp | Mean plasma flow | ml·g−1·min−1 |
| L | Mean length of a capillary | cm |
| L1 | Mean length of an arteriole (4 reg) | cm |
| L2 | Mean length of a venule (4 reg) | cm |
| OrgW | Organ weight with blood. | g |
| PDF(f) | Flow probability density function (4 reg) | unitless |
| PDF RD | PDF relative dispersion (4 reg) | unitless |
| t̄ | Mean organ plasma transit time | cm |
| Vart | Arteriole volume | ml/g |
| Vvein | Venule volume | ml/g |
| Vp | Capillary volume | ml/g |
| Vec | EC volume of distribution (4 reg) | ml/g |
| Visf | ISF volume of distribution (4 reg) | ml/g |
| Vpc | PC volume of distribution (4 reg) | ml/g |
| Vxv | Extravascular vol of distrib (2 reg) | ml/g |
| Ki | dissociation constant for the inhibitor | μM |
| Vmax_ecl | Vmax for PS luminal side of EC (4 reg) | nmol·g−1·min−1 |
| Kmecl | Km for PS luminal side of EC (4 reg) | μM |
| Vmax_eca | Vmax for PS anti-luminal side of EC (4 reg) | nmol·g−1·min−1 |
| Kmeca | Km for PS anti-luminal side of EC (4 reg) | μM |
| PSg | Diffusive PS from capillary to ISF (4 reg) | ml·g−1·min−1 |
| Gecmax | Vmax for EC consumption (4 reg) | nmol·g−1·min−1 |
| KmGec | Km for EC consumption (4 reg) | μM |
| Vmax_xv | Vmax for PS luminal side of XV space (2 reg) | nmol·g−1·min−1 |
| Kmxv | Km for PS luminal side of XV space (2 reg) | μM |
| PSev | Diffusive PS from XV to capillary (2 reg) | ml·g−1·min−1 |
| Gxv | Extravascular consumption (2 reg) | ml·g−1·min−1 |
| Vmax_pc | Vmax for PS ISF to PC (4 reg) | nmol·g−1·min−1 |
| Kmpc | Km for PS ISF to PC (4 reg) | μM |
| Gpcmax | Vmax for PC consumption (4 reg) | nmol·g−1·min−1 |
| KmG_pc | Km for PC consumption (4 reg) | μM |
Terms only used by one or the other model are labeled 4 or 2 region (reg). Conc, concentration.
MATERIALS AND METHODS
Blood Tissue Exchange Model and Equations
Figure 1 diagrams the axially distributed four-region model; terms are in Table 1. The four regions are described by four partial differential equations over the spatial domain x extending from x = 0 at the capillary entrance to its exit at x = L, the capillary length:
Capillary:
| 1 |
Endothelium:
| 2 |
Interstitial:
| 3 |
Parenchymal:
| 4 |
The subscripts p, ec, isf, pc denote the capillary, EC, ISF, and PC regions, respectively. Cn, are the concentrations (mol/ml) of the substrate in the n region, dependent on axial position x and time t. *PS indicates saturable transporters (Eq. 6). Fp is plasma flow (in ml·g−1·min−1), Vn are volumes of distribution (ml/g) within region n (in this paper V and “volume” represent volumes of distribution for the substrate in question). A volume of distribution is defined as the sum of the volume in which the free solute resides, e.g., the water space, plus any equivalent volume due to the concentration of any bound substrate within the volume equilibrated with the concentration of free substrate. For this model there are no binding sites so the volume of distribution for serotonin is just the water space of the region. The anatomical volume of plasma water is the reference intravascular volume of distribution, Vp, and the others, Vec, Visf, and Vpc volumes of distribution, are estimated by fitting experimental data, constrained by the prior estimates obtained by direct techniques [sheep lungs: (46), dog lungs: (33), rabbit hearts: (23)]. Dn is the effective axial diffusion coefficient (cm2/s) within region n. Gec and Gpc are consumption terms (in ml·g−1·min−1) for the EC and PC (defined in Eq. 7). PSg is the diffusive permeability-surface area term used to describe the diffusion between the plasma and the ISF and is not saturable. The permeability-surface area products (PS) PSecl, PSeca, and PSpc are the conductances of saturable transporters (in ml·g−1·min−1) for substrate transport between plasma-EC, EC-ISF, and ISF-PC, respectively. The boundary condition for the capillary entrance is
At x = 0: (−F·L/V)·(C−Cin)+D·∂C/dx = 0, for all solutes, thus balancing the convective inflow and the diffusive backflow at the entrance. At the capillary exit at x = L, and at the other regions' upstream and downstream boundaries at x = 0 and x = L, for all solutes: D·∂C/dx = 0. The initial condition at t = 0 in the capillary is: if x = 0, C = Cin + Cinit else C = Cinit, where Cinit is the initial concentration within the region (capillary). The intravascular transport of tracer-labeled albumin uses Eq. 1 with PS set to zero.
The instantaneous extraction, E(t), of a solute (serotonin) is given by
| 5 |
where h(t) and h(t)ref are the transport functions of labeled serotonin and intravascular reference, respectively, C(t)p is the capillary concentration of the labeled serotonin, and C(t)r is the capillary concentration of the intravascular reference, Doser is the intravascular reference dose, and Doset is the dosage of the labeled serotonin injected into the lung.
Saturable Serotonin Transporters
Endothelial uptake of serotonin is modeled, following Rickaby et al. (41), using Michaelis-Menten parameters Vmax (nmol·g−1·min−1) and Michaelis constant Km (μM) defining the conductance PSecl (ml·g−1·min−1), across the luminal surface of the EC
| 6 |
where Cp is the total concentration of serotonin in the capillary plasma. PSecl and PSeca are assumed identical in Vmax and Km, but the governing concentration for PSeca is Cisf. We modeled the effect of imipramine (Ci) on serotonin transport across the endothelial membrane by use of a simple, fully competitive inhibitor model of the binding of imipramine to the serotonin transporter. The dissociation constant for the inhibitor reaction, Ki, is the ratio of the Off over the On rates of imipramine binding to the serotonin transporter (19). The transporter into the PC from the ISF [PSpc(t,x)] is assumed to be identical, kinetically, to the EC transporter, except for the absence of the imipramine inhibitor term, since the concentration of imipramine in the ISF is assumed to be zero. The use of a simplified transporter is based on two assumptions: the serotonin binding and unbinding reactions with the membrane transporter are fast compared with the movement of the serotonin-transporter complex across the membrane, and the transporter concentration is small compared with that of the substrate. The latter assumption means that this is a noncapacitive transporter. Neither assumption is exactly true, and in tracer-only experiments one should probably consider that the transporter binds some serotonin (40).
Serotonin Consumption
Consumption of serotonin within the EC is assumed to follow Michaelis-Menten enzyme kinetics (5) and so the consumption term is similar to Eq. 6
| 7 |
where Gec(t,x) is the rate of consumption in the EC. Consumption in the PC, Gpc, is assumed to behave, kinetically, the same as in the EC. This assumes no influence of imipramine on Gec.
Endothelial Cleft Diffusion
Diffusion through interendothelial clefts is by passive diffusion (25) with little steric hindrance for a molecule the size of serotonin (6, 16). Serotonin permeates myocardial endothelial clefts in rabbit hearts (34) with a mean PSg of 2.16 ± 0.93 ml·min−1·g−1. Pulmonary smooth muscle cells are activated by intra-arterial serotonin so it is clear that it crosses the capillary wall. Imipramine, an endothelial serotonin transport blocker, diminished the transpulmonary instantaneous extraction of serotonin by ∼90% (18, 43). This result implies that up to 10% of the serotonin traverses the clefts, even though their experiments lacked an extracellular reference to measure cleft permeability explicitly. The studies of Yipintsoi (52) and of Tancredi and Yipintsoi (50) demonstrated that cleft permeability to small hydrophilic solutes was moderately high, with PSg values of 1 to 5 ml·min−1·g−1 for sodium, and also with clear evidence of recruitment of PSg with increasing flow and pressure, in accord with the recruitment of extravascular water at increasing pressures and flows (49).
For the pulmonary endothelium, sucrose, a hydrophilic molecule, provides evidence of diffusion through the clefts (9, 35). Sucrose has a molecular weight of 342 compared with 176 for serotonin and so we expect, from the square root of the ratio of molecular weights, serotonin PSg to be ∼1.4 times sucrose permeability (PSgsuc) (34). In an anesthetized dog lung, Neufeld et al. (35) found that PSgsuc was 2.1 ± 0.6 ml/s at a plasma flow of 10.5 ± 1.6 ml/s, a PS-to-flow ratio of ∼0.2. In human lungs Neufeld et al. (35) observed a PS-to-flow ratio of 4.1 ± 1.9 ml/s to 29.9 ± 1.9 ml/s or ∼0.14, which is in the same range. In the data used here (Table 2), the flows ranged from 2.3 to 3.9 ml·g−1·min−1. If the ratios are the same in the data we analyze here, PSg will be ∼0.5–0.8 ml·g−1·min−1. For our analysis we will fix the PSg value at 0.5 ml·g−1·min−1 and fit to the data followed by allowing PSg to be free. Fixing PSg allows for better estimates of the EC transporter parameters because there is one less free parameter to optimize against and will generate narrower estimated confidence intervals and allow us to realistically maximize the effect of cleft diffusion.
Four-Region Model Variables and Parameters
For fitting our model to serotonin outflow data we use three sets of concentration curves: Mother CM(t,x), Tracer CT(t,x), and Intravascular reference CR(t,x). “Mother” is the unlabeled serotonin; Tracer is labeled serotonin at trace levels (∼10−4 times mother). The intravascular reference concentration curve is described by a version of Eq. 2 without permeation:
| 8 |
The intravascular reference is assumed to not permeate either the ISF or the EC region. Since the intravascular reference is injected simultaneously with the mother and tracer serotonin, its outflow curve is used to represent the dispersion and delay of the serotonin in the vascular space and thereby serve as a reference to determine the intraorgan serotonin uptake. The input functions were not recorded, so the outflow curve was also used to reconstruct the input concentration-time curve by a forward approach instead of a deconvolution. The experimenter's original analyses had used Bronikowski's deconvolution method (10) as we have generally done (45), but as this is essentially a derivative technique and is not inherently stable, we chose a less complex, more stable method. A long-tailed input function composed of a lagged normal density function terminated in a multiexponential tail was used for the Rickaby 1981 and 1984 analyses (41, 43) and a pulse input function was used for the Malcorps analysis (31) to represent the putative input function. Automated optimization to adjust the parameters of the input function was used to minimize the differences between the intravascular outflow curve to the observed intravascular reference (albumin) curve. This was then used to drive the model for each injection.
Flow and Dispersion
Flow is modeled as constant velocity in the axial direction in the capillary. The EC, ISF, and PC spaces have no flow but have axial diffusion. The serotonin plasma diffusion term, Dp, set for Dp = 1 × 10⁻⁴ cm2/s (17), is a combination of molecular diffusion, axial velocity distribution, flow disturbances by branching, etc. (40). The values for Dec, Disf, and Dpc were set to 1 × 10⁻⁶ cm2/s for this model. Radial diffusion is assumed to be instantaneous within each region since the radial distances are 10 μm or less (4); i.e., each extravascular region is considered to be radially “well stirred” but has axial gradients.
Flow Heterogeneity
The modeling of pulmonary capillary flow heterogeneity was based on a probability density function (PDF) of relative regional flows, w(f), represented as seven discrete flows, with a mean of 1.0 and area 1.0. Seven paths were chosen to shorten computational time but still give a relatively smooth transport function. Using more than seven paths for the analysis adds little information since each of these has a dispersed output function and their sum covers the range provided by a larger number of paths (27, 28). Each path consisted of an arteriole, a capillary, and a venule, as described by King et al. (27) and by Audi et al. (2):
| 9 |
| 10 |
where wi is the frequency of occurrence, the fraction of the mass of the organ with flow in the range Δfi about the relative flow fi. Based on transpulmonary relative dispersion (RD) observed by Knopp et al. (28), a random walk PDF was used with a RD of ∼0.5 (varied slightly with different data sets) and skewness of 1.6. The relative flows ranged between 0.5 and 2.0 times the mean flow. (The RD of a PDF is its coefficient of variation.) We used equal widths, Δfi, to cover the range.
The heterogeneity in arterioles and venules was set identically to that in the capillaries, by using the same PDF, but the estimates of vascular volumes depended on which of the three data sets was being analyzed. Arteriolar volumes were 0.04 to 0.05 ml/g and venular volumes were ∼50% larger (Table 2). The arterioles and venules are impermeable “pipes” in that there is no uptake or metabolism of serotonin, only dispersion and delay between input and output.
Two-Region Model
The two-region model described by Linehan et al. (30) is a simplification of that of Peeters et al. (39) consisting of three components that describe the serotonin kinetics between the capillary and the extravascular space: a one-way facilitated transporter from capillary into an extravascular space, PSxv, a passive backdiffusion term from extravascular space to capillary, PSev, and an extravascular linear constant consumption term, Gxv. Vascular axial dispersion, Dp, was set to zero, to match their usage. Capillary heterogeneity is accounted for by relating a distribution of capillary transit times to points on a capillary with the longest transit time, thereby simplifying the number of equations needed to solve the system. The equations used for the two-region model are
Capillary region (p):
| 11 |
Extravascular region (XV):
| 12 |
| 13 |
and for the intravascular reference (CR), Eq. 11 with PSev = PSxv = 0.
PSev (ml·g−1·min−1) is the backdiffusion into the capillary, and Gxv (ml·g−1·min−1) is the extravascular linear consumption term. PSxv(x,t) is the apparent PS for the transport of serotonin from the capillary to the extravascular space with Michaelis-Menten kinetic parameters Vmax_xv and Kmxv.
Intraorgan flow heterogeneity was accounted for by Audi et al.'s (2) transit time variant on King et al.'s (27) model for the PDF of regional flows.
Experimental Conditions
The experimental data used to analyze the model came from Rickaby et al. (41, 43), and Malcorps et al. (31). These experiments consist of perfusing the dog lung with plasma, injecting a bolus containing a vascular reference tracer along with the tracer-labeled serotonin. Unlabeled serotonin (mother) is either constantly perfused, or injected along with the tracers; this latter approach is known as the bolus sweep method, because the tracer competes with mother solute for the transporters as the mother substance concentrations sweep through a large range to inhibit the uptake. The inhibition is small at the front end of the bolus, reaches a peak, and diminishes. The modeling has to account for tracer and nontracer serotonin separately as the degree of transporter saturation changes the fluxes.
Computational Methods
The models were developed under JSim, a Java-based simulation environment for building and analyzing numeric models (7). The PDE solver used was the McCormack solver. Extensive on-line manuals and methods used in JSim are at http://www.physiome.org/jsim.
The three sets of equations representing the three serotonin dosage levels from each set of experimental data were fitted simultaneously with the model solutions. Optimization of kinetic parameters (Vmax_ecl, Kmecl, PSg, Gecmax, KmGec) was done through minimizing the root mean square error (RMS) of the differences between model solution and the data at each time point. The differences were uniformly weighted; from the RMS error the coefficient of variation was calculated for comparison with previously published analyses of the same data (30). Optimizations were done by using the JSim's Simplex and SENSOP optimization routines (12). SENSOP was used first to get a visual goodness of fit to data and Simplex was then employed to fine tune the optimization. Parameter confidence limits and their interdependences (correlation) were evaluated by using the normalized covariance matrix of the parameters. The models used in this paper are available at http://www.physiome.org/jsim/models/webmodel/NSR/JardineSerotonin_FourRegion/.
Sensitivity analysis of model parameters was accomplished by making a finite differences approximation to the rate of change of the model with respect to each parameter. If Cout(t) represents a model function dependent on N parameters, pi, then the sensitivity function Spi(t) is defined as
| 14 |
For our model analysis, the function used is the organ outflow curve CpOut(t) and Δpi = 1%.
RESULTS
Two variations of the four-region model and the two-region model were fit to three sets of data [Rickaby 1981 (41), Malcorps 1984 (31), Rickaby 1984 (43)]. These data sets use the same multiple-indicator dilution technique but with different conditions to help characterize serotonin uptake and transport. The Rickaby 1981 data were obtained from bolus injections of serotonin and reference indicators, the Malcorps 1984 data included bolus injections during constant infusion of serotonin, and the Rickaby 1984 data included bolus injections while the serotonin transporter is blocked by constant infusion of imipramine. The variants on the four-region analysis were 1) PSg, the permeability × surface area product for the interendothelial clefts, is fixed at 0.5 ml−1·g·min−1 (referred in the text as model “4PSg”) and 2) PSg is not fixed (referred in the text as model “4PSg free”) and allowed to vary during model optimization.
Table 2 gives the physiological values used in the four- and two-region model fits to the three data sets of Rickaby 1981, Malcorps 1984, and Rickaby 1984. Vascular volumes based on estimates given by Linehan et al. (30) and Audi et al. (1). The Linehan analysis used data originally obtained by Rickaby et al. (41). The arteriole and venule volumes are assigned values based on the capillary volume representing 48% of the total organ vascular volume and the venule representing 32% of the organ vascular volume (1). The arteriole and venule volumes are treated the same computationally, the only difference being one volume is in front and the other behind the capillary. The volumes of the arterioles and venules were adjusted to obtain an input curve that matched the experimental produced output curve.
The parameter estimation results from the four- and two-region fits, along with the original reported values, are in Tables 3, 4, and 5 for Rickaby et al. 1981, Malcorps et al. 1984, and Rickaby et al. 1984, respectively. Figure 2 displays the four- and two-region model fits to the Rickaby 1981 data. Figure 2A shows outflow curves for the model variant 4PSg free as described above to data from Rickaby 1981. The Rickaby 1981 data consisted of three serotonin outflow curves at 10-, 30-, and 100-nmol doses of serotonin in the injectate and an intravascular reference curve. The reported units are fractions of dose per milliliter. Figures for model variant 4PSg fit are not shown, since its fit to the data is very similar to the 4PSg free results.
Table 3.
Values for kinetic parameters based on 4- and 2-region model fits in Fig. 2 to Rickaby 1981 data (41)
| Model Variant | 4PSg free | 4PSg | 2 Region | 2 Region, Based on Linehan Values | 2 Region, Based on Rickaby Values |
|---|---|---|---|---|---|
| *Vmax_ecl, nmol·g−1·min−1 | 4.0 ± 0.8 | 2.6 ± 0.2 | *15.3 ± 1.0 | *27 | *5.8 ± 2.0 |
| *Kmecl, μM | 0.3 ± 0.1 | 0.12 ± 0.04 | *0.6 ± 0.1 | *1.2 | *0.8 ± 0.3 |
| PSec = Vmax_ecl/Kmec, ml·g−1·min−1 | 13.3 | 22 | *25.5 | *22.1 | *7.3 |
| PSev, ml·g−1·min−1 | *5.7 ± 1.5 | †12.7 | |||
| PSg, ml·g−1·min−1 | 0.3 ± 0.1 | 0.5 | |||
| PSg/F | 0.1 | ||||
| Gecmax, nmol·g−1·min−1 | 2.4 ± 1.4 | 18.4 ± 110 | *7.3 ± 1.7 ml·g−1·min−1 | †7.9 ml·g−1·min−1 | |
| Kmg_ec, μM | 0.5 ± 0.4 | 4.8 ± 29 | |||
| RMS error, 1/ml | 0.0010 | 0.0011 | 0.0008 | ||
| Coefficient of variation | 11.0% | 12.1% | 8.9% | 7.0% |
Values are ± 1SD.
For 2-region fit, Gec is constant (ml·g−1·min−1), PSev is 1-way, and ec is extravascular (xv) region. †Based on Vec of 0.4 ml/g, Linehan '98 analysis (30): Kmet (Gxv) = 0.33 s−1, root mean square (RMS) and coefficient of variation based on 54 data points and weighting of 1. Rickaby 1981 data fit: Vmax_xv = 7.64 nmol/s.
Table 4.
Parameter values for 4- and 2-region fit to Malcorps 1984 data (31)
| Model Variant | 4PSg free Method B | 4PSg Method B | 4PSg free Method C | 4PSg Method C | 2-Region Method B | 2-Region Method C | †Malcorps Method B | †Malcorps Method C |
|---|---|---|---|---|---|---|---|---|
| *Vmax_ecl, nmol·g−1·min−1 | 1.4 ± 0.3 | 1.4 ± 0.3 | 14.0 ± 7.9 | 10.9 ± 2.7 | *7.2 ± 2.9 | *10.8 ± 1.8 | *9.7 ± 0.9 | *6.84 ± 0.48 |
| *Kmec, μM | 0.17 ± 0.04 | 0.16 ± 0.05 | 1.6 ± 0.7 | 1.3 ± 0.4 | *0.26 ± 0.07 | *0.51 ± 0.04 | *1.1 ± 0.1 | *0.70 ± 0.06 |
| *Vmax_ecl/Kmec | 8.2 | 8.8 | 8.8 | 8.4 | *27.7 | *21.6 | *8.8 | * 9.8 |
| PSev ml·g−1·min−1 | *0.01 ± 19 | *0.01 ± 8.1 | ||||||
| PSg ml·g−1·min−1 | 0.4 ± 0.1 | 0.5 | 0.1 ± 0.6 | 0.5 | ||||
| PSg/F | 0.2 | 0.2 | 0.04 | 0.2 | ||||
| RMS error, unitless, | 0.35 | 0.40 | 0.80 | 0.83 | 1.65 | 0.64 | — | — |
Values are ± 1SD. †Values reported by Malcorps et al. 1984 modeled with only a 1-way facilitated transporter (31).
For 2-region fit, PSev is 1-way, and these parameter values are actually for the extravascular (Vmax_xv and Kmxv) area as a whole, not just the endothelium.
Table 5.
Parameter values for 4- and 2-region model fits to Rickaby 1984 data (43)
| Model Variant | 4PSg free Control | 4PSg Control | 4PSg free Imip | 4PSg Imip | 2 Region Control | 2 Region Imip | Rickaby Control | Rickaby Imip |
|---|---|---|---|---|---|---|---|---|
| *Vmax_ecl, nmol·g−1·min−1 | 28 ± 15 | 21.3 ± 3.3 | 18.7 ± 16.7 | 10.4 ± 3.6 | *37.4 ± 3.0 | *45 ± 71 | *24.0 ± 1.8 | *12.6 ± 1.2 |
| *Kmec, μM | 0.9 ± 0.6 | 0.6 ± 0.2 | 0.4 ± 0.4 | 0.021 ± 0.015 | *1.0 ± 0.1 | *0.026 ± 0.004 | *0.69 ± 0.06 | *1.18 ± 0.1 |
| *Vmax_ecl/Kmec | 35 | 36 | 47 | 490 | *37.4 | *1700 | *34.8 | * 10.7 |
| PSev, ml·g−1·min−1 | *0.8 ± 1.3 | *150 ± 730 | ||||||
| PSg, ml·g−1·min−1 | 0.1 ± 0.9 | 0.5 | 0.01 ± 0.8 | 0.5 | ||||
| PSg/F | 0.03 | 0.14 | 0.003 | 0.14 | ||||
| RMS error, unitless | 0.056 | 0.057 | 0.063 | 0.065 | 0.031 | 0.045 |
“Control” and “Imip” refer to type of data used for fit; see text for further details. Ki used: 0.05 μM. Model used by Rickaby is a 2 region one with only one 1-way facilitated transporter (43). Values are ±1SD.
These parameter values are for the extravascular region (Vmax_xv, Kmxv, and PSev) since the Rickaby 1984 model and the 2-region model have only extravascular and vascular space. RMS error is unitless as data being fit was an extraction ratio.
Fig. 2.

Model analysis for 4- and 2-region model fit to Rickaby 1981 data (41), analyzed by Linehan et al. (30). Three dosages shown (A–D): 10, 30, and 100 nmol. Dashed line is intravascular reference curve used for timing. A: outflow comparisons using 4-region model variant 4PSg free graph to Linehan data. B: serotonin outflow curves from a 2-region model fit to Linehan data. C: extractions, E(t) for model variant 4PSg free. Data are from Linehan extraction data based on serotonin and vascular reference outflow curves. Three dosages shown: 10, 30, and 100 nmol. D: extraction ratio plot for 2-region model fit to Rickaby 1981 data. Data model fit to is reported Linehan extraction data (30). Sensitivity analysis of outflow concentrations (E and F) for parameters perturbed 1%. Dotted line is intravascular reference curve (Ref) used for timing. Sensitivity functions normalized to be unitless for comparison, 100-nmol dose shown: 4-region model 4PSg free parameters Vmax_ecl, Kmecl, PSg, Gecmax, and KmGec (E); 2-region model parameter sensitivity analysis (F).
A plot of extraction ratios can give a better view of changes in the shape of the substrate outflow curve vs. the reference curve that are not always apparent in the outflow curves. Figure 2C shows the instantaneous extraction ratio fits for model. Specifically, the extraction curves reveal backdiffusion into the capillary and evidence of flow heterogeneity. The effect of backdiffusion is recognized by the drooping of the tails of the E(t) curves. If there were no backdiffusion or transportation back into the capillary then E(t) would remain constant or rise gradually with time as tracer outflow comes increasingly from the slow-flow pathways. But backdiffusion of unconsumed serotonin raises the concentration in the capillary blood, lowering the apparent extraction. Flow heterogeneity changes the peak extraction times at the different dosages. Figure 2C shows that the peak extraction occurs earliest at the lowest dose extraction and latest at high dose. At low doses, the peak concentrations of mother solute are much less then Kmecl so the extraction curve reaches a peak close to the maximum. At high doses the earliest emerging tracer has its uptake blocked by competition from the nontracer mother solute and it is only after the nontracer concentrations fall to low levels, long after the peak, that the extractions rise as competition diminishes.
Table 3 lists parameter values and goodness of fit calculations for the four-region model variants, the two-region model, Linehan's 1998 model, and Rickaby's 1981 parameter values. Estimates of Vmax_ecl and Kmecl were similar for both four-region variants with the estimates from the model variant 4PSg giving tighter confidence intervals for Vmax_ecl and Kmecl due to less free parameters in the model. For model variant 4PSg free, the estimated PSg is 0.3 ± 0.1 ml·g−1·min−1, lower than our fixed estimate based on sucrose permeation of 0.5 ml·g−1·min−1 for flow of 2.26 ml·g−1·min−1. The estimates for the extravascular transporter (PSxv) parameters Vmax_xv and Kmxv from our two-region model were approximately half of those reported by Linehan and the ratio Vmax_xv to Kmxv was about the same (see two-region model description and results below). Curve fits for the four-region and two-region models are similar, with the two-region model fits by Linehan and us reporting a smaller coefficient of variation, 7% (8.9% for our two-region model) vs. the 11% obtained from our four-region model fit. The four-region model has many more constraints and will give a better fit to experimental data only when the serotonin concentration in the endothelium is large enough to break the assumption in the two-region model that transporter uptake is unidirectional and approximating backtransport as backdiffusion is no longer concentration independent.
The four-region model parameters for the EC transporter are similar to the extravascular transporter parameters Vmax_xv and Kmxv reported by Rickaby for their original fit. Rickaby's two-region model analysis used a one-way transporter with no consumption or backdiffusion; heterogeneity was taken into account (41). Because both of the four-region models variants have similar EC transporter values and are similar to Rickaby's results it appears that the results from Linehan's two-region model overestimated the amount of backdiffusion and compensated for it by increasing Vmax_xv and Kmxv.
The correlation matrix (obtained through normalizing the covariance matrix) for the 4PSg free model reveals important information about parameters' relationship with each other. It gives an estimate of their negative or positive interdependence. The relationship between Kmec and Vmax_ecl is positive, whereas PSg decreases as Vmax_ecl increases. Pairs of parameters with correlation near ±1 are considered irresolvable and are codependent based on the model used and experimental data obtained. The correlation matrices show that model variants 4PSg free and 4PSg give us two independent parameters: Vmax_ecl and the ratio of Gecmax to Kmg_ec (correlation between Gecmax and Kmg_ec is 1). Fixing PSg (model 4PSg) does bring down, a bit, the correlation between Vmax_ecl and Kmecl from 0.96 to 0.87, as expected, but at the expense of increased uncertainty in the consumption parameters Gecmax and KmGec as shown in the SDs for model PSg in Table 3. The two-region correlation matrix reveals high correlation (coefficient of 0.90) between Gxv and PSev, and for the final two data sets we will not report the consumption parameters for all models.
Sensitivity Analysis
To compare parameter sensitivities, we normalize Spi(t) by multiplying Spi(t) with the ratio of pi to CpOut(t). Figure 2E shows the normalized Spi(t) for 4PSg for five parameters: Vmax_ecl, Kmec, Gecmax, Kmg_ec, and PSg. Besides model sensitivity to a parameter, an important characteristic of a parameter can be ascertained from Spi(t): whether a model parameter is separable from another. If evaluation of Spi(t) for each parameter reveals values that are the same or are a product of a scalar of another parameter, then those two parameters are not separable based on the model. In addition, if these two parameters appear as a product in a model equation they will be inseparable, and if these same two parameters form a quotient, Spi(t) for each will be mirror images of each other. Combining the sensitivity information with the correlation matrix gives us a good feel for which parameters are separable in our model and therefore which parameters are extraneous when fitting the model to the data. The timing of the sensitivity function's maximum or minimum also gives some insight into importance of that parameter at that particular point in the outflow curve (3).
We see, from Fig. 2E for a high dose of 100 nmol, that Sp(t) values for Vmax_ecl and Kmecl are not different by a scalar but appear as a quotient in the modeling of PSecl (when Kmecl ≫ Cp) and so are inseparable at low serotonin concentrations, as noted above by the high correlation between the two parameters. The Sp(t) for Kmecl shows a maximum after the reference outflow peak revealing the effect it has on the tail of the outflow curve. The Sp(t) for PSg shows little change in sensitivity throughout the time course, relative to the serotonin outflow concentration, and tells us that, for the four-region model, PSg has only a minor role in the kinetics of serotonin uptake in the lung. This is not to say there is no effect; the sensitivity of PSg at times past the reference peak outflow for the low dose (10 nmol) gives a relative sensitivity of ∼0.02 vs. ∼0.16 at high dose (100 nmol) (Fig. 2E), which is expected due to saturation of the EC transporter.
The next experiments to be analyzed are two experiments of Malcorps et al. (31) using trace bolus injections: one, labeled method B, used a trace bolus injection into a dog lung receiving a constant infusion of serotonin, and the other, labeled method C, used the bolus sweep method, as described in the Rickaby (1981) experiment, with no background infusion of serotonin. A third experiment, method A, used constant infusion of serotonin without tracer injection and was thus not suited for analysis. Malcorps modeled the experiment using just a one-way transporter with no backdiffusion or consumption terms and noted that the fit was only done to data near the peak outflow where backdiffusion was negligible (31). Table 2 shows the physiological values used for the model fits. Behavior of the four-region model during constant infusion of serotonin into the capillary may reveal the importance of accounting for diffusion through interendothelial clefts.
Three sets of data were obtained for method B and method C. Method B had constant infusion levels of unlabeled serotonin at 0.12, 0.81, and 4.50 nmol/ml followed by a bolus injection containing a trace amount of labeled serotonin (bolus 6, 7, 8, respectively). Method C had no constant infusion and three bolus injections containing equal amounts of tracer serotonin and 0, 27, and 110 nmol of unlabeled serotonin (bolus 5, 3, 4, respectively). The reported Malcorps 1984 data are in the form of a ratio of intravascular reference curve to tracer (labeled serotonin). Figure 3 shows the Malcorps methods B and C data with the four- and two-region fits. Table 4 shows parameter fits and RMS error for the four- and two-region model fits to methods B and C data as well as Malcorps' results. The parameters for consumption in the endothelium [Gmaxec, KmGec (four-region model) and extravascular region Gxv (two-region model)] are not reported for Malcorps 1984 and Rickaby 1984 because the estimates had very large SDs (greater than the value itself) due to the high correlation between parameters mentioned earlier.
Looking at the two model fits to the constant infusion (method B) we see, from Fig. 3, A and B, and Table 4 that the curve fit to the 0.12 nmol/ml infusion was not as good in the two-region as it was in the four-region model fit. This is confirmed by the higher RMS error of 1.65 vs. 0.35 for four-region fit (Table 4). The parameter fits for the EC consumption terms are not meaningful since at such low concentrations for method B very little serotonin enters the cell. Also the Vmax_ecl value is much smaller than the estimated Vmax_xv for the two-region model (Table 4). This is directly related to the influence of PSg at these low constant concentrations. The four-region model fits to the constant infusion (method B) show, from Table 4, that the parameter estimates are nearly the same, with 4PSg free estimating PSg to be 0.4 ml·g−1·min−1. This result is evidence of the influence of PSg under constant infusion conditions. Since the infusion of serotonin at 4.50 nmol/ml (bolus 8) would saturate the EC transporter (based on actual Vmax_ecl of around ≤10 ml·g−1·min−1), we cannot obtain a good estimate of EC transporter parameters but it does provide another method for estimating the maximum value of PSg. Assuming the EC transporter is saturated [the outflow ratio of vascular reference (CR) to labeled serotonin (CT) is flat] then we can use the Crone expression for calculating the instantaneous extraction at the outflow peak: E = 1 − e−1PS/Flow (15). Since the EC transporter is saturated, PS = PSg. From the data, at 6 s, the ratio of CR to CT is 1.32, giving a CT extraction of 0.24. Flow was 2.60 ml·g−1·min−1. This gives a PSg value of 0.70 ml·g−1·min−1. Our 4PSg free fit to the method B data gave us a PSg value of 0.4 ± 0.1 ml·g−1·min−1, similar to the 4PSg fixed value of 0.5 ml·g−1·min−1. PSg value for 4PSg free fit to method C data was 0.1 ± 0.6 ml·g−1·min−1, lower than any of our estimates but given the error in the fit, within the expected range (Table 4). Another clue to the significance of PSg under constant infusion is the correlation coefficient between Vmax_ecl and PSg. The 4PSg free method B correlation coefficient between Vmax_ecl and PSg is −0.75, indicating that under constant infusion conditions, diffusion through the clefts should be taken into account. The correlation coefficient between Vmax_ecl and PSg is −0.91 for the 4PSg free fit to method C, confirming the interendothelial clefts lack of influence on serotonin uptake when the EC transporters are not saturated. The two-region fit to method C data had a RMS error of 0.64, better than the four-region fit RMS error 0.80, as expected given the results from the Rickaby 1981 data fits. Note that the total flux out, Vmax_ecl/Kmecl, of the vascular space and into the EC for both four-region model fits to methods B and C are approximately the same and similar to the values reported by Malcorps (Table 4). This gives more indirect evidence of small PSg influence on extravascular serotonin uptake as Malcorps calculated Vmax and Km around the outflow peak so as to remove the influence of backdiffusion (31).
Another set of data to examine is that obtained when the serotonin transporter is blocked. Ideally, if the serotonin transporter is completely blocked, we can ascertain whether interendothelial clefts do allow serotonin diffusion into the ISF. One dog lung experiment involving imipramine as the serotonin transporter inhibitor was done by Rickaby et al. (43). We fit the four-region models to two data sets: one control set, using bolus injections of vascular reference and serotonin, and one in which imipramine was constantly infused along with bolus injections of reference and serotonin. Rickaby et al. (43) used a model that assumed serotonin backdiffusion was negligible and only used data obtained near the peak outflow for their parameter estimation. The concentration of imipramine infused, 3.5 μM, should have been enough to block almost all the serotonin transport, so the reported instantaneous extraction would reflect the cleft permeation. Rickaby et al. noted that the experimental results, estimating an increase in Km and a decrease in Vmax, would point to imipramine as a mixed inhibitor (19) rather than a fully competitive inhibitor where only the Km would change (43).
The four-region models were fit to the instantaneous extraction of bolus injections of 6.6, 30, and 100 nmol of serotonin after the isolated lung lobe had been infused with imipramine, Ci, at 3.5 μM. Figure 4 shows the Rickaby 1984 data with the four- and two-region model fits to it. Table 5 is a summary of the model parameter fits and RMS error for the curve fits for comparison. For Eq. 6, we initially used an estimated imipramine Ki of 50 nM based on Kd for the serotonin transporters on porcine platelet membranes: these depended on plasma sodium concentration and ranged, as reported by Talvenheimo et al. (48), from 137 ± 38 nM at 50 mM Na+ down to 9.1 ± 1.3 nM at 200 mM Na+; 50 nM was chosen as an approximate value at typical plasma concentrations of Na+ of 140 mM.
Fig. 4.

Model fits to Rickaby 1984 group 2 data (43). Three serotonin doses are 6.6, 30, and 100 nmol. Dashed line is intravascular reference outflow curve for timing purposes. Control: group 2 control data (A and B). A: 4-region instantaneous extraction fit. B: 2-region instantaneous extraction fit. Imipramine: lung lobe was infused with 3.5 nmol/ml imipramine (C and D). Ki of 0.05 μM. Group 2 imipramine data. C: 4-region instantaneous extraction fit. D: 2-region instantaneous extraction fit.
Analysis of the imipramine data verified that serotonin PSg through the interendothelial clefts was low. The 4PSg free control fit gives a PSg of 0.1 ± 0.9 ml·g−1·min−1 (Table 5). Fitting the 4PSg free model to imipramine data by using our initial value for Ki of 0.05 μM resulted in a Vmax_ecl of 18.7 ± 16.7 nmol·g−1·min−1, Kmecl = 0.4 ± 0.4 μM, and a PSg of 0.01 ± 0.76 ml·g−1·min−1 with a RMS error of 0.063 (Table 5). Although the PSg drops to essentially zero, the values for Vmax_ecl and Kmecl are within 1 SD of the control fit, suggesting that, for this data set, interendothelial cleft permeation is very small. This is confirmed when we look at the 4PSg model fit with PSg fixed at 0.5 ml·g−1·min−1: The control fit is very similar to the 4PSg free fit but the imipramine data fit shows a 30-fold decrease in Kmecl (from 0.6 to 0.02 μM), indicating that the cleft added too much serotonin flux into the ISF. This forces the EC serotonin transporter to compensate by drastically increasing uptake to increase overall serotonin extraction where it can be consumed within the endothelium and parenchymal cells (PC transporter uses the same kinetic parameters as the EC).
What if our initial estimate of the imipramine dissociation constant Ki is incorrect? If we constrain Vmax_ecl to values within one standard deviation of 28 nmol·g−1·min−1 and fix Kmecl at 0.9 μM and PSg at 0.1 ml·g−1·min−1, values found in the control fit to fit the imipramine data, we get a Vmax_ecl value of 16.9 ± 5.2 nmol·g−1·min−1, a Ki value of 2.1 ± 1.6 μM, and a RMS error 0.063 for model variant 4PSg free (Table 5). For the model variant 4PSg (PSg of 0.5 ml·g−1·min−1) we get a Vmax_ecl of 18.4 ± 7.7 nmol·g−1·min−1 and a Ki of 0.81 ± 0.61 μM with a RMS of 0.073. These values for Ki suggest that imipramine is a partial inhibitor of the serotonin transporter (Ki is > Kmecl) and that the interendothelial clefts do contribute measurably to serotonin uptake.
The two-region model fit to the Rickaby 1984 imipramine data (Fig. 4D and Table 5) gives a better overall fit (RMS error of 0.031 for the control and 0.045 for the imipramine data vs. 0.056 and 0.063 for four-region model), but the imipramine fit requires huge changes in the parameter values that do not make sense physiologically. Kmxv goes from 1.0 to 0.026 μM and PSev goes from 0.8 to 150 ml·g−1·min−1 (Table 5). If we fix our parameters as we did for the four-region models and solve for Ki then we get a Ki value of 1.6 ± 0.5 μM and a RMS error of 0.067, similar to the four-region fits. From the analysis the of Rickaby 1984 imipramine data we can make two observations: if the Ki value of 50 nM is reasonable then uptake through interendothelial clefts is small and the two-region model cannot adequately describe the data, and, second, if Ki is actually much larger (on the order of Kmecl or larger) then interendothelial cleft diffusion is small, but significant (0.1 ml·g−1·min−1 or greater).
DISCUSSION
The Linehan analysis of Rickaby 1981 data shows that the two-region model can fit extravascular pulmonary serotonin uptake as well as the four-region for the specific conditions of the experiment. The Malcorps 1984 data looked at the case of constant infusion of serotonin and the Rickaby 1984 data looked at constant infusion of a serotonin transport inhibitor. Both cases revealed issues with the two-region model: incorrectly accounting for the saturation of the transporter resulting in high extractions at low concentration and the inability for the model to be physiologically consistent when describing inhibited uptake.
A final condition that can affect serotonin uptake is flow through the capillary as measured through the PS/flow ratio. Previous experiments have shown that Vmax for the endothelial transporter is flow independent, Km is independent at plasma flows near or above 6 ml·g−1·min−1 for isolated dog lung and for low-flow cases the calculated Km will increase as backdiffusion was not taken into account in the model fit (43). This is in contradiction to the understanding that Km is a property of the specific chemical reaction and should always be flow independent. Although we do not use any experimental data to compare changes in flow we can compare the two-region and four-region model to see whether the added interendothelial cleft can influence the extraction ratio, in particular, affect Km of the two-region model endothelial transporter with respect to plasma flow changes.
Figure 5 shows the influence plasma flow has on the extraction ratio of the two- and four-region models. The two-region model parameters were obtained by fitting the outflow curves to the four-region model (4PSg) for three dosages (10, 30, 100 nmol) at a plasma flow rate of 2.3 ml·g−1·min−1, which was the flow used in the Rickaby 1981 (41) data fit. All physiological parameters were those used in Table 2. No flow heterogeneity or axial diffusion was used, just a single capillary path. For Fig. 5, top, dosage was 100 nmol and plasma flows used were 2.0 and 10 ml·g−1·min−1, where 10 ml·g−1·min−1 is approximate pulmonary plasma flow in a dog at rest (42). Figure 5, top shows the effect of the cleft at both flow rates and high dosage. At the low flow the instantaneous extraction ratio in the tail is slightly larger and longer for the two-region model. At high flow it is reversed as the PSg term of the four-region model has less of an impact on extravascular uptake and back diffusion. At the intravascular reference peak, when serotonin levels are highest in the capillary, we see a higher extraction ratio with the four-region model at the low flow as the EC transporter is saturated and the effect of PSg is more noticeable. This is evidence that serotonin uptake is less saturated in the four-region model owing to the effects of the interendothelial cleft since it is a passive process dependent on flow and volume and not concentration. The result of this is that the two-region model would tend to overestimate Vmax to compensate for the absence of the cleft and this should be experimentally noticeable at low flows. Figure 5, bottom shows the effect of flow on low concentration (2-nmol dose). At low flow the two models show practically identical extractions over the full time course. This is expected because neither transporter is saturated, reducing the small effect of PSg even further. Notice for high flow that the four-region model gives a higher extraction ratio about the front of the reference peak compared with the two-region model. This is due to the transporter briefly reaching saturation exposing the effect of PSg on uptake. Kmxv must be lowered to match the four-region Kmecl and changes with flow. On the basis of this and the earlier discussion that Km is increased when fitting low dosage curves at low flows, we see that backdiffusion (either through two-way transporter or through interendothelial clefts) is important in obtaining a Vmax and Km that reflects actual physiological situations.
Fig. 5.

Dependence of instantaneous extraction ratio on plasma flow. Flows of 2.0, and 10 ml−1·g·min−1 used for comparison; 2-region model fit to outflow curves of 4-region model at flow of 2.3 ml−1·g·min−1 and PSg of 0.5 ml−1·g·min−1. The 2- and 4-region single path models were used. Dotted line is intravascular reference outflow curve (transport function hAlb) used for timing for each flow. Intravascular reference concentration (Conc.) is right-hand scale. Top: high-concentration dose used was 100 nmol. Bottom: low-concentration dose used was 2 nmol.
From the comparison between the four- and two-region models we see that the presence of the interendothelial cleft has only a small effect on the EC kinetics but that backdiffusion, of some type, into the capillary is important and needs to be accounted for. The two-region model, not accounting for two-way fluxes at low concentrations, at or below Kmecl, and at low plasma flows (less than 3 ml·g−1·min−1 in dog), gives underestimates of Kmxv and overestimates Vmax_xv. However, to verify the four-region model experimentally, as there are too many free parameters to get accurate parameter fits, it will be necessary to run experiments using an extravascular reference, such as l-glucose, whose molecular weight and hydrophilic nature are similar to serotonin, but which remains extracellular, to gather information about diffusion rates and volumes of distributions in the ISF region. This will help in separating the effects of endothelial cleft diffusion from endothelial uptake, which was a big issue in trying to fit the four-region model to the data in the paper. Between an extravascular reference and the use of an endothelial transporter inhibitor the existence of serotonin diffusion through endothelial clefts should be quantifiable. To get confirmation and a more precise value for kinetic parameters PSg, Vmax_ecl, and Kmecl, the experiments should be run at varied flows and low concentrations. It will be necessary to take data for longer periods (30 s for plasma flows of 2.5 ml·g−1·min−1) to capture the tail of the curve because this has important information about serotonin backdiffusion and consumption.
Conclusion
From our analysis and comparison of serotonin pulmonary uptake data we conclude that interendothelial clefts contribute measurably but not greatly to the transport of serotonin into the interstitium, as one would expect from structural studies (20, 36, 37). The overall extraction, at high dosage, of serotonin due to the clefts is ∼7–20% of the total extraction, based on our three data set fits with PSg = 0.5 ml·g−1·min−1 and a unidirectional flux simulated by a very large extravascular space, For the Malcorps et al. method B (31) constant-infusion study at high concentration, the overall serotonin extraction was 32% with the fraction due to the clefts representing 60% of it. The overall extraction of serotonin in the imipramine study of Rickaby et al. (43) went from the control of 72 to 40% when imipramine inhibited, with the interendothelial clefts representing 11 and 27%, respectively, of the total extraction. The increase in the influence of the clefts on the overall extraction in the presence of an inhibitor confirms the possible influence of the EC gaps in pathological lungs. This contrasts sharply with data on rabbit hearts, where the clefts are the main mode of serotonin transport to the ISF (34). The use of the four-region model for serotonin kinetics allowed us to measure cleft permeation and to compare kinetic differences between organs, these results implying that the clefts are more blocked by gap-junctional “zippers” in the lung than in the heart.
These conclusions on the quantitative contribution of the interendothelial clefts are reinforced by other observations from the same laboratory in later years even though they did not specifically identify the clefts as the pathway for passive transport. Peeters et al. (39) found that their model 3 fitted “best.” It had two paths, one saturable and one with such low affinity that it was in the linear regions, i.e., far below the Km and therefore indistinguishable from a purely passive cleft and with a low PS. The PS estimate for this path was ∼10% of the saturable path (39). Dawson et al. (18) used a very high level of imipramine in the perfusate, ostensibly blocking the transporter completely. The serotonin extraction on the upslope of the indicator dilution curve in their Fig. 1 was a few percent, indicating a passive permeation. An analysis of these data with the four-region model gives a PSg of 0.15 ml·g−1·min−1: the interendothelial clefts then represented ∼1% of the control and 85% of the total serotonin PS during the imipramine-inhibited uptake.
The four-region model presented here along with the bolus sweep method with the multiple indicator dilution technique is a useful way to understand the structure and kinetics of the vasculature and reveals differences in endothelial structure from organ to organ, as a whole, without changing the behavior and structure of the cells and organ itself. Nevertheless, it should be remarked that data on the cleft permeability would have been provided directly had the authors included an extracellular reference indicator in their experiments. Probably the best one is tracer-labeled sucrose, as used by Moffett et al. (34), since it has an appropriate molecular weight (342 vs. 176 for serotonin, so the ratio of expected permeabilities can be pretty accurately calculated) and is strictly extracellular so its extraction represents cleft permeation. Cleft widths are governed by the structuring of gap-junctional connections and interstitial glycocalyx and are thus probably similar to functional cleft sizes in the heart, ∼7 nm (26). The clefts are an important avenue of exchange for solutes of molecular weight in the hundreds to the few thousands, the range for most substrates and signaling molecules, and therefore important to lung function.
GRANTS
This research has been supported by National Institutes of Health Grants from NHLBI T15 HL88516 and from NIBIB EB08407.
DISCLOSURES
No conflicts of interest, financial or otherwise, are declared by the author(s).
AUTHOR CONTRIBUTIONS
B.E.J. and J.B.B. conception and design of research; B.E.J. performed experiments; B.E.J. analyzed data; B.E.J. and J.B.B. interpreted results of experiments; B.E.J. prepared figures; B.E.J. drafted manuscript; B.E.J. and J.B.B. edited and revised manuscript; B.E.J. and J.B.B. approved final version of manuscript.
ACKNOWLEDGMENTS
The authors appreciate the efforts of Dr. Said H. Audi in the Department of Bioengineering at Marquette University in supplying us with the original data sets, the work of Erik Butterworth in developing JSim capabilities for these studies, and the work of Gary Raymond in refining the methods for the multicapillary, heterogeneous flow modeling.
REFERENCES
- 1. Audi SH, Krenz GS, Linehan JH, Rickaby DA, Dawson CA. Pulmonary capillary transport function from flow-limited indicators. J Appl Physiol 77: 332–351, 1994 [DOI] [PubMed] [Google Scholar]
- 2. Audi SH, Linehan JH, Krenz GS, Dawson CA. Accounting for the heterogeneity of capillary transit times in modeling multiple indicator dilution data. Ann Biomed Eng 26: 914–930, 1998 [DOI] [PubMed] [Google Scholar]
- 3. Bassingthwaighte JB, Chaloupka M. Sensitivity functions in the estimation of parameters of cellular-exchange. Fed Proc 43: 180–184, 1984 [PMC free article] [PubMed] [Google Scholar]
- 4. Bassingthwaighte JB, Chan ISJ, Wang CY. Computationally efficient algorithms for convection-permeation-diffusion models for blood-tissue exchange. Ann Biomed Eng 20: 687–725, 1992 [DOI] [PubMed] [Google Scholar]
- 5. Bassingthwaighte JB, Wang CY, Chan IS. Blood-tissue exchange via transport and transformation by capillary endothelial cells. Circ Res 65: 997–1020, 1989 [DOI] [PMC free article] [PubMed] [Google Scholar]
- 6. Bassingthwaighte JB. A practical extension of hydrodynamic theory of porous transport for hydrophilic solutes. Microcirculation 13: 111–118, 2006 [DOI] [PMC free article] [PubMed] [Google Scholar]
- 7. Bassingthwaighte JB, Raymond GR, Ploger JD, Schwartz LM, Bukowski TR. GENTEX, a general multiscale model for in vivo tissue exchanges and intraorgan metabolism. Phil Trans A Math Phys Eng Sci 364: 1423–1442, 2006 [DOI] [PMC free article] [PubMed] [Google Scholar]
- 8. Brenner B, Harney JT, Ahmed BA, Jeffus BC, Unal R, Mehta JL, Kilic F. Plasma serotonin levels and the platelet serotonin transporter. J Neurochem 102: 206–215, 2007 [DOI] [PMC free article] [PubMed] [Google Scholar]
- 9. Brigham KL, Harris TR, Owen PJ. [14C]urea and [14C]sucrose as permeability indicators in histamine pulmonary-edema. J Appl Physiol 43: 99–101, 1977 [DOI] [PubMed] [Google Scholar]
- 10. Bronikowski TA, Dawson CA, Linehan JH, Rickaby DA. A mathematical model of indicator extraction by the pulmonary endothelium via saturation kinetics. Math Biosci 61: 237–266, 1982 [Google Scholar]
- 11. Bundgaard M. The 3-dimensional organization of tight junctions in a capillary endothelium revealed by serial-section electron-microscopy. J Ultrastruct Res 88: 1–17, 1984 [DOI] [PubMed] [Google Scholar]
- 12. Chan IS, Goldstein AA, Bassingthwaighte JB. SENSOP: a derivative-free solver for nonlinear least-squares with sensitivity scaling. Ann Biomed Eng 21: 621–631, 1993 [DOI] [PMC free article] [PubMed] [Google Scholar]
- 13. Cioffi DL, Moore TM, Schaack J, Creighton JR, Cooper DMF, Stevens T. Dominant regulation of interendothelial cell gap formation by calcium-inhibited type 6 adenylyl cyclase. J Cell Biol 157: 1267–1278, 2002 [DOI] [PMC free article] [PubMed] [Google Scholar]
- 14. Cousineau DF, Goresky CA, Rouleau JR, Rose CP. Microsphere and dilution measurements of flow and interstitial space in dog heart. J Appl Physiol 77: 113–120, 1994 [DOI] [PubMed] [Google Scholar]
- 15. Crone C. Permeability of capillaries in various organs as determined by use of indicator diffusion method. Acta Physiol Scand 58: 292–305, 1963 [DOI] [PubMed] [Google Scholar]
- 16. Crone C. Does ‘restricted diffusion’ occur in muscle capillaries? Proc Soc Exp Biol Med 112: 453–455, 1963 [DOI] [PubMed] [Google Scholar]
- 17. Dash RK, Bassingthwaighte JB. Simultaneous blood-tissue exchange of oxygen, carbon dioxide, bicarbonate, and hydrogen ion. Ann Biomed Eng 34: 1129–1148, 2006 [DOI] [PMC free article] [PubMed] [Google Scholar]
- 18. Dawson CA, Linehan JH, Rickaby DA, Bronikowski TA. Kinetics of serotonin uptake in the intact lung. Ann Biomed Eng 15: 217–227, 1987 [DOI] [PubMed] [Google Scholar]
- 19. Dixon M, Webb EC. Enzymes. London: Longman, 1979, p. 332–336 [Google Scholar]
- 20. Effros RM, Praker JC. Pulmonary vascular heterogeneity and the Starling hypothesis. Microvasc Res 78: 71–77, 2009 [DOI] [PubMed] [Google Scholar]
- 21. Flink JR, Pitt BR, Hammond GL, Gillis CN. Selective effect of microembolization on pulmonary removal of biogenic-amines. J Appl Physiol 52: 421–427, 1982 [DOI] [PubMed] [Google Scholar]
- 22. Geng WP, Schwab AJ, Hori T, Goresky CA, Pang KS. Hepatic uptake of bromosulfophthalein-glutathione in perfused Eisai hyperbilirubinemic mutant rat liver: a multiple-indicator dilution study. J Pharmacol Exp Ther 284: 480–492, 1998 [PubMed] [Google Scholar]
- 23. Gonzalez F, Bassingthwaighte JB. Heterogeneities in regional volumes of distribution and flows in the rabbit heart. Am J Physiol Heart Circ Physiol 258: H1012–H1024, 1990 [DOI] [PMC free article] [PubMed] [Google Scholar]
- 24. Gorman MW, Bassingthwaighte JB, Olsson RA, Sparks HV. Endothelial cell uptake of adenosine in canine skeletal muscle. Am J Physiol Heart Circ Physiol 250: H482–H489, 1986 [DOI] [PMC free article] [PubMed] [Google Scholar]
- 25. Hodgson L, Tarbell JM. Solute transport to the endothelial intercellular cleft: The effect of wall shear stress. Ann Biomed Eng 30: 936–945, 2002 [DOI] [PubMed] [Google Scholar]
- 26. Kellen MR, Bassingthwaighte JB. Transient transcapillary exchange of water driven by osmotic forces in the heart. Am J Physiol Heart Circ Physiol 285: H1317–H1331, 2003 [DOI] [PMC free article] [PubMed] [Google Scholar]
- 27. King RB, Raymond GM, Bassingthwaighte JB. Modeling blood flow heterogeneity. Ann Biomed Eng 24: 352–372, 1996 [DOI] [PMC free article] [PubMed] [Google Scholar]
- 28. Knopp TJ, Bassingthwaighte JB. Effect of flow on transpulmonary circulatory transport functions. J Appl Physiol 27: 36–43, 1969 [DOI] [PMC free article] [PubMed] [Google Scholar]
- 29. Kuikka J, Levin M, Bassingthwaighte JB. Multiple tracer dilution estimates of d- and 2-deoxy-d-glucose uptake by the heart. Am J Physiol Heart Circ Physiol 250: H29–H42, 1986 [DOI] [PMC free article] [PubMed] [Google Scholar]
- 30. Linehan JH, Audi SH, Dawson CA. The uptake and metabolism of substrates in the lung. In: Whole Organ Approaches to Cellular Mechanism, edited by Bassingthwaighte J, Goresky CA, Linehan JH. New York: Springer-Verlag, p. 427–437, 1998 [Google Scholar]
- 31. Malcorps CM, Dawson CA, Linehan JH, Bronikowski TA, Rickaby DA, Herman AG, Will JA. Lung serotonin uptake kinetics from indicator-dilution and constant-infusion methods. J Appl Physiol 57: 720–730, 1984 [DOI] [PubMed] [Google Scholar]
- 32. Marcos E, Adnot S, Pham MH, Nosjean A, Raffestin B, Hamon M, Eddahibi S. Serotonin transporter inhibitors protect against hypoxic pulmonary hypertension. Am J Respir Crit Care Med 168: 487–493, 2003 [DOI] [PubMed] [Google Scholar]
- 33. Meyer EC, Ottaviano R. Right lymphatic duct distribution volume in dogs: relationship to pulmonary interstitial volume. Circ Res 35: 197–203, 1974 [Google Scholar]
- 34. Moffett TC, Chan IS, Bassingthwaighte JB. Myocardial serotonin exchange: negligible uptake by capillary endothelium. Am J Physiol Heart Circ Physiol 254: H570–H577, 1988 [DOI] [PMC free article] [PubMed] [Google Scholar]
- 35. Neufeld GR, Williams JJ, Graves DJ, Soma LR, Marshall BE. Pulmonary capillary-permeability in man and a canine model of chemical pulmonary-edema. Microvasc Res 10: 192–207, 1975 [DOI] [PubMed] [Google Scholar]
- 36. Ochoa CD, Stevens T. Studies on the cell biology of interendothelial cell gaps. Am J Physiol Lung Cell Mol Physiol 302: L275–L286, 2012 [DOI] [PMC free article] [PubMed] [Google Scholar]
- 37. Parker JC, Stevens T, Randall J, Weber DS, King JA. Hydraulic conductance of pulmonary microvascular, and macrovascular endothelial cell monolayers. Am J Physiol Lung Cell Mol Physiol 291: L30–L37, 2006 [DOI] [PubMed] [Google Scholar]
- 38. Parker JC. Hydraulic conductance of lung endothelial phenotypes and Starling safety factors against edema. Am J Physiol Lung Cell Mol Physiol 292: L378–L380, 2007 [DOI] [PubMed] [Google Scholar]
- 39. Peeters FAM, Bronikowski TA, Dawson CA, Linehan JH, Bult H, Herman AG. Kinetics of serotonin uptake in isolated rabbit lungs. J Appl Physiol 66: 2328–2337, 1989 [DOI] [PubMed] [Google Scholar]
- 40. Poulain CA, Finlayson BA, Bassingthwaighte JB. Efficient numerical methods for nonlinear-facilitated transport and exchange in a blood-tissue exchange unit. Ann Biomed Eng 25: 547–564, 1997 [DOI] [PMC free article] [PubMed] [Google Scholar]
- 41. Rickaby DA, Linehan JH, Bronikowski TA, Dawson CA. Kinetics of serotonin uptake in the dog lung. J Appl Physiol 51: 405–414, 1981 [DOI] [PubMed] [Google Scholar]
- 42. Rickaby DA, Dawson CA, Linehan JH. Influence of blood and plasma-flow rate on kinetics of serotonin uptake by lungs. J Appl Physiol 53: 677–684, 1982 [DOI] [PubMed] [Google Scholar]
- 43. Rickaby DA, Dawson CA, Linehan JH. Influence of embolism and imipramine on kinetics of serotonin uptake by dog lung. J Appl Physiol 56: 1170–1177, 1984 [DOI] [PubMed] [Google Scholar]
- 44. Royston BD, Webster NR, Nunn JF. Time course of changes in lung permeability and edema in the rat exposed to 100-percent oxygen. J Appl Physiol 69: 1532–1537, 1990 [DOI] [PubMed] [Google Scholar]
- 45. Schwartz LM, Bukowski TR, Revkin JH, Bassingthwaighte JB. Cardiac endothelial transport and metabolism of adenosine and inosine. Am J Physiol Heart Circ Physiol 277: H1241–H1251, 1999 [DOI] [PMC free article] [PubMed] [Google Scholar]
- 46. Selinger SL, Bland RD, Demling RH, Staub NC. Distribution volumes of [131I]albumin, [14C]sucrose, and 36Cl in sheep lung. J Appl Physiol 39: 773–779, 1975 [DOI] [PubMed] [Google Scholar]
- 47. Sur C, Betz H, Schloss P. Distinct effects of imipramine on 5-hydroxytryptamine uptake mediated by the recombinant rat serotonin transporter SERT1. J Neurochem 70: 2545–2553, 1998 [DOI] [PubMed] [Google Scholar]
- 48. Talvenheimo J, Fishkes H, Nelson PJ, Rudnick G. The serotonin transporter imipramine receptor: different sodium requirements for imipramine binding and serotonin translocation. J Biol Chem 258: 6115–6119, 1983 [PubMed] [Google Scholar]
- 49. Tancredi R, Caldini P, Shanoff M, Permutt S, Zierler K. The pulmonary microcirculation evaluated by tracer dilution techniques. In: Cardiovascular Nuclear Medicine, edited by Strauss HW, Pitt B, James AE. St. Louis, MO: Mosby, 1974, chapt. 17, p. 255–260 [Google Scholar]
- 50. Tancredi RG, Yipintsoi T. Interrelationships of flow, intravascular pressure, and tissue perfusion in the measurement of capillary permeability to sodium in isolated dog lung lobes. Circ Res 46: 669–680, 1980 [DOI] [PubMed] [Google Scholar]
- 51. Watts SW. 5-HT in systemic hypertension: foe, friend or fantasy? Clin Sci 108: 399–412, 2005 [DOI] [PubMed] [Google Scholar]
- 52. Yipintsoi T. Single-passage extraction and permeability estimation of sodium in normal dog lungs. Circ Res 39: 523–531, 1976 [DOI] [PubMed] [Google Scholar]