

Abstract
Type 2 diabetes (T2D)-associated SNPs are more likely to be expression quantitative trait loci (eQTLs). The allelic expression imbalance (AEI) analysis is the measure of relative expression between two allelic transcripts and is the most sensitive measurement to detect cis-regulatory effects. We performed AEI screening to detect cis-regulators for genes expressed in transformed lymphocytes of 190 Caucasian (CA) and African American (AA) subjects to identify functional variants for T2D susceptibility in the chromosome 1q21–24 region of linkage. Among transcribed SNPs studied in 115 genes, significant AEI (P < 0.001) occurred in 28 and 30 genes in CA and AA subjects, respectively. Analysis of the effect of selected AEI-SNPs (≥10% mean AEI) on total gene expression further established the cis-eQTLs in thioesterase superfamily member-4 (THEM4) (rs13320, P = 0.027), and IGSF8 (rs1131891, P = 0.02). Examination of published genome-wide association data identified significant associations (P < 0.01) of three AEI-SNPs with T2D in the DIAGRAM-v3 dataset. Six AEI single nucleotide polymorphisms, including rs13320 (P = 1.35E-04) in THEM4, were associated with glucose homeostasis traits in the MAGIC dataset. Evaluation of AEI-SNPs for association with glucose homeostasis traits in 611 nondiabetic subjects showed lower AIRG (P = 0.005) in those with TT/TC genotype for rs13320. THEM4 expression in adipose was higher (P = 0.005) in subjects carrying the T allele; in vitro analysis with luciferase construct confirmed the higher expression of the T allele. Resequencing of THEM4 exons in 192 CA subjects revealed four coding nonsynonymous variants, but did not explain transmission of T2D in 718 subjects from 67 Caucasian pedigrees. Our study indicates the role of a cis-regulatory SNP in THEM4 that may influence T2D predisposition by modulating glucose homeostasis.
Keywords: type 2 diabetes, eQTL, allelic expression imbalance, SNP
type 2 diabetes [T2D (MIM 125853)] is a complex metabolic disease for which a genetic contribution is well recognized (2). Since 2007, global efforts to map T2D genetic susceptibility factors have mostly focused on genome-wide association strategies (33). Despite the significant success of these genome-wide association studies (GWAS), based on most recent analyses, the 63 T2D-associated loci discovered so far in Caucasian populations together account only for 5.7% of the liability-scale variance in disease susceptibility, and sibling relative risk (λs) attributed jointly by these variants is 1.104 (19). Thus, targeted analysis of previously identified genomic intervals representing well-replicated genome-wide significant linkage signals for T2D can be considered as an alternative strategy. Chromosome 1q21–24 is one such region of linkage for T2D that has been replicated in multiple studies in Caucasian and non-Caucasian families (3). However, fine mapping studies have not identified a common variant that explains linkage in this region, and no genome-wide significant association signal was discovered in this region in recent GWAS (29).
Recent studies have indicated that most single nucleotide polymorphisms (SNPs) associated with complex diseases are non-coding and more likely to be expression quantitative trait loci (eQTL) (20). Thus, identifying SNPs in chromosome 1q21–24 that regulate expression of transcripts as eQTL may be an alternative strategy to prioritize T2D susceptibility loci in this region. Most heritable gene expression traits are complex and are modulated by a combination of cis- and trans-acting loci. Allelic expression imbalance (AEI) analysis is a measure of relative expression between two alleles of a transcript (35). In AEI analysis, allele-specific mRNA levels are measured within individual samples. Thus, this approach is a very sensitive and specific method to query the effects of genetic and epigenetic differences on cis-regulatory control in a diploid genome, and it is unaffected by sources of variation such as environmental and trans-acting genetic factors (26).
We hypothesized that the linkage signal in the chromosome 1q21–24 region results from multiple common regulatory variants, many of which act in cis to regulate expression of adjacent transcripts. In this study, we performed pyrosequencing (PSQ)-based AEI screening to detect cis-regulators for genes in the chromosome 1q21–24 region that are expressed in transformed lymphocytes (TLs) of 190 Caucasians (CA) and African Americans (AA). We used data from GWAS to find associations of AEI-SNPs or proxies with T2D and glucose homeostasis traits. We further analyzed AEI in TLs from HapMap Caucasian (CEU) subjects to determine if any T2D-associated SNPs in linkage disequilibrium with tested AEI-SNPs modulate allelic expression and explain AEI variance. We identified a 3′-untranslated region (UTR) SNP in the thioesterase superfamily member-4 (THEM4) gene that showed a strong AEI and was associated with glucose homeostasis traits. Furthermore, functional analysis utilizing 3′-UTR luciferase construct and expression analysis in other tissues validated the regulatory role of this SNP. We resequenced coding and other putative functional domains of the THEM4 gene in 192 subjects to identify additional functional variants in this gene. Our results provide evidence that THEM4 is likely a susceptibility gene at the chromosome 1q21–24 locus and may influence T2D predisposition by modulating glucose homeostasis.
MATERIALS AND METHODS
Genes in a 21.4 Mb region flanking SNP rs1056847 and rs859637 in chromosome 1q21–24 were screened for allelic expression imbalance. A schematic workflow for this project is described in Fig. 1.
Fig. 1.
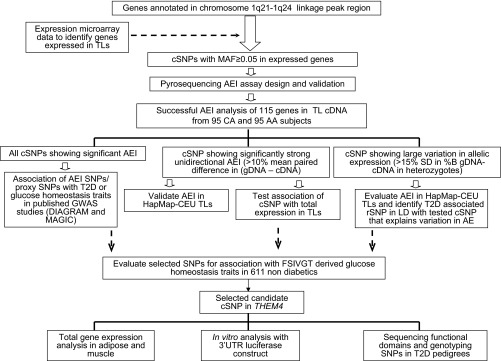
Study design and experimental plan. TL, transformed lymphocyte; cSNP, transcribed single nucleotide polymorphism; MAF, minor allele frequency; AEI, allelic expression imbalance; gDNA, genomic DNA; CA, Caucasian; AA, African American; LD, linkage disequilibrium; FSIVGT, frequently sampled intravenous glucose tolerance test; UTR, untranslated region; T2D, Type 2 diabetes; THEM4, thioesterase superfamily member-4.
Human Subjects
We used TLs from 95 CA and 95 AA from Utah and Arkansas, and 95 HapMap II-CEU subjects for AEI and total gene expression analysis (31). Of 95 CA individuals selected for AEI analysis, 50 are unrelated members from pedigrees showing linkage with T2D at chromosome 1q21–24 region. We also used RNA isolated from subcutaneous adipose and skeletal muscle tissue of 168 metabolically characterized subjects (31). Genomic DNA samples from 611 metabolically characterized nondiabetic CA and AA subjects (5) and 718 subjects from 67 CA T2D pedigrees (4, 10) were used for sequencing and genotyping studies. Sample characteristics were published elsewhere (4, 5, 10, 31). All study participants provided written, informed consent under protocols approved by the University of Arkansas for Medical Sciences. Our current study is approved by the Institutional Review Board of Wake Forest University Health Sciences.
Cell Culture
Allelic expression imbalance was primarily screened in total RNA and genomic DNA isolated from TLs. The TLs from 95 CA and 95 AA from Utah and Arkansas and 95 HapMap II-CEU subjects were grown under normoglycemic (5.6 mM glucose) conditions in RPMI-1640 culture media (Omega Scientific, Tarzana, CA) supplemented with 10% heat-inactivated fetal bovine serum (Omega Scientific), l-glutamine, and antibiotics (31). The cells were grown at 37°C and 5% CO2. Cell growth was monitored by taking cell counts with a Beckman Coulter counter, and all cells were harvested at a density of 0.5–1 × 10⁶ cells/ml. Harvested cell pellets were immediately used for isolation of RNA and DNA.
Isolation of DNA and RNA
Genomic DNA from TLs was isolated by using a Puregene DNA extraction kit (Qiagen, Valencia, CA), and total RNA was extracted with an RNeasy Mini Kit (Qiagen). We also used RNA samples isolated from subcutaneous adipose and skeletal muscle biopsy samples to validate selected gene expression findings. We extracted total RNA from subcutaneous adipose by using an RNeasy Lipid Tissue Mini kit (Qiagen) and from muscle using the Ultraspec RNA kit (Biotecx Laboratories, Houston, TX) (31). The quantity and quality of the isolated nucleic acids were determined by ultraviolet spectrophotometry and electrophoresis, respectively.
cDNA Synthesis
Total RNA (1 μg) was reverse transcribed using Qiagen QuantiTect RT kit (Qiagen) using the manufacturer's protocol, which includes a DNase digestion step to remove genomic DNA (gDNA) contamination. cDNA from TLs were used as template for AEI and total transcript expression analysis. Additional cDNAs were synthesized similarly from adipose and muscle RNA and were used for total transcript expression analysis (31).
Selection of SNP and PSQ Assay Design for AEI Analysis
The T2D linkage peak at chromosome 1q21–24 (chr1:151288172–172711000, build Hg19/GRCh37) includes 412 genes (represented by 755 RefSeq IDs). We searched our in-house genome-wide gene expression data (Agilent 4X44K array, n = 16 TLs and Illumina HT-12 V4 array, n = 160 TLs) (6, 15) and identified 238 expressed genes in this region in TLs. We searched the dbSNP database (v.128) to identify validated transcribed SNPs (cSNP) located in cDNA of expressed genes. We identified 592 cSNPs with minor allele frequency (MAF) ≥0.05 included in 176 genes. Similar to our published studies (35), we designed modified PSQ assays that used a biotin-labeled universal M13-tail primer to evaluate AEI of cSNPs. Initial PCR amplification primers were designed by using Primer 3 software (http://frodo.wi.mit.edu/primer3/), and PSQ assays were designed by SNP Primer Design software (Pyrosequencing, version 1.0.1). We attempted to design PSQ genotyping assays that can perform allele-specific quantitation for a cSNP using same amplification and sequencing primers in both cDNA and gDNA samples. However, AEI analyses for cSNPs located near an exon-intron boundary or in a very short exon necessitated designing separate PSQ assays for cDNA and gDNA. Each of these customized assays was tested for successful amplification and allele-specific quantification using gDNA and cDNA templates. Assays that passed appropriate quality control and optimization were used for further analysis (see Supplementary Table S1 for details of successful assays).1
We first genotyped DNA from 95 CA and 95 AA subjects by using PyroMark Gold Q96 reagents (Qiagene) on a PSQ96 pyrosequencer (Qiagene), according to the manufacturer's instructions. Any cSNPs for which we found >4 individuals with heterozygous genotypes were investigated further. cDNAs from individuals heterozygous for respective cSNPs were then selected and analyzed similarly by PSQ to quantify the expression of both alleles. Additional cDNA samples from major and minor allele homozygotes were included as positive controls. We used a 20 ng cDNA template in each PSQ reaction. We successfully evaluated AEI of 115 cSNP in 115 genes; most (52.2%) were located in 3′-UTR of the gene. cSNPs showing strong AEI (>10%) were also analyzed in cDNA isolated from HapMap-CEU samples for confirmation.
Real-time PCR
Transcripts showing significantly strong AEI (>10% mean difference in allelic expression in both CA and AA samples) were measured by quantitative real-time PCR using SYBR green Master Mix (Applied Biosystems, Foster City, CA) on an ABI 7500 Fast RT-PCR system (Applied Biosystems). We analyzed the effect of genotype on total expression of these transcripts. cDNAs from TLs of 84 CA subjects were used for this analysis. The standard curves were generated by using pooled cDNA from the samples assayed (31). Transcript-specific oligonucleotide primers for real-time PCR were designed to capture most known splice variants (see Supplementary Table S2 for details). Target genes were normalized to 18S ribosomal RNA and ratios were logarithmically transformed and used in all calculations, as described previously (31). We similarly analyzed the expression of a transcript (THEM4) in subcutaneous adipose and skeletal muscle tissue cDNA of 168 metabolically characterized subjects by qRT-PCR.
Identifying Associations of AEI-cSNPs with T2D and Glucose Homeostasis Traits
To investigate whether the cSNPs showing significant AEI in our study were associated with T2D and glucose homeostasis traits, we examined data from large GWAS in CA subjects. We used meta-analyses of association data for T2D from the DIAGRAM (http://diagram-consortium.org/) consortium. We initially used DIAGRAM-V2 meta-analysis data (8,130 cases and 38,987 controls) but finalized our analysis using DIAGRAM-V3 data. Publicly accessible DIAGRAMv3 GWAS meta-analysis (19) includes association summary statistics (risk allele, P value and odds ratio) for 19,285 SNPs in the chr1:151288172–172711000 region from an analysis of 12,171 T2D cases and 56,862 controls across 12 GWAS in populations of European descent. Data for glucose homeostasis traits were taken from the MAGIC dataset (http://www.magicinvestigators.org) (8, 30). In MAGIC, fasting glucose and insulin resistance [homeostatic model assessment-insulin resistance (HOMA-IR)] data sets were generated by performing a meta-analysis of up to 21 GWAS in up to 46,186 nondiabetic CA participants (summary statistics including effect allele, effect size, and P values were available). Two-hour glucose data sets were generated by a meta-analysis of nine GWAS in 15,234 nondiabetic CA individuals.
We further selected trait-associated cSNPs and significant rSNPs to genotype in 611 CA and AA subjects to identify the role of these SNPs in glucose homeostasis (5). Subjects in this cohort was evaluated by insulin modified frequently sampled intravenous glucose tolerance test (FSIVGT) and minimal model analysis to measure insulin sensitivity index (SI) and beta-cell function (acute insulin response to glucose, AIRG) (1). Genomic DNA isolated from TLs or total blood samples was used for genotyping by Sequenom MassARRAY system (Sequenom San Diego, CA) or PSQ (PSQ96 pyrosequencer, Qiagen). Sequenom genotyping (SEQ) procedures were performed according to the manufacturer's iPLEX application guide at the genotyping laboratory of the WFUHS Center for Human Genomics and Personalized Medicine. Details of all selected SNPs and genotyping assays are described in Supplementary Table S3.
Luciferase Reporter Gene Assay
Our strategy for functional evaluation of the SNP rs13320 located in the 3′-UTR of THEM4 gene was similar to that of Innocenti et al. (14). We first cloned a 453 bp region around the SNP. Inserts representing the T and C alleles of rs13320 were generated by PCR amplification of genomic DNA from three individuals homozygous for each allele. The forward and reverse primers used for this amplification were 5′-ATGGTGGGAAACACACAGG-3′ and 5′-GATCCTCGAGGGAGACACACAGAGGGAATG-3′, respectively. The reverse primer included a site for the XhoI restriction enzyme. Purified PCR products were digested with NheI and XhoI restriction enzymes and cloned into the pLightSwitch-3′-UTR vector (Switchgear Genomics, Menlo Park, CA). This vector includes an optimized Renilla luminescent reporter gene (RenSP) whose expression is driven by the RPL10 constitutive promoter. The inserts were cloned into the 3′-end of the RenSP gene in the vector. The ligated vectors were transformed into DH5α Escherichia coli-competent cells, positive clones selected by antibiotic resistance and further confirmed by PCR amplification and restriction digestion of plasmids. Plasmid constructs were verified by DNA sequencing prior to use in transfection.
HEK293 cells maintained in antibiotic-free DMEM supplemented with 6% FBS were used for transient transfection reporter assays. We have selected HEK293 cells for high transfection efficiency and reported (16, 28) endogenous expression of THEM4/carboxy-terminal modulator protein (CTMP). In brief, 25,000 cells were seeded per well in a 96-well cell culture plate before transfection. The next day, used culture medium was replaced with 180 μl fresh DMEM with serum. We prepared a transfection mixture by adding plasmid DNA and CaCl2. We added 20 μl transfection mix, which contains 100 ng plasmid DNA and 1.2 μl of CaCl2 (2 M), in each well. After 24 h, we fed cells with 200 μl of fresh media after removing old media and incubated them for an additional 24 h. At 48 h posttransfection, we removed old media and added 100 μl of fresh media to each well before freezing at −80°C overnight. For luminescence analyses, plates were thawed for 45 min at room temperature, and 100 μl cell lysate was transferred to wells of a white 96-well plate. Then 100 μl of LightSwitch Luciferase assay reagent (LS010, Switchgear Genomics) was added and incubated for 30 min in the dark at room temperature. Luminescence was read for 2 s per well on a 96-well compatible plate luminometer (LUMI Star Optima; BMG Labtech, Ortenberg, Germany). Wells with untransfected cells were used as controls for luminescence background correction. We performed three independent experiments, and each experiment included three to six biological replicates for each allele.
A Student's t-test was performed on normalized luminescence values to compare the effects of the T and C alleles of SNP rs13320. A two-tailed P value of ≤ 0.05 was considered significant.
Sequencing the THEM4 gene and Genotyping in Pedigrees
We sequenced a 1,661 bp region of the THEM4 gene in 96 T2D and 96 nondiabetic CA subjects. We selected 96 T2D subjects from our published genome-wide linkage study, which included members of CA pedigrees from Utah and showed linkage with T2D at chromosome 1q21–24 region (4, 10). Nondiabetic subjects were metabolically characterized by oral glucose tolerance test (OGTT) and FSIVGT. Our sequencing region included all six coding exons, part of 5′-UTR, and part of 3′-UTR around the SNP rs13320 to identify functional variants in the THEM4 gene. Sequencing was performed by a two-step “boost/nest” PCR strategy. Seven different nested PCR products (see Supplementary Table S4a for sequencing primer details) were sequenced by utilizing BigDye Terminator 3.1 kits using the ABI 3730XL DNA sequencers. Data were analyzed by a customized version of Automated GENotyping Tool (AGENT) software by Paracel, which utilizes advanced TraceTuner MX base calling and quality value assignment algorithms to identify polymorphisms and assign genotypes. To ensure accuracy and sensitivity, only data from the high-resolution, high-quality region of the DNA sequencing runs were used. SNPs were called only when confirmed on both strands. Sequencing and data analyses were performed by Polymorphic DNA Technologies (Alameda, CA).
We further genotyped two less-common (MAF < 0.05) coding-nonsynonymous variants (observed in T2D subjects of our sequencing experiment) in 718 subjects from 67 CA pedigrees (4, 10). SNPs were genotyped by pyrosequencing as described above (see Supplementary Table S4b for genotyping assay details).
Data Analysis
AEI data analysis.
Allele-specific quantification of both cDNA and gDNA samples were determined from pyrogram peak heights with PyroMarkID V1 software (Qiagene). Ratios observed between two alleles of a SNP in a heterozygous subject were assay specific and may deviate from the expected ratio of 1 (50:50) due to uneven amplification of alleles unrelated to uneven transcription. We normalized our allele-specific expression data by the methods of Fogarty et al. (11). In brief, we normalized the observed gDNA or cDNA %B/%b ratio (B and b are two alleles of a cSNP) by dividing it by the mean %B/%b ratio of gDNA from individuals heterozygous for the cSNP. The normalized %B allele (%Bn) was used in all AEI tests. In each test, we compared the %Bn allele in gDNA to the %Bn allele in cDNA in samples heterozygous for the cSNP. We used paired sample t-tests (2-sided) and Wilcoxon signed-rank tests (nonparametric) for statistical evaluation. A nominal P < 0.05 was considered as a statistically significant difference.
Evaluation of 15 cSNPs was performed by using separate assays for gDNA and cDNA. We performed normalization of allele-specific expression for these SNPs by constructing a standard curve, mixing purified PCR products from minor and major allele homozygous samples in known ratios. Similar to our published protocol (35), we used mixed samples of five B/b ratios: 80:20, 60:40, 50:50, 40:60, and 20:80 in duplicates as known standards. We used linear regression to fit a standard curve using observed and expected values of these standard samples, and the %B alleles of each unknown sample were interpolated from the standard curve. Further data analysis using %B data was performed as described above.
The AEI can be directly tested only at the transcribed or cSNP. However, the pattern of AEI observed at the cSNP can be influenced by a regulatory SNP (rSNP). We hypothesized that patterns of AEI observed at tested cSNPs would depend on linkage disequilibriums with a trait-associated rSNP. In some tested cSNPs, we observed significant and unidirectional AEI (that is, all heterozygous subjects showed AEI in the same allelic direction). We searched association of these cSNPs (or a SNP in strong linkage disequilibrium at r2 > 0.8 located within ± 500 kb of the cSNP) with T2D and glucose homeostasis traits. A set of cSNPs showed large variations in allele-specific expression (>15% standard deviation in %Bn gDNA − %Bn cDNA in heterozygous subjects) in heterozygotes. To understand the possible causes of this result, we measured allele-specific expression in cDNA isolated from TLs for 95 HapMap-CEU subjects. Utilizing publicly available genotype data of these subjects, we further investigated whether trait-associated rSNPs in linkage disequilibrium with these cSNPs may account for the observed variance in allelic expression. As suggested by Fogerty et al. (2010), depending on the linkage disequilibrium relationship between cSNPs and rSNPs, we used either two-sided t-tests (comparing %Bn in cDNA of subjects homozygous vs. heterozygous at rSNP) or one-sided F-tests (comparing variance of %Bn in subjects heterozygous for rSNP vs. subjects homozygous for rSNP) (11).
Genotypic association.
Genotypic effects on glucose homeostasis traits (SI and AIRG) were tested by univariate analysis of variance using general linear regression models (GLM) implemented in SPSS v.12 for Windows (SPSS, Chicago, IL). Age, body mass index (BMI), sex, ethnicity, genotype, and protocol (tolbutamide or insulin) were included as fixed factors and covariates, as appropriate (9). Skewed variables were ln-transformed to normality before analyses. Genotypic effects on total transcript expressions in adipose and muscle were tested similarly using GLM with age, BMI, sex, ethnicity, and genotype included as fixed factors and covariates, as appropriate.
Family-based associations with T2D were tested in 67 families using a modification of the transmission disequilibrium test, as implemented in the Pedigree Analysis Package (jPAP, http://hasstedt.genetics.utah.edu/jpap/). The minor allele was tested for overtransmission to T2D cases with a one degree of freedom mixture χ2.
RESULTS
Genes in Chromosome 1q21–24 Region Shows AEI
Among cSNPs studied in 115 genes, we observed significant AEI (P < 0.001, Wilcoxon signed-rank test) in 28 genes among TL cDNA of CA subjects and in 30 genes among AA subjects (Supplementary Table S5). Among 109 genes studied in both CA and AA subjects, 12 showed significant AEI (at P < 0.001) in both populations. Six genes in our study showed strong allelic expression imbalance (>10% mean difference in expression of an allele in cDNA compared with gDNA) in both CA and AA populations at a nominal significance level of P < 0.05 (Table 1). These six genes were THEM4, IGSF8 (immunoglobulin superfamily, member 8), IVL (involucrin), FCRL3 (Fc receptor-like 3), XCL1 (chemokine C motif ligand 1), and TMCO1 (transmembrane and coiled-coil domains 1). The AEI analysis of a 3′-UTR SNP rs13320 in THEM4 showed significant (P = 1.68 × 10⁻⁷) overexpression of the T allele in cDNA, while a 3′-UTR SNP rs6660601 in TMCO1 showed significant (P = 6.55 × 10⁻⁴) underexpression of the C allele in cDNA (Fig. 2).
Table 1.
Selected chromosome 1q21-24 region SNPs showing high AEI in transformed lymphoblastoid cell cDNA of Caucasian and African-American subjects
| Caucasian |
African American |
|||||||
|---|---|---|---|---|---|---|---|---|
| Gene | SNP | Allele | n | Mean PD | P Value | n | Mean PD, % | P Value |
| THEM4 | rs13320 | T | 36 | −20.96% | 1.68E-07 | 43 | −26.57 | 1.12E-08 |
| IGSF8 | rs1131891 | C | 20 | −14.09% | 8.86E-05 | 10 | −11.64 | 0.005 |
| IVL | rs913996 | C | 14 | 10.80% | 0.022 | 35 | 11.65 | 7.77E-06 |
| FCRL3 | rs2282283 | T | 20 | 14.35% | 0.011 | 46 | 11.66 | 1.23E-04 |
| XCL1 | rs982143 | A | 15 | 18.80% | 0.008 | 18 | 14.22 | 0.004 |
| TMCO1 | rs6660601 | C | 15 | 35.95% | 6.55E-04 | 14 | 30.02 | 9.82E-04 |
P value, asymptotic significance (2-tailed)-Wilcoxon signed-rank test; n, number of heterozygotes tested; Mean PD, mean paired difference between % of an allele present in genomic DNA (gDNA) compared with the cDNA (in %B gDNA-%B cDNA). Negative value of mean PD indicates higher expression; positive value indicates lower expression of tested allele in cDNA. Detailed results of all 115 tested transcribed single nucleotide polymorphism (cSNPs) are shown in Supplementary Table S5. AEI, allelic expression imbalance.
Fig. 2.

SNPs in chromosome 1q21–24 region shows high allelic expression imbalance in transformed lymphocyte cDNA compared with genomic DNA of heterozygote subjects. Data from Caucasian, African American, and HapMap-CEU subjects are shown. Normalized percent expression of one allele (%Bn) calculated from pyrosequencing data is shown on the y-axis. Each dot in scatter plot represents a heterozygous subject.
We further tested the effect of genotype of these six SNPs on total transcript expression in TLs. In concordance with the AEI results, we found significantly higher expression of the THEM4 gene in T/T homozygotes for SNP rs13320 compared with T/C and C/C subjects (P = 0.027). Individuals with a C/C genotype for SNP rs1131891 also showed significantly higher expression of the IGSF8 gene compared with TC and TT subjects (P = 0.02) (Fig. 3). However, we observed no significant association of cSNP genotype with total expression of IVL, XCL1, and TMCO1. We also searched publicly available eQTL datasets (in Genevar database, http://www.sanger.ac.uk/resources/software/genevar/) and found that some AEI-cSNPs also may affect total gene expression as cis-regulators (Supplementary Table S6). Irrespective of the data source, rs13320 in THEM4 was identified as a strong cis-eSNP.
Fig. 3.

Genotypic association of AEI-cSNPs with total gene expression in TLs. Box plots show transcript-level total expression of genes for different genotypes. Gene expression is shown after 18S normalization and ln transformation. N = no. of samples. The box represents the interquartile range, which contains 50% of the values. The whiskers are lines that extend the box to the highest and lowest values, excluding outliers. A line across the box indicates the median.
SNPs Showing AEI are Associated With T2D and Glucose Homeostasis Traits
To identify associations of AEI cSNPs with T2D, we utilized meta-analysis of GWAS in CA populations by the DIAGRAM consortium. In the DIAGRAM-V3 dataset, association results for 19,285 SNPs were available for the chromosome 1q21–24 linkage peak region (between SNP rs1056847 and rs859637). In this region, we identified 60 cSNPs that showed nominally significant AEI (P ≤ 0.05) in CA subjects. We tested associations of 55 of these cSNPs with T2D directly (for 38 cSNP) or by a proxy SNP in strong linkage disequilibrium (r2 ≥ 0.8) with tested cSNP (includes a total of 926 SNPs). At the significance threshold of P ≤ 0.01, we found associations of cSNP rs7345 [in SNAPIN, P = 0.00061, odds ratio (OR) = 1.06, 95% confidence interval (CI) of OR for risk allele T = 1.02–1.09] and rs3813609 (in ARHGAP30, P = 0.0071, OR = 1.05, 95% CI of OR for risk allele C = 1.01–1.09) with T2D. A cSNP in SLAMF8 (rs7418910) also showed marginal association with T2D (P = 0.016) (Table 2).
Table 2.
Association of AEI cSNPs with T2D and glucose homeostasis traits in GWAS
| AEI |
DIAGRAM-v3 T2D-GWAS |
|||||||||
|---|---|---|---|---|---|---|---|---|---|---|
| Gene | cSNP | n | Allele-B | Mean PD, % | P Value* | Risk | Other | P value | OR (95% CI) | |
| SNAPIN | rs7345 | 40 | G | −1.7 | 2.17E-04 | T | G | 6.10E-04 | 1.06 (1.02–1.09) | |
| SLAMF8 | rs7418910 | 14 | C | −7.2 | 0.035 | T | C | 0.016 | 1.06 (1.01–1.11) | |
| ARHGAP30 | rs3813609 | 40 | G | 1.2 | 0.014 | C | G | 0.007 | 1.05 (1.01–1.09) | |
| MAGIC-glucose homeostasis traits GWAS |
||||||||||
|---|---|---|---|---|---|---|---|---|---|---|
| Effect | Other | P Value | Effect Size | Trait | ||||||
| CREB3L4 | rs11264743 | 42 | A (or T) | −4.0 | 2.31E-04 | T | C | 0.0059 | 0.011 | fasting glucose |
| GATAD2B | rs6700115 | 31 | T (or A) | −1.7 | 0.048 | A | G | 0.0014 | −0.012 | fasting glucose |
| PPOX | rs2301286 | 37 | T (or A) | 9.9 | 4.51E-06 | A | C | 8.4E-05 | −0.013 | HOMA-B |
| A | C | 0.0057 | −0.011 | fasting insulin | ||||||
| A | C | 0.0082 | 0.01 | fasting glucose | ||||||
| SNAPIN | rs7345 | 40 | G | −1.7 | 2.17E-04 | T | G | 0.0058 | 0.011 | HOMA-IR |
| T | G | 0.0066 | 0.01 | fasting insulin | ||||||
| THEM4 | rs13320 | 36 | T | −21.0 | 1.68E-07 | T | C | 1.35E-04 | 0.073 | 2 h glucose |
| ZNF687 | rs3748545 | 11 | T (or A) | 21.7 | 0.003 | A | G | 0.0092 | −0.013 | HOMA-B |
P value, Asymptotic significance (2-tailed)-Wilcoxon signed-rank test in Caucasian subjects; n, number of heterozygotes tested; Mean PD, mean paired difference between % of an allele present in gDNA compared to cDNA (in %Allele B gDNA-%Allele B cDNA). Mean PD value is shown for allele in Allele-B column [allele if genotyped in other strand is shown within parenthesis for some cases to compare with genome-wide association study (GWAS) genotype]. T2D, Type 2 diabetes.
Using the MAGIC dataset, we tested associations of 57 of these AEI-cSNPs with glucose homeostasis traits, either directly (for 49 cSNP) or by a proxy SNP in strong linkage disequilibrium (r2 ≥ 0.8) with tested cSNPs (includes a total of 1,022 SNPs). In the MAGIC dataset, the A allele of AEI-cSNP rs2301286 in the POPX gene was significantly associated with increased fasting glucose (P = 0.0082), decreased fasting insulin (P = 0.0057), and decreased HOMA-B (P = 8.35 × 10⁻⁵). An AEI-cSNP in SNAPIN (rs7345) that showed association with T2D in the DIAGRAM dataset also showed significant association with increased HOMA-IR (P = 0.0058) and fasting insulin (P = 0.0066). Among the cSNPs that showed strong AEI, rs13320 in THEM4 showed association with 2 h glucose values in the MAGIC dataset (Table 2). The T allele for this SNP showed increased expression and was associated with increases in 2 h glucose values during OGTT (P = 1.35 × 10⁻⁴).
Three cSNPs (rs982143, rs2282283 and rs913996) showed high variations in allelic expression (SD > 10%). Thus, despite strong AEI (mean gDNA-cDNA %B is >10%), these SNPs reached marginal significance (P > 0.001) in CA. We hypothesized that this pattern of AEI is caused by rSNPs in linkage disequilibrium with the tested cSNP. We considered any T2D-associated SNPs within ± 500 kb of the tested cSNPs as rSNPs. We measured allele-specific expression in cDNA from TLs of HapMap-CEU subjects heterozygous for these SNPs. Utilizing DIAGRAM-V2 GWAS data, we identified the closest T2D-associated SNP and the most significantly T2D-associated SNP within ± 500 kb of these cSNPs. Depending on the linkage disequilibrium relationship between rSNP and the tested cSNP in HapMap-CEU genotype data, we implemented statistical tests to evaluate the role of genotype at rSNP in modulating AEI patterns at cSNPs. The strongest T2D-associated SNP within ± 500 kb of the FCRL3 cSNP rs2282283 is rs12123141 (P = 0.0036, OR = 0.84 in DIAGRAM-V2 dataset), which is located at a distance of ∼22.4 Kb and shows low linkage disequilibrium (r2 = 0.023 and D′ = 1). Genotypes of the SNP rs12123141 were unable to explain the variation in allelic expression observed at rs2282283. However, among the T2D-associated SNPs, rs3811024 (P = 0.049 in DIAGRAM-V2 dataset) shows the strongest linkage disequilibrium with cSNP rs2282283 (r2 = 0.479 and D′ = 0.803). The cDNA t-test showed that, compared with homozygotes, HapMap-CEU subjects heterozygous for rs3811024 had significantly lower expression of the T allele of cSNP rs2282283 (P = 8.9 × 10⁻⁵, Fig. 4). Thus, the T2D-associated SNP rs3811024 may act as an rSNP to modulate the allele-specific expression of the FCRL3 gene and may explain the variation in allelic expression observed at cSNP rs2282283. However, the association of T2D with rs3811024 was marginal in the DIAGRAM-V2 dataset and was not significant in the larger DIAGRAM-V3 dataset. We found no T2D-associated rSNP that explained variation in allelic expression observed at other two tested cSNPs (rs982143 in XCL1 and rs913996 in IVL).
Fig. 4.

T2D-associated regulatory SNP (rs3881024) near FCRL3 gene modulates allelic expression at transcribed tested SNP (rs2282283). Shown on the x-axis are genotypes of the rSNP rs3881024 for individuals heterozygous for cSNP rs2282283. The y-axis shows normalized quantity of tested cSNP allele in % (%Bn).
Association of AEI cSNPs with FSIVGT-derived Glucose Homeostasis Phenotypes in Nondiabetic Subjects
We genotyped eight SNPs in a cohort of 611 metabolically characterized CA and AA nondiabetic subjects. We selected two cSNPs with very strong unidirectional AEI (rs13320 in THEM4 and rs6660601 in TMCO1). Additionally, we selected cSNPs for rs7345 (SNAPIN), rs7418910 (SLAMF8), rs2301286 (PPOX), rs2282283 (FCRL3 and rSNP rs3811024), and rs3813609 (ARHGAP30), which showed significant AEI in CA and significant associations with T2D or glucose homeostasis traits in the DIAGRAM and MAGIC datasets, respectively. No SNPs showed significant associations with SI in our cohort. Among the tested SNPs, only rs13320 (in THEM4) showed a significant association with AIRG. In the CA subset of our cohort, individuals with a TT genotype (estimated marginal mean of AIRG = 1,851 ± 6, n = 163) showed significantly lower AIRG compared with TC or CC genotypes (AIRG = 2,236 ± 6, n = 246) (P = 0.021). Associations of the rs13320 genotype with AIRG also remained significant in the combined CA and AA cohort (P = 0.005).
3′-UTR SNP rs13320 is a Functional Regulator of the THEM4 Gene.
Utilizing cDNA from TLs, we identified strong AEI in THEM4 gene as detected at SNP rs13320. A study by Maira et al. (16) identified that THEM4 (also known as CTMP) is a negative regulator of protein kinase B/Akt phosphorylation and thus may play a critical role in insulin-induced glucose metabolism. Thus, we further analyzed the association of rs13320 genotype with total THEM4 mRNA expression in subcutaneous adipose and skeletal muscle of human subjects. We found a significant association of rs13320 genotype with THEM4 expression in adipose tissue (P = 0.005, n = 142) but not in the muscle (P > 0.05, n = 145). In adipose, individuals with TT or TC genotype showed significantly higher expression of THEM4 compared with individuals with CC genotype (Fig. 5).
Fig. 5.

Association of rs13320 with expression of THEM4 in tissues relevant for glucose homeostasis. Box plots show transcript-level total expression of THEM4 in adipose and muscle of individuals with different genotypes. Gene expression is shown after 18S normalization and ln transformation. N = no. of samples. The box represents the interquartile range, which contains 50% of the values. A line across the box indicates the median. The whiskers are lines that extend the box to the highest and lowest values, excluding outliers (shown as open circles).
We subsequently sought experimental evidence for the functional nature of the SNP rs13320. We identified that luciferase reporter constructs of the 453 bp region around rs13320 modulate reporter activity (luminescence). Constructs with the T allele had significantly higher reporter activity (∼30%, P = 7.15 × 10⁻⁷) compared with constructs with the C allele of rs13320 (Fig. 6). This effect was in the same direction as the AEI and total expression measurements in TL and adipose tissue.
Fig. 6.

An in vitro analysis with 3′-UTR luciferase construct confirmed the higher expression of T allele of rs13320. Luciferase assays were performed by transfecting HEK-293 cells with 3′-UTR constructs (A). Normalized luminescence data of both alleles are shown as average and standard deviation (B) of 3 independent experiments (each experiment includes 3–6 biological replicates for each allele). RLU, relative light units.
In silico analysis of transcription factor binding in and around rs13320 by Matinspector (http://www.genomatix.de/online_help/help_matinspector/matinspector_help.html) showed binding of MYBL on allele C, whereas binding of SOX5 was observed on the T allele. We searched the Encyclopedia of DNA Elements (ENCODE) Consortium and Roadmap Epigenome Mapping Consortium data to identify additional functional role of SNP rs13320. A search using RegulomeDB (http://regulome.stanford.edu/) identified “minimal binding evidence” (score 6) for this SNP. Similarly, a search using HaploReg-V2 tool (http://www.broadinstitute.org/mammals/haploreg/haploreg.php) was unable to identify additional regulatory role of this SNP. Interestingly, a search for the effect of this SNP on microRNA target binding (http://www.bioguo.org/miRNASNP/) showed that the rs13320 G allele in THEM4 mRNA is recognized by hsa-miR-101, while the A allele may cause a loss in miRNA binding (indicated by an energy change from −16.80 kcal/mol to −13.10 kcal/mol).
Search for Other Functional Variants in THEM4
Sequencing of coding exons and the UTR in 192 subjects identified 11 variants, including six coding variants, in THEM4 (Table 3). Among the identified SNPs, three are novel (not in dbSNPv137). None of the identified variants shows significant linkage disequilibrium (r2 < 0.2) with the 3′-UTR SNP rs13320. All coding nonsynonymous variants were present in nondiabetic subjects of our sequencing cohort and unlikely to be functional variants with high penetrance. We genotyped two rare (MAF < 0.05) coding nonsynonymous variants in 718 subjects from 67 CA T2D pedigrees. The coding variant S72P (rs144757240) was present in nine subjects of a pedigree, while the coding variant S38C (rs144257719) was present in 27 subjects from six pedigrees. We observed only heterozygotes for these coding variants that did not explain transmission of T2D in pedigrees (rs144757240, transmission probability = 66.10, P = 0.216 and rs144257719, transmission probability = 61.78, P = 0.302).
Table 3.
Variants identified in exons and UTRs of THEM4 from sequencing of 96 T2D and 96 nondiabetic subjects
| SNP | Position (hg19/NCBI 37) | Gene Location | Annotation | MAF | Alleles (Major: Minor) | Case, Control Ratio Counts |
|---|---|---|---|---|---|---|
| rs74997792 | 151846267 | 3′-UTR | 0.018 | A:G | 186:4, 189:3 | |
| Novel-151846450 | 151846450 | 3′-UTR | 0.003 | T:G | 189:1,192:0 | |
| rs13320 | 151846517 | 3′-UTR | 0.382 | A:G | 118:72, 118:74 | |
| rs4845385 | 151846719 | 3′-UTR | 0.089 | C:T | 174:16, 174:18 | |
| rs114800758 | 151867528 | exon-2 | coding, nonsynon. (242G>A, 81R>H) | 0.005 | G:A | 190:0, 190:2 |
| rs144757240 | 151867556 | exon-2 | coding, nonsynon. (214T>C, 72S>P) | 0.005 | T:C | 189:1, 191:1 |
| rs77308366 | 151867560 | exon-2 | coding, synon. (210C>T, 70D>D) | 0.099 | T:C | 173:17, 171:21 |
| rs144257719 | 151867657 | exon-2 | coding, nonsynon. (113C>G, 38S>C) | 0.016 | C:G | 186:4, 190:2 |
| Novel-151881871 | 151881871 | exon-1 | coding, synon. (64C>A, 22R>R) | 0.005 | C:A | 186:2, 192:0 |
| rs3748805 | 151881885 | exon-1 | coding, nonsynon. (50T>G, 17L>R) | 0.1 | G:T | 171:17, 171:21 |
| Novel-151881986 | 151881986 | 5′-UTR | 0.003 | G:A | 187:1, 192:0 |
Novel, not in dbSNPv137 as presented in “All SNPs(137)” track of UCSC genome browser; UTR, untranslated region; MAF, minor allele frequency.
DISCUSSION
Genomic regions representing replicated linkage signals are likely to be driven by causal variants. Thus, our search for regulatory variants within the chromosome 1q21–24 region utilizing AEI analysis is a reasonable approach to prioritize and identify functional genetic susceptibility variants for T2D. In our study, AEI analysis by PSQ identified cis-regulatory polymorphisms for 28 of 115 genes (24.3%, P < 0.001) in CA subjects. This proportion is comparable with that reported in previously published studies. Genome-wide surveys in TLs from 53 Hapmap-CEU subjects utilizing hybridization-based methods (on Illumina Human1M BeadChips) identified AEI in 30% of the 9,751 tested genes (12). This study used both exonic and intronic SNPs of unspliced primary transcripts (heteronuclear RNA) and reported 13 high-confidence full-transcript AEI in the chromosome 1q21–24 region we studied (12). Our study replicated (P < 0.05) AEI in four of these transcripts, including FCRL3, CD244, NDUFS2, and TMCO1. We have not tested AEI in non-RefSeq transcripts; because of technical differences, we could not replicate AEI in genes that were detected by intronic regulatory SNPs.
A recent study successfully used AEI analysis to identify genes influenced by cis-acting regulatory SNPs and to prioritize functional gene candidates for high-density lipoprotein cholesterol from a GWAS locus (11). The goal of our study was to prioritize T2D susceptibility genes in the chromosome 1q21–24 region via AEI analysis. Successful AEI experiments require that genes in the tested region are expressed in an available tissue “relevant” to the associated trait. Current understanding of T2D pathophysiology indicates a complex interplay of different tissues (including pancreas, adipose, muscle, liver, brain, and intestine) and cell types within each tissue (e.g., adipocytes, macrophages, and T cells in adipose). Recent studies have shown diverse and distinct roles of the TCF7L2 gene (the gene showing the strongest genetic association with T2D susceptibility) in tissues other than pancreatic β-cells (17, 21). Thus, selecting a relevant tissue for each gene in the region based on available experimental evidence or bioinformatics will be difficult. We selected expressed genes from available genome-wide expression array data and used RNA from transformed lymphocytes to identify AEI. A limitation of our study is the lack of RNA from different tissues of human subjects for AEI analysis.
One major requirement to test AEI is that a gene contains at least one common transcribed SNP, so that sufficient heterozygous samples are available for analysis. In this study we selected common transcribed SNPs (MAF > 0.05) to obtain at least >4 heterozygous individuals in our CA or AA DNA samples. AEI can be studied for intronic regulatory SNPs using hnRNA as a template (26). However, because of technical limitations of our method, we selected transcribed SNPs that are present in mature (spliced) mRNA. Most published studies have used BigDye Terminator-based normalized sequencing methods or Taqman allelic discrimination assays to evaluate allele-specific expression (11, 27). The PSQ methods used in our study were optimized and validated for AEI analysis by our laboratory and represent a more sensitive and comparatively high-throughput method (35). Recently developed technologies based on cDNA sequencing by second-generation sequencing methods (RNA-Seq) provide an in-depth and high-throughput detection of allele-specific expression. However, sensitivity of RNA-Seq in AEI analysis depends on numbers of sequence read coverage (18, 7) and is currently an expensive method.
Comparisons of allelic expression in our study showed a strong correlation (r = 0.81) in the degree of AEI and the direction of allelic expression in CA and AA. We identified 12 loci that showed significant AEI in both CA and AA (P < 0.001, Wilcoxon signed-rank test). Among SNPs showing high allelic expression imbalance (>10% mean % difference gDNA-cDNA), only rs2241108 (in SLC25A44) showed higher expression of “G” allele (11.08 ± 5.18%, P = 1.11 × 10E-09) in cDNA from AA subjects, while in CA subjects it showed marginally lower expression (1.91 ± 4.59%). cSNPs in PRUNE (rs11204762) and IL6R (rs2229238) showed similarity in the direction of allelic expression in both populations but did not reach statistical significance in either AA or in CA samples, respectively. Differences in regional linkage disequilibrium (between tested cSNPs and untested rSNPs) may cause these differences in allelic expression among populations.
Expression of genes at the transcript level is a complex biochemical quantitative trait and is influenced by a combination of cis- and trans-acting genetic variations, epigenetic factors, and environmental and other nongenetic factors. Allelic expression imbalance analysis compares allelic expression within individuals (in heterozygotes) and, in principle, eliminates the effect of trans-acting and nongenetic factors. Thus, compared with total transcript-based analysis (performed across individuals), the AEI analysis provides higher sensitivity to uncover cis-regulatory elements (26). Thus, cSNPs showing AEI as well as genotypic associations with total transcript expression (e.g., rs13320 in THEM4) may represent a strong cis-regulatory element. Genes that showed AEI but not genotypic associations with total gene expression in our study (or in publicly available cis-eQTL data) are possibly under control of stronger trans-regulatory or nongenetic factors.
Meta-analyses of large genome-wide studies in the DIAGRAM dataset failed to identify any T2D susceptibility loci in the chromosome 1q21–24 region that reached a genome-wide significance level (P < 5 × 10⁻⁸) (19). Similar meta-analyses of glucose homeostasis traits by MAGIC also found no loci of genome-wide significance in this region(8, 30). Among the cSNPs showing significant AEI in CA samples in our cohort, the SNP rs7345 in SNAP-associated protein (SNAPIN) gene showed the strongest association with T2D (P = 6.1 × 10⁻⁴, OR = 1.06) in the DIAGRAM-V3 dataset. SNP rs7345 exhibits significant but minor AEI. As part of the SNARE complex, the SNAPIN gene is required for vesicle docking and fusion and regulates neurotransmitter release (13). The existing literature does not describe its possible role in altering glucose homeostasis or T2D pathogenesis. A similar search in the MAGIC dataset for glucose homeostasis traits identified the strongest association of AEI cSNP rs2301286 in the protoporphyrinogen oxidase (PPOX) gene with HOMA-B. The A allele of this SNP shows moderately low expression compared with the C allele and is also associated with decreased HOMA-B (P = 8.4 × 10⁻⁵, β = −0.013). The PPOX enzyme is located in the inner membrane of mitochondria from various tissues and is involved in the heme biosynthetic pathway (34). No direct evidence exists to support a role for the PPOX gene in T2D pathogenesis. However, recent studies indicate that altered iron metabolism may be a factor in T2D pathogenesis, and involvement of PPOX in iron metabolism may support it as a candidate gene (32).
The SNP rs13320 in the 3′-UTR of THEM4 (or CTMP) gene showed the strongest AEI in our study. Interestingly, the T allele of this SNP showed significantly high expression compared with the C allele and was associated with increased 2 h glucose values (P = 1.35 × 10⁻⁴, β =0.073) in the MAGIC dataset. In a cohort of 611 nondiabetic subjects from Arkansas, this SNP also showed significant associations with an FSIVGT-derived index of beta cell function. Individuals with the TT genotype showed significantly low AIRG. However, this SNP was not associated with T2D in DIAGRAM-v3 [P = 0.67, OR = 1.01 (95% CI = 0.97–1.04), case n = 12,171, control n = 56,862] or AA [P = 0.70, OR = 1.02 (95% CI = 0.9–1.16), case n = 966, control n = 1,029] GWAS (19, 23). Higher expression of the T allele was confirmed in publicly available lymphoblastoid cell eQTL data (Supplementary Table S7), in adipose tissue of nondiabetic subjects from our study and by luciferase reporter assay. Thus, SNP rs13320 may act as a strong cis-regulator of the THEM4 gene and modulate its expression at transcript level. Alternatively, based on in silico analysis, SNP rs13320 alters the binding of microRNA (hsa-miR-101) and may modulate THEM4 expression posttranscriptionally. Further functional studies will be required to elucidate the complex mechanism involved in modulating THEM4 expression and altered glucose homeostasis.
The THEM4 gene was first described as CTMP and was shown as a negative regulator of Akt/protein kinase B-α (PKB) (16). Akt phosphorylation plays a major role in insulin-stimulated glucose uptake; thus, the THEM4 gene can be considered as a strong candidate for T2D pathogenesis. Since binding of CTMP to Akt reduces its activity by inhibiting phosphorylation on Ser473 and Thr308 (16), higher CTMP/THEM4 expression may cause insulin resistance. Studies by Zhou et al. (38, 39) show that the expression of CTMP is increased by fatty acid, tumor necrosis factor-α, or in mice with diet-induced obesity. Genetic data from our study indicate the association of a high-expressing allele of THEM4 with increased 2 h glucose values and low AIRG, which parallels the proposed role of this gene from the in vitro study by Maira et al. (16). A study by Zhao et al. (36) demonstrates direct CTMP-Akt1 binding by immunoprecipitation and by inhibition of Akt1 kinase activity, thus providing independent evidence that CTMP is an Akt1 negative regulator. However, a study by Ono et al. (22) indicates that CTMP also can act as activator of Akt phosphorylation under certain experimental conditions. Nonetheless, both studies indicate the involvement of CTMP in Akt activity and downstream response. Further studies will be required to confirm the role of CTMP in modulating Akt function at the organismal or tissue-specific level.
Several studies indicated that CTMP has a major function in mitochondria-mediated apoptosis via inhibition of PKB (24, 25, 28). Interestingly, studies by Zhao et al. (37) demonstrate that in vitro, the CTMP protein exhibits highly efficient thioesterase activity. The CTMP/THEM4 catalyzes the hydrolysis of acyl-CoA thioesters to release free fatty acids. Together, these studies provide support for multiple functions of THEM4 protein. Further functional studies will be required to understand the regulatory mechanisms involved in modulating THEM4 expression in different tissues and its connection with altered glucose homeostasis and T2D pathogenesis.
In summary, our AEI analysis identified several regulatory variants in the chromosome 1q21–24 region of T2D linkage. A strong regulatory variant in this genomic region regulates expression of the THEM4 gene and may increase susceptibility to T2D predisposition by modulating glucose homeostasis.
GRANTS
This work was supported by National Institutes of Health (NIH) Grant R01 DK-039311. Clinical studies were supported by NIH General Clinical Research Center Grant M01RR-14288 to the University of Arkansas for Medical Sciences.
DISCLOSURES
No conflicts of interest, financial or otherwise, are declared by the author(s).
AUTHOR CONTRIBUTIONS
Author contributions: A.K.M., N.K.S., S.C.E., and S.K.D. performed experiments; A.K.M., N.K.S., S.C.E., and S.K.D. analyzed data; A.K.M., N.K.S., S.C.E., and S.K.D. interpreted results of experiments; A.K.M. and S.K.D. prepared figures; A.K.M. and S.K.D. drafted manuscript; A.K.M., N.K.S., and S.K.D. edited and revised manuscript; A.K.M., N.K.S., and S.K.D. approved final version of manuscript; S.C.E. and S.K.D. conception and design of research.
Supplementary Material
ACKNOWLEDGMENTS
The authors are grateful to DIAGRAM, MAGIC, and HapMap Project investigators for generously making genetic association and genotype data publicly available. We thank Dr. Sandra J Hasstedt (University of Utah) for performing family-based association analysis. We also thank Karen Klein (Office of Research, Wake Forest University Health Sciences) for critical reading and editing of our manuscript.
Footnotes
The online version of this article contains supplemental material.
REFERENCES
- 1. Boston RC, Stefanovski D, Moate PJ, Sumner AE, Watanabe RM, Bergman RN. MINMOD Millennium: a computer program to calculate glucose effectiveness and insulin sensitivity from the frequently sampled intravenous glucose tolerance test. Diabetes Technol Ther 5: 1003–1015, 2003 [DOI] [PubMed] [Google Scholar]
- 2. Das SK, Elbein SC. The genetic basis of type 2 diabetes. Cellscience 2: 100–131, 2006 [DOI] [PMC free article] [PubMed] [Google Scholar]
- 3. Das SK, Elbein SC. The search for type 2 diabetes susceptibility loci: the chromosome 1q story. Curr Diab Rep 7: 154–164, 2007 [DOI] [PubMed] [Google Scholar]
- 4. Das SK, Hasstedt SJ, Zhang Z, Elbein SC. Linkage and association mapping of a chromosome 1q21-q24 type 2 diabetes susceptibility locus in northern European Caucasians. Diabetes 53: 492–499, 2004 [DOI] [PubMed] [Google Scholar]
- 5. Das SK, Sharma NK, Elbein SC. Analysis of osteocalcin as a candidate gene for type 2 diabetes (T2D) and intermediate traits in Caucasians and African Americans. Dis Markers 28: 281–286, 2010 [DOI] [PMC free article] [PubMed] [Google Scholar]
- 6. Das SK, Sharma NK, Hasstedt SJ, Mondal AK, Ma L, Langberg KA, Elbein SC. An integrative genomics approach identifies activation of thioredoxin/thioredoxin reductase-1-mediated oxidative stress defense pathway and inhibition of angiogenesis in obese nondiabetic human subjects. J Clin Endocrinol Metab 96: E1308–E1313, 2011 [DOI] [PMC free article] [PubMed] [Google Scholar]
- 7. Degner JF, Marioni JC, Pai AA, Pickrell JK, Nkadori E, Gilad Y, Pritchard JK. Effect of read-mapping biases on detecting allele-specific expression from RNA-sequencing data. Bioinformatics 25: 3207–3212, 2009 [DOI] [PMC free article] [PubMed] [Google Scholar]
- 8. Dupuis J, Langenberg C, Prokopenko I, Saxena R, Soranzo N, Jackson AU, Wheeler E, Glazer NL, Bouatia-Naji N, Gloyn AL, Lindgren CM, Magi R, Morris AP, Randall J, Johnson T, Elliott P, Rybin D, Thorleifsson G, Steinthorsdottir V, Henneman P, Grallert H, Dehghan A, Hottenga JJ, Franklin CS, Navarro P, Song K, Goel A, Perry JR, Egan JM, Lajunen T, Grarup N, Sparso T, Doney A, Voight BF, Stringham HM, Li M, Kanoni S, Shrader P, Cavalcanti-Proenca C, Kumari M, Qi L, Timpson NJ, Gieger C, Zabena C, Rocheleau G, Ingelsson E, An P, O'Connell J, Luan J, Elliott A, McCarroll SA, Payne F, Roccasecca RM, Pattou F, Sethupathy P, Ardlie K, Ariyurek Y, Balkau B, Barter P, Beilby JP, Ben Shlomo Y, Benediktsson R, Bennett AJ, Bergmann S, Bochud M, Boerwinkle E, Bonnefond A, Bonnycastle LL, Borch-Johnsen K, Bottcher Y, Brunner E, Bumpstead SJ, Charpentier G, Chen YD, Chines P, Clarke R, Coin LJ, Cooper MN, Cornelis M, Crawford G, Crisponi L, Day IN, de Geus EJ, Delplanque J, Dina C, Erdos MR, Fedson AC, Fischer-Rosinsky A, Forouhi NG, Fox CS, Frants R, Franzosi MG, Galan P, Goodarzi MO, Graessler J, Groves CJ, Grundy S, Gwilliam R, Gyllensten U, Hadjadj S, Hallmans G, Hammond N, Han X, Hartikainen AL, Hassanali N, Hayward C, Heath SC, Hercberg S, Herder C, Hicks AA, Hillman DR, Hingorani AD, Hofman A, Hui J, Hung J, Isomaa B, Johnson PR, Jorgensen T, Jula A, Kaakinen M, Kaprio J, Kesaniemi YA, Kivimaki M, Knight B, Koskinen S, Kovacs P, Kyvik KO, Lathrop GM, Lawlor DA, Le Bacquer O, Lecoeur C, Li Y, Lyssenko V, Mahley R, Mangino M, Manning AK, Martinez-Larrad MT, McAteer JB, McCulloch LJ, McPherson R, Meisinger C, Melzer D, Meyre D, Mitchell BD, Morken MA, Mukherjee S, Naitza S, Narisu N, Neville MJ, Oostra BA, Orru M, Pakyz R, Palmer CN, Paolisso G, Pattaro C, Pearson D, Peden JF, Pedersen NL, Perola M, Pfeiffer AF, Pichler I, Polasek O, Posthuma D, Potter SC, Pouta A, Province MA, Psaty BM, Rathmann W, Rayner NW, Rice K, Ripatti S, Rivadeneira F, Roden M, Rolandsson O, Sandbaek A, Sandhu M, Sanna S, Sayer AA, Scheet P, Scott LJ, Seedorf U, Sharp SJ, Shields B, Sigurethsson G, Sijbrands EJ, Silveira A, Simpson L, Singleton A, Smith NL, Sovio U, Swift A, Syddall H, Syvanen AC, Tanaka T, Thorand B, Tichet J, Tonjes A, Tuomi T, Uitterlinden AG, van Dijk KW, van Hoek M, Varma D, Visvikis-Siest S, Vitart V, Vogelzangs N, Waeber G, Wagner PJ, Walley A, Walters GB, Ward KL, Watkins H, Weedon MN, Wild SH, Willemsen G, Witteman JC, Yarnell JW, Zeggini E, Zelenika D, Zethelius B, Zhai G, Zhao JH, Zillikens MC, Borecki IB, Loos RJ, Meneton P, Magnusson PK, Nathan DM, Williams GH, Hattersley AT, Silander K, Salomaa V, Smith GD, Bornstein SR, Schwarz P, Spranger J, Karpe F, Shuldiner AR, Cooper C, Dedoussis GV, Serrano-Rios M, Morris AD, Lind L, Palmer LJ, Hu FB, Franks PW, Ebrahim S, Marmot M, Kao WH, Pankow JS, Sampson MJ, Kuusisto J, Laakso M, Hansen T, Pedersen O, Pramstaller PP. New genetic loci implicated in fasting glucose homeostasis and their impact on type 2 diabetes risk. Nat Genet 42: 105–116, 2010 [DOI] [PMC free article] [PubMed] [Google Scholar]
- 9. Elbein SC, Chu WS, Das SK, Yao-Borengasser A, Hasstedt SJ, Wang H, Rasouli N, Kern PA. Transcription factor 7-like 2 polymorphisms and type 2 diabetes, glucose homeostasis traits and gene expression in US participants of European and African descent. Diabetologia 50: 1621–1630, 2007 [DOI] [PubMed] [Google Scholar]
- 10. Elbein SC, Hoffman MD, Teng K, Leppert MF, Hasstedt SJ. A genome-wide search for type 2 diabetes susceptibility genes in Utah Caucasians. Diabetes 48: 1175–1182, 1999 [DOI] [PubMed] [Google Scholar]
- 11. Fogarty MP, Xiao R, Prokunina-Olsson L, Scott LJ, Mohlke KL. Allelic expression imbalance at high-density lipoprotein cholesterol locus MMAB-MVK. Hum Mol Genet 19: 1921–1929, 2010 [DOI] [PMC free article] [PubMed] [Google Scholar]
- 12. Ge B, Pokholok DK, Kwan T, Grundberg E, Morcos L, Verlaan DJ, Le J, Koka V, Lam KC, Gagne V, Dias J, Hoberman R, Montpetit A, Joly MM, Harvey EJ, Sinnett D, Beaulieu P, Hamon R, Graziani A, Dewar K, Harmsen E, Majewski J, Goring HH, Naumova AK, Blanchette M, Gunderson KL, Pastinen T. Global patterns of cis variation in human cells revealed by high-density allelic expression analysis. Nat Genet 41: 1216–1222, 2009 [DOI] [PubMed] [Google Scholar]
- 13. Ilardi JM, Mochida S, Sheng ZH. Snapin: a SNARE-associated protein implicated in synaptic transmission. Nat Neurosci 2: 119–124, 1999 [DOI] [PubMed] [Google Scholar]
- 14. Innocenti F, Cooper GM, Stanaway IB, Gamazon ER, Smith JD, Mirkov S, Ramirez J, Liu W, Lin YS, Moloney C, Aldred SF, Trinklein ND, Schuetz E, Nickerson DA, Thummel KE, Rieder MJ, Rettie AE, Ratain MJ, Cox NJ, Brown CD. Identification, replication, and functional fine-mapping of expression quantitative trait loci in primary human liver tissue. PLoS Genet 7: e1002078, 2011 [DOI] [PMC free article] [PubMed] [Google Scholar]
- 15. Langberg KA, Ma L, Sharma NK, Hanis CL, Elbein SC, Hasstedt SJ, Das SK. Single nucleotide polymorphisms in JAZF1 and BCL11A gene are nominally associated with type 2 diabetes in African-American families from the GENNID study. J Hum Genet 57: 57–61, 2012 [DOI] [PMC free article] [PubMed] [Google Scholar]
- 16. Maira SM, Galetic I, Brazil DP, Kaech S, Ingley E, Thelen M, Hemmings BA. Carboxyl-terminal modulator protein (CTMP), a negative regulator of PKB/Akt and v-Akt at the plasma membrane. Science 294: 374–380, 2001 [DOI] [PubMed] [Google Scholar]
- 17. McCarthy MI, Rorsman P, Gloyn AL. TCF7L2 and diabetes: a tale of two tissues, and of two species. Cell Metab 17: 157–159, 2013 [DOI] [PubMed] [Google Scholar]
- 18. Montgomery SB, Sammeth M, Gutierrez-Arcelus M, Lach RP, Ingle C, Nisbett J, Guigo R, Dermitzakis ET. Transcriptome genetics using second generation sequencing in a Caucasian population. Nature 464: 773–777, 2010 [DOI] [PMC free article] [PubMed] [Google Scholar]
- 19. Morris AP, Voight BF, Teslovich TM, Ferreira T, Segre AV, Steinthorsdottir V, Strawbridge RJ, Khan H, Grallert H, Mahajan A, Prokopenko I, Kang HM, Dina C, Esko T, Fraser RM, Kanoni S, Kumar A, Lagou V, Langenberg C, Luan J, Lindgren CM, Muller-Nurasyid M, Pechlivanis S, Rayner NW, Scott LJ, Wiltshire S, Yengo L, Kinnunen L, Rossin EJ, Raychaudhuri S, Johnson AD, Dimas AS, Loos RJ, Vedantam S, Chen H, Florez JC, Fox C, Liu CT, Rybin D, Couper DJ, Kao WH, Li M, Cornelis MC, Kraft P, Sun Q, van Dam RM, Stringham HM, Chines PS, Fischer K, Fontanillas P, Holmen OL, Hunt SE, Jackson AU, Kong A, Lawrence R, Meyer J, Perry JR, Platou CG, Potter S, Rehnberg E, Robertson N, Sivapalaratnam S, Stancakova A, Stirrups K, Thorleifsson G, Tikkanen E, Wood AR, Almgren P, Atalay M, Benediktsson R, Bonnycastle LL, Burtt N, Carey J, Charpentier G, Crenshaw AT, Doney AS, Dorkhan M, Edkins S, Emilsson V, Eury E, Forsen T, Gertow K, Gigante B, Grant GB, Groves CJ, Guiducci C, Herder C, Hreidarsson AB, Hui J, James A, Jonsson A, Rathmann W, Klopp N, Kravic J, Krjutskov K, Langford C, Leander K, Lindholm E, Lobbens S, Mannisto S, Mirza G, Muhleisen TW, Musk B, Parkin M, Rallidis L, Saramies J, Sennblad B, Shah S, Sigurethsson G, Silveira A, Steinbach G, Thorand B, Trakalo J, Veglia F, Wennauer R, Winckler W, Zabaneh D, Campbell H, van Duijn C, Uitterlinden AG, Hofman A, Sijbrands E, Abecasis GR, Owen KR, Zeggini E, Trip MD, Forouhi NG, Syvanen AC, Eriksson JG, Peltonen L, Nothen MM, Balkau B, Palmer CN, Lyssenko V, Tuomi T, Isomaa B, Hunter DJ, Qi L, Shuldiner AR, Roden M, Barroso I, Wilsgaard T, Beilby J, Hovingh K, Price JF, Wilson JF, Rauramaa R, Lakka TA, Lind L, Dedoussis G, Njolstad I, Pedersen NL, Khaw KT, Wareham NJ, Keinanen-Kiukaanniemi SM, Saaristo TE, Korpi-Hyovalti E, Saltevo J, Laakso M, Kuusisto J, Metspalu A, Collins FS, Mohlke KL, Bergman RN, Tuomilehto J, Boehm BO, Gieger C, Hveem K, Cauchi S, Froguel P, Baldassarre D, Tremoli E, Humphries SE, Saleheen D, Danesh J, Ingelsson E, Ripatti S, Salomaa V, Erbel R, Jockel KH, Moebus S, Peters A, Illig T, de Faire U, Hamsten A, Morris AD, Donnelly PJ, Frayling TM, Hattersley AT, Boerwinkle E, Melander O, Kathiresan S, Nilsson PM, Deloukas P, Thorsteinsdottir U, Groop LC, Stefansson K, Hu F, Pankow JS, Dupuis J, Meigs JB, Altshuler D, Boehnke M, McCarthy MI. Large-scale association analysis provides insights into the genetic architecture and pathophysiology of type 2 diabetes. Nat Genet 44: 981990, 2012 [DOI] [PMC free article] [PubMed] [Google Scholar]
- 20. Nicolae DL, Gamazon E, Zhang W, Duan S, Dolan ME, Cox NJ. Trait-associated SNPs are more likely to be eQTLs: annotation to enhance discovery from GWAS. PLoS Genet 6: e1000888, 2010 [DOI] [PMC free article] [PubMed] [Google Scholar]
- 21. Nobrega MA. TCF7L2 and Glucose Metabolism: Time to Look Beyond the Pancreas. Diabetes 62: 706–708, 2013 [DOI] [PMC free article] [PubMed] [Google Scholar]
- 22. Ono H, Sakoda H, Fujishiro M, Anai M, Kushiyama A, Fukushima Y, Katagiri H, Ogihara T, Oka Y, Kamata H, Horike N, Uchijima Y, Kurihara H, Asano T. Carboxy-terminal modulator protein induces Akt phosphorylation and activation, thereby enhancing antiapoptotic, glycogen synthetic, and glucose uptake pathways. Am J Physiol Cell Physiol 293: C1576–C1585, 2007 [DOI] [PubMed] [Google Scholar]
- 23. Palmer ND, McDonough CW, Hicks PJ, Roh BH, Wing MR, An SS, Hester JM, Cooke JN, Bostrom MA, Rudock ME, Talbert ME, Lewis JP, Ferrara A, Lu L, Ziegler JT, Sale MM, Divers J, Shriner D, Adeyemo A, Rotimi CN, Ng MC, Langefeld CD, Freedman BI, Bowden DW, Voight BF, Scott LJ, Steinthorsdottir V, Morris AP, Dina C, Welch RP, Zeggini E, Huth C, Aulchenko YS, Thorleifsson G, McCulloch LJ, Ferreira T, Grallert H, Amin N, Wu G, Willer CJ, Raychaudhuri S, McCarroll SA, Langenberg C, Hofmann OM, Dupuis J, Qi L, Segre AV, van Hoek M, Navarro P, Ardlie K, Balkau B, Benediktsson R, Bennett AJ, Blagieva R, Boerwinkle E, Bonnycastle LL, Bostrom KB, Bravenboer B, Bumpstead S, Burtt NP, Charpentier G, Chines PS, Cornelis M, Couper DJ, Crawford G, Doney AS, Elliott KS, Elliott AL, Erdos MR, Fox CS, Franklin CS, Ganser M, Gieger C, Grarup N, Green T, Griffin S, Groves CJ, Guiducci C, Hadjadj S, Hassanali N, Herder C, Isomaa B, Jackson AU, Johnson PR, Jorgensen T, Kao WH, Klopp N, Kong A, Kraft P, Kuusisto J, Lauritzen T, Li M, Lieverse A, Lindgren CM, Lyssenko V, Marre M, Meitinger T, Midthjell K, Morken MA, Narisu N, Nilsson P, Owen KR, Payne F, Perry JR, Petersen AK, Platou C, Proenca C, Prokopenko I, Rathmann W, Rayner NW, Robertson NR, Rocheleau G, Roden M, Sampson MJ, Saxena R, Shields BM, Shrader P, Sigurdsson G, Sparso T, Strassburger K, Stringham HM, Sun Q, Swift AJ, Thorand B, Tichet J, Tuomi T, van Dam RM, van Haeften TW, van Herpt T, Vliet-Ostaptchouk JV, Walters GB, Weedon MN, Wijmenga C, Witteman J, Bergman RN, Cauchi S, Collins FS, Gloyn AL, Gyllensten U, Hansen T, Hide WA, Hitman GA, Hofman A, Hunter DJ, Hveem K, Laakso M, Mohlke KL, Morris AD, Palmer CN, Pramstaller PP, Rudan I, Sijbrands E, Stein LD, Tuomilehto J, Uitterlinden A, Walker M, Wareham NJ, Watanabe RM, Abecasis GR, Boehm BO, Campbell H, Daly MJ, Hattersley AT, Hu FB, Meigs JB, Pankow JS, Pedersen O, Wichmann HE, Barroso I, Florez JC, Frayling TM, Groop L, Sladek R, Thorsteinsdottir U, Wilson JF, Illig T, Froguel P, van Duijn CM, Stefansson K, Altshuler D, Boehnke M, McCarthy MI, Soranzo N, Wheeler E, Glazer NL, Bouatia-Naji N, Magi R, Randall J, Johnson T, Elliott P, Rybin D, Henneman P, Dehghan A, Hottenga JJ, Song K, Goel A, Egan JM, Lajunen T, Doney A, Kanoni S, Cavalcanti-Proenca C, Kumari M, Timpson NJ, Zabena C, Ingelsson E, An P, O'Connell J, Luan J, Elliott A, McCarroll SA, Roccasecca RM, Pattou F, Sethupathy P, Ariyurek Y, Barter P, Beilby JP, Ben Shlomo Y, Bergmann S, Bochud M, Bonnefond A, Borch-Johnsen K, Bottcher Y, Brunner E, Bumpstead SJ, Chen YD, Chines P, Clarke R, Coin LJ, Cooper MN, Crisponi L, Day IN, de Geus EJ, Delplanque J, Fedson AC, Fischer-Rosinsky A, Forouhi NG, Frants R, Franzosi MG, Galan P, Goodarzi MO, Graessler J, Grundy S, Gwilliam R, Hallmans G, Hammond N, Han X, Hartikainen AL, Hayward C, Heath SC, Hercberg S, Hicks AA, Hillman DR, Hingorani AD, Hui J, Hung J. A genome-wide association search for type 2 diabetes genes in African Americans. PLoS One 7: e29202, 2012 [DOI] [PMC free article] [PubMed] [Google Scholar]
- 24. Parcellier A, Tintignac LA, Zhuravleva E, Cron P, Schenk S, Bozulic L, Hemmings BA. Carboxy-terminal modulator protein (CTMP) is a mitochondrial protein that sensitizes cells to apoptosis. Cell Signal 21: 639–650, 2009 [DOI] [PubMed] [Google Scholar]
- 25. Parcellier A, Tintignac LA, Zhuravleva E, Dummler B, Brazil DP, Hynx D, Cron P, Schenk S, Olivieri V, Hemmings BA. The carboxy-terminal modulator protein (CTMP) regulates mitochondrial dynamics. PLoS One 4: e5471, 2009 [DOI] [PMC free article] [PubMed] [Google Scholar]
- 26. Pastinen T. Genome-wide allele-specific analysis: insights into regulatory variation. Nat Rev Genet 11: 533–538, 2010 [DOI] [PubMed] [Google Scholar]
- 27. Pastinen T, Ge B, Gurd S, Gaudin T, Dore C, Lemire M, Lepage P, Harmsen E, Hudson TJ. Mapping common regulatory variants to human haplotypes. Hum Mol Genet 14: 3963–3971, 2005 [DOI] [PubMed] [Google Scholar]
- 28. Piao L, Li Y, Yang KJ, Park KA, Byun HS, Won M, Hong J, Kim JL, Kweon GR, Hur GM, Seok JH, Cho JY, Chun T, Hess D, Sack R, Maira SM, Brazil DP, Hemmings BA, Park J. Heat shock protein 70-mediated sensitization of cells to apoptosis by carboxyl-terminal modulator protein. BMC Cell Biol 10: 53, 2009 [DOI] [PMC free article] [PubMed] [Google Scholar]
- 29. Prokopenko I, Zeggini E, Hanson RL, Mitchell BD, Rayner NW, Akan P, Baier L, Das SK, Elliott KS, Fu M, Frayling TM, Groves CJ, Gwilliam R, Scott LJ, Voight BF, Hattersley AT, Hu C, Morris AD, Ng M, Palmer CN, Tello-Ruiz M, Vaxillaire M, Wang CR, Stein L, Chan J, Jia W, Froguel P, Elbein SC, Deloukas P, Bogardus C, Shuldiner AR, McCarthy MI. Linkage disequilibrium mapping of the replicated type 2 diabetes linkage signal on chromosome 1q. Diabetes 58: 1704–1709, 2009 [DOI] [PMC free article] [PubMed] [Google Scholar]
- 30. Saxena R, Hivert MF, Langenberg C, Tanaka T, Pankow JS, Vollenweider P, Lyssenko V, Bouatia-Naji N, Dupuis J, Jackson AU, Kao WH, Li M, Glazer NL, Manning AK, Luan J, Stringham HM, Prokopenko I, Johnson T, Grarup N, Boesgaard TW, Lecoeur C, Shrader P, O'Connell J, Ingelsson E, Couper DJ, Rice K, Song K, Andreasen CH, Dina C, Kottgen A, Le Bacquer O, Pattou F, Taneera J, Steinthorsdottir V, Rybin D, Ardlie K, Sampson M, Qi L, van Hoek M, Weedon MN, Aulchenko YS, Voight BF, Grallert H, Balkau B, Bergman RN, Bielinski SJ, Bonnefond A, Bonnycastle LL, Borch-Johnsen K, Bottcher Y, Brunner E, Buchanan TA, Bumpstead SJ, Cavalcanti-Proenca C, Charpentier G, Chen YD, Chines PS, Collins FS, Cornelis M, Crawford J, Delplanque J, Doney A, Egan JM, Erdos MR, Firmann M, Forouhi NG, Fox CS, Goodarzi MO, Graessler J, Hingorani A, Isomaa B, Jorgensen T, Kivimaki M, Kovacs P, Krohn K, Kumari M, Lauritzen T, Levy-Marchal C, Mayor V, McAteer JB, Meyre D, Mitchell BD, Mohlke KL, Morken MA, Narisu N, Palmer CN, Pakyz R, Pascoe L, Payne F, Pearson D, Rathmann W, Sandbaek A, Sayer AA, Scott LJ, Sharp SJ, Sijbrands E, Singleton A, Siscovick DS, Smith NL, Sparso T, Swift AJ, Syddall H, Thorleifsson G, Tonjes A, Tuomi T, Tuomilehto J, Valle TT, Waeber G, Walley A, Waterworth DM, Zeggini E, Zhao JH, Illig T, Wichmann HE, Wilson JF, van Duijn C, Hu FB, Morris AD, Frayling TM, Hattersley AT, Thorsteinsdottir U, Stefansson K, Nilsson P, Syvanen AC, Shuldiner AR, Walker M, Bornstein SR, Schwarz P, Williams GH, Nathan DM, Kuusisto J, Laakso M, Cooper C, Marmot M, Ferrucci L, Mooser V, Stumvoll M, Loos RJ, Altshuler D, Psaty BM, Rotter JI, Boerwinkle E, Hansen T, Pedersen O, Florez JC, McCarthy MI, Boehnke M, Barroso I, Sladek R, Froguel P, Meigs JB, Groop L, Wareham NJ, Watanabe RM. Genetic variation in GIPR influences the glucose and insulin responses to an oral glucose challenge. Nat Genet 42: 142–148, 2010 [DOI] [PMC free article] [PubMed] [Google Scholar]
- 31. Sharma NK, Langberg KA, Mondal AK, Elbein SC, Das SK. Type 2 diabetes (T2D) associated polymorphisms regulate expression of adjacent transcripts in transformed lymphocytes, adipose, and muscle from Caucasian and African-American subjects. J Clin Endocrinol Metab 96: E394–E403, 2011 [DOI] [PMC free article] [PubMed] [Google Scholar]
- 32. Simcox JA, McClain DA. Iron and diabetes risk. Cell Metab 17: 329–341, 2013 [DOI] [PMC free article] [PubMed] [Google Scholar]
- 33. Visscher PM, Brown MA, McCarthy MI, Yang J. Five years of GWAS discovery. Am J Hum Genet 90: 7–24, 2012 [DOI] [PMC free article] [PubMed] [Google Scholar]
- 34. von und zu Fraunberg M, Nyroen T, Kauppinen R. Mitochondrial targeting of normal and mutant protoporphyrinogen oxidase. J Biol Chem 278: 13376–13381, 2003 [DOI] [PubMed] [Google Scholar]
- 35. Wang H, Elbein SC. Detection of allelic imbalance in gene expression using pyrosequencing. Methods Mol Biol 373: 157–176, 2007 [DOI] [PubMed] [Google Scholar]
- 36. Zhao H, Lim K, Choudry A, Latham JA, Pathak MC, Dominguez D, Luo L, Herzberg O, Dunaway-Mariano D. Correlation of structure and function in the human hotdog-fold enzyme hTHEM4. Biochemistry 51: 6490–6492, 2012 [DOI] [PMC free article] [PubMed] [Google Scholar]
- 37. Zhao H, Martin BM, Bisoffi M, Dunaway-Mariano D. The Akt C-terminal modulator protein is an acyl-CoA thioesterase of the Hotdog-Fold family. Biochemistry 48: 5507–5509, 2009 [DOI] [PMC free article] [PubMed] [Google Scholar]
- 38. Zhou Q, Leeman SE, Amar S. Signaling mechanisms involved in altered function of macrophages from diet-induced obese mice affect immune responses. Proc Natl Acad Sci USA 106: 10740–10745, 2009 [DOI] [PMC free article] [PubMed] [Google Scholar]
- 39. Zhou Q, Leeman SE, Amar S. Signaling mechanisms in the restoration of impaired immune function due to diet-induced obesity. Proc Natl Acad Sci USA 108: 2867–2872, 2011 [DOI] [PMC free article] [PubMed] [Google Scholar]
Associated Data
This section collects any data citations, data availability statements, or supplementary materials included in this article.