Abstract
Measuring neuron capacitance is important for morphological description, conductance characterization, and neuron modeling. One method to estimate capacitance is to inject current pulses into a neuron and fit the resulting changes in membrane potential with multiple exponentials; if the neuron is purely passive, the amplitude and time constant of the slowest exponential give neuron capacitance (Major G, Evans JD, Jack JJ. Biophys J 65: 423–449, 1993). Golowasch et al. (Golowasch J, Thomas G, Taylor AL, Patel A, Pineda A, Khalil C, Nadim F. J Neurophysiol 102: 2161–2175, 2009) have shown that this is the best method for measuring the capacitance of nonisopotential (i.e., most) neurons. However, prior work has not tested for, or examined how much error would be introduced by, slow voltage-dependent phenomena possibly present at the membrane potentials typically used in such work. We investigated this issue in lobster (Panulirus interruptus) stomatogastric neurons by performing current clamp-based capacitance measurements at multiple membrane potentials. A slow, voltage-dependent phenomenon consistent with residual voltage-dependent conductances was present at all tested membrane potentials (−95 to −35 mV). This phenomenon was the slowest component of the neuron's voltage response, and failure to recognize and exclude it would lead to capacitance overestimates of several hundredfold. Most methods of estimating capacitance depend on the absence of voltage-dependent phenomena. Our demonstration that such phenomena make nonnegligible contributions to neuron responses even at well-hyperpolarized membrane potentials highlights the critical importance of checking for such phenomena in all work measuring neuron capacitance. We show here how to identify such phenomena and minimize their contaminating influence.
Keywords: stomatogastric neurons, lobster, Panulirus interruptus
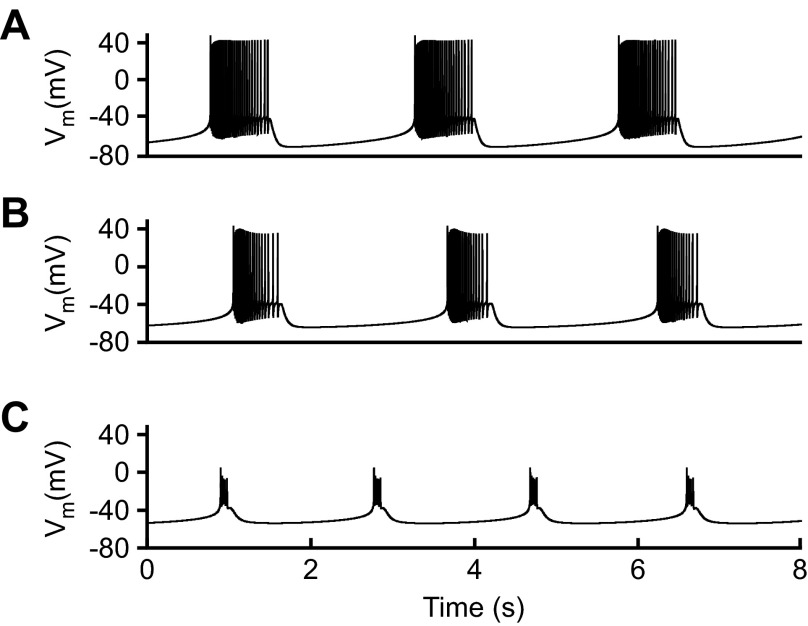
capacitance is a defining characteristic of neuron electrical properties. Because membrane-specific capacitance varies little across neurons, typically being 0.9 μF/cm2 (Gentet et al. 2000), neuron capacitance also estimates neuron surface area. Accurately measuring capacitance is therefore important in studying neuron development and morphology, characterizing neuron conductances, and neuron modeling. With respect to modeling, membrane currents change membrane voltage by acting through membrane capacitance. Model membrane potential dynamics thus critically depend on capacitance. Simply stated, no matter how accurate the description of neuron currents, without an accurate value of capacitance, neuron models give incorrect activity. In a bursting pyloric model neuron (Fig. 1A), increasing capacitance twofold increased interburst interval and decreased burst duration (Fig. 1B) and a tenfold increase sharply attenuated spike amplitude and further decreased burst duration (Fig. 1C).
Fig. 1.
Altering neuron capacitance changes neuron activity. A: a common pyloric neuron model (Prinz et al. 2003) was used, having conductance ḡ parameter values of 5 (CaT), 4 (CaS), 40 (A), 5 (KCa), 125 (Kd), 0.01 (H), and 200 (Na) mS/cm2 and base capacitance of 0.628 nF. Doubling capacitance (B) and increasing capacitance 10-fold (C) change the model neuron's cycle period, burst duration, and spike amplitude. Vm, membrane potential.
Accurate measurement of neuron capacitance is thus clearly required for accurate neuron modeling. Multiple electrical techniques for neuron capacitance measurement have been described. Capacitance can be measured in voltage clamp by integrating or fitting the currents that occur with step or ramp changes in voltage (Golowasch et al. 2009; Haedo and Golowasch 2006; Iwasaki et al. 2008; Khorkova and Golowasch 2007; Pineda et al. 2008; Royeck et al. 2008) or in current clamp by fitting the voltage responses to step changes in current (Arsenault et al. 2011; Firestein and Werblin 1987; Liao and Lee 2011; Major et al. 1993; Roth and Häusser 2001; Szabo et al. 2010). Current-clamp techniques are most accurate for neurons with extended morphologies or nonuniform conductance distributions (nonisopotential neurons) (Golowasch et al. 2009), the case for essentially all neurons. In these neurons the voltage response is typically well fit by a sum of exponentials. In nonisopotential neurons with only passive (non-voltage-dependent) electrical properties, and in which the dendritic compartment dominates neuron response (see Fig. 3 of Golowasch et al. 2009), the slowest of these terms can be used to estimate neuron capacitance and resistance. The faster terms arise from current flow through the neuron's branches (Major et al. 1993) and can be used to estimate neuron electrotonic length (Rall 1977).
Fig. 3.
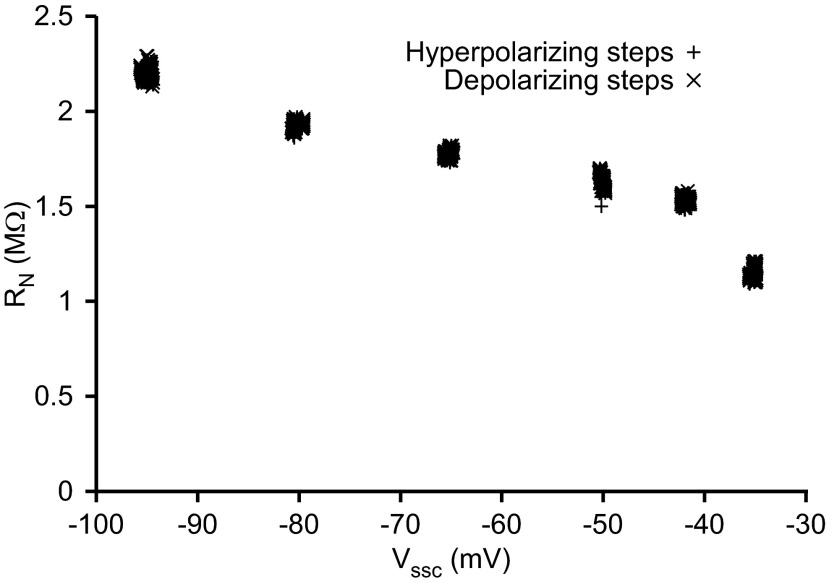
RN of neuron LP2 continuously increased as the steady-state voltage from which current pulses were initiated (Vssc) was hyperpolarized. RN was measured by dividing the membrane voltage deflection at the end of each pulse half-cycle (hyperpolarizing and relaxing phases) by pulse current. The tight clustering of points indicates that, at each Vssc, RN was stable both within pulse trains and across the 3 stairstep cycles.
A potential difficulty with the current-clamp technique is the presence of voltage-dependent phenomena with dynamics slower than the neuron's passive dynamics (Taylor 2012), in which case the slowest term arises from the dynamics of the slow phenomena, not from neuron capacitance and passive resistance. Since passive charging curves change monotonically, slow phenomena that cause voltage changes that oppose the neuron charge curve, e.g., Ih-induced voltage sags, are easily identifiable (Major et al. 1993; Rose and Dagum 1988). However, for slow voltage-dependent phenomena that cause voltage changes with the same sign as the charging curve, it is not obvious that the slow term does not arise from neuron passive properties and thus should not be used to estimate neuron capacitance.
Since true neuron capacitance should not vary with membrane potential, one method to identify voltage-dependent phenomena is to perform current steps at multiple membrane potentials. We have performed such experiments on pyloric neurons of the lobster (Panulirus interruptus) stomatogastric ganglion and show that the voltage responses are indeed contaminated by a slow voltage-dependent process. Misidentifying this slowest term in the multiexponential fits as arising from passive properties would overestimate neuron capacitance many hundredfold. To our knowledge, previous current-clamp measurement of neuron capacitance, regardless of species, has not been performed at multiple membrane potentials. The presence of slow voltage-dependent phenomena has therefore not been tested for in any of this work, and it may thus be compromised by unrecognized slow voltage-dependent phenomena.
MATERIALS AND METHODS
Electrophysiology.
P. interruptus were obtained from Marinus Scientific (Newport Beach, CA) and maintained in aquaria at 10–13°C with circulating artificial seawater. Dissections were standard (Selverston et al. 1976). Preparations were perfused with 10–13°C P. interruptus saline (in mM: 479 NaCl, 12.9 KCl, 13.7 CaCl2, 3.9 Na2SO4, 10 MgSO4, 10.9 dextrose, 11.1 Tris, and 5.1 maleic acid, pH adjusted to 7.4–7.6; Fisher Scientific) throughout the experiment. Extracellular recordings from the lateral and medial ventricular nerves were made with an A-M Systems differential amplifier using monopolar stainless steel electrodes insulated with petroleum jelly. Intracellular recordings were made with an Axoclamp 2B and sharp glass microelectrodes pulled on a P-87 Flaming/Brown micropipette puller (Sutter Instruments) and filled with 2.5 M KAc, 20 mM KCl (resistance 10–20 MΩ). Lateral pyloric (LP) and pyloric (PY) neurons were identified by comparing intracellular and extracellular activities.
After neuron identification, preparations were bathed in P. interruptus saline containing 0.1 μM tetrodotoxin, 10 μM picrotoxin, and 5 mM CsCl to block fast sodium spikes, glutamatergic synapses, and hyperpolarization-activated Ih current, respectively. LP or PY neurons were impaled with two glass microelectrodes, one to measure voltage and the other to pass current. The Axoclamp 2B amplifier was used in bridge mode. Data were digitized at 5 kHz with a Cambridge Electronic Design 1401plus intracellular amplifier and processed with Spike2 software. Square-wave pulses were generated with custom-written Spike2 scripts.
Setting current pulse amplitude.
Current pulse amplitude, Ipulse, was set by injecting bias current to hold the neuron at −50 mV for 60 s and then injecting 1 s on, 1 s off square-wave current pulses of sufficient amplitude to hyperpolarize the neuron to −60 mV. This Ipulse was used throughout the experiment and was not adjusted to compensate for changes in neuron input resistance (RN) that might have occurred during the experiment. Not compensating for RN changes did not affect analysis validity, as RN was not used in determining capacitance. These calculations do depend on membrane potential. The data were therefore always plotted and analyzed with measured membrane potential (see, e.g., the horizontal scatter of the data around each nominal membrane potential in Fig. 6).
Fig. 6.
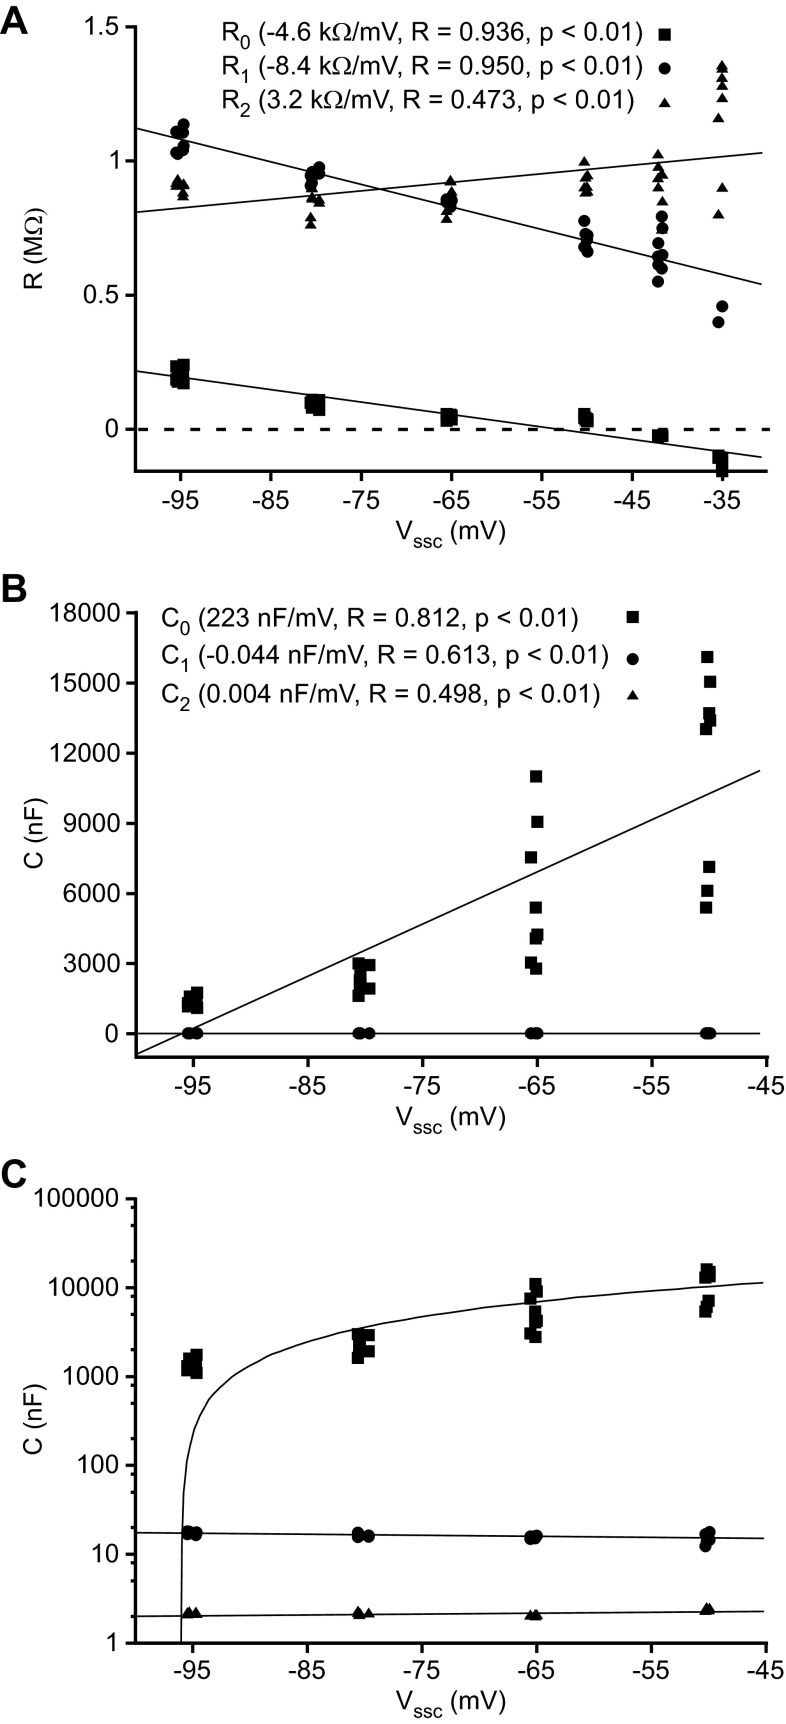
Resistive coefficients (A) shown in a linear plot and capacitive coefficients shown in linear (B) and semilog (C) plots derived from the τ and A coefficients of neuron LP2. Resistive coefficients were calculated as Ri = Ai/Ipulse. Capacitive coefficients were calculated as Ci = τi·Ri. Coefficients derived from slow, medium, and fast exponential terms are represented by squares, circles, and triangles, respectively. Linear fits to capacitive (C = m·Vssc + b) and resistive (R = m·Vssc + b) coefficients are shown (lines). Linear fits appear curved in C because plot is semilogarithmic. Triangles in B are not visible because they overlap circles.
Current stairsteps.
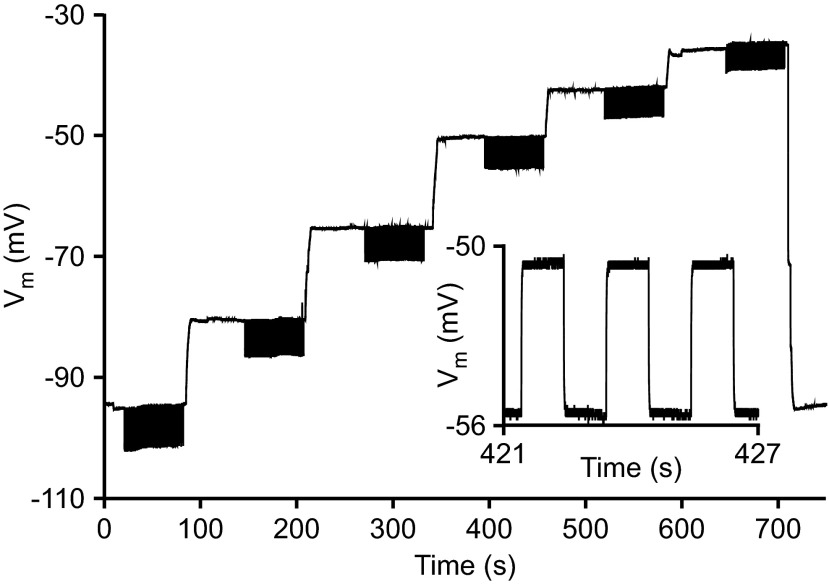
In five PY and four LP neurons, four or six increasing nominal membrane potentials were selected: −95, −80, −65, −50, −42.5, −35 or −80, −70, −60, −50 mV. Each neuron was held at the first potential for at least 60 s by adjusting bias current as necessary to achieve and maintain the desired potential. Square-wave pulses of amplitude Ipulse and 0.5-Hz frequency were then injected for 60 s. Bias current was then changed to reach the next potential, and the process was repeated (see Fig. 2; inset shows an expanded version of the voltage response to a few current pulses at 1 potential). The stairstep was repeated two to four times. Calculations were made relative to these nominal membrane potentials, which we refer to as Vssc, the steady-state voltage from which the current pulses were initiated.
Fig. 2.
Response of neuron LP2 to current-clamp stairstep protocol. Bias current was applied to reach and maintain a nominal membrane potential of −100 mV for 60 s, followed by 60 s of a 0.5-Hz fixed-amplitude square-wave pulse train added to the bias current (the actual steady-state potential achieved was used in all calculations). This process was repeated at 6 increasingly depolarized potentials. In this experiment the entire stairstep was repeated for 2 additional cycles. Inset: 3 cycles of the neuron's response during the pulse train at −50 mV. Pulse train response amplitude was greater at −95 mV than at −50 mV [the membrane potential at which capacitance measurements are typically made (Golowasch et al. 2009)], indicating that input resistance (RN) was greater at −95 mV.
Determining mean voltage responses to current pulses.
Waveform data were exported from Spike2 and processed with custom software written in Perl and C. Current clamp-based methods for estimating capacitance depend critically on accurate measurements of current pulse amplitude and timing. To maximize accuracy, we therefore determined these two parameters algorithmically. Mean current pulse on and off amplitudes were determined from the current trace by constructing a kernel density estimator of the current values and finding the two maxima thereof. Pulse timing was recovered by adjusting the phase of a mathematically generated square wave of matching amplitude and frequency until maximum overlap with the current trace was achieved. This technique was used because it produced more accurate results than thresholding in preliminary tests. This timing information was used to find the start and end times of the membrane voltage response to each current step. The voltage responses to the first five current pulses were discarded to exclude any effects of slow process equilibration (see results). All subsequent cycles were averaged to improve signal-to-noise ratio.
Exponential fitting and coefficient calculation.
Hyperpolarizing and relaxing phases of each pulse train's mean voltage response waveform from t = 0 to 990 ms were fit (see Fig. 4) with a sum of exponentials model:
with software implementing a transform method (DISCRETE) incorporating the standard deviations of the mean voltage responses (Provencher and Vogel 1980). The DISCRETE program selected the best number of exponential terms, using a Fischer's F-test (α = 0.05) with Beale's nonlinearity correction; at most three terms were permitted. If the standard error of any of the Vfinal, Ai, or τi in a three-term fit exceeded 10%, two-term fits were used, which in all cases gave acceptable Vfinal, Ai, and τi errors. Custom software written in Perl was used to make the Ai and Vfinal values for positive current steps (the relaxing phase of the current pulses) comparable to the Ai and Vfinal values for negative current steps. Resistive coefficients were calculated as Ri = −Ai/Ipulse for each term (negative Ai being used because of the fitting equation, which gives positive Ai for negative current steps). Capacitive coefficients were calculated as Ci = τi/Ri (of which only one corresponds to neuron capacitance; see introduction).
Fig. 4.
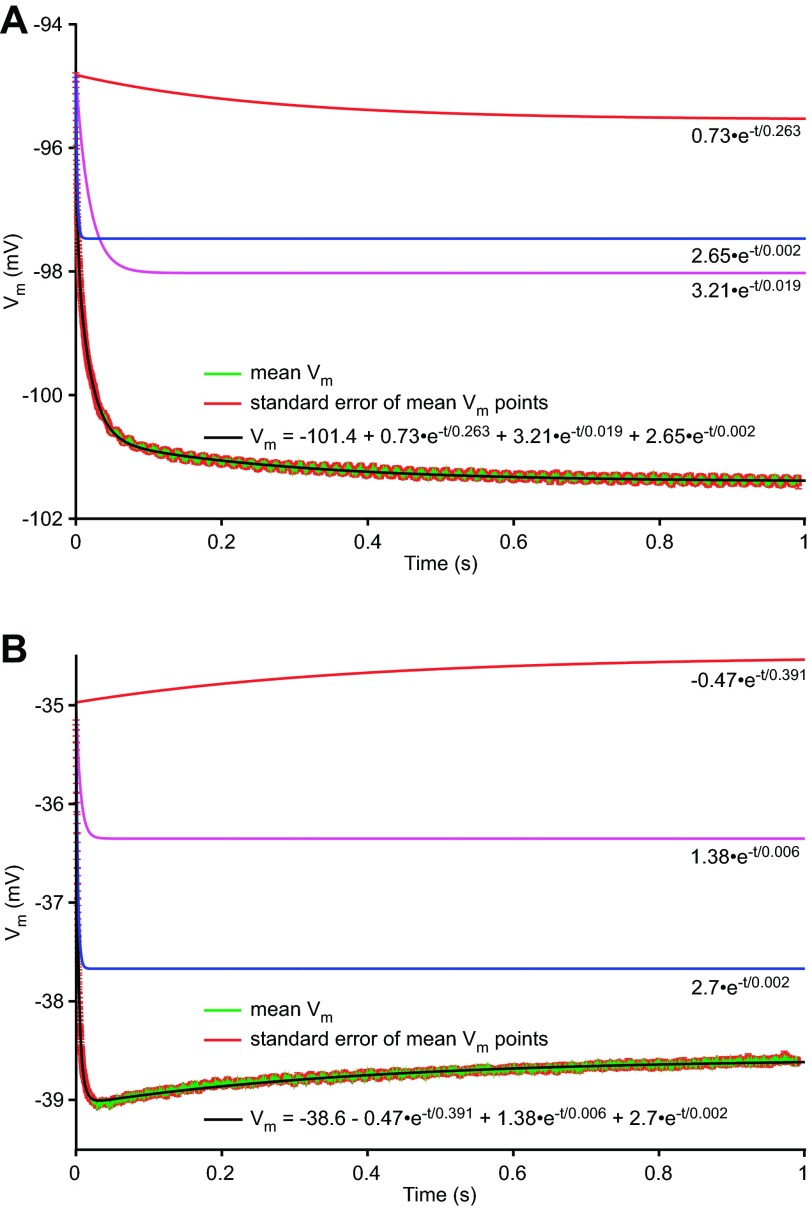
Membrane potential response of neuron LP2 to hyperpolarizing current steps at Vssc = −95 mV (A) and −35 mV (B), fit to a sum of 3 exponentials. Amplitude and time course of slow (red), medium (magenta), and fast (blue) terms are shown.
Input resistance determination.
RN was calculated for each pulse by dividing the amplitude of the membrane potential change at the end of each phase of the current pulse by Ipulse. These RN were then averaged to obtain a mean RN for each pulse train at each nominal Vssc.
Statistical analyses.
Means were compared with Student's t-tests. Linear regressions were performed with the Perl Statistics::Regression package. Outliers were detected by calculating Cook's distance Di on the regression model (Bollen and Jackman 1990). Where Di exceeded 4/N (N = number of observations), the corresponding waveforms were visually examined and recordings with obvious noise or artifacts were rejected. When Vssc was used in linear regressions, the mean membrane potential at the end of the current off phase was used to determine Vssc.
NEURON models.
To test the effect of a slow, depolarization-activated conductance on capacitance measurements (see results) under completely defined conditions, we implemented a voltage-dependent conductance Isr in NEURON as follows:
with τm fixed at 0.2 s (the typical τ of the slowest exponential component). Isopotential and nonisopotential models were constructed. The isopotential model was a single compartment with Ileak and Isr currents. ḡleak, ḡsr, V1/2, k, m0, Esr, Eleak, and Cm (membrane-specific capacitance per unit area) were adjusted during fitting (see below). The nonisopotential “ball and stick” model comprised two isopotential compartments (soma and distal) containing Ileak and Isr separated by a 10-μm-diameter cable containing only Ileak. Soma ḡleak, ḡsr, and cm; cable ḡleak, cm, and length; distal ḡleak, ḡsr, and cm; and global V1/2, k, m0, Esr, and Eleak were adjusted during fitting.
The data from neuron LP4 (chosen because it had the largest RN change in response to changes to Vssc; see Fig. 7B) were used to fit the two models. To reduce the influence of noise in the waveform recordings, an idealized waveform trace was constructed. The average voltage response of the neuron to the current pulses (see Determining mean voltage responses to the current pulses above) was appended to itself, repeating for a total of eight cycles. The NEURON Multiple Run Fitter, with some hand adjustment of parameters, was used to optimize model parameters until the model neuron's voltage response to the current pulse train was very similar to the average response of the real LP neuron, differing by an average of 0.5 mV or less. Only the voltage response during the final pulse was considered; with a 0.2-s τ, this allowed the slow conductance to reach its new steady-state mean value by the beginning of the last pulse.
Fig. 7.
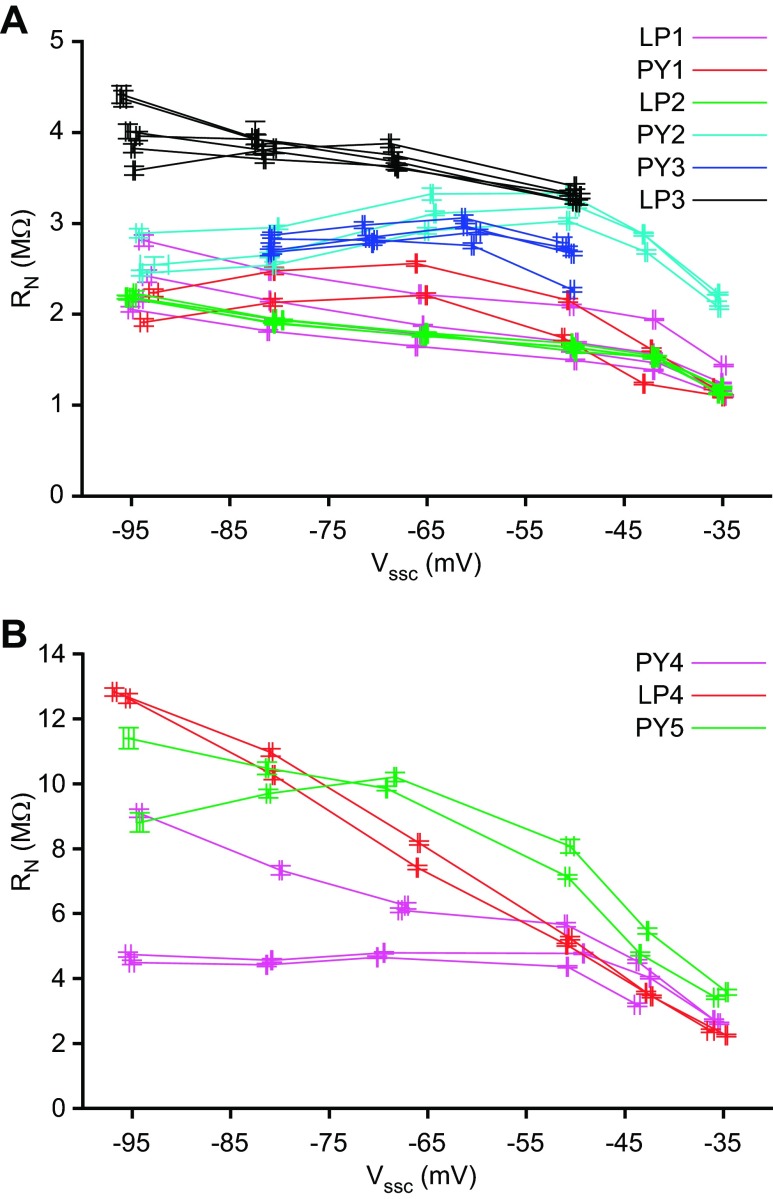
RN of all neurons at different Vssc values, separated for clarity into low (A)- and high (B)-RN groups. Error bars show SD of each pulse train's mean RN and Vssc. All LP neurons showed increased RN at hyperpolarized potentials, as did 2 PY neurons (PY4 and PY5) during the first stairstep cycle (descending magenta and green traces, B).
The fitted models were then subjected to a full stimulus protocol of three stairstep cycles. To make each stairstep cycle visibly unique in plots, a constant 0.075 nA was added to the bias current in each subsequent stairstep cycle (see Fig. 10). The resulting response waveforms were processed as described above.
Fig. 10.
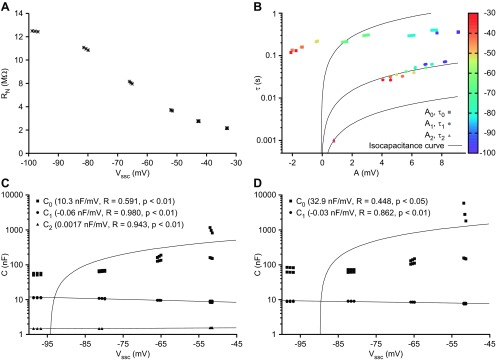
Response of optimized NEURON models to stairstep protocols. Ball and stick model RN (A), τ and A coefficients (B), capacitive coefficients (C), and single-compartment model capacitive coefficients (D) are shown. In addition to standard passive properties, both models included a noninactivating voltage-dependent conductance designed to behave similarly to the active component observed in our experimental data. The C1 coefficients of both models showed a slight voltage dependence with a negative slope, consistent with experimental data. Note that the ball and stick model neurons are morphologically simple compared with real pyloric neurons. Accordingly, the fast exponential term, which reflects current flow due to nonisopotentiality, varies only slightly with Vssc, with changes to τ2 and A2 coefficients not being visible (overlapping triangles, B) and the C2 coefficient varying only 0.0017 nF/mV (C). The C2 coefficient is absent in the isopotential model fits (D) because there is no such current flow.
Visualization.
Data were plotted with gnuplot and custom software written in Perl. Final figures were prepared in Canvas (Deneba Software, Miami, FL).
RESULTS
The response of a passive isopotential neuron to a current step of amplitude I is given by an exponential charging curve:
where Vm is membrane potential, Vfinal is the Vm achieved after infinite time, τ is exponential time constant, and A is voltage excursion maximum amplitude. τ = RC and A = −IR, where R is neuron resistance and C is neuron capacitance. In such neurons C can therefore be measured by fitting the charge curve with a single exponential and calculating C = −Iτ/A. In nonisopotential passive neurons current flows both across the membrane and among internal compartments. In such neurons the charge curve is given by a sum of exponentials:
and input resistance (RN) does not equal R but instead , where Ri = −Ai/I. The time constant arising from neuron capacitance and resistance is most closely approximated (in theory, given exactly) by the slowest τ coefficient τ0 (Holmes et al. 1992; Major et al. 1993), and C is calculated not from C = τ0/RN but from C = τ0/R0 = −Iτ0/A0 (Major et al. 1993).
This analysis depends on either the neuron having only passive membrane responses or any voltage-dependent phenomena in it having dynamics faster than the passive membrane response, as otherwise the slowest term may reflect the dynamics of the slow voltage-dependent phenomena, not the passive membrane response. In the past, achieving this goal has been attempted by performing current steps from relatively negative membrane potentials (typically −50 mV), on the assumption that most depolarization-activated conductances will be inactive in this membrane potential range, and by blocking the hyperpolarization-activated current Ih with cesium (see, e.g., Golowasch et al. 2009). However, to our knowledge whether neuron responses under these conditions are nonetheless contaminated by voltage-dependent phenomena has not been tested.
To assess this possibility, we applied current pulses to PY and LP neurons of the lobster stomatogastric ganglion, in saline containing CsCl to block Ih (Hartline and Graubard 1992), from multiple membrane potentials (Vssc) achieved by bias current injection. These potentials included the −50 to −60 mV range used in previous work measuring PY neuron capacitance (Golowasch et al. 2009). The amplitude of the voltage responses of the neurons to identical current steps changed considerably as Vssc was varied from −95 mV to −50 mV (Fig. 2), indicating that RN changed in this voltage range (in the example shown, increasing from 1.6 to 2.2 MΩ, some 37.5%; Fig. 3). A likely source of this RN change was changes in voltage-dependent currents. Because RN measurement does not measure response dynamics, this alone did not show that these currents are affecting capacitance estimation (e.g., if the currents change quickly, they would not alter C estimation), but they did indicate that this possibility exists. Note also that these RN changes were not due to unblocked Ih, since Ih would decrease, not increase, RN at more hyperpolarized membrane potentials.
PY and LP neuron membrane voltage responses to current steps were well fit by a sum of exponentials. Figure 4 shows responses to identical hyperpolarizing current steps from two Vssc. When current steps were applied at Vssc more hyperpolarized than about −60 mV, the voltage responses monotonically increased (Fig. 4A). Note the lack of a sag voltage during the step, demonstrating again the complete block of Ih. The three fit line components had well-separated time constants; the slowest would represent neuron capacitance in the standard approach. When current steps were applied at Vssc more depolarized than about −60 mV, the voltage responses were no longer monotonic but instead showed a late depolarization (Fig. 4B) associated with a sign change in the amplitude of the slowest exponential fit term. Because capacitance is a passive phenomenon, voltage responses must have the same sign as the charging current. Thus the late depolarization, and the slowest exponential fit term, cannot be attributed to neuron capacitance. Because the slowest exponential term in Fig. 4B is not due to capacitance, it follows that the slowest term in Fig. 4A may not be either.
Another possible source of the slow responses in both cases would be a slow, depolarization-activated, voltage-dependent conductance. The slow hyperpolarization in Fig. 4A is consistent with a depolarizing membrane current that slowly deactivates in response to the hyperpolarizing current step, and the slow depolarization in Fig. 4B is consistent with a hyperpolarizing membrane current that slowly deactivates in response to the current step, with the switch in current direction being due to the Vssc crossing the current's reversal potential. Consistent with this hypothesis, in the data from all steps in this neuron, A0, the amplitude coefficient of the slowest exponential term (Fig. 5), continuously decreased as Vssc was depolarized from −100 mV, crossing zero at Vssc around −50 mV, and then becoming negative at more depolarized Vssc. Negative R0 values cannot occur for a passive resistive element, as it implies that positive current applied to the resistor would give a negative voltage across it. Negative R0 values are, however, consistent with the hypothesis of a depolarization-activated voltage-dependent conductance.
Fig. 5.
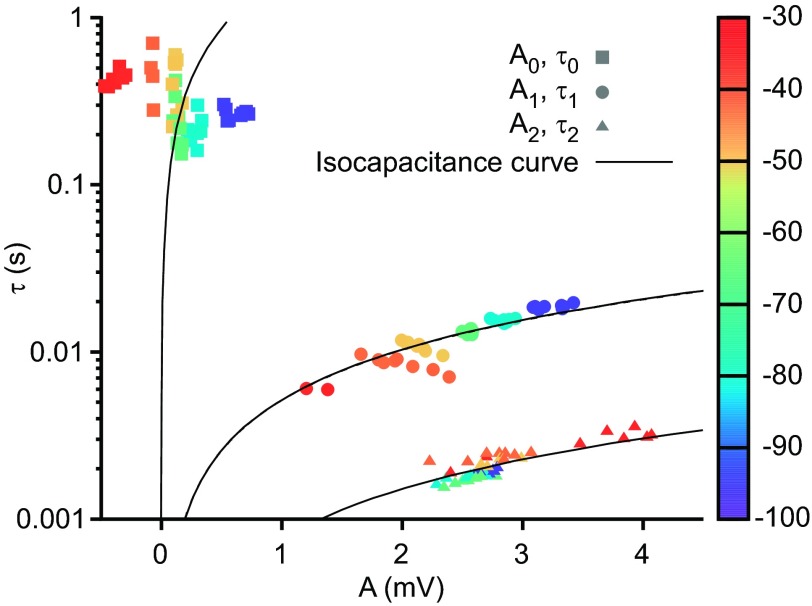
τ and A coefficients from neuron LP2's fitted exponential terms, colored by Vssc (color scale bar, right). Slow, medium, and fast exponential terms are represented by squares, circles, and triangles, respectively. Isocapacitance curves (curved black lines) for each temporal class were generated from τ = AC/Ipulse, where C is the mean of the capacitive coefficients within each class (see materials and methods). The failure of the slow term class (τ0 and A0) data to lie on their corresponding isocapacitance line, and A0 becoming negative at Vssc around −50 mV, suggests the presence of a voltage-dependent process.
This decrease in A0 at Vssc near the apparent reversal potential of −50 mV would be expected to result in A0 sometimes becoming too small to fit successfully, and fits in this membrane voltage range indeed sometimes required only two terms, with three-term fits not yielding significant improvement by F-test. Examination of the time constants of the three-term and two-term exponential fits showed that, as expected, in the two-term cases it was the slowest term of the three-term fits that was missing. In the two-term fits the two terms were therefore placed in the middle and fastest term classes. As there was no overlap between the τ0 (∼0.2 s), τ1 (∼0.02 s), and τ2 (∼0.002 s) classes, this classification was unambiguous.
During the 60-s equilibrating time after setting a new Vssc, the hypothesized slow conductance would open or close and assume a new steady-state activation value by the time the current pulses began. A0 would thus reflect only the change in the voltage-dependent current in response to the roughly 10-mV membrane potential changes occurring during the current pulses themselves. With the hyperpolarizing current step at the beginning of the pulse, the conductance would close slightly, causing a hyperpolarization at Vssc more hyperpolarized than the conductance's reversal potential and a depolarization at Vssc more depolarized than the conductance's reversal potential. With the depolarizing step back to Vssc, the conductance would open slightly, yielding the opposite effects. Importantly, since the hypothesis is that the current opens and closes more slowly than the capacitive time constant of the neuron, the slowest exponential term (A0 and τ0) would thus not represent neuron capacitance.
The changes in the amount of the conductance that was open during the 60-s equilibrating phase would change the neuron's resistance, increasing it at more hyperpolarized Vssc. In addition to making A0 and τ0 voltage dependent as explained above, this change in neuron resistance would also be expected to change the A1 and τ1 coefficients (which under this hypothesis would represent true neuron capacitance) because of their dependence on neuron resistance. A1 and τ1 indeed both decreased as Vssc varied from −95 mV to −30 mV, A1 from ∼3.5 mV to ∼1 mV and τ1 from ∼0.02 s to ∼0.006 s (Fig. 5). Changes in neuron resistance would also likely change the A2 and τ2 coefficients, which represents neuron settling response as current spreads throughout the neuron's dendritic tree, although predicting the effect this should have on A2 and τ2 is difficult (Major et al. 1993).
A slow voltage-dependent conductance would therefore be predicted not only to introduce a noncapacitive slowest A0/τ0 term in the multiexponential fits but also to cause voltage-dependent changes in the A1/τ1 term from which neuron resistance and capacitance should be calculated and the A2/τ2 term that represents current spread throughout the dendritic tree. Importantly, however, true neuron capacitance should be constant as membrane potential changes. Since at all Vssc the same current pulse amplitude (I) was injected, it follows from the relationship Ci = −Iτi/Ai, and hence τi = −CiAi/I, that for a constant Ci τ and A should be linearly related. We tested this prediction for each Ai/τi class by calculating the mean of each term's Ci coefficients across all pulse trains at all Vssc and using this mean to plot isocapacitance lines for each mean Ci value (Fig. 5). The data points for the A1 and τ1 and A2 and τ2 terms closely followed linear relationships (lines are curved because plot is semilogarithmic). The A0 and τ0 data points, alternatively, did not, further supporting the hypothesis that the A0/τ0 term represents a noncapacitive phenomenon.
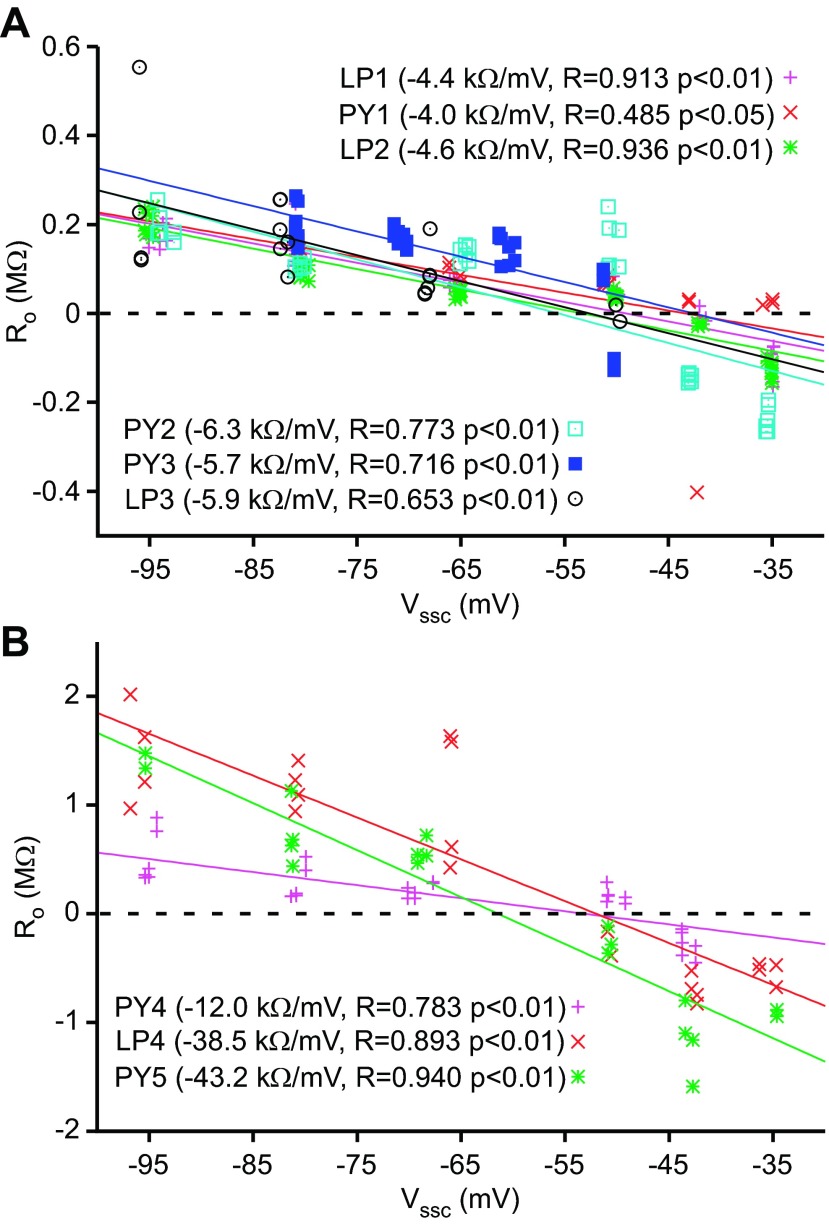
Using τi and Ai to calculate each term's resistive and capacitive coefficients gave results consistent with the data in Fig. 5 and the hypothesis presented above. With respect to resistance, R0 (Fig. 6A) decreased and then became negative as Vssc was depolarized, crossing a reversal potential at about −50 mV. R1 and R2 varied linearly with Vssc but always remained positive. At very depolarized Vssc, where A0 becomes negative, calculated C0 becomes negative, impossible for a true capacitance. We therefore plotted Ci values only for Vssc more hyperpolarized than −45 mV. Because of the very large differences between the Ci coefficients, we present these data in both linear (Fig. 6B) and semilogarithmic (Fig. 6C) plots. C0 depended strongly on Vssc, varying from ∼1,500 nF at −95 mV to 10,500 nF at −47.5 mV (some 6-fold). C1 and C2 varied much less, each changing by ∼10% of their mean values.
The data in Figs. 2–6 are from a single LP neuron. In experiments on three other LP neurons and five PY neurons, the slowest fit terms were again not due to neuron passive membrane properties but instead to a phenomenon consistent with slow voltage-dependent conductances. All neurons showed voltage-dependent variations in RN (Fig. 7; divided for clarity into 2 panels because of the large RN variation across the neurons). Importantly, in almost all cases RN changed with hyperpolarization in the −50 to −60 mV range at which capacitance measurements are typically made. These RN changes are consistent with residual voltage-dependent conductances active in this voltage range (see discussion), which could interfere with capacitance measurements.
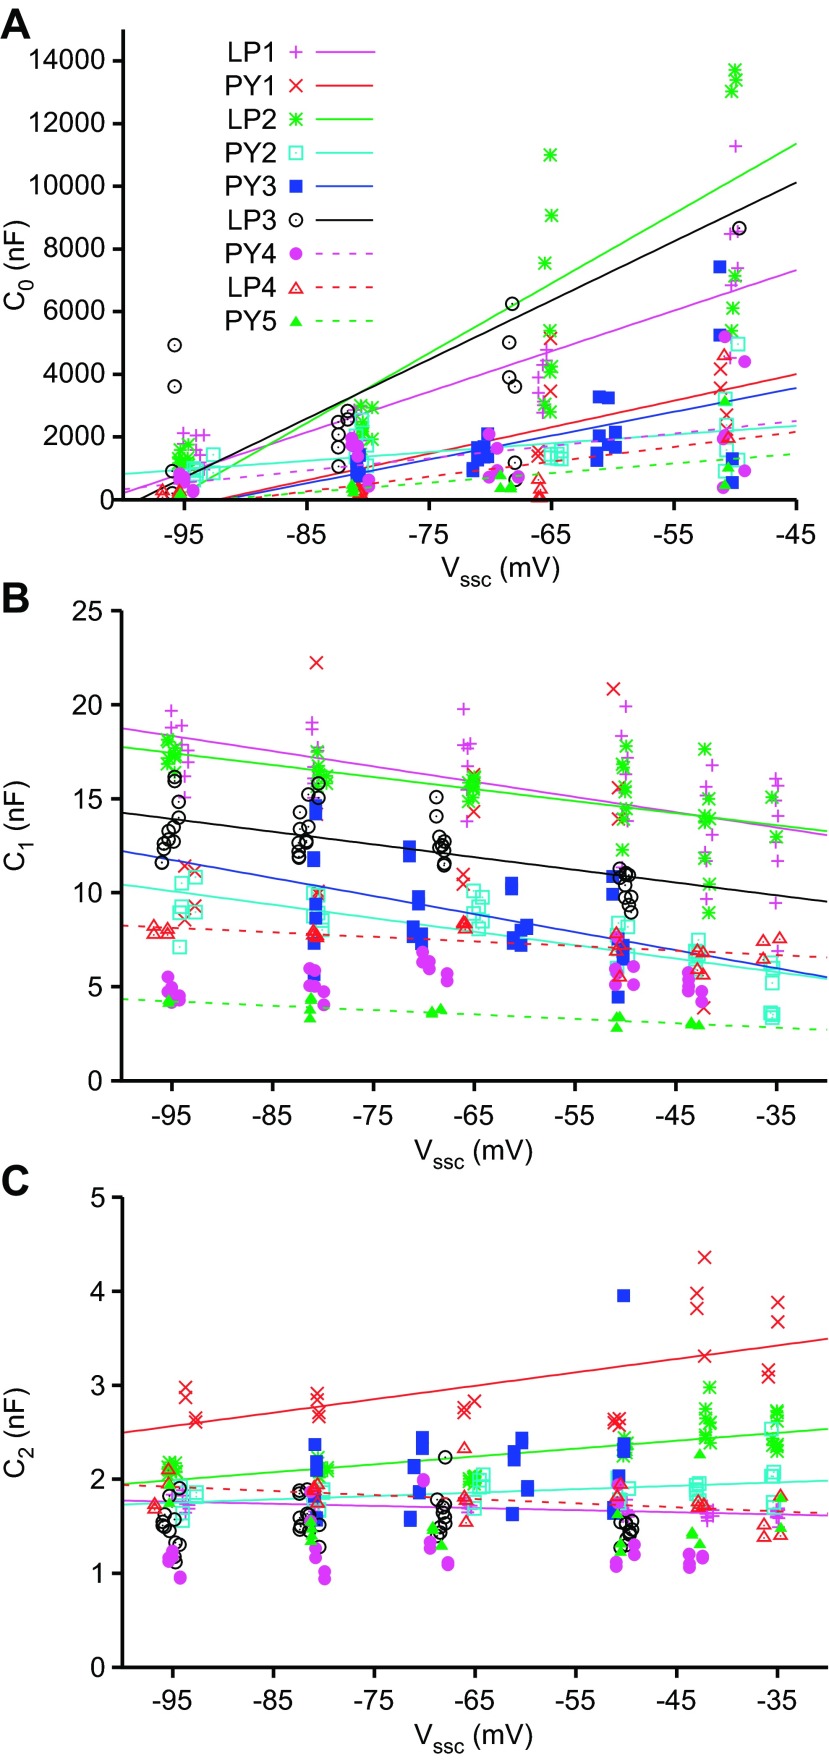
Fits to the charging curves of these neurons again showed three τ classes, one around 0.2 s, a second around 0.02 s, and a third around 0.002 s, and A0 values that decreased with depolarization and eventually became negative (data not shown). The resulting R0 sign changes occurred between −42.6 mV and −61.5 mV (−51.4 ± 5.85 mV, mean ± SD), consistent with a conductance reversing at these potentials (Fig. 8, again grouped by neuron RN as in Fig. 7). C0 again showed large voltage dependence in all neurons (Fig. 9). These variations were significant for all neurons, and the slopes of the fits differed from zero (Tables 1–3). C1 and C2 showed much smaller changes, both in absolute variation and relative to the mean values of the coefficients. The C1 variations were significant for all neurons, and the slopes of the fits differed from zero. Four of the nine neurons did not show a significant dependence of C2 on Vssc, and the slopes of the significant C2 fits did not differ from zero.
Fig. 8.
R0 vs. Vssc for all neurons, separated into low (A)- and high (B)-RN groups. Significant linear fits were found for all neurons. R0 sign changed around −50 mV in all neurons, suggesting a reversal potential.
Fig. 9.
C0 (A), C1 (B), and C2 (C) vs. Vssc for all neurons. Linear fits are shown where significant (P < 0.05). Because R0 became negative at Vssc more depolarized than −50 mV, the C0 terms at these depolarized Vssc values are not shown and were not used in the fits.
Table 1.
Capacitive coefficient C0
| Slope, nF/mV | %/mV | R0 | P < | |
|---|---|---|---|---|
| LP1 | 129 | 2.4 | 0.850 | 0.01 |
| LP2 | 223 | 4.3 | 0.812 | 0.01 |
| LP3 | 200 | 5 | 0.635 | 0.01 |
| LP4 | 47.4 | 7.8 | 0.625 | 0.02 |
| PY1 | 84.6 | 2.8 | 0.620 | 0.05 |
| PY2 | 27.9 | 2 | 0.499 | 0.02 |
| PY3 | 76.1 | 4.2 | 0.548 | 0.01 |
| PY4 | 39.5 | 2.9 | 0.540 | 0.01 |
| PY5 | 30.8 | 6 | 0.600 | 0.05 |
| All | 95.4 | 0.005 | ||
| LP | 150 | 0.05 | ||
| PY | 51.8 | 0.02 |
For each fitted exponential term, a linear fit (C = m • Vssc + b) was made to the voltage dependence of the capacitive coefficients (intercepts not shown), with slope additionally expressed as change relative to the mean of the capacitive coefficients (%/mV).
Table 2.
Capacitive coefficient C1
| Slope, nF/mV | %/mV | R1 | P < | |
|---|---|---|---|---|
| LP1 | −0.0816 | −0.52 | 0.612 | 0.01 |
| LP2 | −0.064 | −0.41 | 0.651 | 0.01 |
| LP3 | −0.0658 | −0.53 | 0.630 | 0.01 |
| LP4 | −0.0242 | −0.33 | 0.607 | 0.01 |
| PY1 | NS | |||
| PY2 | −0.0717 | −0.94 | 0.778 | 0.01 |
| PY3 | −0.096 | −1.1 | 0.452 | 0.01 |
| PY4 | NS | |||
| PY5 | −0.0233 | −0.66 | 0.846 | 0.01 |
| All | −0.0609 | 0.002 | ||
| LP | −0.0589 | 0.02 | ||
| PY | −0.0637 | NS |
For each fitted exponential term, a linear fit (C = m • Vssc + b) was made to the voltage dependence of the capacitive coefficients (intercepts not shown), with slope additionally expressed as change relative to the mean of the capacitive coefficients (%/mV). NS, not significant.
Table 3.
Capacitive coefficient C2
| Slope, nF/mV | %/mV | R2 | P < | |
|---|---|---|---|---|
| LP1 | −0.00226 | −0.13 | 0.624 | 0.01 |
| LP2 | 0.00837 | 0.37 | 0.726 | 0.01 |
| LP3 | NS | |||
| LP4 | −0.00435 | −0.24 | 0.460 | 0.05 |
| PY1 | 0.0143 | 0.582 | 0.01 | |
| PY2 | 0.00362 | 0.19 | 0.447 | 0.01 |
| PY3 | NS | |||
| PY4 | NS | |||
| PY5 | NS | |||
| All | 0.00393 | NS | ||
| LP | 0.000586 | NS | ||
| PY | 0.00895 | NS |
For each fitted exponential term, a linear fit (C = m • Vssc + b) was made to the voltage dependence of the capacitive coefficients (intercepts not shown), with slope additionally expressed as change relative to the mean of the capacitive coefficients (%/mV).
R0 crossing zero (Fig. 8) and the large variation in C0 (Fig. 9A) are inconsistent with this term of the exponential fits representing true R and C. The R1/C1 coefficients, as the next slowest component, more likely represent these parameters. However, C1 nonetheless showed a slight voltage dependence, which might not be expected for true R/C values. To investigate this issue under completely controlled conditions, we constructed ball and stick (nonisopotential) and single-compartment (isopotential) models in NEURON. These models included a slow, depolarization-activated conductance with a reversal potential near −50 mV, consistent with the experimental data. The models reproduced all salient features of the experimental data. In particular, their RN increased with hyperpolarization (Fig. 10A, data from ball and stick model). In the ball and stick model, fits to the voltage responses produced three exponential terms with τ values near 0.2, 0.02, and 0.001 s. The slowest term did not follow an isocapacitance curve, but the second slowest did (the third having too little variation to assess) (Fig. 10B). In both the ball and stick (Fig. 10C) and isopotential (Fig. 10D) models, the second-slowest capacitive coefficient (C1) showed a voltage dependence with a slight negative slope, consistent with the experimental data. As C is known in these models (ball and stick, 9.4 nF; isopotential, 7.8 nF), it is clear that the second-slowest capacitive term represents neuron capacitance. Thus these data show that in neurons with contaminating slow voltage-dependent conductance(s), these conductances add slight voltage dependence to the coefficient representing true neuron capacitance. Notably, C1 equals C near the reversal potential of the slow conductance. This suggests that, in neurons with such conductances, capacitance measurement should be made at the conductance's reversal potential.
On the basis of these model observations, we calculated C in real neurons (Table 4) in two ways. For neurons in which C1 significantly varied with membrane potential, we took as capacitance the values of the C1 coefficient linear fits (Fig. 9B) at the membrane potential at which R0 crossed zero (R0's reversal potential; Fig. 8). For neurons in which C1 did not significantly vary with membrane potential, we used the mean of the C1 values measured at membrane potentials closest to the R0 zero-crossing. Mean PY neuron C was 5.4 ± 1.7 nF (0.0060 ± 0.0019 cm2) and mean LP neuron C was 12 ± 3.6 nF (0.013 ± 0.0040 cm2) [in both cases assuming a specific capacitance of 0.9 μF/cm2 (Gentet et al. 2000)]. PY and LP neuron mean C, and thus mean areas, differed at P < 0.05 (Student's t-test with unequal variance assumed), consistent with optical measurements showing that PY neurons are smaller than LP neurons (Thuma et al. 2009).
Table 4.
Neuron capacitances and areas
| R0 = 0, mV | C, nF | Area, cm2 | |
|---|---|---|---|
| LP1 | −49.1 | 14.6 | 0.0163 |
| LP2 | −53.3 | 14.8 | 0.0164 |
| LP3 | −52.2 | 11 | 0.0123 |
| LP4 | −52 | 7.1 | 0.00788 |
| PY1 | −43.4 | 3.87 | 0.0043 |
| PY2 | −55.6 | 7.26 | 0.00806 |
| PY3 | −42.6 | 6.72 | 0.00746 |
| PY4 | −53.1 | 5.93 | 0.00659 |
| PY5 | −61.5 | 3.44 | 0.00382 |
| All | −51.4 | 8.3 ± 4.2 | 0.0092 |
| LP | −51.6 | 11.9 ± 3.6 | 0.0132 |
| PY | −51.2 | 5.4 ± 1.7 | 0.006 |
The Vssc at which R0 crossed 0 (R0 = 0) was calculated from linear fits to the R0 coefficients (Fig. 8). Where C1 linear fits were significant (P < 0.05), neuron capacitance (C) estimates were taken from the value of the fitted line at this R0 = 0 potential; otherwise, the mean of all C1 values at Vssc closest to the R0 = 0 potential were used. Area estimates were made assuming a specific capacitance of 0.9 μF/cm2 (Gentet et al. 2000).
Possible alternative explanations.
The slow voltage-dependent phenomenon observed here could be an artifact of the fitting procedure. We tested this possibility by generating artificial data analogous to the curves shown in Fig. 4 including noise but without a slow component. The fitting procedures found no slow component in these data. The phenomenon could also arise from electrical artifacts arising from the electrometer, reference electrode, or microelectrodes. We tested this possibility by repeating the experiments using an electronic model cell connected, via agar bridges, to the reference and microelectrodes. Fits to these data again found no slow voltage-dependent terms. The data reported here are thus not due to fitting or experimental capacitive artifacts.
The slow component could also arise from a slow continuous drift in membrane potential. Within each individual pulse, such a drift would add to the membrane potential change induced by the current pulse. If large enough, the fitting procedure would fit this slow change with an exponential term. If this were the case, since the direction of the drift would be the same in the hyperpolarizing and relaxing phases of the step, the sign of the slow term amplitude coefficient A0, and thus R0, would reverse between these phases. Except when the voltage changes induced by the current steps straddled the slow component's reversal potential (e.g., the blue squares at Vssc = −55 mV), the R0 values of the fits to these two phases instead always had the same sign (Fig. 8). The slow component is therefore not due to a slow continuous membrane potential drift.
DISCUSSION
We have shown that pyloric neurons contain a slow, voltage-dependent phenomenon that complicates current clamp-based measurement of neuron capacitance by appearing as the slowest term in multiexponential fits. This phenomenon had an apparent reversal potential and was associated with changes in RN, features consistent with voltage-dependent conductances. The second-slowest term, presumably representing true neuron capacitance, was also slightly voltage dependent. Computational modeling demonstrated that the true capacitance term of model neurons possessing a slow voltage-dependent conductance showed similar voltage dependence. These data indicate that in pyloric neurons the second-slowest term represents neuron capacitance. In general, however, the capacitive term will not necessarily be the second-slowest. The characteristic that identifies the capacitive term is instead that it is the slowest term without appreciable voltage dependence.
Past current clamp-based measurements of neuron capacitance in this and other systems (Arsenault et al. 2011; Firestein and Werblin 1987; Golowasch et al. 2009; Liao and Lee 2011; Roth and Häusser 2001; Szabo et al. 2010) were made at single membrane potentials on the assumption that no voltage-dependent processes were active at these potentials (i.e., without checking for voltage dependence) and always used the slowest term of the exponential fits, even in cases in which, as here, good fits to a single neuron's membrane voltage responses sometimes required two, and other times three, terms. Our data show that this treatment is incorrect for pyloric neurons and suggest that capacitance measurements in other systems could be similarly compromised. Given the importance of capacitance in neuron activity (Fig. 1), such errors in capacitance may be a major cause of the failure of many “data-based” models to reproduce the activities of the very neurons from which the model parameters were obtained.
Comparison to standard technique.
It is illuminating to consider what happens when the standard current-clamp capacitance measurement technique is applied to our data. Measurements are typically performed at a Vssc of −50 mV. Because this is near the reversal potential of the slow, voltage-dependent phenomenon described here, at this Vssc the contribution of the phenomenon is so small that often only two-term fits are obtained. The capacitive coefficient calculated from the slowest term in these two-term fits therefore correctly represents neuron capacitance. When three-term fits are required, however, the capacitive coefficient of the slowest term reflects the dynamics of the slow voltage-dependent phenomenon. Averaging the C0 coefficients from the two- and three-term fits would therefore yield an erroneously high capacitance estimate with a large coefficient of variance.
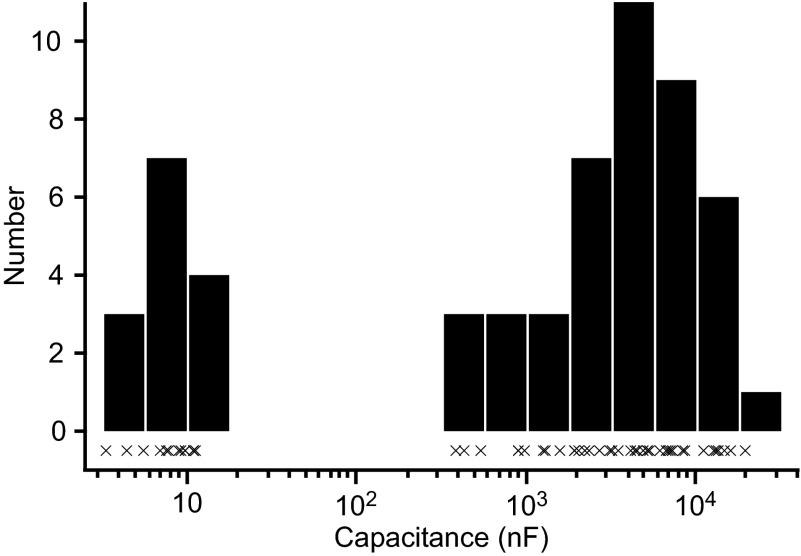
Applying the standard measurement technique to the data across all our neurons, but only from the pulse trains at Vssc = −50 mV, confirmed this prediction. In the LP neurons, significant three-term fits were obtained in 17 of 22 measurements, with the remaining being two-term fits. In the PY neurons, significant three-term fits were obtained in 19 of 24 measurements. Calculating capacitance with the slowest terms from both two- and three-term fits gave a mean capacitance of 6,697 ± 5,504 (SD) nF in LP neurons, and 1,954 ± 1,962 nF in PY neurons. These capacitance estimates differ from those obtained with our technique in two ways. First, they are some 550 (LP)- and 350 (PY)-fold larger than our estimates of 11.9 ± 3.6 nF (LP) and 5.4 ± 1.7 nF (PY), respectively (Table 4). Second, their coefficients of variation, 0.8 (LP) and 1.0 (PY), are larger than our 0.3 (both LP and PY). These large coefficients of variation arise from the standard method treating the slowest terms of the two- and three-term exponential fits as equivalent. Binning confirmed the presence of two distinct capacitive coefficient classes (Fig. 11). As expected, all low capacitance measurements came from two-term fits and all high capacitance measurements from three-term fits.
Fig. 11.
Bimodal distribution of “naive” neuron capacitance estimates. Data from Vssc = −50 mV were used, as is typical in standard current-clamp capacitance measurement methods. Charge curves were fit to 2- or 3-term exponential fits, whichever was necessary to meet our fitting procedure error standards (see materials and methods). The slowest term of the fits was used regardless of the temporal class to which the term belonged. The × symbols represent the capacitances of each fit; the bars are the data divided into 16 bins. Two populations are clearly present. The smaller population was from the 2-exponential fits, in which the amplitude of the slow, voltage-dependent phenomenon was too small for the fitting procedure to find. The larger population was from the 3-exponential fits, in which the phenomenon's amplitude was large enough to be fit.
Comparison to prior pyloric work.
The good fits to the voltage responses (Fig. 4) and relative isocapacitance of the middle and fastest terms (Fig. 5, Fig. 6, B and C, Fig. 9, B and C), agree with the primary conclusion of Golowasch et al. (2009) that current-clamp techniques measure neuron capacitance well. However, our data indicate that proper use of this technique requires performing it at multiple membrane potentials in order to identify which exponential term correctly represents R and C. Failure to do so can lead to hundredfold overestimates of capacitance and large coefficients of variation. Prior current-clamp estimates of pyloric neuron capacitance using the standard technique reported capacitance measurements hundreds of times larger than those expected from anatomical data, with coefficients of variation between 0.6 and 1 (Golowasch et al. 2009). A retrospective analysis examining these data for multimodal capacitance distributions (Fig. 11) would help resolve whether they are compromised. However, as individual data points were not provided in this work, we were unable to perform this analysis.
Even with correct term identification, our estimates of pyloric neuron surface area of 0.006 (PY) to 0.01 (LP) cm2 are still two to three times larger than the largest surface areas of dye-filled lobster pyloric neurons (0.003 cm2, data from our lab; see Thuma et al. 2009). However, dye fills are likely to be incomplete, particularly for small fibers, and stomatogastric neurons possess processes whose diameter is below optical resolution (King 1976a, 1976b). Given these difficulties, this discrepancy is not unreasonable.
Nature of slow voltage-dependent phenomenon.
We have treated this phenomenon as if it were a noninactivating, depolarization-activated, slowly opening conductance. Given R0's reversal and the voltage-dependent RN changes, this treatment is not unreasonable. However, these data are not evidence that the slow phenomenon is a single conductance, and we are unaware of any conductance with the properties found in the NEURON model optimization (Table 5). An alternative explanation arises from the fact that the activation curves of multiple stomatogastric neuron conductances (persistent sodium, two calcium, the delayed rectifier, the calcium-activated potassium, and the A conductance) all begin to open at membrane potentials more hyperpolarized than −75 mV (Prinz et al. 2003; Turrigiano et al. 1995). In the voltage ranges used here these conductances show little inactivation, and their kinetics of activation and inactivation are slow. The steady-state values of these conductances over the voltages used here are small, but for calcium and sodium currents the driving forces are large, and the fitting process reliably identifies small amplitude terms. Additionally, many neurons possess ion channels with very slow inactivation kinetics, e.g., the dendrotoxin-sensitive Kv1.2 potassium channel (Shen et al. 2004). Similar channels could contribute to the identified ionic conductances in pyloric neurons. The slow voltage-dependent phenomenon we have identified here thus likely arises from the sum of the small, but not zero, currents flowing through these conductances even at the hyperpolarized membrane voltages used here. It is also important to stress that the voltage dependencies of stomatogastric neuron conductances are not different from those typically observed in other neurons. These considerations thus suggest that the difficulties in measuring neuron capacitance that we have identified here likely apply across preparations.
Table 5.
Optimized NEURON model parameters
| Parameter | Isopotential | Ball and Stick |
|---|---|---|
| Esr | −58 mV | −60 mV |
| V | −43 mV | −12.3 mV |
| k | 16.8 mV | 22.1 mV |
| m0 | 0.09 (unitless) | 0.03 (unitless) |
| Eleak | −68 mV | −68 mV |
| Soma ḡsr | 0.24 mS/cm2 | 0.63 mS/cm2 |
| Soma ḡleak | 0.04 mS/cm2 | 0.04 mS/cm2 |
| Soma cm | 5 μF/cm2 | 15.25 μF/cm2 |
| Soma dimensions | 50 μm long, 1,000-μm diameter | 50 μm long, 50-μm diameter |
| Cable ḡleak | 0.5 mS/cm2 | |
| Cable cm | 5 μF/cm2 | |
| Cable dimensions | 200 μm long, 10-μm diameter | |
| Distal ḡsr | 0.8 mS/cm2 | |
| Distal ḡleak | 0.015 mS/cm2 | |
| Distal cm | 5 μF/cm2 | |
| Distal dimensions | 50 μm long, 1,000-μm diameter |
See materials and methods for model equations. Axial resistance (Ra) = 35.4 Ω cm in both models.
The one conductance the slowest term cannot arise from is unblocked Ih, as with the Vssc used here Ih would induce a depolarizing sag at hyperpolarized Vssc and a hyperpolarizing sag at depolarized Vssc. The actual effect of the slow component was precisely opposite (Fig. 4).
Remaining limitations in current clamp-based method of capacitance estimation.
We have identified a major potential problem in the most appropriate capacitive measurement technique for most neurons (Golowasch et al. 2009) and provided a solution: sort the time constants of the multiple exponential fits into classes, identify which classes are voltage independent, and calculate neuron capacitance from the slowest voltage-independent class. Although this will generally work well, there remains one case that, to our knowledge, cannot be overcome electrically. If a voltage-dependent phenomenon exists, but its time constant is very similar to the time constant of the true capacitive term across the Vssc range (e.g., if the data points in Fig. 5, top left, had τ values around 0.01 instead of 0.5), then the fitting algorithm will not separate the two terms. Instead, it will fit the sum of these two changes with a single exponential term. In Fig. 5, this would result in the A1 red and orange points being shifted left and the purple, blue, and green points being shifted right.
In pyloric neurons, the amplitude of the voltage-dependent phenomenon is so small that such shifts would change the A1/τ1 curve, and the voltage dependence of the R1 points in Fig. 6C, only slightly (the R0 points would disappear, having been subsumed into the sum described above). If A0 were large, however, the R1 points in Fig. 6C would show a large voltage dependence and hence be rejected. The slowest of the settling time constants would therefore be identified as representing neuron capacitance. This would substantially underestimate capacitance, giving a neuron capacitance of ∼2 nF, some fivefold lower than our estimate of ∼10 nF (Table 4). However, using the slowest, but voltage-dependent, term, in which A would reflect both capacitor charging and the voltage-dependent process, would also lead to substantial capacitance estimate errors. Thus, in the unlikely event that a neuron possesses a large-amplitude (relative to the voltage response due to neuron capacitance) voltage-dependent phenomenon whose time constant is close to the neuron charging time constant, neither our nor any similar capacitance measurement technique will yield accurate results.
Implications for correct capacitance estimations and summary.
In choosing among competing methods for capacitance measurement, two sources of error must be considered. The first is current flow among dendritic processes in nonisopotential neurons. The second is the presence of slow, voltage-dependent phenomena, as identified here. Generally speaking, methods that separate different dynamic components of the neuron response are more robust to nonisopotentiality at the expense of susceptibility to error from residual voltage-dependent phenomena. Voltage-clamp methods using step or ramp voltage changes are less accurate than current-clamp methods for nonisopotential neurons (Golowasch et al. 2009). However, because they rely on the total amplitude of the clamp currents, the error introduced by slow, voltage-dependent current should scale approximately with the current's amplitude (Taylor 2012). Voltage-clamp methods based on sinusoidal driving (Gillis 1995) are similarly susceptible to nonisopotentiality errors but again robust to slow, voltage-dependent currents provided they are small in amplitude. Where accurate neuron morphology is known, a final method is optimizing multicompartmental neuron model membrane parameters with experimental data (Roth and Häusser 2001). This technique, though computationally demanding, will work well provided the morphological description is accurate and the membrane is passive but introduces error that scales with slow, voltage-dependent current amplitude.
Given the difficulties in obtaining accurate neuron morphologies, and the fact that most neurons are nonisopotential, these considerations are in agreement with Golowasch et al. (2009) that current-clamp methods are optimal in most cases. However, these methods can give highly erroneous capacitive estimates when slow voltage-dependent phenomenon are present. Because even very small amplitude processes can be reliably identified with multiexponential fits, these concerns apply even when slow phenomena contribute little to total membrane response. Correct current-clamp based estimation of neuron capacitance should therefore be performed at multiple membrane potentials to look for changes in input resistance, voltage dependence of putative capacitance parameters, and evidence of reversal of the associated amplitude coefficient. The slowest term without these phenomena, measured at potentials where their contaminating influence is least (e.g., the reversal potential of slow voltage-dependent phenomenon), should be used to estimate capacitance.
GRANTS
This research was supported by National Institute on Drug Abuse Grant RC1 DA-028494.
DISCLOSURES
No conflicts of interest, financial or otherwise, are declared by the author(s).
AUTHOR CONTRIBUTIONS
Author contributions: W.E.W. and S.L.H. conception and design of research; W.E.W. performed experiments; W.E.W. analyzed data; W.E.W. and S.L.H. interpreted results of experiments; W.E.W. and S.L.H. prepared figures; W.E.W. drafted manuscript; W.E.W. and S.L.H. edited and revised manuscript; W.E.W. and S.L.H. approved final version of manuscript.
ACKNOWLEDGMENTS
We thank J. B. Thuma for performing the dissections, initial experimental setup, and neuron identification; R. A. DiCaprio for noting the large standard deviations present in some prior current clamp-based capacitance estimation work; and R. A. DiCaprio, K. H. Hobbs, and J. B. Thuma for comments on the manuscript.
REFERENCES
- Arsenault D, Julien C, Tremblay C, Calon F. DHA improves cognition and prevents dysfunction of entorhinal cortex neurons in 3xTg-AD mice. PLoS One 6: e17397, 2011 [DOI] [PMC free article] [PubMed] [Google Scholar]
- Bollen KA, Jackman R. Regression diagnostics: an expository treatment of outliers and influential cases. In: Modern Methods of Data Analysis, edited by Fox J, Long JS. Newbury Park, CA: Sage, 1990, p. 257–291 [Google Scholar]
- Firestein S, Werblin FS. Gated currents in isolated olfactory receptor neurons of the larval tiger salamander. Proc Natl Acad Sci USA 84: 6292–6296, 1987 [DOI] [PMC free article] [PubMed] [Google Scholar]
- Gentet LJ, Stuart GJ, Clements JD. Direct measurement of specific membrane capacitance in neurons. Biophys J 79: 314–320, 2000 [DOI] [PMC free article] [PubMed] [Google Scholar]
- Gillis KD. Techniques for membrane capacitance measurements. In: Single-Channel Recording, edited by Sakmann B, Neher E. New York: Springer, 1995, p. 155–198 [Google Scholar]
- Golowasch J, Thomas G, Taylor AL, Patel A, Pineda A, Khalil C, Nadim F. Membrane capacitance measurements revisited: dependence of capacitance value on measurement method in nonisopotential neurons. J Neurophysiol 102: 2161–2175, 2009 [DOI] [PMC free article] [PubMed] [Google Scholar]
- Haedo RJ, Golowasch J. Ionic mechanisms underlying recovery of rhythmic activity in adult isolated neurons. J Neurophysiol 96: 1860–1876, 2006 [DOI] [PMC free article] [PubMed] [Google Scholar]
- Hartline DK, Graubard K. Cellular and synaptic properties in the crustacean stomatogastric nervous system. In: Dynamic Biological Networks: The Stomatogastric Nervous System, edited by Harris-Warrick RM, Marder E, Selverston AI, Moulins M. Cambridge, MA: MIT Press, 1992, p. 31–86 [Google Scholar]
- Holmes WR, Segev I, Rall W. Interpretation of time constant and electrotonic length estimates in multicylinder or branched neuronal structures. J Neurophysiol 68: 1401–1420, 1992 [DOI] [PubMed] [Google Scholar]
- Iwasaki S, Chihara Y, Komuta Y, Ito K, Sahara Y. Low-voltage-activated potassium channels underlie the regulation of intrinsic firing properties of rat vestibular ganglion cells. J Neurophysiol 100: 2192–2204, 2008 [DOI] [PubMed] [Google Scholar]
- Khorkova O, Golowasch J. Neuromodulators, not activity, control coordinated expression of ionic currents. J Neurosci 27: 8709–8718, 2007 [DOI] [PMC free article] [PubMed] [Google Scholar]
- King DG. Organization of crustacean neuropil. I. Patterns of synaptic connections in lobster stomatogastric ganglion. J Neurocytol 5: 207–237, 1976a [DOI] [PubMed] [Google Scholar]
- King DG. Organization of crustacean neuropil. II. Distribution of synaptic contacts on identified motor neurons in lobster stomatogastric ganglion. J Neurocytol 5: 239–266, 1976b [DOI] [PubMed] [Google Scholar]
- Liao CC, Lee LJ. Evidence for structural and functional changes of subplate neurons in developing rat barrel cortex. Brain Struct Funct 217: 275–292, 2011 [DOI] [PubMed] [Google Scholar]
- Major G, Evans JD, Jack JJ. Solutions for transients in arbitrarily branching cables. I. Voltage recording with a somatic shunt. Biophys J 65: 423–449, 1993 [DOI] [PMC free article] [PubMed] [Google Scholar]
- Pineda RH, Knoeckel CS, Taylor AD, Estrada-Bernal A, Ribera AB. Kv1 potassium channel complexes in vivo require Kvbeta2 subunits in dorsal spinal neurons. J Neurophysiol 100: 2125–2136, 2008 [DOI] [PMC free article] [PubMed] [Google Scholar]
- Prinz AA, Billimoria CP, Marder E. Alternative to hand-tuning conductance-based models: construction and analysis of databases of model neurons. J Neurophysiol 90: 3998–4015, 2003 [DOI] [PubMed] [Google Scholar]
- Provencher SW, Vogel RH. Information loss with transform methods in system identification: a new set of transforms with high information content. Math Biosci 50: 251–262, 1980 [Google Scholar]
- Rall W. Core conductor theory and cable properties of neurons. In: Handbook of Physiology. The Nervous System. Cellular Biology of Neurons. Bethesda, MD: Am Physiol Soc, 1977, sect. 1, vol. I, pt. 1, p. 39–97 [Google Scholar]
- Rose PK, Dagum A. Nonequivalent cylinder models of neurons: interpretation of voltage transients generated by somatic current injection. J Neurophysiol 60: 125–148, 1988 [DOI] [PubMed] [Google Scholar]
- Roth A, Häusser M. Compartmental models of rat cerebellar Purkinje cells based on simultaneous somatic and dendritic patch-clamp recordings. J Physiol 535: 445–472, 2001 [DOI] [PMC free article] [PubMed] [Google Scholar]
- Royeck M, Horstmann MT, Remy S, Reitze M, Yaari Y, Beck H. Role of axonal NaV1.6 sodium channels in action potential initiation of CA1 pyramidal neurons. J Neurophysiol 100: 2361–2380, 2008 [DOI] [PubMed] [Google Scholar]
- Selverston AI, Russell DF, Miller JP, King DG. The stomatogastric nervous system: structure and function of a small neural network. Prog Neurobiol 7: 215–290, 1976 [DOI] [PubMed] [Google Scholar]
- Shen W, Hernandez-Lopez S, Tkatch T, Held JE, Surmeier DJ. Kv1.2-containing K+ channels regulate subthreshold excitability of striatal medium spinal neurons. J Neurophysiol 91: 1337–1394, 2004 [DOI] [PubMed] [Google Scholar]
- Szabo TM, Caplan JS, Zoran MJ. Serotonin regulates electrical coupling via modulation of extrajunctional conductance: H-current. Brain Res 1349: 21–31, 2010 [DOI] [PMC free article] [PubMed] [Google Scholar]
- Taylor A. What we talk about when we talk about capacitance measured with the voltage-clamp step method. J Comput Neurosci 32: 167–175, 2012 [DOI] [PMC free article] [PubMed] [Google Scholar]
- Thuma JB, White WE, Hobbs KH, Hooper SL. Pyloric neuron morphology in the stomatogastric ganglion of the lobster, Panulirus interruptus. Brain Behav Evol 73: 26–42, 2009 [DOI] [PubMed] [Google Scholar]
- Turrigiano G, LeMasson G, Marder E. Selective regulation of current densities underlies spontaneous changes in the activity of cultured neurons. J Neurosci 15: 3640–3652, 1995 [DOI] [PMC free article] [PubMed] [Google Scholar]


