

Abstract
Dopamine neurons of the ventral tegmental area (VTA) signal the occurrence of a reward-predicting conditioned stimulus (CS) with a subsecond duration increase in post-CS firing rate. Important theories about reward-prediction error and reward expectancy have been informed by the substantial number of studies that have examined post-CS phasic VTA neuron activity. On the other hand, the role of VTA neurons in anticipation of a reward-predicting CS and analysis of prestimulus spike rate rarely has been studied. We recorded from the VTA in rats during the 3-choice reaction time task, which has a fixed-duration prestimulus period and a difficult-to-detect stimulus. Use of a stimulus that was difficult to detect led to behavioral errors, which allowed us to compare VTA activity between trials with correct and incorrect stimulus-guided choices. We found a sustained increase in firing rate of both putative dopamine and GABA neurons during the pre-CS period of correct and incorrect trials. The poststimulus phasic response, however, was absent on incorrect trials, suggesting that the stimulus-evoked phasic response of dopamine neurons may relate to stimulus detection. The prestimulus activation of VTA neurons may modulate cortical systems that represent internal states of stimulus expectation and provide a mechanism for dopamine neurotransmission to influence preparatory attention to an expected stimulus.
Keywords: attention, dopamine, reward, schizophrenia, ADHD, prefrontal cortex
dopamine neurons of the ventral tegmental area (VTA) have been ascribed a role in motivation and learning because they signal the expectancy and occurrence of reward and reward-predicting or salient stimuli (Cohen et al. 2012; Horvitz 2000; Pan et al. 2005; Schultz 1998; Schultz et al. 1997). These studies have demonstrated that dopamine neurons increase discharge after the onset of a reward-predicting conditioned stimulus (CS). The post-CS response may signal reward expectancy (Cohen et al. 2012). On the other hand, pre-CS VTA activity, occurring as an organism expects the stimulus, has remained largely unexamined in the context of electrophysiological recordings (Bromberg-Martin et al. 2010; Schultz 2007).
Dopamine neurons likely contribute to cognitive states of stimulus expectancy, given that dopamine neurotransmission can modulate an organism's ability to estimate the timing of stimuli (Coull et al. 2011) and that dopamine neurotransmission may be abnormal in psychiatric illnesses such as schizophrenia and attention-deficit and hyperactivity disorder (ADHD), which involve disrupted temporal organization of behavior (Allman and Meck 2012; Ward et al. 2012). These findings suggest that VTA neurons may control general stimulus expectation regardless of stimulus valence. One study that examined VTA activity during CS anticipation found a ramping decrease in firing rate that began when the presentation of a predictable stimulus was delayed or omitted, which is consistent with decreased dopamine activity when a CS is omitted (Bromberg-Martin et al. 2010). Therefore, previous studies on stimulus expectation have been limited to omission of an expected stimulus.
Our objective in the current experiments was to study the activity of VTA neurons during stimulus expectation. Given that dopamine may participate in the neural mechanisms underlying stimulus expectation (Allman and Meck 2012; Coull et al. 2011; Ward et al. 2012), we hypothesized that dopamine neurons would change their firing rate during the time immediately preceding the CS (“prestimulus period”) in expectation of the CS. Furthermore, given that temporal expectation of a stimulus improves stimulus detection (Nobre et al. 2007; Rohenkohl et al. 2012), we hypothesized that firing rate would correlate with behavioral performance in a task in which the stimulus was presented with predictable timing but was difficult to detect. A stimulus detection task (i.e., the 3-choice reaction time task; Totah et al. 2009), which used a brief stimulus presented at randomized stimulus locations, was employed because it generated incorrect and missed trials, which allowed us to assess VTA activity on the basis of behavioral performance. Notably, reduced cortical dopamine neurotransmission (Crofts et al. 2001; Granon et al. 2000) results in impaired stimulus detection in the 3-choice reaction time task. These findings suggest that in this task dopamine neuron spiking should correlate with behavior and that increased spiking rate may correlate with accurate stimulus detection by contributing to the neural mechanisms of stimulus expectancy.
To study stimulus expectancy, we analyzed single-unit firing rate during an 8-s prestimulus period. We also characterized the VTA neuronal firing rate immediately after stimulus onset, because VTA neurons have been observed to exhibit a short-duration “phasic” response after the presentation of reward-predicting and salient stimuli (Dommett et al. 2005; Schultz 2007). Consistent with involvement of the VTA in internal states of stimulus expectation and temporal organization of behavior, we found that the putative GABA and dopamine neurons had a sustained, elevated firing rate during the prestimulus period. The prestimulus activation occurred during both trial types, whereas poststimulus VTA neuron activation was absent on error trials, supporting a role for the VTA in successful stimulus detection.
MATERIALS AND METHODS
Subjects and behavioral methods.
Male Sprague-Dawley rats (n = 20) were housed on a reverse light cycle and tested during their active phase. All animal use procedures were approved by and carried out in compliance with the University of Pittsburgh Institutional Animal Care and Use Committee. The behavioral task has been described in detail in our previous work (Totah et al. 2009). Briefly, rats were trained and tested in operant chambers with a house light on the ceiling, three stimulus ports with internal light-emitting diode (LED) lights on one wall, and an illuminated food magazine on the wall opposite from the stimulus ports. Nose pokes into the stimulus ports and the food magazine were registered by photosensors. A correct response, consisting of a nose poke into an illuminated stimulus port, was rewarded with sucrose. An incorrect response into an unlit stimulus port resulted in an extinguished house light. The rat was required to nose poke into a stimulus port within 5 s after stimulus onset; otherwise, the house light was extinguished (i.e., an omission trial). The rat initiated each trial with a poke into the food magazine, which either contained sucrose pellets or was empty depending on whether the previous trial was correct or an error.
At the start of a trial, an 8-s prestimulus period passed before the stimulus onset. Throughout this article, we use the term “prestimulus” to refer to the time immediately preceding the CS, and not the unconditioned stimulus (US). On each trial, one of the three stimulus ports would illuminate. The location of the stimulus was selected at random from the three stimulus ports. There was a balanced distribution of the selection of the three ports, but the order of presentation was random. Each session lasted 30 min. On the basis of satisfying performance criteria [see previous work (Totah et al. 2009) for detailed training information], the stimulus duration was reduced gradually to 300 ms. Rats were deemed ready for electrode implantation when they met the performance criterion of >70% accuracy [i.e., no. of correct responses/(no. of correct responses + no. of incorrect responses)] and <20% omissions (i.e., no. of omitted responses/no. of total trials) for six consecutive sessions using the 300-ms cue duration. The mean number of sessions needed to complete training was 42 sessions. During both correct and incorrect trials, rats oriented to the operant chamber wall that contained the stimulus ports and waited for the stimulus. Orientation to the wall of stimulus ports began ∼2 s before stimulus onset and was maintained throughout the remainder of the prestimulus period. Review of video recordings showed that orienting behavior was similar for correct and incorrect trials; unfortunately, the video recordings did not allow us to quantify the exact movement trajectory or head position. We were, however, able to confirm that, once they oriented, rats faced the wall of stimulus ports for the remainder of the prestimulus period on both correct and incorrect trials. During omission trials, the rats did not orient to the wall of stimulus ports during the prestimulus period.
Electrophysiology procedure.
Rats were implanted under isoflurane anesthesia with a microelectrode array of 8 Teflon-insulated stainless steel wires with an impedance of 300–700 kΩ (NB Labs, Denison, TX). Twenty rats were implanted with one array in the VTA (−5.1 to −6.1 mm posterior to bregma, 0.4 to 0.6 mm lateral to bregma, and −8.0 mm ventral from the dura surface).
After 1 wk of recovery, rats were acclimated to the recording cable in the operant box for four 30-min sessions and retrained to criterion performance. Once performance was stable and above criterion, a 30-min session was recorded. Single units were recorded via a unity-gain field-effect transistor head stage and lightweight cabling, which passed through a commutator to allow freedom of movement. Single-unit activity was amplified using a 1,000× gain, bandpass filtered at 300–8,000 Hz, and digitized at a rate of 40 kHz using Recorder software (Plexon). Single- unit activity was digitally high-pass filtered at 300 Hz. If voltage crossed an experimenter-defined threshold, the single-unit trace was recorded for 0.5 ms before and 2.5 ms after threshold crossing, yielding a 3.0-ms-duration waveform. Spike sorting was performed using Offline Sorter (Plexon) with the use of manual sorting methods described previously (Totah et al. 2009). We used standard criteria, which we have employed previously (Totah et al. 2009), to accept waveforms as a single unit if the cluster in principal component analysis space was >2 SD from the noise and the interstimulus interval was >1.1 ms.
Classification of single units into groups of putative neurons.
Single units recorded in the VTA were separated into three groups: putative dopamine, putative GABA, and “other” units that could not be classified. Classification was according to previously published methods (Fiorillo et al. 2003; Kim et al. 2010, 2012; Steffensen et al. 1998; Ungless and Grace 2012) and based on baseline firing rate and the waveform duration. Waveform duration was calculated from the average spike waveform across all spikes. Single units that had a firing rate ≤10.0 Hz and a duration of ≥1.5 ms were assigned to the putative dopamine neuron group. Single units that had a firing rate >10.0 Hz and waveform duration of <1.5 ms were assigned to the putative GABA neuron group. All other single units were assigned to a group designated as “other” neurons. The use of these electrophysiological criteria for classifying VTA neurons recorded in vivo in the awake rat may permit units that could use glutamate as a neurotransmitter to be classified as putative dopamine neurons (Ungless and Grace 2012); however, it is unlikely that they use GABA as a neurotransmitter (Steffensen et al., 1998). A recent study that used optogenetic targeting of VTA neuron types demonstrated that waveform duration is highly variable but that firing rate separates neuronal types clearly (see supplementary figures in Cohen et al. 2012). Our dopamine and GABA neuron groups are separated conservatively by firing rate, with the “other” group likely containing members of both groups. Neural activity was analyzed both across all recorded VTA single units and according to these three groups of putative neurons.
Electrophysiological data analysis.
Electrophysiological data were analyzed with custom scripts written in MATLAB (The MathWorks, Natick, MA). Single-unit spiking was aligned to stimulus onset (t = 0 s) and binned into 250-ms bins for the prestimulus period and 20-ms bins for the poststimulus period. The prestimulus period was from −4 to 0 s and the poststimulus period was from 0 to 240 ms (but plotted until 500 ms). The shorter poststimulus period was chosen to correspond with the characterized duration of the dopamine neuron response to stimuli. The longer prestimulus bin size and time window were chosen on the basis of reviewing the data in different bin sizes and our previous finding (Totah et al. 2009) that a 250-ms time bin was appropriate for plotting the data but that a smaller or larger bin size did not change statistical significance. Firing rate was averaged across trials within trial type. For normalization (Z score), we used −5.75 to −4.0 s as a baseline period to calculate a mean and standard deviation of baseline firing rate. The baseline firing rate was calculated within trial type (i.e., separately for correct, incorrect, and omission trials). Single units were considered to be responsive (i.e., increase in firing rate from baseline) if there were at least three consecutive time bins with Z > 2. All data are plotted as means ± 1 SE (shaded region). The χ2 test was used to compare the proportion of single units responding on correct trials vs. incorrect trials for only one neuron type (e.g., dopamine) or to compare the proportion of dopamine vs. GABA neurons responding during only one trial type (e.g., correct trials). Accordingly, all χ2 tests had 1 degree of freedom. If any group of units was <5, then we used a Fisher's exact test.
Perfusion and histology.
At the completion of recordings, rats were anesthetized with chloral hydrate and perfused with normal saline for 10 min and 10% buffered formalin for 10 min. After fixation, brains were sectioned (60-μm thickness) and stained with cresyl violet. Electrode tracks and electrode tips were confirmed under a light microscope, and rats with incorrectly placed electrodes were excluded from analysis (yielding n = 20 rats after exclusion of inaccurate implantations).
RESULTS
Prestimulus VTA single-unit activation correlates with subsequent stimulus-guided behavior.
We recorded neuronal activity in a 3-choice reaction time task (Fig. 1). As described previously (Totah et al. 2009), during the prestimulus period (immediately preceding the CS), animals oriented to the wall of three stimulus ports in expectation of the upcoming stimulus. The stimulus was difficult to detect due to its short (300 ms) duration and its location being chosen randomly from one of the three stimulus ports on each trial. In animals used in the current study, incorrect stimulus location choice occurred in 24 ± 2% of trials, confirming that the stimulus was difficult to detect. Accuracy [no. correct/(no. correct + no. incorrect)] was similar for each stimulus port location (75 ± 18%, right port; 77 ± 13%, center port; 76 ± 15%, left port; mean ± SD from 20 rats). The reaction time (i.e., the latency between stimulus onset and the nose poke into a stimulus port) also did not differ between stimulus port locations (0.782 ± 1.072 and 1.902 ± 1.462 s, right port; 0.704 ± 1.222 and 1.484 ± 1.271 s, center port; 0.766 ± 1.109 and 1.783 ± 1.748 s, left port; mean ± SD for correct and incorrect trials combined across 20 rats). Although there is some imprecision in measuring the behavior during the prestimulus period, these data demonstrate that behavior was stereotypical across the stimulus ports and may not have been heavily affected by trial-to-trial differences in body or head position. Moreover, video analysis demonstrated that orienting behavior was similar across animals and that, once rats oriented, they faced the wall of stimulus ports for the remainder of the prestimulus period on both correct and incorrect trials. Overall, behavior during the prestimulus period appeared to be similar between correct and incorrect trials in that the rats oriented to the wall in a similar manner. Rats tended to stand in front of the middle stimulus port. In some trials, the stimulus illuminated directly in front of the rat, but it still chose a different location.
Fig. 1.

A diagram of the timing of events during the behavioral task. The trial initiation, prestimulus period, and conditioned stimulus (CS) were the same across trials. The only exception was that the CS presentation changed between 3 randomly selected locations on the operant chamber wall to which the rat oriented. After the CS, there were 3 possible behavioral choices: nose poke into the correct stimulus location, nose poke into the incorrect stimulus location, or response omission (not shown on the diagram). The timing of these nose poke events shown is approximate. Both correct and incorrect behavioral choices were followed 250 ms later by the trial outcome, either reward or extinguishment of the house light. Note that event times are shown to illustrate important points and are not drawn to scale. Analysis focused on firing rate changes during the prestimulus period immediately preceding the CS (−4,000 to 0 ms) and during the poststimulus period (0 to 240 ms). The behavioral response and the outcome occur well after (>500 ms) the CS analysis window.
We analyzed changes in prestimulus VTA single-unit firing rate during stimulus expectation. We recorded 123 single units from 20 rats (Fig. 2). Across the entire population of 123 VTA units, we found that 29 (23.6%) increased their firing rate during the prestimulus period on correct trials. Exemplar spike rasters and peristimulus time histograms of spike rate for two single units are illustrated in Fig. 3. The rasters are similar to previous observations of changes (both increases and decreases) in tonic dopamine neuron firing over a period of multiple seconds (Bromberg-Martin et al. 2010; Fiorillo et al. 2003; Romo and Schultz 1990). The proportion of significantly responsive units (using Z score; see materials and methods for details) was reduced to 12 (9.8%) and 8 (6.5%) units on incorrect and omission trials, respectively (Fig. 4A). The proportion of activated units was significantly different between correct and incorrect trials [χ2(1) = 8.46, P = 0.004], as well as between correct and omission trials [χ2(1) = 14.03, P < 0.0001]. The mean firing rate (from the entire recording session) of the prestimulus modulated single units was 17.26 ± 19.88 Hz (mean ± SD). Of the significantly activated units on correct trials, the mean increase in Z-score-normalized prestimulus firing rate was largest on correct trials (Fig. 4B). The mean increase in firing rate of activated neurons on correct trials was significantly larger than the increase during incorrect and omission trials [ANOVA (time as repeated measure); trial type (all 3 types) and time interaction, F(46,1288) = 10.27, P < 0.0001]. The difference was significant between each of the groups [ANOVA (time as repeated measure); trial type (correct vs. incorrect) and time interaction, F(23,644) = 7.05, P < 0.0001; trial type (incorrect vs. omission) and time interaction, F(23,644) = 4.34, P < 0.0001]. Note that the ANOVA tests compare data from the prestimulus period, which is baseline onset (t = −5.75 s) until stimulus onset (t = 0 s). The remaining units (n = 94) did not respond during the prestimulus period; however, in the nonresponsive units, a large poststimulus response is apparent (Fig. 4C). A response at the start of the trial (−8 s before stimulus onset) also occurred in both prestimulus responsive (Fig. 4B) and nonresponsive units (Fig. 4C). The trial start nose poke coincided with reward consumption (if the previous trial was correct, which was the majority of the trials). Thus there was a nonspecific modulation related to reward consumption (seen in both Fig. 4, B and C) and a specific modulation related to prestimulus period (seen in Fig. 4B only). To further characterize the change in prestimulus firing rate, we plotted nonnormalized (Hz) perievent time histograms. The firing rate across prestimulus activated units was highly variable (17.26 ± 19.88 Hz, mean ± SD) and is plotted as a histogram (Fig. 4B, inset). Therefore, we divided units into three groups with prestimulus period mean firing rates of <1 Hz (Fig. 4D), between 1 and 3 Hz (Fig. 4E), and >3 Hz (Fig. 4F). In Fig. 4, D–F, top, we show the mean and SE of firing rate, and at bottom we show firing rate for all units during correct trials only. Figure 4, D–F, bottom, clearly illustrate that the activation during the prestimulus period lasted for several seconds. Across units in all three ranges of firing rates, there was always an interaction between time (−6 to 0 s) and all three trial types [ANOVA (time as repeated measure); trial type (all 3 types) and time interaction, Fig. 4D, F(46,368) = 2.64, P < 0.0001; Fig. 4E, F(46,276) = 2.35, P < 0.0001; Fig. 4F, F(46,552) = 2.18, P < 0.0001]. The difference was due to an elevation of firing rate during correct trials compared with omission trials [ANOVA (time as repeated measure); trial type (correct and omission trials) and time interaction, Fig. 4D, F(23,184) = 4.63, P < 0.0001; Fig. 4E, F(23,138) = 4.20, P < 0.0001; Fig. 4F, F(23,276) = 2.58, P < 0.0002], whereas correct and incorrect trials were not significantly different [ANOVA (time as repeated measure); trial type (correct and incorrect trials) and time interaction, Fig. 4D, F(23,184) = 1.49, P = 0.077; Fig. 4E, F(23,138) = 0.95, P = 0.528; Fig. 4F, F(23,276) = 1.42, P = 0.100]. Although the Z-score normalization of firing rate was useful for visualizing data and controlling for firing rate variability across neurons (Fig. 4B), it may have generated an artificial difference between correct and incorrect trials that could not be observed in the nonnormalized data (Fig. 4, D–F). In summary, we observed sustained activation of VTA single units during the period immediately preceding the onset of a CS.
Fig. 2.
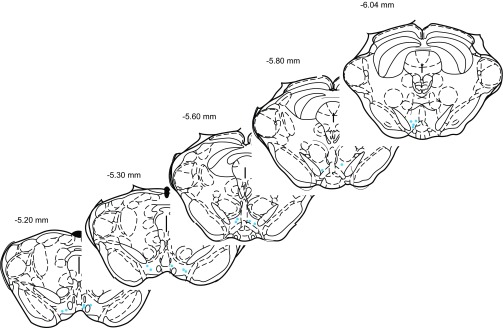
Extracellular recordings of single units were made in the ventral tegmental area (VTA). The drawing indicates the location of recordings from each rat in relation to bregma.
Fig. 3.

Waveforms, spike rasters, and perievent time histograms for firing rate (Hz) are presented for 2 single units. These units significantly increased their firing rate during the prestimulus period. Stimulus onset is at t = 0 s.
Fig. 4.

Sustained activation of VTA single units before stimulus onset. A: the largest proportion of units (n = 29 of 123 total) was activated during correct trials, whereas the proportion of significantly activated units was reduced during incorrect and omission trials (**P < 0.01). Significance was determined using Z score (see materials and methods for details). B: mean normalized firing rate across units that were significantly activated before the stimulus is plotted (250-ms bins). The shading indicates SE. Stimulus onset is at t = 0 s. The magnitude of change was largest during correct trials and reduced during the other trial types (P < 0.0001). During omission trials, the firing rate did not change. The inset shows that nonnormalized firing rate was highly variable across single units. The x-axis shows the mean rate from the prestimulus period (−6 to 0 s), and the y-axis shows the number of units. C: mean normalized firing rate of the remaining nonresponsive units (n = 94) is plotted with shading indicating SE from the mean. These units did not respond during the prestimulus period. However, the population responded after stimulus onset. D–F: units were split into groups with different firing rates to reduce variability in the population mean perievent time histograms. Top: mean and SE of firing rate (Hz) in 250-ms bins. Bottom: individual units on the y-axis and time around stimulus onset on the x-axis. Units were activated for a sustained period of multiple seconds before stimulus onset. Note that 1 unit with a mean firing rate of ∼20 Hz was excluded from the plots to reduce variability but is included in the statistical tests (ANOVA) reported in the results. VTA unit activation was observed during both correct and incorrect trials, but a change in firing rate did not occur during omission trials.
The next analysis examined the possibility that the prestimulus activation reflected motor planning and execution. The stimulus-guided behavior (i.e., a nose poke into a stimulus port) occurred 0.441 ± 0.732 s after stimulus onset during correct trials (mean ± SD across all trials collected from n = 20 rats), whereas it occurred 1.100 ± 1.221 s after stimulus onset during incorrect trials (Fig. 5, A and B). We tested the hypothesis that increases in firing rate were related to motor preparation and would align to nose poke events occurring sooner (as in correct trials) or later (as in incorrect trials). We aligned the activity of the prestimulus responsive units (shown in Fig. 4) to the onset of the stimulus-guided nose poke (Fig. 5C). We used Z-score normalization because it was clear from perievent time histograms plotting firing rate (Fig. 4, D–F) that activation of these units occurred. The perievent time histogram shows the mean change in normalized firing rate for prestimulus responsive neurons aligned to the nose poke onset at t = 0 s (black line). The orange and green vertical lines mark the average time of the stimulus onset before the nose poke (−0.4 s before correct nose poke, orange line; −1.1 s before incorrect nose poke, green line). Critically, the activation began before stimulus onset, suggesting that motor preparation, alone, does not explain the increased firing rate during the prestimulus period. We further tested the hypothesis that these neurons were directly involved in motor preparation by plotting their firing rate aligned to the premature nose poke. Premature nose pokes were made during the prestimulus period and therefore reflected impulsive motor actions. On average, premature nose pokes (n = 35 ± 25, mean ± SD of the number of premature response trials across n = 20 rats) occurred 7.200 ± 1.135 s (mean ± SD across all trials collected from n = 20 rats) after the rat initiated the trial by poking into the food magazine. Premature nose pokes therefore usually occurred during the final 1 s before stimulus onset would occur. Firing rate did not change in preparation for premature nose pokes (Fig. 5D). These data demonstrate that VTA neurons increase firing rate before stimulus onset and that this change does not relate to motor preparation.
Fig. 5.

Prestimulus increases in firing rate were aligned to the subsequent stimulus-guided nose poke. A and B: the latency to make a stimulus-guided nose poke differed between trial types. During correct trials (orange, A), rats responded with a mean latency of 0.441 s after stimulus onset, whereas latency occurred 1.100 s after stimulus onset during incorrect trials (green, B). C: mean normalized firing rate of prestimulus responsive neurons aligned to stimulus-guided nose poke onset (at t = 0 s, vertical black line). The shading indicates SE. The orange and green vertical dotted lines mark the average time of stimulus onset preceding the nose poke for correct trials (orange) and incorrect trials (green). Units increased firing rate before stimulus onset and continued to fire at an elevated rate until nose poke onset. The change in firing rate was greater during correct trials (orange line). D: prestimulus responsive neurons did not respond to nose poking events that were not stimulus-guided (i.e., premature nose pokes during the prestimulus period). These data suggest that VTA neurons respond during stimulus expectancy and continue until the stimulus-guided action, but do not respond to actions alone.
We assessed how this prestimulus sustained activation was represented in different groups of VTA units according to putative neuronal type. The VTA contains neurons that primarily use dopamine or GABA as neurotransmitter (Bayer and Pickel 1990; Carr and Sesack 2000a; Nair-Roberts et al. 2008; Swanson 1982). Single units were divided into groups using standard extracellular electrophysiology criteria, as described previously (Kim et al. 2010, 2012; Ungless and Grace 2012) (see materials and methods for details). We characterized the task-related activity of all recorded VTA single units, and when separating them into putative groups, we also showed data for “other” units that could not be classified using these criteria. We recorded 72 putative dopamine neurons (mean ± SD of firing rate, 3.40 ± 2.31 Hz), 14 putative GABA neurons (mean firing rate, 33.38 ± 21.61 Hz), and 37 other neurons (mean firing rate, 19.43 ± 20.48 Hz). Figure 6A shows representative example waveforms of a putative dopamine neuron and a putative GABA neuron. Figure 6B is a scatter plot of the firing rate and waveform duration for all recorded single units (n = 123). Although the separation between high baseline firing rate, short-duration waveform single units (putative GABA neurons) and low baseline firing rate, long-duration waveform single units (putative dopamine neurons) is not substantial, we note that the plot is consistent with the separation observed in other studies (Cohen et al. 2012; Matsumoto and Hikosaka 2009). Critically, a recent study that used optogenetic targeting of dopamine and GABA neurons in the VTA demonstrated that waveform duration is highly variable but that firing rate separates neuronal types clearly (see supplementary figures in Cohen et al. 2012). Accordingly, given that the dopamine and GABA neuron groups are conservatively separated by firing rate in the present study, it is likely that they accurately reflect the phenotype of each neuronal population.
Fig. 6.

VTA single units were classified as putative dopamine and GABA neurons on the basis of firing rate and waveform duration. A: putative dopamine neurons were characterized by long waveform duration, whereas putative GABA neurons were characterized by short waveform duration. B: firing rate and waveform duration were used to classify single units into 2 groups.
The prestimulus firing rate of dopamine, GABA, and other (unclassified) neurons were considered separately. The proportion of prestimulus activated neurons within each putative neuron group was not significantly different between these groups [χ2 test for correct trials: DA and GABA, χ2(1) = 1.16, P = 0.28; DA and other, χ2(1) = 0.01, P = 0.94] (Fig. 7A). The mean firing rate (from the entire recording session) of the prestimulus modulated units was 4.79 ± 3.20 Hz (mean ± SD) for putative dopamine neurons, 43.67 ± 23.14 Hz for putative GABA neurons, and 25.68 ± 17.79 Hz for other neurons. We plot the magnitude of prestimulus activation for each group of putative neurons that was activated on correct trials (Fig. 7B). Therefore, all responsive VTA single units, regardless of putative neuronal type (dopamine or GABA), exhibited sustained activation during the prestimulus period.
Fig. 7.

All three groups of VTA neurons (dopamine, GABA, and other) contained neurons that were activated during the prestimulus period. A: similar proportions of each putative neuron group significantly increased firing rate during the prestimulus period (correct trials). DA, dopamine. B: units from all 3 groups of putative neuronal types were activated. The mean normalized firing rate across all responsive units is plotted, and the shading indicates SE.
Poststimulus VTA single-unit phasic response after stimulus onset.
A short-duration phasic increase in firing rate was observed within 250 ms after the stimulus onset in 21 of 123 single units (17.1%) during correct trials. Although rats were oriented to the stimulus ports during both correct and incorrect trials, the proportion of responsive units was reduced significantly during incorrect trials (n = 5 units) and omission trials (n = 1 unit) compared with correct trials (Fig. 8A, Fisher's exact test; P = 0.0006 for correct vs. incorrect trials and P < 0.0001 for correct vs. omission trials). The single units that were activated phasically after stimulus onset were primarily putative dopamine neurons (Fig. 8B). Twenty of 72 putative dopamine neurons (27.8%) responded to stimulus onset during correct trials, whereas only 1 of 14 putative GABA neurons responded. The mean firing rate (from the entire recording session) of the putative dopamine neurons with a poststimulus phasic response was 3.78 ± 2.10 Hz (mean ± SD). Of the putative dopamine neurons with a phasic response during correct trials, the magnitude of the Z-score-normalized firing rate response was less during the incorrect and omission trials (Fig. 8C) [ANOVA (time as repeated measure); trial type (all 3 types) and time interaction, F(48,912) = 12.71, P < 0.0001]. The difference was significant between each of the trial types [ANOVA (time as repeated measure); trial type (correct vs. incorrect) and time interaction, F(24,456) = 12.61, P < 0.0001; trial type (incorrect vs. omission) and time interaction, F(24,456) = 2.24, P < 0.001]. Some of the excited putative dopamine neurons remained responsive for a longer duration after stimulus onset, whereas others were activated for only two or three 20-ms bins (Fig. 8D). The single units (n = 20 putative dopamine neurons and n = 1 putative GABA neuron) that responded after stimulus onset did not have a sustained increase in firing rate during the prestimulus period (Fig. 8D). Finally, we plotted the mean nonnormalized firing rate of the putative dopamine neurons that exhibited a phasic response (Fig. 8E, same neurons as in 8, C and D). There was a significant interaction between time (0 s to 300 ms) and all three trial types [ANOVA, F(64,1216) = 5.89, P < 0.0001] as well as between correct and incorrect trials [F(32,608) = 9.21, P < 0.0001] and correct and omission trials [F(32,608) = 8.17, P < 0.0001]. However, there was no significant difference between incorrect and omission trials [F(32,608) = 1.26, P = 0.154].
Fig. 8.

VTA units exhibited a phasic activation after stimulus onset that was significantly different between different types of stimulus-guided behavioral response. A: the proportion of VTA single units that had a phasic response after stimulus onset was the largest on correct trials and reduced on the other trial types (**P < 0.001). B: units from the group of putative dopamine neurons had a phasic response after stimulus onset, whereas other groups of neurons were not activated. C: the normalized (Z score) magnitude of phasic response of dopamine neurons was related to the subsequent stimulus-guided response. The response was not related to the instrumental response or to the trial outcome, both of which occurred well after stimulus onset (>500 ms). The mean normalized firing rate of units from the putative dopamine neuronal group that is activated after stimulus onset (t = 0 s) is plotted in 20-ms bins. The shading indicates SE. The largest activation was on correct trials, and the magnitude was reduced during other trials (P < 0.0001). D: the phasic response for each single unit (including 1 putative GABA neuron, plotted at y = 1) that is significantly activated after stimulus onset (t = 0 s) is plotted across a large time window that illustrates firing rate during both the pre- and poststimulus time periods. The normalized firing rate of all single units that were significantly activated after stimulus onset is displayed on the y-axis, and time around stimulus onset (in 20-ms bins) is displayed on the x-axis. A Z score >2 (yellow) signified a significant increase in firing rate from each single unit's baseline firing rate. These neurons did not have a seconds-long activation before the stimulus onset; rather, they had a phasic activation within 250 ms after the stimulus onset. E: the firing rate (Hz) of neurons represented in A–D is also shown nonnormalized across a large time window including both pre- and poststimulus periods (300-ms bins). The phasic response was significantly reduced during error trials.
DISCUSSION
We recorded from VTA single units during a 3-choice reaction time task. The task requires well-trained rats to orient toward a wall of three stimulus ports in anticipation of a brief visual stimulus, which changes between port locations randomly on each trial. The rat must make an instrumental response to the perceived location of the stimulus. We analyzed neural activity during two cognitively relevant time periods: first, the prestimulus period during stimulus expectation, and second, during the period shortly after stimulus onset when VTA neurons would be expected to exhibit a phasic response to the onset of a salient stimulus (Horvitz 2000; Pan et al. 2005; Schultz 1998; Schultz et al. 1997). During the prestimulus period, we found that putative dopamine and GABA neurons increased their firing rate, suggesting a role for VTA neurons in representation of internal states of stimulus expectation. We observed that the poststimulus phasic response was absent on incorrect trials, suggesting that the stimulus-evoked phasic response of putative dopamine neurons may relate to stimulus detection.
Prestimulus activity in relation to current theories of reward and motivation.
During the prestimulus period, putative dopamine neurons maintained an increased firing rate over a period of seconds. This effect did not differ between trial types. Previous work has demonstrated a similar sustained increase in firing rate before an unconditioned stimulus (reward) that was proportional to increased uncertainty about reward delivery (Fiorillo et al. 2003). A key distinction between our design and the previous work is that we examined activity related to expectancy of a CS as opposed to activity related to reward expectancy. In our task, it is unlikely that the difference in firing rate before the CS is related to reward expectancy, because the rat was not provided with external information about trial outcome during the prestimulus period. Therefore, the change in prestimulus activity that we observe could be related to general stimulus expectation regardless of valence.
A previous study of VTA activity during expectancy of a CS has reported a tonic decrease in firing rate in the context of delaying or omitting an expected stimulus, which the authors note is consistent with reward prediction error theory (Bromberg-Martin et al. 2010). These authors did not find a change in activity before the CS, but only after the expected CS had been omitted. In contrast, our behavioral task had predictable stimulus timing paired with a stimulus that required cognitive effort to detect. As a control condition, Bromberg-Martin et al. (2010) examined prestimulus activity in a context similar to our task, in which the time of stimulus onset was always predictable. In that case they found no change in VTA activity. It is possible that they would have found increased prestimulus activity before a predictable stimulus had the task required higher cognitive demand to detect the stimulus.
The majority of studies about motivation have focused on VTA dopamine neurons, rather than VTA GABA neurons. We found that both putative dopamine and GABA neurons increased firing rate during the prestimulus period. One recent study also demonstrated increased VTA GABA neuron spiking over a multisecond period (Cohen et al. 2012). The authors used optogenetic targeting to differentiate VTA neuronal types and demonstrated that sustained increases in firing rate occurred in GABA neurons but not in dopamine neurons. The increase in GABA neuron activity occurred over a poststimulus delay during reward expectancy. Our finding of sustained activation in both neuron types likely is due to the fact that our analysis was focused on stimulus expectancy during the prestimulus time period, rather than reward expectancy during the poststimulus period.
Given that sustained increases in VTA dopamine neuron firing rate have been observed before self-initiated movement (Romo and Schultz 1990), we should emphasize that a limitation of our current task design prevents us from firmly concluding that the prestimulus activation is unrelated to motor planning and execution. Specifically, our video monitoring of body position and minor body movements was not adequate to completely dissociate stimulus expectancy from motor preparation. We do, however, provide one important piece of evidence that the prestimulus activation is not related to nose poke execution, because we did not observe increased firing rate before premature nose pokes. Although this suggests that prestimulus activity is related to stimulus expectation, our interpretation should be taken with the caveat that the VTA activity could relate to body positioning, movements, and action preparation. Future experiments using detailed monitoring and control of orienting and motor behavior will address this limitation of the current study.
Finally, we recognize that the criteria we used to characterize single units into putative dopamine and GABA neurons may not provide enough accuracy. Although dopamine agonists can be used to test a dopamine neuron for auto-inhibition (Bunney et al. 1973; Grace and Bunney 1983; Groves et al. 1975), it is also the case that not all dopamine-releasing neurons are sensitive to autoinhibition (Margolis et al. 2006), including dopamine neurons projecting to the prefrontal cortex (PFC) (Lammel et al. 2008). We were interested primarily in PFC-projecting neurons because intra-PFC infusion of dopamine antagonists impairs performance of this task (Crofts et al. 2001; Granon et al. 2000). However, PFC-projecting dopamine neurons have a shorter waveform duration (Margolis et al. 2008) than that denoted by standard classification criteria (Ungless and Grace 2012). Recent experiments targeting dopamine (tyrosine hydroxylase positive) and GABA (glutamic acid decarboxylase positive) neurons and driving them to emit spikes using optogenetics have revealed that waveform duration is highly variable and that firing rate may be the best criteria with which to classify extracellularly recorded VTA units (Cohen et al. 2012). Notably, the characterization criteria may not be critical for interpreting VTA neuron activity during the prestimulus period given that all types of neurons were similarly activated. On the other hand, the poststimulus phasic response that we observed was almost entirely putative dopamine neurons. The criteria that we employed may therefore affect the interpretation of those data.
Poststimulus response of dopamine neurons in relation to current theories of reward and motivation.
The brief, phasic increase in poststimulus firing rate that we observed was similar to the widely reported dopamine neuron response to a CS or novel stimulus (Horvitz 2000; Pan et al. 2005; Schultz 1998; Schultz et al. 1997). We observed the poststimulus phasic response, primarily, in putative dopamine neurons that were classified using standard firing rate and waveform shape criteria (Ungless and Grace 2012). Other work has demonstrated that both dopamine and GABA neurons respond to a CS (Kim et al. 2010). This difference may be because the animals in that study were not overtrained or because the stimulus used in the present study was difficult to detect.
The phasic poststimulus response was reduced significantly during incorrect and omission trials. The difference in phasic response does not reflect outcome because the stimulus did not provide any feedback about the outcome of the trial. Feedback was contingent on the instrumental response and was not received until ∼750–1,500 ms after the stimulus onset. One potential explanation for the reduced phasic response during incorrect trials is that orientation to the stimulus on these trials could have reduced peripheral visual input, which is known to drive VTA neurons (Dommett et al. 2005). Although we did not record sensory cortex activity or control peripheral sensory input using head fixation, we observed that the rats oriented to the stimuli in a similar manner in all trial types. Therefore, rather than reflecting afferent drive by peripheral sensory input (Dommett et al. 2005), the reduced phasic response during incorrect trials may be due to lack of stimulus detection. This is further supported by recent experiments in the monkey, which demonstrated that a difficult-to-detect stimulus that is not perceived by the animal still evokes a response in sensory cortex but does not evoke a response from dopamine neurons or PFC neurons (de Lafuente and Romo 2011, 2012). Thus, in cognitively demanding tasks such as the one employed presently, dopamine neurons may not simply respond to peripheral sensory stimulation but instead, along with PFC neurons, reflect an organism's perception of the stimulus. Given this, the reduced VTA neuron responses during incorrect trials observed in the present study may be caused, in part, by reduced top-down drive from the PFC to VTA dopamine neurons. PFC neurons provide top-down drive to dopamine neurons and cause them to spike more frequently (Lodge 2011). Recordings from PFC neurons during the same task (Totah et al. 2009) indicate that increased prestimulus firing rate occurs earlier in PFC neurons than in VTA neurons. It is noteworthy that the VTA neurons that exhibited a phasic response to the stimulus were, primarily, putative dopamine neurons, given that PFC-projecting dopamine neurons, and not VTA GABA neurons, are preferentially innervated by PFC afferents (Carr and Sesack 2000b). Furthermore, microdialysis measurements of PFC dopamine release have suggested that the PFC can control its own dopamine release (Takahata and Moghaddam 1998). Therefore, VTA dopamine neurons could be driven selectively by PFC afferents to control cortical dopamine release during demanding cognitive tasks.
VTA activity as a neuromodulator of cortical processing.
The sustained increase in dopamine neuron firing rate during the prestimulus period could have a tonic, modulatory effect on cortical neurons during periods of expectancy (Constantinople and Bruno 2011; Harris and Thiele 2011). This action may stabilize cortical ensembles by synchronizing up-states across neurons (Peters et al. 2004) and limiting PFC inhibitory interneurons to fire within focused time windows (Tierney et al. 2008). Increased cortical dopamine neurotransmission would enhance sustained activity in the PFC (Lapish et al. 2007), which is precisely the activity that we observe in the PFC during the prestimulus period of this task (Totah et al. 2009). Prestimulus activity before the onset of behaviorally relevant events has been found not only in the PFC (Niki and Watanabe 1979; Pragay et al. 1987; Totah et al. 2009) but also in the striatum (Apicella et al. 1992). Both of these areas are modulated by dopamine (Fields et al. 2007); thus prestimulus VTA activity may modulate target regions during periods of stimulus expectancy. As discussed in the previous section, this modulation may occur within a PFC-VTA-PFC loop, in which these interconnected regions (Carr and Sesack 2000b) all have expectancy-related activity (Niki and Watanabe 1979; Pragay et al. 1987; Totah et al. 2009).
In addition to dopamine neurons, the GABA neurons in the VTA also could provide long-range modulation of cortical processing. Our electrodes spanned the medial-lateral axis of the VTA but were primarily placed in the heavily PFC-projecting medial (as defined by Lindvall et al. 1978 and Lammel et al. 2008) sector of the VTA. Although we cannot determine projection targets using our experimental paradigm, at least some of our electrodes were located in the parabrachial pigmented nucleus, which also contains tyrosine hydroxylase immunonegative neurons that are presumably GABA producing neurons (Lammel et al. 2008). Furthermore, 60% of the VTA projection to the medial PFC in the rat is GABAergic (Carr and Sesack 2000a). Therefore, it is possible that at least a portion of the putative GABA neurons that we recorded were PFC projecting. Our data therefore indicate that the GABA projection from the VTA may play a role in regulating PFC activity during the prestimulus period. The activation of GABA neurons could produce prestimulus suppression of PFC neuron firing rate that we previously have demonstrated in this task (Totah et al. 2009).
Conclusion.
We have demonstrated that prestimulus VTA activity changes during a task that uses a predictable but difficult-to-detect stimulus. Our results may be consistent with a preparatory increase in VTA neuron activity that underlies internal cognitive states of expectation, preparatory attention, or timing of behavior. These cognitive states are fundamental to decision-making and behavior but are not well understood (Driver and Frith 2000; Nobre et al. 2007; Totah et al. 2013). It is noteworthy that dopamine neurotransmission regulates both attention and time estimation (Coull et al. 2011; Swanson et al. 2011). Furthermore, individuals with schizophrenia, ADHD, and Parkinson's disease who are thought to have an underlying pathology of dopamine neurotransmission also have attentional deficits, time estimation deficits, and disrupted temporal organization of decision-making and behavior (Allman and Meck 2012; Arnsten 2011; Ward et al. 2012). Thus a purpose of prestimulus VTA activation may be to modulate PFC neurons via both dopamine and long-range GABA projections during stimulus expectancy under cognitively demanding conditions. The sustained increase in dopamine neuron firing rate, and the resulting dopamine release, during the prestimulus period may stabilize cortical ensembles by synchronizing up-states across neurons (Peters et al., 2004) and strengthen PFC sustained neural activity against degradation by task-irrelevant afferent neural activity (Totah et al. 2009, 2013). Finally, we found an unexpected reduction of phasic VTA neuron activation during the poststimulus period of incorrect trials. These data suggest that dopamine neurons may function in a PFC-VTA-PFC loop that underlies stimulus detection.
GRANTS
This research was supported by National Institutes of Health Grants R01 MH084906 (to B. Moghaddam), R37 MH48404 (to B. Moghaddam), and T32 DA031111 (to N. K. B. Totah) and an Andrew Mellon Fellowship (to N. K. B. Totah).
DISCLOSURES
No conflicts of interest, financial or otherwise, are declared by the authors.
AUTHOR CONTRIBUTIONS
N.K.B.T. and B.M. conception and design of research; N.K.B.T. and Y.K. performed experiments; N.K.B.T. and Y.K. analyzed data; N.K.B.T. and B.M. interpreted results of experiments; N.K.B.T. prepared figures; N.K.B.T. drafted manuscript; N.K.B.T., Y.K., and B.M. edited and revised manuscript; N.K.B.T., Y.K., and B.M. approved final version of manuscript.
ACKNOWLEDGMENTS
We thank Drs. Hank Jedema, Charles Bradberry, and Anthony Grace for helpful comments on this manuscript.
Present address of N. K. B. Totah: Max Planck Institute for Biological Cybernetics, Department of Physiology of Cognitive Processes, Tuebingen, Germany.
REFERENCES
- Allman MJ, Meck WH. Pathophysiological distortions in time perception and timed performance. Brain 135: 656–677, 2012 [DOI] [PMC free article] [PubMed] [Google Scholar]
- Apicella P, Scarnati E, Ljungberg T, Schultz W. Neuronal activity in monkey striatum related to the expectation of predictable environmental events. J Neurophysiol 68: 945–960, 1992 [DOI] [PubMed] [Google Scholar]
- Arnsten AF. Catecholamine influences on dorsolateral prefrontal cortical networks. Biol Psychiatry 69: e89–e99, 2011 [DOI] [PMC free article] [PubMed] [Google Scholar]
- Bayer VE, Pickel VM. Ultrastructural localization of tyrosine hydroxylase in the rat ventral tegmental area: relationship between immunolabeling density and neuronal associations. J Neurosci 10: 2996–3013, 1990 [DOI] [PMC free article] [PubMed] [Google Scholar]
- Bromberg-Martin ES, Matsumoto M, Hikosaka O. Distinct tonic and phasic anticipatory activity in lateral habenula and dopamine neurons. Neuron 67: 144–155, 2010 [DOI] [PMC free article] [PubMed] [Google Scholar]
- Bunney BS, Aghajanian GK, Roth RH. Comparison of effects of l-dopa, amphetamine and apomorphine on firing rate of rat dopaminergic neurones. Nat New Biol 245: 123–125, 1973 [DOI] [PubMed] [Google Scholar]
- Carr DB, Sesack SR. GABA-containing neurons in the rat ventral tegmental area project to the prefrontal cortex. Synapse 38: 114–123, 2000a [DOI] [PubMed] [Google Scholar]
- Carr DB, Sesack SR. Projections from the rat prefrontal cortex to the ventral tegmental area: target specificity in the synaptic associations with mesoaccumbens and mesocortical neurons. J Neurosci 20: 3864–3873, 2000b [DOI] [PMC free article] [PubMed] [Google Scholar]
- Cohen JY, Haesler S, Vong L, Lowell BB, Uchida N. Neuron-type-specific signals for reward and punishment in the ventral tegmental area. Nature 482: 85–88, 2012 [DOI] [PMC free article] [PubMed] [Google Scholar]
- Constantinople CM, Bruno RM. Effects and mechanisms of wakefulness on local cortical networks. Neuron 69: 1061–1068, 2011 [DOI] [PMC free article] [PubMed] [Google Scholar]
- Coull JT, Cheng RK, Meck WH. Neuroanatomical and neurochemical substrates of timing. Neuropsychopharmacology 36: 3–25, 2011 [DOI] [PMC free article] [PubMed] [Google Scholar]
- Crofts HS, Dalley JW, Collins P, Van Denderen JC, Everitt BJ, Robbins TW, Roberts AC. Differential effects of 6-OHDA lesions of the frontal cortex and caudate nucleus on the ability to acquire an attentional set. Cereb Cortex 11: 1015–1026, 2001 [DOI] [PubMed] [Google Scholar]
- de Lafuente V, Romo R. Dopamine neurons code subjective sensory experience and uncertainty of perceptual decisions. Proc Natl Acad Sci USA 108: 19767–19771, 2011 [DOI] [PMC free article] [PubMed] [Google Scholar]
- de Lafuente V, Romo R. Dopaminergic activity coincides with stimulus detection by the frontal lobe. Neuroscience 218: 181–184, 2012 [DOI] [PubMed] [Google Scholar]
- Dommett E, Coizet V, Blaha CD, Martindale J, Lefebvre V, Walton N, Mayhew JE, Overton PG, Redgrave P. How visual stimuli activate dopaminergic neurons at short latency. Science 307: 1476–1479, 2005 [DOI] [PubMed] [Google Scholar]
- Driver J, Frith C. Shifting baselines in attention research. Nat Rev Neurosci 1: 147–148, 2000 [DOI] [PubMed] [Google Scholar]
- Fields HL, Hjelmstad GO, Margolis EB, Nicola SM. Ventral tegmental area neurons in learned appetitive behavior and positive reinforcement. Annu Rev Neurosci 30: 289–316, 2007 [DOI] [PubMed] [Google Scholar]
- Fiorillo CD, Tobler PN, Schultz W. Discrete coding of reward probability and uncertainty by dopamine neurons. Science 299: 1898–1902, 2003 [DOI] [PubMed] [Google Scholar]
- Grace AA, Bunney BS. Intracellular and extracellular electrophysiology of nigral dopaminergic neurons–1. Identification and characterization. Neuroscience 10: 301–315, 1983 [DOI] [PubMed] [Google Scholar]
- Granon S, Passetti F, Thomas KL, Dalley JW, Everitt BJ, Robbins TW. Enhanced and impaired attentional performance after infusion of D1 dopaminergic receptor agents into rat prefrontal cortex. J Neurosci 20: 1208–1215, 2000 [DOI] [PMC free article] [PubMed] [Google Scholar]
- Groves PM, Wilson CJ, Young SJ, Rebec GV. Self-inhibition by dopaminergic neurons. Science 190: 522–528, 1975 [DOI] [PubMed] [Google Scholar]
- Harris KD, Thiele A. Cortical state and attention. Nat Rev Neurosci 12: 509–523, 2011 [DOI] [PMC free article] [PubMed] [Google Scholar]
- Horvitz JC. Mesolimbocortical and nigrostriatal dopamine responses to salient non-reward events. Neuroscience 96: 651–656, 2000 [DOI] [PubMed] [Google Scholar]
- Kim Y, Wood J, Moghaddam B. Coordinated activity of ventral tegmental neurons adapts to appetitive and aversive learning. PLoS One 7: e29766, 2012 [DOI] [PMC free article] [PubMed] [Google Scholar]
- Kim YB, Matthews M, Moghaddam B. Putative gamma-aminobutyric acid neurons in the ventral tegmental area have a similar pattern of plasticity as dopamine neurons during appetitive and aversive learning. Eur J Neurosci 32: 1564–1572, 2010 [DOI] [PMC free article] [PubMed] [Google Scholar]
- Lammel S, Hetzel A, Hackel O, Jones I, Liss B, Roeper J. Unique properties of mesoprefrontal neurons within a dual mesocorticolimbic dopamine system. Neuron 57: 760–773, 2008 [DOI] [PubMed] [Google Scholar]
- Lapish CC, Kroener S, Durstewitz D, Lavin A, Seamans JK. The ability of the mesocortical dopamine system to operate in distinct temporal modes. Psychopharmacology (Berl) 191: 609–625, 2007 [DOI] [PMC free article] [PubMed] [Google Scholar]
- Lindvall O, Bjorklund A, Divac I. Organization of catecholamine neurons projecting to the frontal cortex in the rat. Brain Res 142: 1–24, 1978 [DOI] [PubMed] [Google Scholar]
- Lodge DJ. The medial prefrontal and orbitofrontal cortices differentially regulate dopamine system function. Neuropsychopharmacology 36: 1227–1236, 2011 [DOI] [PMC free article] [PubMed] [Google Scholar]
- Margolis EB, Lock H, Hjelmstad GO, Fields HL. The ventral tegmental area revisited: is there an electrophysiological marker for dopaminergic neurons? J Physiol 577: 907–924, 2006 [DOI] [PMC free article] [PubMed] [Google Scholar]
- Margolis EB, Mitchell JM, Ishikawa J, Hjelmstad GO, Fields HL. Midbrain dopamine neurons: projection target determines action potential duration and dopamine D2 receptor inhibition. J Neurosci 28: 8908–8913, 2008 [DOI] [PMC free article] [PubMed] [Google Scholar]
- Matsumoto M, Hikosaka O. Two types of dopamine neuron distinctly convey positive and negative motivational signals. Nature 459: 837–841, 2009 [DOI] [PMC free article] [PubMed] [Google Scholar]
- Nair-Roberts RG, Chatelain-Badie SD, Benson E, White-Cooper H, Bolam JP, Ungless MA. Stereological estimates of dopaminergic, GABAergic and glutamatergic neurons in the ventral tegmental area, substantia nigra and retrorubral field in the rat. Neuroscience 152: 1024–1031, 2008 [DOI] [PMC free article] [PubMed] [Google Scholar]
- Niki H, Watanabe M. Prefrontal and cingulate unit activity during timing behavior in the monkey. Brain Res 171: 213–224, 1979 [DOI] [PubMed] [Google Scholar]
- Nobre A, Correa A, Coull J. The hazards of time. Curr Opin Neurobiol 17: 465–470, 2007 [DOI] [PubMed] [Google Scholar]
- Pan WX, Schmidt R, Wickens JR, Hyland BI. Dopamine cells respond to predicted events during classical conditioning: evidence for eligibility traces in the reward-learning network. J Neurosci 25: 6235–6242, 2005 [DOI] [PMC free article] [PubMed] [Google Scholar]
- Peters Y, Barnhardt NE, O'Donnell P. Prefrontal cortical up states are synchronized with ventral tegmental area activity. Synapse 52: 143–152, 2004 [DOI] [PubMed] [Google Scholar]
- Pragay EB, Mirsky AF, Nakamura RK. Attention-related unit activity in the frontal association cortex during a go/no-go visual discrimination task. Exp Neurol 96: 481–500, 1987 [DOI] [PubMed] [Google Scholar]
- Rohenkohl G, Cravo AM, Wyart V, Nobre AC. Temporal expectation improves the quality of sensory information. J Neurosci 32: 8424–8428, 2012 [DOI] [PMC free article] [PubMed] [Google Scholar]
- Romo R, Schultz W. Dopamine neurons of the monkey midbrain: contingencies of responses to active touch during self-initiated arm movements. J Neurophysiol 63: 592–606, 1990 [DOI] [PubMed] [Google Scholar]
- Schultz W. Multiple dopamine functions at different time courses. Annu Rev Neurosci 30: 259–288, 2007 [DOI] [PubMed] [Google Scholar]
- Schultz W. Predictive reward signal of dopamine neurons. J Neurophysiol 80: 1–27, 1998 [DOI] [PubMed] [Google Scholar]
- Schultz W, Dayan P, Montague PR. A neural substrate of prediction and reward. Science 275: 1593–1599, 1997 [DOI] [PubMed] [Google Scholar]
- Steffensen SC, Svingos AL, Pickel VM, Henriksen SJ. Electrophysiological characterization of GABAergic neurons in the ventral tegmental area. J Neurosci 18: 8003–8015, 1998 [DOI] [PMC free article] [PubMed] [Google Scholar]
- Swanson J, Baler RD, Volkow ND. Understanding the effects of stimulant medications on cognition in individuals with attention-deficit hyperactivity disorder: a decade of progress. Neuropsychopharmacology 36: 207–226, 2011 [DOI] [PMC free article] [PubMed] [Google Scholar]
- Swanson LW. The projections of the ventral tegmental area and adjacent regions: a combined fluorescent retrograde tracer and immunofluorescence study in the rat. Brain Res Bull 9: 321–353, 1982 [DOI] [PubMed] [Google Scholar]
- Takahata R, Moghaddam B. Glutamatergic regulation of basal and stimulus-activated dopamine release in the prefrontal cortex. J Neurochem 71: 1443–1449, 1998 [DOI] [PubMed] [Google Scholar]
- Tierney PL, Thierry AM, Glowinski J, Deniau JM, Gioanni Y. Dopamine modulates temporal dynamics of feedforward inhibition in rat prefrontal cortex in vivo. Cereb Cortex 18: 2251–2262, 2008 [DOI] [PubMed] [Google Scholar]
- Totah NK, Jackson ME, Moghaddam B. Preparatory attention relies on dynamic interactions between prelimbic cortex and anterior cingulate cortex. Cereb Cortex 23: 729–738, 2013 [DOI] [PMC free article] [PubMed] [Google Scholar]
- Totah NK, Kim YB, Homayoun H, Moghaddam B. Anterior cingulate neurons represent errors and preparatory attention within the same behavioral sequence. J Neurosci 29: 6418–6426, 2009 [DOI] [PMC free article] [PubMed] [Google Scholar]
- Ungless MA, Grace AA. Are you or aren't you? Challenges associated with physiologically identifying dopamine neurons. Trends Neurosci 35: 422–430, 2012 [DOI] [PMC free article] [PubMed] [Google Scholar]
- Ward RD, Kellendonk C, Kandel ER, Balsam PD. Timing as a window on cognition in schizophrenia. Neuropharmacology 62: 1175–1181, 2012 [DOI] [PMC free article] [PubMed] [Google Scholar]