Abstract
This investigation evaluated the utility of a physiologically based pharmacokinetic (PBPK) model, which incorporates model parameters representing key determinants of monoclonal antibody (mAb) target-mediated disposition, to predict, a priori, mAb disposition in plasma and in tissues, including tumors that express target antigens. Monte Carlo simulation techniques were employed to predict the disposition of two mAbs, 8C2 (as a non-binding control mouse IgG1 mAb) and T84.66 (a high-affinity murine IgG1 anti-carcinoembryonic antigen mAb), in mice bearing no tumors, or bearing colorectal HT29 or LS174T xenografts. Model parameters were obtained or derived from the literature. 125I-T84.66 and 125I-8C2 were administered to groups of SCID mice, and plasma and tissue concentrations were determined via gamma counting. The PBPK model well-predicted the experimental data. Comparisons of the population predicted versus observed areas under the plasma concentration versus time curve (AUC) for T84.66 were 95.4 ± 67.8 versus 84.0 ± 3.0, 1,859 ± 682 versus 2,370 ± 154, and 5,930 ± 1,375 versus 5,960 ± 317 (nM × day) at 1, 10, and 25 mg/kg in LS174T xenograft-bearing SCID mice; and 215 ± 72 versus 233 ± 30, 3,070 ± 346 versus 3,120 ± 180, and 7,884 ± 714 versus 7,440 ± 626 in HT29 xenograft-bearing mice. Model predicted versus observed 8C2 plasma AUCs were 312.4 ± 30 versus 182 ± 7.6 and 7,619 ± 738 versus 7,840 ± 24.3 (nM × day) at 1 and 25 mg/kg. High correlations were observed between the predicted median plasma concentrations and observed median plasma concentrations (r2 = 0.927, for all combinations of treatment, dose, and tumor model), highlighting the utility ofthe PBPK model forthe a priori prediction of in vivo data.
Keywords: Monoclonal antibody, Target-mediated disposition (TMD), Physiologically based pharmacokinetic (PBPK), Monte Carlo simulation, Preclinical pharmacokinetic, Tissue disposition
Introduction
Due to their selectivity and specificity, many monoclonal antibodies (mAbs) have been developed and evaluated for utility in treating cancer. Several anti-cancer mAbs have reached the market, including antibodies directed against soluble ligands associated with tumor growth (e.g., bevacizumab), antibodies directed against cell-surface proteins associated with hematological tumors (e.g., rituximab), and antibodies with affinity for cell surface proteins associated with solid tumors (e.g., trastuzumab, cetuximab and panitumumab) [1]. In addition to the mAbs that are in current clinical use, several anti-cancer mAbs are in various stages of clinical testing [2].
Antibodies targeting solid tumors must overcome a range of well-known hurdles, including: (a) heterogeneous vascularization and blood perfusion [3]; (b) inefficient lymphatic drainage, which leads to elevated hydrostatic pressure in the tumor interstitium and, thus, limits the rate of convective transport of antibodies into tumors[3, 4]; (c) the “binding site barrier”, where high affinity antibody binding to tumor antigens concentrates antibody in tumors to regions close to the site of antibody extravasation from tumor capillaries [5–8]; (d) nonspecific binding to proteins within the tumor milieu [3, 9]; and (e) rapid target-mediated mAb elimination within tumors, which acts as a sink that minimizes mAb concentrations in tumor interstitial fluids [10, 11].
Target-mediated disposition (TMD) of antibody may lead to a particularly dramatic effect on mAb concentrations within tumors. The influence of TMD on mAb disposition is a function of dose, the antigen expression level, rates of antigen “shedding”, rates of antigen internalization and turnover, rates of antibody extravasation and transport within tumors, and rates of antibody-target association and dissociation [5, 6, 12–18]. Given the complex nature of antibody disposition in tumors, prediction of antibody uptake and tumor distribution has been an elusive goal.
Few mathematical models have been developed to characterize or predict the tumor disposition kinetics of antibodies or antibody fragments [5, 13, 19]. However, there is growing interest in physiologically based pharmacokinetic (PBPK) models of mAb disposition, and mechanistic PBPK models may be well-suited for incorporation of mAb- and target-specific parameters to facilitate efforts to predict tumor distribution, including the disposition of mAb exhibiting TMD [20–26]. For example, PBPK models of IgG organ and tissue disposition [22] have been extended to characterize the influence of tumor-associated target-mediated mAb elimination on the plasma, tissue, and tumor disposition of a monoclonal anti-carcinoembryonic antigen antibody, T84.66 [23]. However, the predictive utility of this PBPK model, with modulation of known determinants of mAb disposition, has not been thoroughly evaluated.
The main objectives of this study were: (i) to investigate the impact of target antigen expression level and antibody specificity on the plasma, tissue and tumor disposition of mAb in tumor-bearing SCID mice, (ii) to incorporate information from the literature regarding antibody-target binding, target expression, and target-mediated antibody catabolism, to predict the plasma, tissue, and tumor disposition of mAb, with or without specific tumor binding, in tumor bearing-SCID mouse models, and (iii) to evaluate the PBPK model predictions by comparison with the experimental data.
Materials and methods
Antibodies, cells and reagents
T84.66, a murine anti-carcinoembryonic antigen IgG1 mAb (anti-CEA) and 8C2, a murine anti-topotecan IgG1 mAb, were used as model antibodies with high affinity (T84.66) or with no specific affinity (8C2) for tumor antigens. T84.66 was produced from the culture of hybridoma cells (HB-8747, ATCC, Manassas, VA), as described previously [23]. 8C2 was produced and purified following established methods [27]. Two CEA-expressing human colorectal adenocarcinoma cell lines, LS174T (CL-188, ATCC) and HT29 (HB-8747, ATCC), were employed for this work. LS174T human colon cancer cells were cultured in Minimum Essential Medium (Invitrogen, Grand Island, NY) supplemented with 10 % fetal bovine serum (Invitrogen) and 1 % penicillin–streptomycin (Invitrogen). HT29 human colon cancer cells were cultured in McCoy’s 5a modified medium (ATCC), supplemented with 10 % fetal bovine serum and 1 % penicillin–streptomycin. Sodium iodide (Na125I) was obtained from Perkin Elmer Life & Analytical Sciences (Waltham, MA). Trichloroacetic acid (TCA) was obtained from Sigma Life Science (St. Louis, MO), and Potassium iodide (KI) was from Fisher Scientific (Pittsburgh, PA). Phosphate-buffered saline (PBS) was obtained from Invitrogen.
Animals
Male severe compromised immune-deficient (SCID) mice (C.B-17/IcrHsd-PrkdcSCID), 4–5 weeks of age, were purchased from Harlan (Indianapolis, IN). The mice were housed individually in autoclaved filter-top cages under sterile conditions, and maintained on a 12-h light/12-h dark cycle. Mice were fed autoclaved laboratory animal chow and water ad libitum. All animal experiments were approved by the Institutional Animal Use and Care Committee of the University at Buffalo, The State University of New York.
Development of xenograft models
Suspensions of LS174T cells (~2.0 × 10⁶ cells/mouse) or HT29 cells (~5.0 × 10⁶ cells/mouse) in sterile PBS were injected subcutaneously into the left flank of SCID mice, and tumor growth was monitored. LS174T cells have been shown to exhibit high expression of CEA, whereas HT29 cells exhibit low-level expression of CEA. IgG was injected when tumor size reached 200–300 mm3 as measured using a Vernier caliper. Starting 2 days prior to injection of 125I-IgG, mice were kept on KI-autoclaved water (0.2 g/l) to block the thyroidal uptake of free iodine.
Iodination of IgG
IgG was labeled with 125I using a modified chloramine-T method, as described previously [22]. The purity of the iodinated IgG was assessed using thin layer chromatography (PE SiL-G, Whatman Ltd., Kent, England). For all in vivo experiments, the purity of the iodinated preparation was higher than 99 %.
Pharmacokinetic studies
Anti-CEA mAb (T84.66) pharmacokinetics
T84.66 pharmacokinetics were assessed in: (i) LS174T xenograft-bearing SCID mice, (ii) in HT29-xenograft bearing SCID mice, (iii) in non-tumor bearing (control) SCID mice. All groups of mice received T84.66 at dose levels of 1, 10 and 25 mg/kg. Additionally, T84.66 pharmacokinetics in HT29 xenograft-bearing mice were also investigated at 0.025 and 0.1 mg/kg. In all studies, mAbs were injected intravenously with a tracer dose (10 μCi/mouse) of 125I-labeled mAb (400 μCi/kg, ~0.03 Ci/mg specific activity of125I-T84.66 solution). The tracer comprised less than 1 % of the total T84.66 injected dose at the 1, 10, and 25 mg/kg dose levels. For dosing of 0.025 and 0.1 mg/kg, the dosing solution was prepared with a specific activity of 0.0862 Ci/mg, and 10 μCi of 125I-T84.66 corresponded to 28.5 or 5.98 % of the total injected dose.
8C2 pharmacokinetics
8C2 pharmacokinetics were investigated in LS174T xenograft-bearing SCID mice at 1 and 25 mg/kg. When tumor size reached 200–300 mm3, 8C2 was injected intravenously in mice at the predetermined dose, with a tracer amount of 125I-8C2 (10 μCi/mouse). The amount of mAb in the tracer dose was less than ~1 % of the total injected dose.
Assessment of antibody concentration in plasma, tissue, and tumor samples
Blood and other tissues were harvested from sub-groups of mice, at predetermined points, up to 10 days after dosing. For T84.66 pharmacokinetic studies in HT-29 tumor bearing mice, three mice were sacrificed at each time-point in the terminal portion of the time-course (i.e., at 4, 7 and 10 days), while 1–3 mice were sacrificed at earlier time points (1 h–1 day). For all other PK studies, three mice were sacrificed, from each treatment group, at each time point. Plasma samples were separated and TCA-precipitated as described previously [28]. Radioactivity was counted using a gamma counter (LKB Wallac 1272, Wallac, Turku, Finland). Radioactive counts from TCA-precipitated tissue and plasma samples were corrected for background and decay, and the counts were then converted to concentration (nM) based on the specific activity of the dosing solution. The densities of all tissues were assumed to be 1 g/ml.
Noncompartmental pharmacokinetic analysis (NCA)
The mean areas under the plasma or tissue concentration–time curves (AUC0–10 days), and the associated standard deviations, were calculated for each mAb using the NCA for sparse samples module in WinNonlin 6.1 (Phoenix, Pharsight Corporation, Palo Alto, CA). The sparse sampling module calculates the standard deviation associated with AUC0–10 days using a modified Bailer method [29, 30]. Plasma clearance (CLp) and volume of distribution at steady-state (Vss) were also determined using NCA.
Mathematical modeling
Model structure
A PBPK model evaluating the influence of the neonatal Fc receptor (FcRn) on plasma and organ disposition of mAbs and the influence of CEA on the target-mediated elimination of T84.66 was previously developed [23]. The intent of this work is to evaluate the utility of the model in predicting mAb pharmacokinetics in plasma, tumors, and in other tissues, using the published model structure, and incorporating literature-reported values for physiological parameters that are known determinants of the TMD of antibodies. These determinants include: antibody-target binding affinity, target expression levels, rates of internalization of mAb-target complexes, plasma and lymphatic flow rates, and the tumor vascular volume.
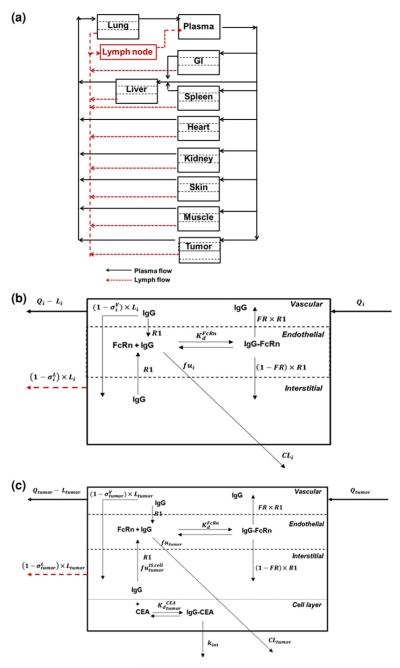
A schematic diagram of the PBPK model structure is shown in Fig. 1. The model structure includes compartments to represent the lung, gastrointestinal tract (GI), spleen, liver, heart, kidney, muscle, skin, lymph nodes, and tumor. Each organ was divided into vascular, endothelial, and interstitial spaces (Fig. 1b). An additional cellular sub-compartment was included in the tumor compartment, as described previously, to account for antibody interaction with cellular antigens (Fig. 1c) [23]. In each tissue, the mAb enters the tissue vascular space by plasma flow rate to that organ (Q) and exits by a reduced flow (Q–L) based on the lymphatic flow associated that organ (L). In the vascular space, the mAb is sieved through vascular pores into the interstitial sub-compartment, via convection, as dictated by lymph flow and the vascular reflection coefficient. Unbound mAb in the interstitial space is sieved out of the organ by convection, based on lymphatic flow rate and on the lymphatic reflection coefficient . Unbound mAb in the interstitial space is also allowed to enter the endosomal sub-compartment by a linear rate process (representing fluid-phase endocytosis). Plasma flow rates into non-tumor tissues, organ volumes, organ clearances, reflection coefficients, and FcRn-related transport parameters were obtained from a previously published PBPK model [23]. Parameters that were used in the model are defined in Tables 5, 6, 7 in Appendix 1, and the equations for the model are provided in Appendix 2.
Fig. 1.
Schematic diagram of the PBPK model of mAb disposition. a System Model: The plasma and lymphatic flow to and from each organ are presented by solid and dashed arrows. Each tissue within this model is divided into vascular, endosomal and interstitial sub-compartments. b Organ Model: Qi and Li are the plasma and lymph flow rates, R1 is the endosomal uptake and recycling rate constant for IgG, FR is the fraction of recycled antibody that is transported to the vascular compartment. The vascular and lymph reflection coefficients are and is IgG-FcRn equilibrium dissociation constant. CLi represents the rate of organ specific clearance of unbound IgG, and fui is the unbound fraction of IgG within the endosomal compartment. To allow for anti-cancer antibody interaction with cellular antigens, an additional cellular sub-compartment was assumed for tumor. c Tumor model: The model assumes equilibrium binding kinetics between T84.66 in the interstitial space and cellular CEA. The fraction of IgG not bound to CEA is , and the T84.66-CEA complex degrades irreversibly by the internalization rate constant, kint. The total T84.66 concentration in each tissue was based on the sum of the total antibody amount in each sub-compartment and divided by the weight of each organ. For the tumor compartment, the total tumor weight increased as a function of time, based on the growth rate of the tumor
Table 5.
Parameter symbols and definitions
| Parameter | Unit | Definition |
|---|---|---|
| Qorgan | ml/min | Plasma flow rate to organ |
| Lorgan | ml/min | Lymph flow rate to organ |
| Vp | ml | Volume of plasma compartment |
| ml | Volume of organ vascular space | |
| ml | Volume of organ endosomal space | |
| ml | Volume of vascular space | |
| Cplasma | M | Antibody concentration in plasma |
| Cplasma(0) | M | Antibody concentration in plasma at time zero |
| M | Antibody concentration in each organ vascular space | |
| M | Antibody concentration in each organ endosomal space | |
| M | Antibody concentration in each organ interstitial space | |
| CLorgan | ml/min | Antibody clearance from each organ |
| K0 | M/min | Endogenous IgG production rate |
| nptorgan | M | FcRn concentration in each organ |
| M | Antibody-FcRn equilibrium dissociation constant | |
| fuorgan | Fraction of antibody unbound to FcRn | |
| Fraction of antibody unbound to tumor antigen in the interstitial space | ||
| FR | Fraction of antibody recycled upon binding to FcRn | |
| R1 | min−1 | Endosomal uptake and recycling rate of antibody |
| Vascular reflection coefficient of each organ | ||
| Lymph reflection coefficient of each organ | ||
| Tau | min | Transit time for lymph transfer from lymph node to plasma |
| Xlymph | mol | Amount of antibody in lymph compartment |
| ml | Volume of tumor cellular sub-compartment | |
| M | Antibody-CEA equilibrium dissociation constant | |
| kint | min−1 | Antibody-CEA internalization rate constant |
| FA | Fraction of antigen available for antibody binding | |
| nPtorgan | M | Tumor antigen concentration in the tumor cellular space |
Table 6.
Organ-specific parameter values
| Organ | Total volume (ml) | Vascular volume (ml) | Interstitial volume (ml) |
Endosomal volume (ml) |
Plasma flow (ml/min) |
Organ clearance (ml/min) |
|---|---|---|---|---|---|---|
| Plasma | 0.774 | |||||
| Lung | 0.191 | 0.0191 | 0.057 | 9.55 × 10⁻⁴ | 1.43 × 10⁻⁶ | |
| GI | 3.45 | 0.1 | 0.6 | 1.73 × 10⁻² | 0.9 | 2.58 × 10⁻⁵ |
| Liver | 0.951 | 0.095 | 0.19 | 4.76 × 10⁻³ | 1.1 | 7.10 × 10⁻⁶ |
| Spleen | 0.1 | 0.01 | 0.02 | 5.00 × 10⁻⁴ | 0.05 | 7.47 × 10⁻⁷ |
| Heart | 0.133 | 0.007 | 0.019 | 6.65 × 10⁻⁴ | 0.28 | 9.93 × 10⁻⁷ |
| Kidney | 0.298 | 0.03 | 0.101 | 1.49 × 10⁻³ | 0.8 | 2.22 × 10⁻⁶ |
| Skin | 2.94 | 0.2 | 0.999 | 1.47 × 10⁻² | 1.21 | 2.19 × 10⁻⁵ |
| Muscle | 7.924 | 0.15 | 1.032 | 3.96 × 10⁻² | 0.8 | 5.92 × 10⁻⁵ |
Table 7.
PBPK model parameters
| Parameter | Unit | |
|---|---|---|
| nPtorgan | M | 1.64 × 10⁻⁴ |
| M | 7.50 × 10⁻⁷ | |
| FR | 0.715 | |
| R1 | min−1 | 5.0 × 10⁻⁴ |
| 0.95 | ||
| 0.80 | ||
| Tau | min | 127.7 |
Tumor compartment parameters and assumptions
The published PBPK model was shown to be most sensitive to tumor-related parameters [23], including the tumor vasculature reflection coefficient , tumor plasma flow rate (Qtumor), tumor lymph flow rate (Ltumor), the fraction of accessible antigens (FA), antigen concentration ([CEA]), antibody-antigen equilibrium dissociation constant (Kd), and the antibody-antigen internalization rate constant (kint). A literature survey was conducted to obtain in vitro or in vivo estimates of these key parameters. Plasma flow rate was set based on an estimated value in LS174T tumors using the 86Rb uptake method [20], with adjustment for the tumor weights observed over the study period. Reported values for the tumor lymph flow rates ranged from 0.07 to 10 % of blood flow to tumor [20, 31]. Given the high variability in literature reported values of the tumor lymph flow rate, we fixed Ltumor to 4 % of the tumor plasma flow rate, as assumed previously [23]. The mean literature reported values, and the associated standard deviations, for binding affinity, tumor antigen concentrations, and tumor vasculature reflection coefficients are summarized in Table 1.
Table 1.
PBPK model parameters
| Description | Parameter | Unit | Mean (SD) | References |
|---|---|---|---|---|
| CEA concentration in LS174T xenografts or cell lines | [CEA] (LS174T) | M | 1.52 × 10⁻⁶ (1.53 × 10⁻⁶) | [17, 21, 33, 35, 36] |
| CEA concentration in HT29 xenografts or cell lines | [CEA] (HT29) | M | 1.59 × 10 − 7 (1.7 × 10 − 7) | [32, 33, 35, 37, 38] |
| mAb-CEA internalization rate constant | kint | min−1 | 8.75 × 10⁻⁴ (2.45 × 10⁻⁴) | [11, 17] |
| mT84.66-CEA binding equilibrium dissociation constant | M | 2.33 × 10⁻¹¹ (1.27 × 10⁻¹¹) | [39, 40] | |
| Tumor vasculature reflection coefficient (sigma) | – | 0.734 (0.189) | [20, 23, 44] |
CEA concentrations in LS174T and HT29 tumors were based on measurements in excised xenograft tumors or in cells grown in culture. The CEA concentration in different LS174T or HT29 preparations varied substantially in reports from different groups, and this variability may be related to heterogeneity in antigen expression and to assay variability [17, 21, 32–38]. The fraction of accessible antigens in xenograft tumors was fixed to 0.203 [23]. The mean CEA concentration in LS174T tumors was ~tenfold higher than the mean CEA concentration in HT29 tumors (1,520 vs. 159 nM) (Table 1).
The rate of mAb-CEA internalization (kint) was based on in vitro measurements of the internalization of CEA or mAb-CEA complexes in CEA expressing cell lines. Endocytosis half-life has been reported to be in the range of 10–16 h in LS174T spheroids [11], and 11–17 h in other CEA expressing cell lines [11]. This internalization rate is consistent with values reported for cell-surface CEA turnover (15 h) [11, 17].
Values for the equilibrium T84.66-CEA dissociation constant were obtained via a variety of binding analysis methods, such as surface plasmon resonance [39], and cell binding assays with the use of radiolabeled and nonradiolabeled detection methods [40]. 8C2, the anti-to-potecan mAb, was assumed to show no specific binding for CEA. LS174T vascular volume was assumed to be 7 % of total tumor volume [20], and HT29 vascular volume was set to 2 % of total tumor volume [41]. Tumor growth rates were determined from the observed tumor growth, with characterization with a simple exponential growth function.
For anti-VEGF-treated LS174T-tumors, the tumor vascular volume was reduced by 65 % [42], and plasma and lymphatic flow rates were reduced by 50 % [43]. The tumor vascular permeability coefficient was “normalized” to 0.95, the value used for non-tumor tissues in the model. Anti-VEGF treatment was assumed to have no effect on CEA expression, internalization, or on CEA-mAb binding.
PBPK model simulations
Simulations were conducted using ADAPT 5 Version 5.0.42 (University of Southern California, BMSR, CA) to predict plasma, tumor, and tissue concentrations of mAb. The mean parameter estimate and the variance (SD2) were used to simulate mAb concentrations, assuming log-normal distributions for each parameter. Simulations predicted mAb concentration versus time data for the following: (i) T84.66 administered to LS174T xenograft-bearing SCID mice at 1, 10, and 25 mg/kg, (ii) T84.66 mAb administered to HT29 xenograft-bearing SCID mice at 0.025, 0.1, 1, 10, and 25 mg/kg, (iii) 8C2 mAb administered to LS174T-bearing SCID mice at 1 and 10 mg/kg, and (iv) T84.66 mAb administered at 10 mg/kg to LS174T xenograft mice that had been treated with anti-VEGF mAb [28]. For each treatment group, at each dose level, 1,000 virtual animals were simulated up to 10 days post dosing.
PBPK model evaluation
The population median, 5th, and 95th percentiles of mAb concentrations in plasma, tumors, and other tissues were calculated. The mean population AUC0–10 days (± SD) values for each tissue were also predicted by the model. Observed in vivo data of antibody plasma and tissue concentrations were compared to the prediction interval for each tissue. Additionally, mean plasma clearance values, plasma AUCs, and tissue AUCs were calculated from observed antibody concentration data and compared to model-predicted clearance and AUCs. Correlation between model predicted and observed median plasma concentrations was tested.
Results
T84.66 and 8C2 plasma pharmacokinetics
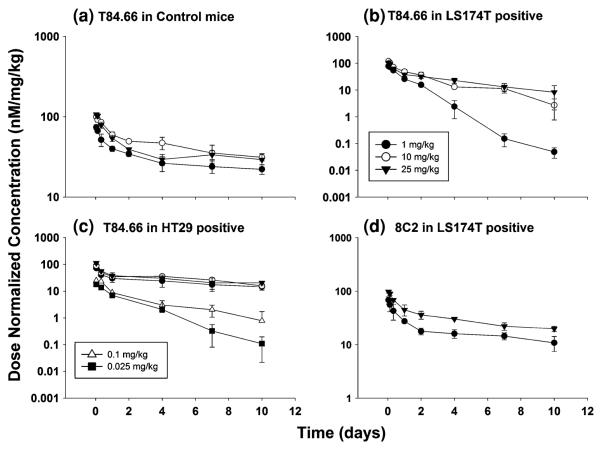
As summarized in Table 2 and depicted in Fig. 2, T84.66 exhibited rapid, nonlinear elimination in mice with CEA-expressing tumors. For comparison of disposition across the different groups of mice, pharmacokinetic parameters (Vss, CL) were determined via non-compartmental, moment analyses. It is important to note that the pharmacokinetics of T84.66 are likely to be inconsistent with two important assumptions of moment analysis (i.e., the assumptions of linear pharmacokinetics and the assumption that all T84.66 elimination occurs from sites that are in rapid equilibrium with plasma). Consequently, estimated values for plasma clearance should be interpreted as concentration- and time-averaged values, and estimates of Vss should be viewed with caution. T84.66 clearance, as estimated by moment analyses, was fourfold to 12.7-fold higher in LS174T-bearing mice compared to values observed for non-tumor bearing mice over the dose range of 1–25 mg/kg. Elimination of T84.66 was 1.8–2.8-fold faster in HT29- tumor-bearing mice compared to values in non-tumor bearing mice at 1–25 mg/kg. Evaluation of the dose normalized profiles (Fig. 2) of T84.66 in control and HT29–SCID mice suggests linear disposition over the 1–25 mg/kg dose range. However, nonlinear elimination was observed for T84.66 in LS174T–SCID mice. To further evaluate T84.66 disposition in HT29 tumor-bearing mice, additional investigations were conducted using doses of 0.025 and 0.1 mg/kg. At these doses, T84.66 was eliminated very rapidly, revealing a significant dose-dependency in clearance (Fig. 2). The plasma pharmacokinetics of 8C2 were assessed in LS174T-bearing SCID mice at 1 and 25 mg/kg. 8C2 exhibited bi-exponential disposition kinetics, with slower elimination relative to T84.66 (Table 2). 8C2 disposition showed more rapid clearance at 1 mg/kg (19.7 ml/day/kg) than at 25 mg/kg (10.6 ml/day/kg).
Table 2.
Summary parameters for plasma pharmacokinetics of T84.66 and 8C2
| Group | Dose (mg/ kg) |
CLp (ml/ day/ kg) |
Vss (ml/ kg) |
AUC0–10 days (nM × day) |
|---|---|---|---|---|
| T84.66_Control | 1 | 6.2 | 211 | 2.95 × 10² ± 11.8 |
| 10 | 5.5 | 127 | 4.54 × 10³ ± 2.0 × 10² | |
| 25 | 6.5 | 140 | 9.51 × 10³ ± 2.9 × 10² | |
| T84.66_LS174T | 1 | 79.3 | 93 | 84 ± 3.04 |
| 10 | 21.9 | 135 | 2.37 × 10³ ± 1.54 × 10² | |
| 25 | 23.2 | 125 | 5.96 × 10³ ± 3.17 × 10² | |
| 8C2-LS174T | 1 | 19.7 | 264 | 1.82 × 10² ± 7.55 |
| 25 | 10.6 | 188 | 7.84 × 10³ ± 24.3 | |
| T84.66-HT29 | 0.025 | 220 | 376 | 0.752 ± 0.123 |
| 0.1 | 130 | 388 | 4.81 ± 0.74 | |
| 1 | 16.1 | 193 | 2.34 × 10² ± 2.09 × 101 | |
| 10 | 15.8 | 117 | 3.15 × 10³ ± 1.81 × 10² | |
| 25 | 12.0 | 149 | 7.51 × 10³ ± 6.26 × 10² |
T84.66_Control refers to data collected from control, non-tumor bearing mice that were administered T84.66. T84.66_LS174T refers to data collected from SCID mice bearing LS174T xenograft tumors. 8C2_LS174T refers to 8C2 data collected from SCID mice bearing LS174T xenograft tumors. T84.66_HT29 refers to T84.66 data collected from SCID mice bearing HT29 xenograft tumors. T84.66 pharmacokinetics show clear dose dependencies, thus violating a major assumption for the use of moment analysis to determine disposition parameters. As such, estimates of CL and Vss should be viewed with caution
Fig. 2.
Dose normalized plasma concentration–time profiles for T84.66 and 8C2. Mean concentrations of T84.66 were normalized to the injected dose, and plotted vs. time for: (a) T84.66 in control, non-tumor bearing SCID mice, (b) T84.66 in LS174T-tumor bearing SCID mice, (c) T84.66 in HT29 tumor-bearing SCID mice, and (d) 8C2 PK in LS174T-tumor bearing SCID mice. Symbols for all panels: open triangle (0.025 mg/kg), filled square (0.1 mg/kg), filled circle (1 mg/kg), open circle (10 mg/kg), filled triangle (25 mg/kg)
Tumor disposition
T84.66 and 8C2 uptake into tumors increased with increasing dose, with highest uptake observed at 25 mg/kg. At each dose level, T84.66 tumor concentrations were higher in LS174T versus HT29 tumors, consistent with the higher antigen expression on LS174T cells. Following administration of mAb at 25 mg/kg, T84.66 AUC0–10 days was 3,610 ± 145 in LS174T and 1,765 ± 149 (nM × day) in HT29 tumors, while 8C2 AUC0–10 days was 2,565 ± 122 (nM × day) in LS174T tumors. The ratios of tumor to plasma AUC0–10 days, for all groups, are summarized in Table 3.
Table 3.
Tumor-to-plasma AUC ratios in xenograft bearing SCID mice
| Group | Dose (mg/kg) | Tumor:plasma AUC ratio (SD) |
|---|---|---|
| T84.66_LS174T | 1 | 1.33 (0.95) |
| 10 | 1.06 (0.39) | |
| 25 | 0.61 (0.14) | |
| 8C2-LS174T | 1 | 0.24 (0.03) |
| 25 | 0.34 (0.04) | |
| T84.66-HT29 | 0.025 | 0.18 (0.15) |
| 0.1 | 0.33 (0.23) | |
| 1 | 0.46 (0.16) | |
| 10 | 0.23 (0.03) | |
| 25 | 0.22 (0.03) |
T84.66_LS174T refers to T84.66 data collected from SCID mice bearing LS174T xenograft tumors. 8C2_LS174T refers to 8C2 data collected from SCID mice bearing LS174T xenograft tumors. T84.66_HT29 refers to T84.66 data collected from SCID mice bearing HT29 xenograft tumors
PBPK model simulations and evaluation
T84.66 pharmacokinetics in LS174T xenograft-bearing SCID mice
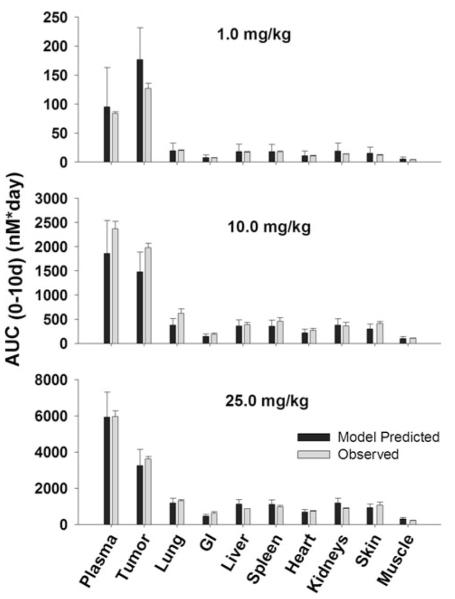
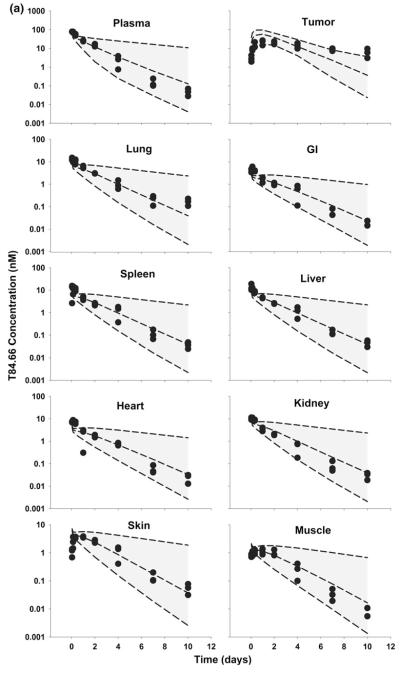
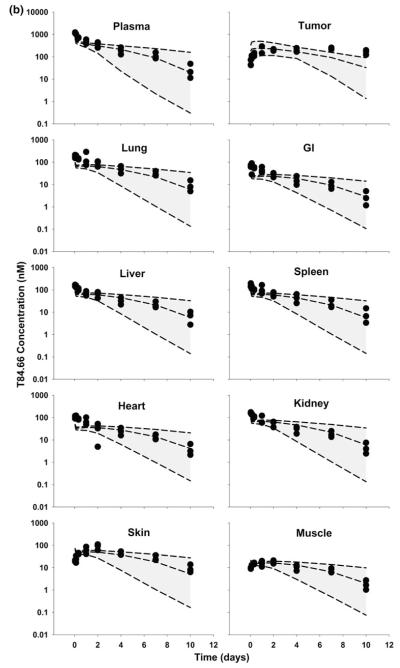
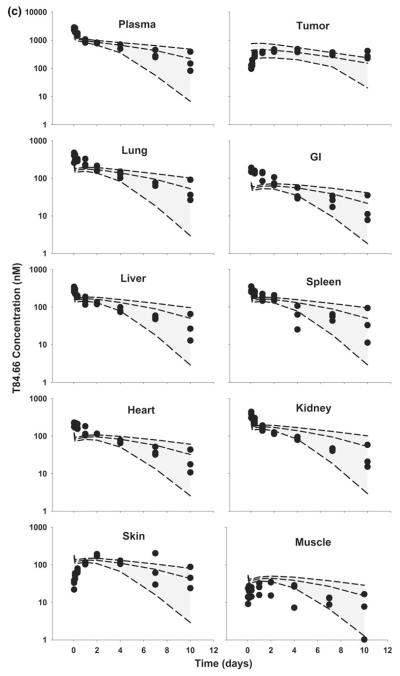
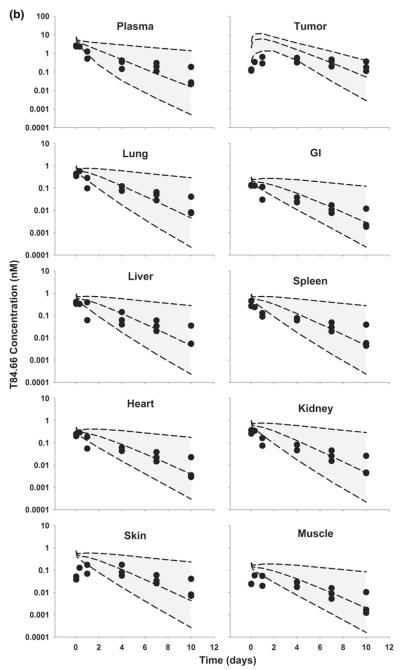
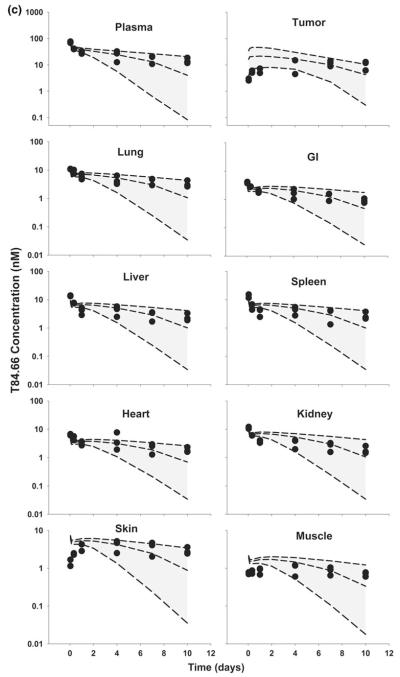
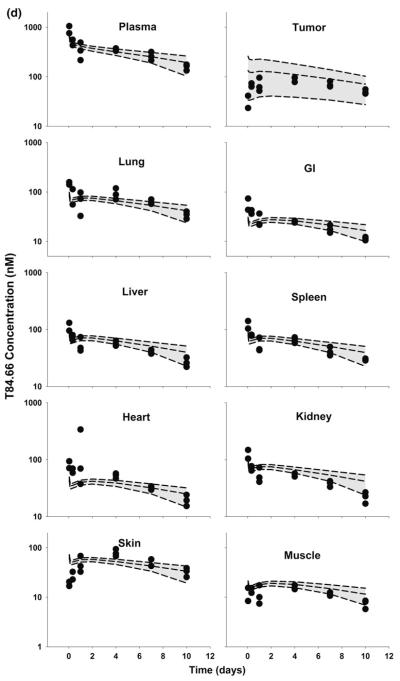
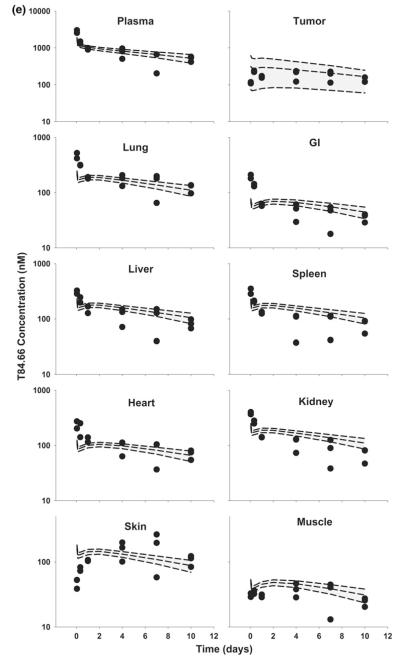
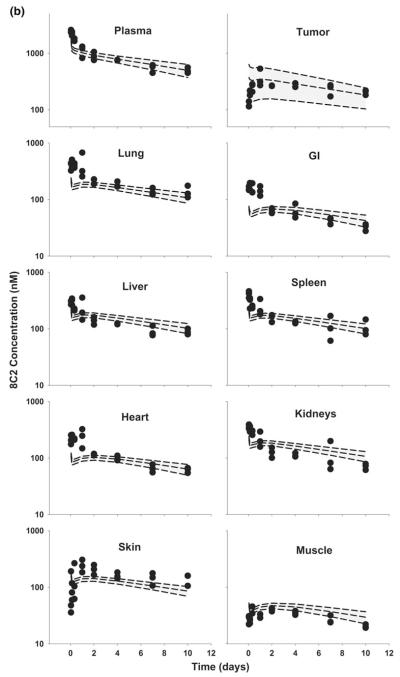
The PBPK model was used to simulate plasma, tumor, and tissue concentrations of T84.66 and 8C2. Comparison of model predictions and observed T84.66 concentrations in plasma and tissues of LS174T-bearing mice are shown in Figs. 3 and 4. PBPK model-predicted AUCs at each dose were comparable to observed AUCs in all tissues (Fig. 3), and Table 4 presents a comparison of model-predicted and observed values of CL. The observed T84.66 concentration–time profiles and the model-predicted population median and associated 90 % prediction intervals for LS174T- bearing mice are depicted in Fig. 4. As shown in the figure, T84.66 concentrations in plasma and other tissues are in good agreement with model predictions. At all investigated doses, the 90 % prediction intervals were relatively narrow at early time points, and the windows widened with time after dosing, reflecting the influence of variability in the primary determinants of mAb elimination. At higher dose levels (e.g., 25 mg/kg), where non-linear processes show a greater degree of saturation, the variability in the predicted profiles was less profound.
Fig. 3.
Comparison of PBPK model-predicted and observed T84.66 population mean AUCs in LS174T xenograft-bearing SCID mice. Black bars represent the predicted T84.66 AUC0–10 days in plasma, LS174T tumors, and other tissues. Error bars represent the standard deviation around the mean (n = 1,000 subjects). Gray Bars represent the observed mean T84.66 AUC0–10 days in plasma, tumor and other tissues. Sub groups of three mice were sacrificed at several time points (t = 1 h–10 days), AUCs were calculated using NCA for sparse sampling module (WinNonlin 6.1). Error bars represent the standard deviations around the mean calculated using a modified Bailer method
Fig. 4.
Comparison of PBPK model-predicted and observed T84.66 concentration data in mice bearing LS174T xenografts. Shaded areas represents the PBPK model-predicted 90 % confidence intervals (n = 1,000 subjects); dashed lines represent the predicted 5th, 50th and 95th percentiles. Filled circles depict the observed concentrations from individual mice. Shown curves represent T84.66 PK after intravenous injection at a 1 mg/kg, b 10 mg/kg, and c 25 mg/kg to LS174T-xenograft bearing SCID mice
Table 4.
Comparison of PBPK model predicted mean apparent clearance versus observed apparent clearance in SCID mice
| Group | Dose (mg/kg) |
CLp (predicted) ml/day/kg |
CLp(Observed) ml/day/kg |
|---|---|---|---|
| T84.66_LS174T | 1 | 61.8 | 79.3 |
| 10 | 32.1 | 21.9 | |
| 25 | 22.9 | 23.2 | |
| 8C2-LS174T | 1 | 10.7 | 19.7 |
| 25 | 11.7 | 10.6 | |
| T84.66-HT29 | 0.025 | 65.1 | 220 |
| 0.1 | 55.6 | 130 | |
| 1 | 26.4 | 16.1 | |
| 10 | 12.4 | 15.8 | |
| 25 | 11.1 | 12.0 |
T84.66_LS174T refers to T84.66 data collected from SCID mice bearing LS174T xenograft tumors. 8C2_LS174T refers to 8C2 data collected from SCID mice bearing LS174T xenograft tumors. T84.66_HT29 refers to T84.66 data collected from SCID mice bearing HT29 xenograft tumors
T84.66 mAb PK in HT29 xenograft-bearing SCID mice
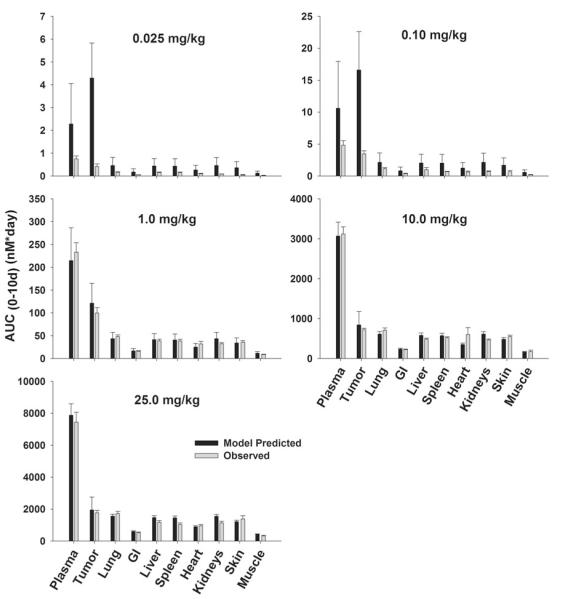
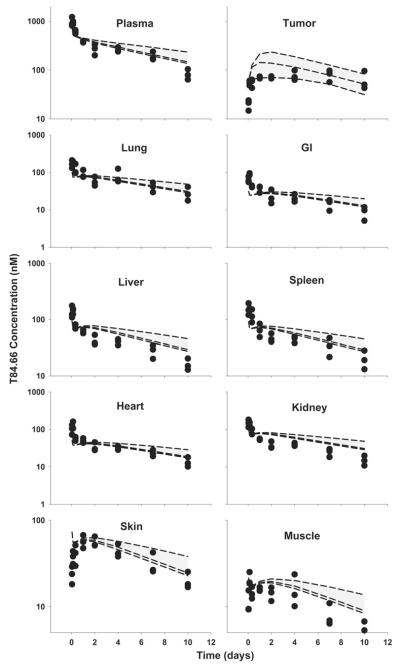
Model predictions of T84.66 concentration–time profiles in HT29-bearing mice, at doses of 0.025–25 mg/kg, are shown in Figs. 5 and 6. For doses of 0.025 and 0.1 mg/kg, T84.66 exhibited a rapid decrease in concentrations during the first several hours following mAb administration to HT29 xenograft-bearing mice, and this pharmacokinetic behavior was not well predicted by the model (Figs. 5, 6a, b). Model-predicted mean clearance values of 65.1 and 55.6 ml/day/kg under-predicted the observed clearance rates of 220 and 130 ml/day/kg at 0.025 and 0.1 mg/kg (Table 4).
Fig. 5.
Comparison of PBPK model-predicted and observed T84.66 population mean AUCs in HT29 xenograft-bearing SCID mice. Black bars represent the mean population predicted T84.66 AUC0–10 days in plasma, HT29 tumors, and other tissues. Error bars represent the standard deviation around the mean (n = 1,000 subjects). Gray bars represent the mean T84.66 AUC0–10 days in plasma, tumor and other tissues. Sub groups of 1–3 mice were sacrificed at several time points (t = 1 h–10 days). Error bars represent the standard deviations around the mean calculated using a modified Bailer method
Fig. 6.
Comparison of PBPK model-predicted and observed T84.66 plasma and tissue concentration versus time profiles in HT29 xenograft-bearing SCID mice. The shaded area represents the PBK model-predicted population confidence interval (n = 1,000 subjects). Dashed lines represent the predicted 5th, 50th and 95th percentiles. Filled circles represent the observed concentrations from individual mice. The curves represent T84.66 concentration versus time profiles after intravenous injection of a 0.025 mg/kg, b 0.1 mg/kg, c 1.0 mg/kg, d 10 mg/kg, e 25 mg/kg to HT29-xenograft bearing SCID mice
8C2 mAb PK in LS174T-bearing SCID mice
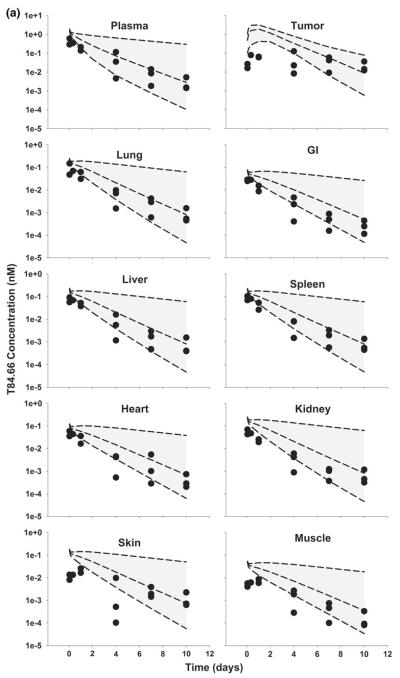
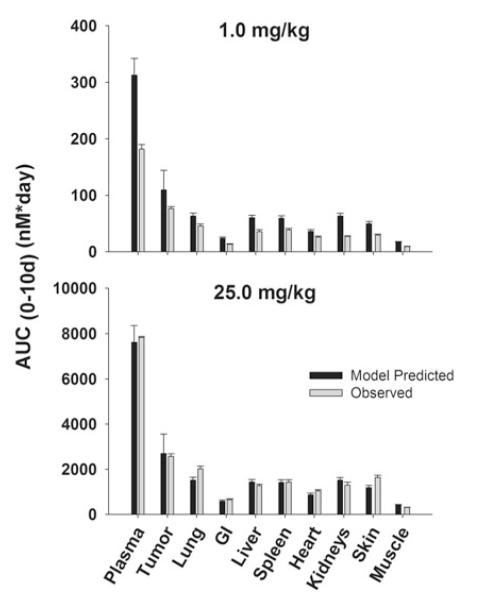
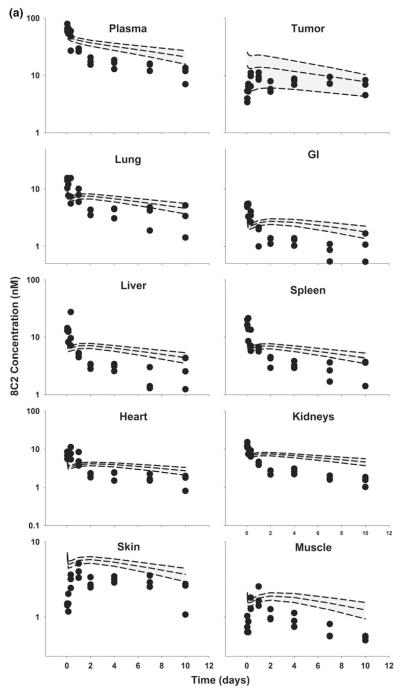
Unexpectedly, 8C2 demonstrated dose-dependent pharmacokinetics in the LS174T tumor model, with more rapid elimination at 1 versus 25 mg/kg. The relatively rapid elimination of 8C2 at 1 mg/kg was not predicted by the model (Figs. 7, 8). Interestingly, the observed clearance of 8C2, 19.7 ml/day/kg at 1 mg/kg and 10.6 ml/day/kg at 25 mg/kg, exceeded the observed clearance of T84.66 in control mice (6.2 and 6.6 ml/day/kg at 1 and 25 mg/kg) (Table 2). The observed rapid distribution of 8C2 in GI and heart, and the slower distribution in muscle and skin, were not well-predicted by the model. Nonetheless, the model captured 8C2 uptake and elimination in tumors fairly well, and observed tumor concentrations of 8C2 were within the 90 % confidence interval at all investigated time points.
Fig. 7.
Comparison of PBPK model-predicted and observed 8C2 AUC values in LS174T xenograft-bearing SCID mice. Black bars depict the mean population predicted 8C2 AUC0–10 days in plasma, LS174T tumors, and in other tissues. Error bars represent the standard deviation around the mean (n = 1,000 subjects). Gray bars represent the mean 8C2 AUC0–10 days in plasma, tumor, and other tissues. Sub groups of three mice were sacrificed at several time points (t = 1 h–10 days). Error bars represent the standard deviations around the mean, calculated using a modified Bailer method
Fig. 8.
Comparison of PBPK model-predicted and observed 8C2 plasma and tissue concentration versus time profiles in LS174T xenograft-bearing SCID mice. The shaded area represents the PBPK model-predicted confidence interval (n = 1,000 subjects), and dashed lines represent the predicted 5th, 50th and 95th percentiles. Filled circles represent the observed concentrations from individual mice. Curves depict 8C2 concentration versus time data after intravenous injection of a 1 mg/kg, and b 25 mg/kg into LS174T-xenograft bearing SCID mice
T84.66 PK in anti-VEGF treated LS174T xenograft-bearing SCID mice
In general, model predictions were in very good agreement with observed data (Figs. 9, 10). Reducing blood and lymphatic flow to the tumor, and reducing tumor vascular volume, led to predictions for decreased tumor uptake of T84.66 in the tumor, and the model predicted T84.66 plasma and tissues concentration versus time profiles quite well.
Fig. 9.
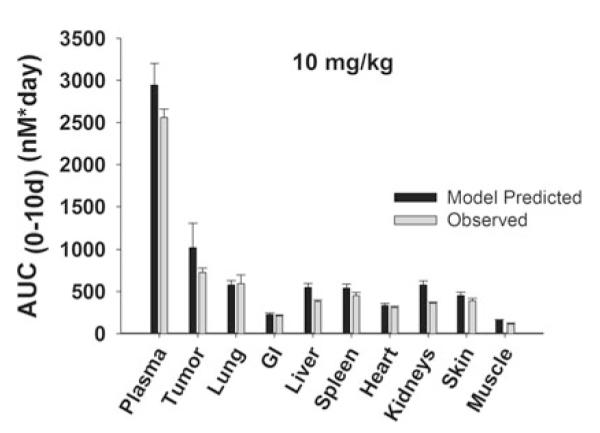
Comparison of PBPK model-predicted and observed AUCs in plasma and tissues in anti-VEGF treated, LS174T xenograft-bearing mice. Black bars represent the mean population predicted T84.66 AUC0–10 days in plasma, LS174T tumors, and in other tissues. Error bars represent the standard deviation around the mean (n = 1,000 subjects). Gray bars represent the mean T84.66 AUC0–10 days in plasma, tumor, and other tissues. Sub groups of three mice were sacrificed at several time points (t = 1 h–10 days), and AUCs were calculated using NCA with WinNonlin 6.1. Error bars represent the standard deviations around the mean, as calculated with a modified Bailer method
Fig. 10.
Comparison of PBPK model-predicted and observed T84.66 plasma and tissues concentration versus time profiles in anti-VEGF treated LS174T xenograft-bearing SCID mice The shaded area represents the PBPK model-predicted 90 % confidence interval (n = 1,000 subjects), and dashed lines depict the predicted 5th, 50th and 95th percentiles. Filled circles represent the observed concentrations from individual mice. Plots show T84.66 concentration versus time data following intravenous injection (10 mg/kg) into anti-VEGF treated LS174T xenograft-bearing SCID mice
There was a high correlation between the predicted population median concentrations and the observed median plasma concentration. The correlation coefficient (r2) value of 0.927 indicates good agreement between model predicted values and observed data, at all-time points, and for all simulation scenarios.
Discussion
This study evaluated the ability of a PBPK model to predict the plasma, tumor, and tissue concentration versus time profiles for monoclonal antibodies, with or without specific tumor binding, in mouse models. Experimental work was conducted with two different monoclonal antibodies (8C2 and T84.66), in two tumor models (LS174T and HT29) and in non-tumor bearing control mice, with co-administration of bevacizumab (to modulate tumor vascularization and blood flow), and at doses ranging from 0.025 to 25 mg/kg. Under these conditions, time-averaged estimates for plasma clearance of the mAb ranged from 5.5 to 220 ml/day/kg and time-averaged tumor-to-plasma exposure ratios ranged from 0.18 to 1.33. The simulation work employed a previously published PBPK model, which had been shown to allow accurate characterization of the dose-dependent plasma pharmacokinetics of an anti-carcinoembryonic antigen antibody, T84.66, in mice bearing LS174T xenografts [23]. For this study, literature reports were reviewed to obtain, or to allow derivation of, key parameters associated with the TMD of mAb, including antigen density for two different tumor models, antibody-antigen internalization rate constants, antibody-antigen affinity, tumor vascular reflection coefficients, and tumor blood flow rates. In general, the model provided very good, a priori predictions of mAb exposure in plasma, tumor, and in non-tumor tissues. Discussed below are the main assumptions of the model and of the parameter estimates, followed by discussion of the results and the implications of this work.
In several instances, the literature data used to estimate model parameters were associated with substantial uncertainty, and some simplifying assumptions were made. For example, reflection coefficients have not been directly measured for healthy tissues or for tumor samples. Literature reports indicate that tumor vessels are leakier in comparison to other organs, hence is anticipated to be smaller than the reflection coefficient that has been assumed for healthy organs (0.95). Reported values for the reflection coefficient in tumor blood vessels have been based on model fittings or from investigations conducted in vitro [23, 44]. Based on the reported values, which are viewed with relatively low confidence, a mean value of 0.734 ± 0.189 (25 % variability) was used in this work. For animals treated with bevacizumab, was assumed to “normalize” to 0.95. This normalization is consistent with the role played by VEGF in tumor vascular permeability [45], and with reports that indicate that the tumor vasculature is less permeable following treatment with anti-VEGF [46, 47]. Lymphatic capillaries, including tumor lymphatic capillaries, are expected to be quite porous and, consequently, the reflection coefficient for lymph capillaries was set at 0.2, as used in prior publications [22,23, 26]. As a result of the structure of our model, which is consistent with the majority of models that describe convective transport of macromolecules in tissues [20–26], mass transfer by convection is relatively insensitive to changes in the lymphatic reflection coefficient (i.e., as mass transfer is dependent on L × [1–σ] × C, and when σ is small, relatively large changes are required to influence mass transfer rates). Due to expectations for low sensitivity to the lymphatic reflection coefficient, and due to a lack of experimentally determined values, the lymphatic reflection coefficient was assumed to be the same in tumors and in healthy tissues.
Vastly different values for the lymphatic flow rate in tumors have been reported, ranging from 0.07 to 10.2 % of tumor plasma flow rate [20, 31]. Given the large variability in this value, and to minimize the impact of uncertainty in lymph flow rates in the population simulations, we assumed a median value of 4 % of plasma flow, as applied previously [23]. The poorly controlled growth of solid tumors is expected to lead to a decrease in tissue compliance and, potentially, to a collapse of lymphatic vessels within tumors [48]. This then leads to increased hydrostatic pressure in the tumor interstitial space, and to decreases in the rate of fluid entry into the tumor interstitial space. Dramatic reduction in the rate of lymph flow from tumors (L) may occur, resulting in substantial decreases in the mass transfer of macromolecules via convection (L × [1–σ] × C). The increased porosity of blood capillaries, in combination with decreased rates of lymph flow, is thought to be responsible for the “enhanced permeability and retention effect” for macromolecules within solid tumors [49]. The present PBPK model assumes that lymph flow is a fixed fraction of plasma flow, independent of tumor size. This assumption may be valid for relatively small tumors, such as those evaluated in this study. However, it is important to note that the simple structure of our PBPK model may be inappropriate for predicting mAb distribution within large tumors, where there is an increased likelihood for dramatic changes in tumor hydrostatic pressure gradients and lymph flow.
Tumor growth rate was expressed as exponential function of time over the study period, where the total tumor volume at any time point was defined as: , for LS174T tumors, and for HT29 tumors. In these equations, and Vtumor(0) represent the total and initumor volumes. The LS174T growth rate in the current investigation was similar to, but slightly faster than, the value reported previously for LS174T tumors (8.08 × 10⁻⁵ vs. 6.35 × 10⁻⁵/min) [23].
Plasma flow rate to tumors was based on the reported value of 0.212 ml/min/g tumor for LS174T tumors [20]. Initial efforts to model tumor blood flow as a function of tumor volume led to convergence problems with the software. As such, tumor blood flow and lymph flow rates were modeled as time-invariant constants. The plasma flow rate, 0.18 ml/min, was based on a tumor size of 0.85 g, which is close to the average tumor volume observed in this work. Of note, the largest tumor size observed in our in vivo studies was ~2 g for LS174T and ~1.3 g for HT29 tumors.
For anti-VEGF treated tumors, we assumed a 50 % reduction in plasma flow rate to tumor (0.087 ml/min). This assumption was based on our previous observation of ~50 % reduction in tumor permeability to Evans blue dye [28], and the observations of 50 % reduction in blood flow by Pastuskovas and coworkers in anti-VEGF treated ovarian cancer xenografts [43]. Anti-VEGF treated tumor growth rate was expressed as
The plasma flow rate to the lung was calculated as:
where Qi is plasma flow rate and Li is lymph flow rate to organ i. The lung flow rate was reduced from 4.24 to 4.15 ml/min after reducing the plasma flow rate to anti-VEGF treated tumors. The assumed minimal effect of bevacizumab on total plasma flow is consistent with a prior report that demonstrated that anti-VEGF treatment does not lead to alterations in the plasma flow rate to non-tumor tissues [50].
CEA plasma concentrations were not measured in this study. In prior work, CEA plasma concentration in LS174T-bearing mice was found to be less than 0.01 nM [23], which is 100,000-fold lower than the reported mean antigen concentration for LS174T tumors. Hence, the present model assumed that there is no significant shedding of antigen into plasma.
The variability (%CV) associated with literature reported T84.66-CEA equilibrium dissociation constants was 54.5 % (Table 1). The relatively high variability for this estimate is likely related to the use of different methods for assessment of binding affinity (e.g., surface plasmon resonance technology, [39] or cell binding assays [40]). Given the known impact of Kd on the terminal elimination profile for drugs demonstrating TMD [51], it is likely that uncertainty in Kd is a contributing factor to the simulated uncertainty in terminal portions of the predicted concentration versus time profiles.
Another important determinant of mAb TMD is the expression level of the target antigen (CEA). The tumor cell lines selected for this work, T84.66 and HT29, differ substantially in CEA expression, and this is consistent with the observed pharmacokinetic data. Following administration of doses of 1–25 mg/kg, T84.66 pharmacokinetics were highly dose-dependent in animals bearing LS174T tumors (Fig. 2), which demonstrate high expression of CEA. Interestingly, the disposition of T84.66 showed little dose-dependency over the dose range of 1–25 mg/kg in HT-29 xenograft bearing mice, where plasma clearance was 16.1, 15.8 and 12 ml/day/kg, and dose-normalized AUC0–10 days values were 234 ± 20.9, 315 ± 18.1, and 286 ± 25 nM × day/mg at 1, 10, and 25 mg/kg. This apparent linear, dose-independent pharmacokinetic behavior is consistent with saturation of TMD at much lower doses in HT29 tumor-bearing mice relative to LS174T tumor-bearing mice. To further investigate the possible non-linear pharmacokinetics of T84.66 in mice with HT29 tumors, two additional dose-levels were investigated: 0.025 and 0.1 mg/kg. Again, consistent with TMD mediated by low level antigen expression, clearance was found to be substantially increased (220 and 130 ml/day/kg).
The PBPK model well described the differences in the pharmacokinetics of T84.66 in the two different tumors. However, the model under-predicted LS174T tumor concentrations at late time-points. This under-prediction may be consistent with a time-dependency in T84.66 elimination from LS174T, perhaps indicating slow turnover of CEA following internalization of T84.66-CEA complexes. This hypothesis will require evaluation in future work.
Excellent agreement was observed between population-predicted median plasma concentration–time profiles and observed T84.66 data for HT29 tumor-bearing mice, at 1, 10 and 25 mg/kg (Fig. 6c, d, e). T84.66 observed plasma concentrations at 0.025 and 0.1 mg/kg were below the median population prediction (Fig. 6a, b). Additionally, the population prediction interval and the standard deviation associated with predicted mean AUC values were very large at the 0.025 and 0.1 mg/kg dose levels (Fig. 5). This relationship between confidence windows and dose is expected, as the simulation assumes that the primary factors impacting variability in mAb disposition are determinants of TMD. At low doses, TMD pathways are not saturated, and small differences in TMD determinants (e.g., CEA expression level, blood flow, lymph flow) lead to large effects on mAb disposition. At high mAb doses, TMD pathways are more completely saturated, and this minimizes the impact of variability in determinants of TMD. The over-prediction of T84.66 concentrations in plasma, tumor, and other tissues at low doses in HT29 xenograft-bearing mice is likely indicative of model mis-specification. Although not yet experimentally investigated, we hypothesize that the very high rate observed for T84.66 clearance (220 ml/day/kg) relates to low levels of shed CEA in plasma, and rapid elimination of soluble CEA-T84.66 complexes. This type of mAb elimination is a form of TMD, where T84.66 binding to soluble CEA mediates T84.66 elimination. However, elimination of T84.66 in complex with shed CEA removes the dependence of T84.66 TMD on tumor blood and lymph flow, thus allowing the rate of TMD clearance to exceed the maximal rate of convective uptake of mAb into the tumor interstitial space (note: ml/day/kg).
The model predicted the tumor uptake of 8C2 at 1 and 25 mg/kg very well. However, the observed rapid elimination of 8C2 from plasma and non-tumor tissues at 1 mg/kg was not captured by the model. The rapid elimination may be related to non-specific interactions of 8C2 that were not accounted for in the model. Formation of anti-8C2 antibodies may also explain the increased elimination observed for 8C2; however, this possibility is deemed unlikely, as the investigations have been performed in immune compromised mice, after a single intravenous dose, with short-term collection of samples. These conditions suggest that anti-drug antibody development is quite unlikely.
The model also provided very good prediction of the effects of bevacizumab treatment on T84.66 plasma, tissue, and tumor disposition. Prior work from our group and others has shown that bevacizumab treatment does not affect the plasma and non-tumor tissue pharmacokinetics of mAb; however, significant effects are observed on mAb distribution to tumor tissues (presumably due to bevacizumab effects on neovascularization in tumors, tumor blood flow, and tumor capillary permeability) [46].
The model predicted mAb concentrations in non-tumor tissues quite well. In most of the tested scenarios, the predicted concentrations were within the 90 % prediction interval. The model under predicted concentrations at early time points in tissues such as GI, heart and lung, and over predicted the early concentrations in muscle and skin. This deviation is likely related to assumptions inherent within the present model for identical values of the vascular reflection coefficient in all non-tumor tissues (0.95), and for consistent rates of fluid phase endocytosis of antibody in all tissues. Additional experimental and modeling work will be required to identify tissue-specific values relating to drivers of convective transport of mAb (e.g., lymph flow rates, σtissue), to evaluate whether this will allow improved prediction of mAb disposition.
In summary, this work evaluated several putative determinants of the disposition of monoclonal antibodies in mouse models of cancer, including antibody dose, target expression, mAb-target internalization rates, and antibody specificity for tumor antigens. Additionally, the impact of these factors on the plasma, tissue, and tumor pharmacokinetics was predicted via simulation with a PBPK model, through the use of parameter estimates derived from previously published work. The model provided very good prediction of the observed data for two different mAb, in two tumor models, with or without prior bevacizumab therapy. As such, our results indicate that PBPK modeling has potential for prediction of tumor and tissue concentration versus time data, which are typically inaccessible in preclinical and clinical evaluations of mAb disposition. It is anticipated that further development of mAb PBPK models, coupled with improved experimental methods to characterize target expression and dynamics, will allow accurate, a priori prediction of mAb plasma and tissue disposition in experimental models and, eventually, in humans.
Acknowledgments
This work was supported by funding from the Center for Protein Therapeutics and from the National Cancer Institute of the National Institutes of Health (CA114612).
Appendix 1.
Appendix 2.
Model equations
1. Plasma
| (1) |
2. Lung
2.1. Vascular space
| (2) |
2.2. Endothelial space
| (3) |
2.3. Interstitial space
| (4) |
3. Liver
3.1. Vascular space
| (5) |
3.2. Endothelial space
| (6) |
3.3. Interstitial space
| (7) |
4. Tumor
4.1. Vascular space
| (8) |
4.2. Endothelial space
| (9) |
4.3. Interstitial space
| (10) |
Please note: The model assumes an instantaneous binding equilibrium between unbound mAb and mAb in complex with tumor antigens. Binding to the target receptor influences the rate of mass loss from the interstitial space via convection (through influence on and via target-mediated clearance (via influence on .
5. Other organs (i)
5.1. Vascular space
| (11) |
5.2 Endothelial space
| (12) |
5.3. Interstitial space
| (13) |
6. Lymph node
| (14) |
7. For each organ, the fui to organ FcRn in the endosomal space was described as follow
| (15) |
| (16) |
For tumor compartment, the to tumor antigens in the interstitial space was described as follow:
| (17) |
8. Total antibody concentration was calculated as follow
| (18) |
For tumor compartment total tumor volume was defined using an exponential growth function, which represents the sum of all sub-compartments
| (19) |
Contributor Information
Lubna Abuqayyas, Department of Pharmaceutical Sciences, School of Pharmacy and Pharmaceutical Sciences, University at Buffalo, The State University of New York, 452 Kapoor Hall, Buffalo, NY 14260, USA.
Joseph P. Balthasar, Department of Pharmaceutical Sciences, School of Pharmacy and Pharmaceutical Sciences, University at Buffalo, The State University of New York, 452 Kapoor Hall, Buffalo, NY 14260, USA
References
- 1.Weiner LM, Surana R, Wang S. Monoclonal antibodies: versatile platforms for cancer immunotherapy. Nat Rev Immunol. 2010;10:317–327. doi: 10.1038/nri2744. [DOI] [PMC free article] [PubMed] [Google Scholar]
- 2.Yan L, Hsu K, Beckman RA. Antibody-based therapy for solid tumors. Cancer J. 2008;14:178–183. doi: 10.1097/PPO.0b013e318172d71a. [DOI] [PubMed] [Google Scholar]
- 3.Jain RK. Physiological barriers to delivery of monoclonal antibodies and other macromolecules in tumors. Cancer Res. 1990;50:814s–819s. [PubMed] [Google Scholar]
- 4.Jain RK. Tumor physiology and antibody delivery. Front Radiat Ther Oncol. 1990;24:32–46. [PubMed] [Google Scholar]
- 5.Fujimori K, Covell DG, Fletcher JE, Weinstein JN. A modeling analysis of monoclonal antibody percolation through tumors: a binding-site barrier. J Nucl Med. 1990;31:1191–1198. [PubMed] [Google Scholar]
- 6.Van Osdol W, Fujimori K, Weinstein JN. An analysis of monoclonal antibody distribution in microscopic tumor nodules: consequences of a “binding site barrier”. Cancer Res. 1991;51:4776–4784. [PubMed] [Google Scholar]
- 7.Juweid M, Neumann R, Paik C, Perez-Bacete MJ, Sato J, van Osdol W, Weinstein JN. Micropharmacology of monoclonal antibodies in solid tumors: direct experimental evidence for a binding site barrier. Cancer Res. 1992;52:5144–5153. [PubMed] [Google Scholar]
- 8.Sagan S, Charpentier S, Delfour A, Amiche M, Nicolas P. The aspartic acid in deltorphin I and dermenkephalin promotes targeting to delta-opioid receptor independently of receptor binding. Biochem Biophys Res Commun. 1992;187:1203–1210. doi: 10.1016/0006-291x(92)90431-j. [DOI] [PubMed] [Google Scholar]
- 9.Jain RK, Weissbrod JM, Wei J. Mass transport in tumors: characterization and applications to chemotherapy. Adv Cancer Res. 1980;33:251–310. doi: 10.1016/s0065-230x(08)60672-7. [DOI] [PubMed] [Google Scholar]
- 10.Levy G. Pharmacologic target-mediated drug disposition. Clin Pharmacol Ther. 1994;56:248–252. doi: 10.1038/clpt.1994.134. [DOI] [PubMed] [Google Scholar]
- 11.Schmidt MM, Thurber GM, Wittrup KD. Kinetics of anti-carcinoembryonic antigen antibody internalization: effects of affinity, bivalency, and stability. Cancer Immunol Immunother. 2008;57:1879–1890. doi: 10.1007/s00262-008-0518-1. [DOI] [PMC free article] [PubMed] [Google Scholar]
- 12.Weinstein JN, Eger RR, Covell DG, Black CD, Mulshine J, Carrasquillo JA, Larson SM, Keenan AM. The pharmacology of monoclonal antibodies. Ann N Y Acad Sci. 1987;507:199–210. doi: 10.1111/j.1749-6632.1987.tb45802.x. [DOI] [PubMed] [Google Scholar]
- 13.Fujimori K, Covell DG, Fletcher JE, Weinstein JN. Modeling analysis of the global and microscopic distribution of immunoglobulin G, F(ab’)2, and Fab in tumors. Cancer Res. 1989;49:5656–5663. [PubMed] [Google Scholar]
- 14.Weinstein JN, van Osdol W. Early intervention in cancer using monoclonal antibodies and other biological ligands: micropharmacology and the “binding site barrier”. Cancer Res. 1992;52:2747s–2751s. [PubMed] [Google Scholar]
- 15.Fracasso G, Colombatti M. Effect of therapeutic macromolecules in spheroids. Crit Rev Oncol Hematol. 2000;36:159–178. doi: 10.1016/s1040-8428(00)00084-6. [DOI] [PubMed] [Google Scholar]
- 16.Ackerman ME, Pawlowski D, Wittrup KD. Effect of antigen turnover rate and expression level on antibody penetration into tumor spheroids. Mol Cancer Ther. 2008;7:2233–2240. doi: 10.1158/1535-7163.MCT-08-0067. [DOI] [PMC free article] [PubMed] [Google Scholar]
- 17.Thurber GM, Wittrup KD. Quantitative spatiotemporal analysis of antibody fragment diffusion and endocytic consumption in tumor spheroids. Cancer Res. 2008;68:3334–3341. doi: 10.1158/0008-5472.CAN-07-3018. [DOI] [PMC free article] [PubMed] [Google Scholar]
- 18.Graff CP, Wittrup KD. Theoretical analysis of antibody targeting of tumor spheroids: importance of dosage for penetration, and affinity for retention. Cancer Res. 2003;63:1288–1296. [PubMed] [Google Scholar]
- 19.Thurber GM, Zajic SC, Wittrup KD. Theoretic criteria for antibody penetration into solid tumors and micrometastases. J Nucl Med. 2007;48:995–999. doi: 10.2967/jnumed.106.037069. [DOI] [PubMed] [Google Scholar]
- 20.Baxter LT, Zhu H, Mackensen DG, Jain RK. Physiologically based pharmacokinetic model for specific and nonspecific monoclonal antibodies and fragments in normal tissues and human tumor xenografts in nude mice. Cancer Res. 1994;54:1517–1528. [PubMed] [Google Scholar]
- 21.Ferl GZ, Wu AM, DiStefano JJ., 3rd A predictive model of therapeutic monoclonal antibody dynamics and regulation by the neonatal Fc receptor (FcRn) Ann Biomed Eng. 2005;33:1640–1652. doi: 10.1007/s10439-005-7410-3. [DOI] [PubMed] [Google Scholar]
- 22.Garg A, Balthasar JP. Physiologically-based pharmacokinetic (PBPK) model to predict IgG tissue kinetics in wild-type and FcRn-knockout mice. J Pharmacokinet Pharmacodyn. 2007;34:687–709. doi: 10.1007/s10928-007-9065-1. [DOI] [PubMed] [Google Scholar]
- 23.Urva SR, Yang VC, Balthasar JP. Physiologically based pharmacokinetic model for T84.66: a monoclonal anti-CEA antibody. J Pharm Sci. 2010;99:1582–1600. doi: 10.1002/jps.21918. [DOI] [PubMed] [Google Scholar]
- 24.Covell DG, Barbet J, Holton OD, Black CD, Parker RJ, Weinstein JN. Pharmacokinetics of monoclonal immunoglobulin G1, F(ab’)2, and Fab’ in mice. Cancer Res. 1986;46:3969–3978. [PubMed] [Google Scholar]
- 25.Davda JP, Jain M, Batra SK, Gwilt PR, Robinson DH. A physiologically based pharmacokinetic (PBPK) model to characterize and predict the disposition of monoclonal antibody CC49 and its single chain Fv constructs. Int Immunopharmacol. 2008;8:401–413. doi: 10.1016/j.intimp.2007.10.023. [DOI] [PMC free article] [PubMed] [Google Scholar]
- 26.Shah DK, Betts AM. Towards a platform PBPK model to characterize the plasma and tissue disposition of monoclonal antibodies in preclinical species and human. J Pharmacokinet Pharmacodyn. 2012;39:67–86. doi: 10.1007/s10928-011-9232-2. [DOI] [PubMed] [Google Scholar]
- 27.Chen J, Balthasar JP. Development and characterization of high affinity anti-topotecan IgG and Fab fragments. In: Gad SC, editor. Handbook of pharmaceutical biotechnology. Wiley; Hoboken: 2007. pp. 835–850. [Google Scholar]
- 28.Abuqayyas L, Balthasar JP. Pharmacokinetic mAb–mAb Interaction: Anti-VEGF mAb decreases the distribution of anti-CEA mAb into colorectal tumor xenografts. AAPS J. 2012;14(3):445–455. doi: 10.1208/s12248-012-9357-2. [DOI] [PMC free article] [PubMed] [Google Scholar]
- 29.Nedelman JR, Gibiansky E, Lau DT. Applying Bailer’s method for AUC confidence intervals to sparse sampling. Pharm Res. 1995;12:124–128. doi: 10.1023/a:1016255124336. [DOI] [PubMed] [Google Scholar]
- 30.Nedelman JR, Jia X. An extension of Satterthwaite’s approximation applied to pharmacokinetics. J Biopharm Stat. 1998;8:317–328. doi: 10.1080/10543409808835241. [DOI] [PubMed] [Google Scholar]
- 31.Butler TP, Grantham FH, Gullino PM. Bulk transfer of fluid in the interstitial compartment of mammary tumors. Cancer Res. 1975;35:3084–3088. [PubMed] [Google Scholar]
- 32.Greiner JW, Ullmann CD, Nieroda C, Qi CF, Eggensperger D, Shimada S, Steinberg SM, Schlom J. Improved radioim-munotherapeutic efficacy of an anticarcinoma monoclonal antibody (131I-CC49) when given in combination with gamma-interferon. Cancer Res. 1993;53:600–608. [PubMed] [Google Scholar]
- 33.Guadagni F, Witt PL, Robbins PF, Schlom J, Greiner JW. Regulation of carcinoembryonic antigen expression in different human colorectal tumor cells by interferon-gamma. Cancer Res. 1990;50:6248–6255. [PubMed] [Google Scholar]
- 34.Esteban JM, Kuhn JA, Felder B, Wong JY, Battifora H, Beatty JD, Wanek PM, Shively JE. Carcinoembryonic antigen expression of resurgent human colon carcinoma after treatment with therapeutic doses of 90Y-alpha-carcinoembryonic antigen monoclonal antibody. Cancer Res. 1991;51:3802–3806. [PubMed] [Google Scholar]
- 35.Shi ZR, Tsao D, Kim YS. Subcellular distribution, synthesis, and release of carcinoembryonic antigen in cultured human colon adenocarcinoma cell lines. Cancer Res. 1983;43:4045–4049. [PubMed] [Google Scholar]
- 36.Berk DA, Yuan F, Leunig M, Jain RK. Direct in vivo measurement of targeted binding in a human tumor xenograft. Proc Natl Acad Sci USA. 1997;94:1785–1790. doi: 10.1073/pnas.94.5.1785. [DOI] [PMC free article] [PubMed] [Google Scholar]
- 37.Wagner HE, Toth CA, Steele GD, Jr, Thomas P. Metastatic potential of human colon cancer cell lines: relationship to cellular differentiation and carcinoembryonic antigen production. Clin Exp Metastasis. 1992;10:25–31. doi: 10.1007/BF00163573. [DOI] [PubMed] [Google Scholar]
- 38.Friedman J, Seger M, Levinsky H, Allalouf D. Modulation of carcinoembryonic antigen release by HT-29 colon carcinoma line in the presence of different agents. Experientia. 1987;43:1121–1122. doi: 10.1007/BF01956058. [DOI] [PubMed] [Google Scholar]
- 39.Hefta LJ, Neumaier M, Shively JE. Kinetic and affinity constants of epitope specific anti-carcinoembryonic antigen (CEA) monoclonal antibodies for CEA and engineered CEA domain constructs. Immunotechnology. 1998;4:49–57. doi: 10.1016/s1380-2933(98)00004-9. [DOI] [PubMed] [Google Scholar]
- 40.Wagener C, Clark BR, Rickard KJ, Shively JE. Monoclonal antibodies for carcinoembryonic antigen and related antigens as a model system: determination of affinities and specificities of monoclonal antibodies by using biotin-labeled antibodies and avidin as precipitating agent in a solution phase immunoassay. J Immunol. 1983;130:2302–2307. [PubMed] [Google Scholar]
- 41.Rowlinson-Busza G, Maraveyas A, Epenetos AA. Effect of tumour necrosis factor on the uptake of specific and control monoclonal antibodies in a human tumour xenograft model. Br J Cancer. 1995;71:660–665. doi: 10.1038/bjc.1995.131. [DOI] [PMC free article] [PubMed] [Google Scholar]
- 42.Shah DK, Shin BS, Veith J, Toth K, Bernacki RJ, Balthasar JP. Use of an anti-vascular endothelial growth factor antibody in a pharmacokinetic strategy to increase the efficacy of intraperitoneal chemotherapy. J Pharmacol Exp Ther. 2009;329:580–591. doi: 10.1124/jpet.108.149443. [DOI] [PMC free article] [PubMed] [Google Scholar]
- 43.Pastuskovas CV, Mundo EE, Williams SP, Nayak TK, Ho J, Ulufatu S, Clark S, Ross S, Cheng E, Parsons-Reponte K, Cain G, Van Hoy M, Majidy N, Bheddah S, Dela Cruz Chuh J, Kozak KR, Lewin-Koh N, Nauka P, Bumbaca D, Sliwkowski M, Tibbitts J, Theil FP, Fielder PJ, Khawli LA, Boswell CA. Effects of Anti-VEGF on Pharmacokinetics, Biodistribution, and Tumor Penetration of Trastuzumab in a Preclinical Breast Cancer Model. Mol Cancer Ther. 2012;11:752–762. doi: 10.1158/1535-7163.MCT-11-0742-T. [DOI] [PubMed] [Google Scholar]
- 44.Topp EM, Kitos PA, Vijaykumar V, DeSilva BS, Hendrickson TL. Antibody transport in cultured tumor cell layers. J Control Release. 1998;53:15–23. doi: 10.1016/s0168-3659(97)00234-4. [DOI] [PubMed] [Google Scholar]
- 45.Carmeliet P, Jain RK. Angiogenesis in cancer and other diseases. Nature. 2000;407:249–257. doi: 10.1038/35025220. [DOI] [PubMed] [Google Scholar]
- 46.Jain RK. Normalizing tumor vasculature with anti-angiogenic therapy: a new paradigm for combination therapy. Nat Med. 2001;7:987–989. doi: 10.1038/nm0901-987. [DOI] [PubMed] [Google Scholar]
- 47.US Food and Drug Administration (FDA) [Accessed April 2011];Label for Avastin (bevacizumab) 2011 http://www.accessdata.fda.gov/drugsatfda_docs/label/2009/125085s0168lbl.pdf.
- 48.Jain RK. Transport of molecules in the tumor interstitium: a review. Cancer Res. 1987;47:3039–3051. [PubMed] [Google Scholar]
- 49.Maeda H. The enhanced permeability and retention (EPR) effect in tumor vasculature: the key role of tumor-selective macromolecular drug targeting. Adv Enzyme Regul. 2001;41:189–207. doi: 10.1016/s0065-2571(00)00013-3. [DOI] [PubMed] [Google Scholar]
- 50.Boswell CA, Ferl GZ, Mundo EE, Bumbaca D, Schweiger MG, Theil FP, Fielder PJ, Khawli LA. Effects of anti-VEGF on predicted antibody biodistribution: roles of vascular volume, interstitial volume, and blood flow. PLoS One. 2011;6:e17874. doi: 10.1371/journal.pone.0017874. [DOI] [PMC free article] [PubMed] [Google Scholar]
- 51.Abraham AK, Krzyzanski W, Mager DE. Partial derivative-based sensitivity analysis of models describing target-mediated drug disposition. AAPS J. 2007;9:E181–E189. doi: 10.1208/aapsj0902020. [DOI] [PMC free article] [PubMed] [Google Scholar]


