

Abstract
Purpose
The purpose is to address the problem in magnetic resonance imaging (MRI) of contrast agent dilution.
Procedures
In situ magnetic labeling of cells and MRI were used to assess distribution and growth of human hepatic stem cells (hHpSCs) transplanted into SCID/nod mice. It was done with commercially available magnetic microbeads coupled to an antibody to a surface antigen, Epithelial Cell Adhesion Molecule (EpCAM), uniquely expressed in the liver by hepatic progenitors.
Results
We validated the microbead connection to cells and related MRI data to optical microscopy observations in order to develop a means to quantitatively estimate cell numbers in the aggregates detected. Cell counts of hHpSCs at different times post-transplantation revealed quantifiable evidence of cell engraftment and expansion.
Conclusions
This magnetic labeling methodology can be used with any antibody coupled to a magnetic particle to target any surface antigen that distinguishes transplanted cells from host cells, thus facilitating studies that define methods and strategies for clinical cell therapy programs.
Keywords: Magnetic resonance imaging (MRI), Cell labeling and tracking, Human hepatic stem cells, Cell therapies, EpCAM
Introduction
The paucity of livers available for orthotopic liver transplantation results in an increased interest in liver cell therapies in which suspensions of cells are injected into the livers of patients with liver failure [1–3]. Cells obtained from a single donated liver are used to treat multiple patients. Furthermore, the surgical procedures for cell therapies are less drastic, potentially safer, and more economical than whole organ transplantation. As part of those investigations, tracking methods are being explored for ways to follow what happens to the donor cells after transplantation, both in terms of their final location within the host, and whether they demonstrate expansion within the host tissues.
Labeling and noninvasive detection of transplanted cells are areas of active research in molecular imaging, involving a variety of imaging modalities. For short-term (i.e., several days to a few weeks) monitoring, cells pre-labeled with, for example, superparamagnetic iron oxide (SPIO)-contrast agents, can be readily detected using MRI [4, 5]. The challenge of the pre-labeling approach for all modalities is that the labels invariably fade over time as their concentrations become diluted after each cell proliferation cycle. Alternative approaches, ideally those that allow cells of interest and imaging labels to be transplanted or administered separately, are needed for long-term cell tracking. A promising method has been developed for positron emission tomography (PET) using a combination of cells transfected with herpes simplex virus thymidine kinase and a special class of 18F radiolabels [6–8]. However, techniques for post-transplantation labeling and detection remain elusive for MRI, despite that the modality offers the advantages of better spatial resolution and involves non-ionizing radiation.
Another challenge for all cell therapies from solid organs is that transplantation is done by a vascular route, the current method of choice, and the cell populations engraft partially into the target tissue but also distribute to other tissues. In the case of liver cell therapies, the most common ectopic sites are the lungs and kidneys [2, 9,10]. This general issue is a major factor in ongoing debates as to whether liver cell therapies should be done with mature parenchymal cells or with hepatic progenitors [2, 11, 12]. The mature cells yield higher engraftment, since they are larger (>20 μm), have a propensity for clumping leading to aggregates of cells lodged within the sinusoids of the liver or in any tissue to which they go, and the aggregates facilitate engraftment. The disadvantages are that the clumps increase the risk of life-threatening emboli formation, especially in the lungs; the cells are highly immunogenic resulting in the need for immunosuppressive therapy; and the effects of the donor cells can be transient. By contrast subpopulations of hepatic progenitors are (1) small (7–12 μm), (2) have lower engraftment (<5%) if injected by the portal vein and higher engraftment (similar to that of mature cells) if injected into the hepatic artery, (3) rarely lead to emboli, (4) have minimal or negligible immunogenicity, and (5) the cells that do engraft into the liver offer long-term effects for the patient. The debates are spurring investigations to identify better methods for transplantation, methods that can be assessed most easily if there is the ability to track the cells after transplantation.
We are focused on developing forms of liver cell therapies utilizing human hepatic progenitors, particularly human hepatic stem cells, hHpSCs, that are small (7–9 μm in diameter) and give rise to hepatoblasts, hHBs,(10–12 μm in diameter), that in turn mature into the hepatocytic and biliary cellular lineages of the liver. The hHpSCs can be immunoselected from cell suspensions of fetal and postnatal livers of all donor ages as cells positive for both epithelial cell adhesion molecule, EpCAM, and neural cell adhesion molecule, NCAM [13,14]. The hHpSCs have been extensively characterized and conditions identified for their ex vivo expansion and differentiation [14–19]. In addition to EpCAM and NCAM, the hHpSCs express E-cadherin, CD133/1, albumin, Sonic and Indian hedgehog proteins and their receptor, Patched, cytokeratins (CK 8, 18, and 19), telomerase protein within the nucleus [17], have a metabolomics profile typical of stem cells [20], and are negative for α-fetoprotein (AFP), intercellular adhesion molecule (ICAM-1), and all forms tested of P450s. They are negative also for markers of hemopoietic cells (CD34, CD38, CD14, CD45, CD90, glycophorin A), endothelial cells (CD31, Von Willebrand Factor, VEGFr, CD146) and mesenchymal cells (desmin, α-smooth muscle actin, vitamin A, CD146) [13,19].
Transplantation of hHpSCs must include strategies for tracking them in vivo to (1) monitor cells at a designated site, (2) define rigorously the cell seeding densities, (3) track cell integration within the host tissues, and (4) assess cell proliferation of the transplanted cells within the liver. Here we present a method for in vivo cell MRI tracking enabling non-invasive monitoring of the hHpSCs after transplantation. The methods identified consist of marking the cells, pre- and/or post-cell transplantation, with magnetic nanoparticles coupled to a surface antigen antibody that can distinguish transplanted cells from host cells. The transplanted hHpSCs were detected by MRI signals that were confirmed and calibrated against in vitro signal responses utilizing established cell spheroid aggregates with known cell numbers. A major novelty of the current study is the detection of transplanted cells with MRI contrast agents administered after transplantation, which paves the way for monitoring cell distribution and growth in long term studies.
Materials and Methods
Human Fetal Livers
Livers from human fetuses between 16–20 weeks gestational age were obtained from an accredited agency (ABR) within 18 hours of isolation and arrived in a medium, Kubota’s Medium (KM), found effective for hepatic progenitors [21], supplemented with 5% fetal bovine serum, and maintained at 4°C.
Media and Solutions
All media and buffers were sterile-filtered (0.22-μm filter) and kept in the dark at 4°C before use. RPMI-1640 (Gibco/Invitrogen, Carlsbad, CA) was used as the basal medium for cultures. All reagents except those noted were obtained from Sigma (St. Louis, MO).
Kubota’s medium (KM) was designed originally for hepatoblasts [21] and now has been found effective for hHpSCs [13,14, 22]. It consists of any basal medium (here being RPMI 1640) with no copper, low calcium (0.3 mM), 10−9 M selenium, 0.1% BSA, 4.5 mM nicotinamide, 0.1 nM zinc sulfate heptahydrate, 10−8 M hydrocortisone, 5 μg/ml transferrin/Fe, 5 μg/mL insulin, 10 μg/mL high density lipoprotein, and a mixture of free fatty acids that are added bound to purified human serum albumin. Details of its preparations are given in a recent methods review [23].
Preparation of Cell Suspensions and of Cultures
Cell Preparations
Cell suspensions of human fetal livers were prepared as described previously [13, 23]. The original cell suspension is comprised of multiple parenchymal cell populations [hHpSCs (~1–3%), hHBs (~80–82%), and committed progenitors (1–2%)] and various non-parenchymal cells [endothelia, stellate cells, and hemopoietic cells (collectively 12–15%)]. Parenchymal cell aggregates were separated from floating non-parenchymal cells by repeated slow spin centrifugation. The parenchymal cells were then subjected to another round of collagenase digestion to yield a single cell suspension and resuspended in KM. Stock parenchymal cell suspensions routinely had viabilities exceeding 98% on day 0 as assessed by trypan blue exclusion analysis.
Culture selection of hHpSCs was done as described previously [23]. Approximately 3×10⁵ cells were plated onto a 10-cm culture dish (cat# 08–771–24; Fisher Scientific, Pittsburgh, PA) and in KM with 5% fetal bovine serum, FBS (cat# 26140–079, GIBCO, Carlsbad, CA). After the cells attached (within a few hours), the medium was changed to serum-free KM and further medium changes with serum-free KM occurred every 3 days. Colonies formed within 3–5 days and were observed for up to 3 months. Each colony is comprised of hHpSCs to which angioblasts are closely associated; the angioblasts give rise to hepatic stellate cell precursors that are found just outside the perimeter of the colony [13,14, 24]. For the experiments, hHpSC colonies were picked by hand after 14–18 days using an inverted microscope (1X-FLAIII; Olympus, Japan and Melville, NY). Representative hHpSC colonies are shown in Fig 1d–f.
Figure 1.
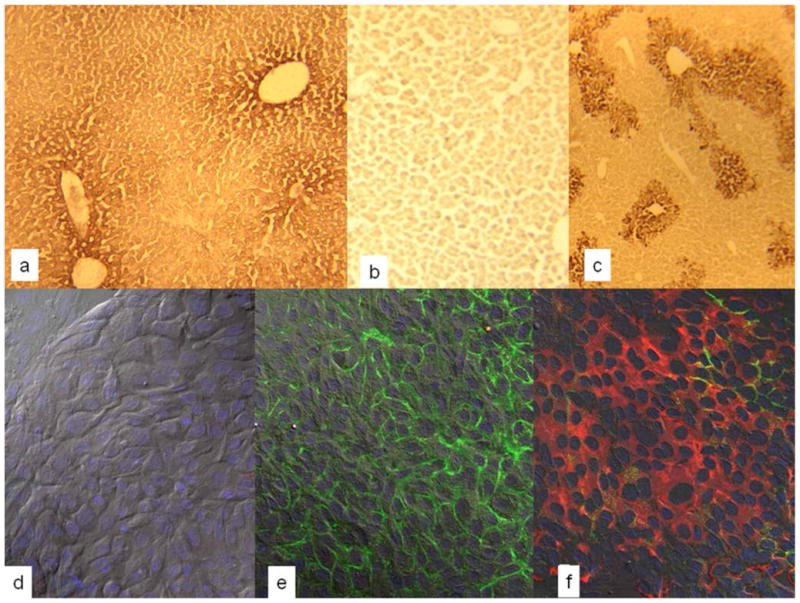
(a–c) Sections of livers of SCID/nod mice transplanted with hHpSCs and sacrificed at day 7 after transplantation and stained either for human albumin (a) or human alpha-fetoprotein (c). As a control, a section of liver from a transplanted mouse was stained with an isotype control for alpha-fetoprotein (b). Antibodies to human albumin demonstrated some cross-reactivity with murine albumin resulting in less distinction between host cells and transplanted cells. Nevertheless, there is sufficient distinction enabling the recognition of the colony of human cells within the host liver cells. (d–f) Colonies of human hepatic stem cell (hHpSCs) showing expression of epithelial cell adhesion molecule, EpCAM, present throughout the cells and especially at the cell surface. In all of them the nucleus is stained with DAPI=blue. (d) Digital interference contrast images with DAPI staining providing a higher magnification of an hHpSCs colony; (e) Immunohistochemistry of the hHpSC colony for EpCAM (green); (f) Immunohistochemistry of the hHpSC colony for EpCAM (green) and NCAM (red).
Mice and Rats
C57Bl/6 SCID/nod mice were purchased from Jackson Laboratories (Bar Harbor, Maine) and Sprague Dawley rats from Charles River (Raleigh, NC). The mice were housed in a barrier facility and the rats in a standard animal room on the campus of the University of North Carolina-Chapel Hill (UNC-CH), NC. Animals received care according to the Division of Laboratory Animal Medicine, UNC-CH guidelines, ones approved by AALAC.
Transplantation of hHpSCs into Immunocompromised Hosts
Animals were anesthetized with 40–85 mg/kg pentobarbital injected intraperitoneally (IP) and treated after the “toe pinch” reflex displayed a pain-free state. For survival studies and post transplantation, animals were given analgesics, Ketamine HCL (100mg/kg) mixed with Xylazine (5–16 mg/kg), intraperitoneally (IP), and warmed under a heat lamp for 15 minutes to assist in post-surgery recovery. An additional dose of Ketamine HCL and Xylazine IM was administered 8 hours later. For studies not requiring survival of the animals, the animals were anesthetized by IP injection and monitored until the “toe pinch” reflex displayed them to be pain free. They were then immediately exsanguinated, and liver, lungs, kidneys, and other tissues were dissected free and fixed with paraformaldehyde. The abdominal cavity was opened; the aorta was cannulated and then clamped; and the portal vein was severed. Then, 60mls of 1x phosphate buffered saline (PBS) was retro-flowed through the liver at 8 ml/minute to clear the liver of red blood cells before proceeding as described below.
Tissue Procurement from Transplanted Mice
After euthanasia, the liver was removed, cut into 2 mm3 portions, and saturated in 30% sucrose 1x PBS. Tissues were then embedded in Tissue-Tek O.C.T. Compound (Sakura), snap frozen utilizing a 100% ethanol bath surrounded by liquid nitrogen, prepared for 5 μm thick frozen sections, and the sections mounted on tissue culture slides. Routine examinations were made in some sections stained with hematoxylin-eosin (H&E) and with the others for immunohistochemistry. In Fig. 1a-c are shown representative sections of host livers transplanted with hHpSC cells.
Immunohistochemistry: Paraffin Embedded Tissues
Serial sections (5 μm thick) were prepared of formalin-fixed, paraffin-embedded livers from mice that were transplanted with hHpSCs or from controls not transplanted with cells. The sections were incubated twice in PBS with 0.3% Triton X-100 for 10 minutes and then in 0.3% hydrogen peroxide solution in order to block endogenous peroxidase activity. The sections were then blocked with serum and treated with an Avidin-Biotin blocking kit. This kit and associated reagents for avidin-biotin staining are all from Vector Laboratories (Burlingame, CA). The blocking was used to inhibit non-specific binding in the tissue and then incubated with primary antibody overnight at 4 °C. Protease digestion using the Auto/Zyme Reagent Set (Biomeda, Foster City, CA) was employed for CK-19 staining before blocking with serum. Sections were then incubated with biotinylated secondary antibody and ABC reagents of the Vectastain Elite Universal ABC kit according to the manufacturer’s instructions. The secondary antibody was detected using the Avidin-Biotin-Peroxidase method with 3,3′-diaminobenzidine as the substrate. Negative controls were performed by omitting the primary antibody and/or using isotype control antibodies. These controls revealed minimal or no background staining (data not shown).
Immunochemistry: Frozen Sections
Sections were fixed in 50/50 acetone-methanol for 2 minutes, washed in PBS, and blocked with 10% goat serum for 45 minutes. The sections were then exposed to primary conjugated human antibody at room temperature for 1-to-8 hours. Details of antibody concentrations are listed in Table 1.
Table 1.
Antibodies utilized in labeling hHpSCs
| Company | Product |
|---|---|
| Becton Dickenson | NCAM (CD56), 1:250 (BD# 340363); ICAM-1 (CD54) 347977); Conjugated isotype controlsMouse IgG FITC and PE (#349041 and 349043) |
| Myltenyi BIotec | mouse anti-human EpCAM, 1:200 |
| Neomarkers | EpCAM, 1:750 (# MS-155-P1ABX) |
| NovaCastra | CK19, 1:300 and 1:100 (#NCL-CK19) |
| Sigma | Albumin, 1:1200 (# A6684); AFP, 1:250; NCAM (CD56), 1:250 (#C9672) |
| Zymed | AFP (# 18–0003); CK8/18, 1:1000 (# 18–0213) |
Magnetic Beads
Magnetic bead immunoselection technologies make use of magnetic beads coupled to a specific antigen antibody that are presented to cells [4]. In this study, HEA-125 antibodies to EpCAM coupled to magnetic iron microbeads were obtained from Miltenyi Biotech (Bergisch Gladbach, Germany, recently cataloged as CD326 Microbead). The EpCAM antibody-microbead has an overall diameter of 50–100 nm, well within viral particle size magnitudes of < 200 nm, and is a surface tagging agent that can be endocytosed into the cell. Since the agent is a magnetic label, it is expected to enhance T2 and T2* relaxations and lead to hypointensity or signal voids in MR spin echo or gradient echo scans.
Labeling the Cells with EpCAM-Magnetic Microbeads
Cells were exposed to an EpCAM-microbead concentration of 10 μL EpCAM antibody/microbead per 107 cells in 100 μl buffer for 40 minutes at 4°C (Miltenyi Biotech, Bergisch Gladbach, Germany) using KM as the buffer. After HEA-125 labeling, excess microbeads were washed from cells. If the cells were on culture plastic, they were removed from the dishes mechanically and transferred into 1% agarose gels. If the cells were in suspension, they were collected as pellets after centrifuging at 250 revolutionary centrifugal force (RCF) for 5 min. Pelleted cells were resuspended and seeded at 83,500 cells/cm2 onto dishes.
Label Confirmation
Twenty-four hours post labeling, the cultures were washed with 1x PBS, and prepared for transmission electron microscopy (TEM) using a Zeiss LEO 910 TEM (Carl Zeiss, SMT, Germany and Thornwood, NY).), a Zeiss Supra 25 Field Emission scanning electron microscopy, and a Kevex 7000 energy dispersive x-ray imaging system (Noran System of Thermo Scientific, Waltham, MA). All are available in the Microscope Services Facility at UNC (core director: Dr. Robert Bagnell). For TEM, the cultures were fixed in a 0.1M sodium cacodylate solution with 3% glutaraldehyde and 0.05M CaCl2 at pH 7.4. For SEM and EDX, the cultures were washed with 1x PBS, fixed in a 0.15M sodium phosphate solution with 3% glutaraldehyde at pH 7.4. For EDX, the hHpSCs were seeded onto 0.4 μm culture inserts (cat #353493; Becton Dickinson, Franklin Lakes, NJ) for improved EDX analysis.
Aggregates of hHpSCs
3-Dimensional (3-D) aggregates of hHpSCs were generated from cell stock suspensions by placing cells in culture dishes containing KM and placing the dishes on Thermolyne Orbital Rotomix M71735 rocker platforms (Krackeler, Scientific, Albany, NY). Platforms were placed inside an incubator (37°C, 5% CO2) and rockers swayed at 10 rpm. Small aggregates were removed after a10-minute duration, while larger aggregates were generated over 90-minute intervals. The radius, diameter, and area of the harvested cell aggregates were determined with hematocytometer and phase contrast imaging. Area measurements and volumetric extrapolations were made assuming a single hHpSC has a radius of ~8 μm, and the descendents of hHpSCs, the hepatoblasts, have a single cell radius of ~11 μm, findings supported in direct measurements done in prior studies [13–15].
Pre-transplantation MRI
MR imaging was done at Duke University’s Center for In Vivo Microscopy using a 7.0 T 21-cm horizontal bore Magnex magnet interfaced to a GE EXCITE console (EPIC 12.4; GE Medical Systems). To analyze the efficiency of detecting labeled cells by MRI, labeled and unlabeled cells were embedded in 1% agarose on 35 mm petri dishes. Two-dimensional gradient echo (4.0 cm FOV, 15 ms TE, 250 ms TR, 30° flip angle, 256 × 256 matrix size) and 3D spin echo images (0.5 mm slice thickness, 90° angle, 4.0 cm FOV, TR = 250 ms, TE = 15 ms, 4 averages) spanned the thickness of the tissue. Cell aggregate diameters and areas were measured using known micrograph border dimensions, either 4cm x 4cm or 5cm x 5cm. Agarose gels without any cells were used for the calibrations.
Validation of MRI Detectability of Labeled Cells In Situ
To determine whether labeled cells can be detected in situ, labeled and unlabeled hHpSCs were transplanted directly into livers of Sprague Dawley rats and then immediately imaged. Labeled or unlabeled hHpSCs (n = ~2E6) suspended in 70 μl of KM were transplanted into the liver through portal vein catheterization. Since the livers were to be isolated for imaging (to enhance the signal strength), a potential complication arises from the paramagnetic property of deoxygenated blood. Consequently, the liver was perfused with 4% paraformaldehyde containing Magnevist, gadopentetate dimeglumine (Berlex Imaging, Montville, N.J.) at a 20:1 liquid suspension to remove red blood cells and enhance T1 imaging. The organ was then excised and kept in 4% paraformaldehyde. For MRI, the isolated livers were placed on a 3.0 cm-diameter surface RF coil. Acquired images consisted of both 2D interleaved, multislice gradient echo (0.5 mm slice thickness, 4.0 cm FOV, TR = 250 ms, TE = 15 ms, 4 averages) and 3D spin echo images (0.5 mm slice thickness, 90° angle, 4.0 cm FOV, TR = 250 ms, TE = 15 ms, 4 averages) that spanned the thickness of the tissue.
Post-Transplantation Labeling and MRI
For cell transplantation, 2E6 labeled or unlabeled hHpSCs suspended in 70 μL KM were transplanted into the spleens of SCID/nod mice by exteriorizing a small segment of spleen from the mouse’s left lateral side. The cells were injected intra-splenically using a gastight syringe and RN series needles (Hamilton, cat #1710 and #80427). Once transplanted, the spleen was repositioned within the peritoneum, and the site sutured closed. In the study, 16 animals were used and divided into four groups (each with n=4): 1) sham studies, in which the animals were subjected to mock surgery; 2) controls injected with microbeads but without cells; 3) controls transplanted with unlabeled cells; and 4) mice transplanted with labeled cells. On days 6 and 18, and for groups 1, 2, and 3, 15 μL of HEA-125 (EpCAM)-microbeads were mixed with 85 μl PBS solution and infused into the circulatory blood stream via mouse tail vein injection. Eight hours post infusion, the mice were sacrificed and perfusion fixed via left ventricle cardiac cannulation in preparation for MRI. In group 4, because cells were pre-labeled prior to transplantation, mice were not exposed to the 85 μL PBS-EpCAM-microbead solution, but they were fixed and MR imaged at the same times as groups 1, 2, and 3. For MR imaging, animals were positioned within a 4.0 cm-diameter birdcage RF coil for tissue investigations and analyzed as described above for the isolated livers. For confirmation the MRI images were of transplanted human cells, the livers were prepared for immunohistochemical analyses as described above.
Data Analyses
All experiments were repeated with suspensions of hHpSCs from at least three independent tissue isolations, with triplicate measurements per experiment. All data sets were plotted using Sigma Plot (SPSS Science) or Microsoft Excel (Microsoft, Redmond WA), where each graph’s error bars indicate ± one standard deviation.
Results
Epithelial Cell Adhesion Molecule, EpCAM, is a Surface Marker on hHpSCs
Transplantation of EpCAM+ cells into SCID/nod mice resulted initially in cells clustered near the central veins and detectable with antibodies to human albumin (Fig 1a). The hHpSCs do not express AFP [13], but after transplantation into the livers of the murine hosts, they expanded and matured within a few days to hepatoblasts with strong expression of human AFP (Fig 1c). In studies reported elsewhere, longer periods of time in vivo resulted in fully mature human liver cells [13]. Fig. 1b is an image of a liver section stained with an isotope control antibody.
In cultures, the hHpSCs undergo clonogenic expansion on plastic and in serum-free KM (Fig 1. d–f). The hHpSCs strongly express EpCAM (green labeling in Fig. 1e and 1f) and also NCAM (red staining of cells in Fig. 1f). The nuclei are visible by staining with 4′, 6-diamidino-2-phenylindole (DAPI) (Fig. 1d–f).
Labeling of hHpSCs with Magnetic Microbeads Tagged with EpCAM Antibody
Magnetic beads are available in varying sizes, but those found especially useful are very small beads that are the size of viral particles (50–100 nm). Access of such particles to tissues will vary with the 3 known categories of capillaries comprised of 1) continous capillaries (skeletal muscle, heart, skin), 2) fenestrated capillaries (intestinal mucosa, endocrine and exocrine glands, kidney), and 3) discontinuous capillaries (reticulo-endothelial tissues including the liver, bone marrow and spleen). The width of inter-endothelial gaps (also called clefts) in continous capillaries are 20–60 Å and accommodate only ions and water; those in fenestrated capillaries are ~60–80 nm and allow small molecules and some proteins; and those in reticulo-endothelial cells are 30–40 μm and allow hemopoietic cells and large molecules. In addition, in all 3 categories, there are endothelial cell pores, called “fenestrae”, of two sizes, the larger one being 200–300 Å and that accommodate transport of molecules of varying size across the endothelia cell [25].
Schematics depicting cell-bead-MRI relations are shown in Fig 2 on which is a representative bead (Fig 2a) and its attachment to cells via antibodies (Fig 2b).
Figure 2.

Schematics demonstrating the principle of contrast labeling cells for MR imaging. (a) Schematics of the magnetic microbeads coupled to an antibody. (b) Schematic of microbeads bound to a human hepatic stem cell, hHpSC. (c) Schematic to explain the enhancement of MRI by use of the microbeads.
The internalization and surface attachment of HEA-125 (EpCAM) microbeads into/onto hHpSCs was confirmed by transmission electron microscopy (TEM) and scanning electron microscopy (SEM) analyses on cultured cells (Fig 3). Control images for both TEM and SEM consisted of unlabeled cells. The experimental groups consisted of hHpSCs labeled with EpCAM microbeads. The high magnification (2000x) TEM micrograph shown in Fig 3a displays a heterogeneous distribution of 80 nm diameter glycogen particles throughout the cell’s interior, seen as gray and black dotted specks. The detail Fig 3b (31500x image) further displays the spheroid structure of glycogen. Glycogen’s dark contrast and size can cause it to interfere with recognition of microbead-labeled cells and single contrast agents 50–100 nm in size. For contrast-labeled cells, as shown in Fig 3c and 3d, glycogen is again seen within the cells interior. As shown in both figures, several large particles having ~222 nm diameters are observed in the cell’s interior. These particles are much larger than those for glycogen or individual EpCAM microbeads (e.g. 50nm <×<100nm) and are due to aggregation of microbeads.
Figure 3.

Transmission Electron Microscopy (TEM, a–d), Scanning Electron Microscopy (SEM, e–i), and Emission Dispersive X-ray (EDX, Line graph and j) displaying human cells labeled with HEA-125 antibodies coupled to magnetic microbeads (Miltenyi). (a–d) Ability to detect the microbeads, and to distinguish them from glycogen particles (small arrows) occurs with aggregates yielding a size above 200 μm (large arrows); (e) SEM of hHpSCs that is not labeled with the beads; (f-iI) SEM of hHpSCs labeled with the beads (arrows denote the beads); (j) The line graph is from EDX analyses and shows that the beads on the cells contain the elements known to be in the EpCAM-microbeads, notably iron.
Further characterization of EpCAM microbeads on cells is shown with the SEM micrographs in Fig 3e-i. A SEM control, Fig 3e, illustrates two hHpSCs in close physical contact and without labeling with EpCAM microbeads. The cells’ surfaces are fairly smooth and absent of irregularities caused by microbead surface attachments. Contrastingly, Fig 3f shows a contrast-labeled cell with large numbers of EpCAM microbeads on the left lateral cell surface (arrows). Further illustrations of these microbeads are shown in Fig 3g-i in which cells labeled with EpCAM microbeads and viewed at increasing image magnifications. Figure 3g displays large clumps of microbead aggregates. Figure 3h illustrates enhanced microbead detail with many intertwined beads connected to form a “web mesh” on the cell’s surface. Figure 3i illustrates EpCAM microbeads clustered on cell surfaces with detectable diameters ranging from 100 nm (smallest) to 500nm (medium) to 4166 nm (large) magnitudes.
To confirm that the imaged particles are the EpCAM magnetic microbeads, energy dispersive x-ray imaging system (EDX) was used to provide a “snapshot” view of the microbeads atomic structure, as displayed in the line graph in Fig 3j. As the graph shows, multiple peaks over a 0–10 KeV range are distinctly labeled. The peak for Fek iron (Fe) as determined by K-shell valance electron removal (kα) at 6.3 KeV, indicates that the microbeads contain iron. Other components include magnesium (Mg), aluminum (Al), silicone (Si), and silver (Ag). The white specks in Fig 3j are illustrative of EDX signals associated with microbead-labeled cultured cells.
MRI of hHpSCs in Agarose Gels
Representative MR images of agarose-embedded cells, with and without labeling, are shown in Fig 4, including 1) gel only without cells, 2) gel with unlabeled cells, and 3) gels with labeled cell aggregates. For the agarose-only control (Fig 4a), the image depicts a relatively homogeneous light gray background. Few MR signal irregularities were observable, including background intensity nonuniformity due to RF coil magnetic field inhomogeneity (e.g. lower quarter of the FOV) and intensity voids arising from large (e.g., lower left side of the dish marked by ⇓) and miniscule air bubbles (↑ or ↓) that developed during agarose gelation. The MRI appearance of the agarose gel containing unlabeled cell aggregates (Fig 4b) is similar to that of the agarose-only control. In contrast, agarose gel containing EpCAM-nanoparticle-labeled cell aggregates (Fig 4c) has conspicuous large clusters of signal voids of varying sizes, attributed to cell aggregates of varying sizes that are labeled with paramagnetic iron oxide contrast agents.
Figure 4.
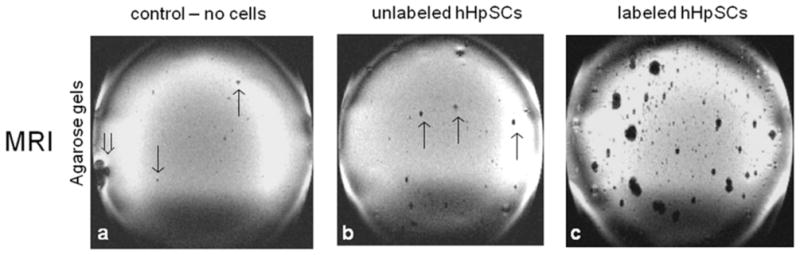
MRI signals from agarose gel-embedded hHpSCs and hHBs labeled with the magnetic bead-coupled to EpCAM antibodies. (a) Agarose gel only (no cells or beads); (b) Agarose gel with unlabeled cells; (c) Agarose gel with labeled cells.
Quantitative Spheroid Formations Analyzed by Microscopy and MRI Normalizations
To provide a basis for estimating the number of cells in aggregates detected in MR images, the aggregate radii were measured by microscopy using a hemocytometer grid (200 μm grid), categorized with respect to appropriate headings (e.g. small, medium, and large) and compared against MR signals from labeled cells (Fig 5). Some measurement variability is acknowledged as individual cell radii are heterogeneous in size with variations being associated with cell sourcing, microscopy optics, and image overlay thresholds. The numbers of cells in selected aggregates were determined by microscopy and correlated to the aggregate volumes estimated from their radii, assuming a spherical shape. For example, a cell count of 120 was found for an aggregate of 33 μm radius, or 1.5E5 μm3 volume. Linear regression of the cell count versus aggregate volume yielded the relationship,
Figure 5.
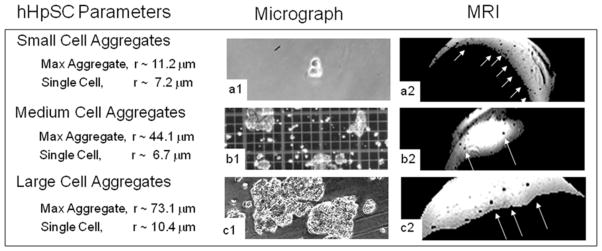
Image cell aggregates as seen in microscopy and compared to their MRI appearances. Three columns are labeled ‘Cell Parameters’, ‘Microscopy’, and MRI. Cell parameters depict known cell aggregate measurements as confirmed by microscopic analyses and hemacytometer calibrations. The intensities of the MR images have been scaled and thresholded to enhance contrast, which explains the irregular shapes of the agarose gels.
| (1) |
where N is the cell count and Vmicroscopy is the aggregate volume in μm3.
Moreover, the radii of some cell aggregates measured from microscopy and MR images were correlated (Fig. 6) resulting in the relationship,
Figure 6.

Correlation of cell aggregate sizes as observed in MRI and actually measured via microscopy. Linear regression (solid line) indicates that the cell aggregates appear 64% (r2 = 0.99) larger in MRI than their actual sizes.
| (2) |
with rMRI and rmicroscopy representing the MRI and microscopy measured cell aggregate radii, respectively. The cell aggregate radii showed a very strong correlation, with correlation r2 = 0.99. Not surprisingly, the cell aggregates appeared larger (64% in this case) in MRI than in actuality, since the influence of the magnetic beads that give rise to the MRI contrast extends beyond their physical boundary. Based on Eq. (1) and (2), the cell count N in terms of MRI-observed aggregate radius rMRI is estimated to be,
| (3) |
Alternatively, for instances when the cell aggregates are clearly non-spherical, Eq. (2) is used to convert Eq. (1) into,
| (4) |
where VMRI is the volume of the MRI region-of-interest.
Equations (3) and (4) were used to directly compute the cell count based on MRI observed aggregate size in all subsequent analysis, with the caveat that it represents only a first-order approximation, given all factors and assumptions involved.
MRI Detection and Quantification of Labeled Cells In Situ
MR images of labeled cells injected into whole livers in 3 animals are shown in Fig. 7, which clearly demonstrates the detectability of the labeled cells. Fig 7a1 illustrates two liver lobes with intensity voids corresponding to aggregates of labeled cells throughout the tissues. For analysis, a polygonal region of interest was segmented on the region containing relatively high concentration of signal voids. The intensity of the region was inverted and then thresholded to obtain a binary image that better shows the locations and sizes of the labeled cell aggregates (Fig 7a2). Comparable MRI and cell aggregate binary images obtained for the other 2 animals are shown in Figs 7b1, 7c1, 7b2 and 7c2, respectively. Further analyses of the binary images revealed that the labeled cell aggregates across all 3 animals have average radius of 133.4 μm, which, based on Eq. (3), corresponds to an average cell count of 1.1 × 10².
Figure 7.
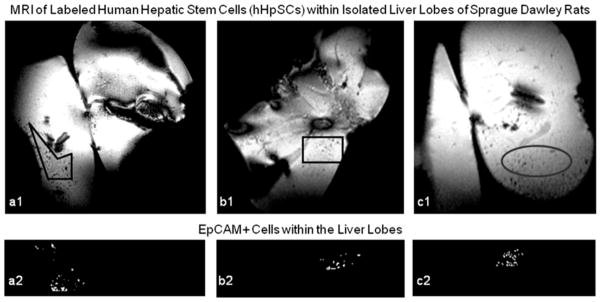
In Vivo MR images from rat liver lobes inoculated with labeled cells. Panels a, b, and c illustrate liver lobes heterogeneously inundated with labeled cell aggregates. Dense cell signals are highlighted in Panels a1, b1, and c1; the same signals are threshold imaged in Panels a2, b2, and c2.
Post-Transplantation Cell Labeling, Detection and Quantification
Selected 2D MR image slices of the post-transplantation cell labeling study are shown in Fig. 8. For the controls, Figs. 8a-c illustrate adequately perfused liver lobes appear as homogeneous backgrounds except for the hyperintense branching pathways near the liver center that correspond to the hepatic sinusoids. Intensity voids that signify labeled cell aggregates are clearly absent. This confirms the lack of contrast from the microbeads each of the 3 control groups, which include hosts not injected with human cells, hosts injected only with microbeads, and hosts injected with unlabeled hHpSCs. Figures 8d and 8e show representative MRI images of hosts originally injected with unlabeled hHpSCs but subsequently were given magnetic microbeads on day 6 and 18, respectively, after transplantation. At least 2 and 5 hypointense foci that indicate the presence of hHpSC aggregates can be detected in the day 6 and 18 MR image slices, respectively. Although the relative locations of cell aggregates are not conspicuous in the day-6 image slice, those in the day-18 image slice are clearly located near large sinusoidal pathways of the liver, which is consistent with the fact that cells were transplanted into the liver via the portal vein and must migrate through sinusoidal pathways before integrating into the liver tissue.
Figure 8.

In vivo MR images of unlabeled and contrast labeled hHpSCs in SCID/nod mice. Signal voids indicating the presence of magnetically labeled hHpSC aggregates are absent in the control groups, which include animals that (a) were not transplanted with hHpSCs and did not receive microbeads, (b) were not transplanted with hHpSCs but received microbeads, and (c) were transplanted with hHpSCs but not with microbeads. In contrast, labeled cell aggregates were detected in animals that received hHpSCs and given microbeads at (d) day 6 or (e) day 18 post-transplantation. The enumerated sites correspond to signal voids selected for quantitative analysis and reported in the text.
Examinations of all image slices obtained for the hosts labeled at day 6 and 18 detected the presence of a total of 4 and 7 hHpSC aggregates, respectively. Using the quantification technique described above, the cell counts for the aggregates found in sites 1 and 2 of the day-6 image slice shown in Fig. 8d are approximately 1065 and 128, respectively. The two additional aggregates detected were determined to have approximately 289 and 527 cells. Similarly, the cell counts in sites 1 – 5 of the day-18 image slice (Fig. 8e) are 1.1 × 10⁴, 4.4 × 10³, 260, 7.8 × 10³ and 4.3 × 10³, respectively. The two additional aggregates detected were determined to have approximately 6.2 × 10³ and 6.0 × 10³ cells. Although these cell counts are estimates, the facts that more aggregates are found and that most aggregates have markedly higher cell count in day-18 than in day-6 are indicative of post-transplantation cell proliferation.
DISCUSSION
We demonstrate a novel method for MRI tracking of transplanted human hepatic stem/progenitors (hHpSCs and hHBs) by labeling the cells in situ with magnetic microbeads coupled to an antibody binding to a surface antigen on the transplanted cells. The first antigen used to establish the technique has been human EpCAM, found in human livers uniquely on hHpSCs, hHBs and other hepatic progenitors [13,14], on liver cancer stem cells that are transformants of a subpopulation(s) of the hepatic stem/progenitors [26], and on proliferating epithelial cells in other tissues [27–29]. The method is applicable to any surface antigen for which antibody-magnetic microbeads are available. Existing methods for tracking transplanted cells are either non-specific, require marking the cells prior to transplantation, are effective only for short-term studies, or potentially can harm the cells. One of the most established techniques is to mark the cells with magnetic beads (particles, nanoshells) that become incorporated into cells by endocytosis [4, 30–33]. The ability to mark the cells is dependent on their propensity to endocytose the magnetic beads or nanoshells. The uptake of magnetic particles can be made more efficient by the use of electroporation [34]. However, all labeling strategies dependent on endocytosis offer little specificity as to which cells become marked. Similar problems occur for cells marked by perfluorocarbon nanobeacons [35] and with TAT-peptide derivatized nanoparticles [5], or with contrast agents [4, 30, 36]. Stable labeling of a specific cell population, such as by transfection of a gene, is highly successful and widely used for experimental studies [36,37], but is not suitable for clinical programs given that transfected cells can give rise to tumors depending on the integration site [38].
The newest strategies reported are ones in which magnetic resonance spectroscopy are focused on metabolomic profiling of unique subpopulations such as stem/progenitor cells [40] and offer a way to monitor endogenous and transplanted cells via unique metabolomic features detectable by MR spectroscopy [20, 41]. This approach does not distinguish transplanted versus endogenous cells unless the transplanted cells are in a tissue site distinct from that of the endogenous cellular subpopulations.
Contrast agents, such as Gadolinium-DTPA complex or SPIO-based colloids, facilitate visibility and display more intense MR signals, but these also do not have specificity [36,42,43]. Signal agents can range from iron metabolites (e.g. deoxygenated blood), to paramagnetic structures (copper, manganese), to superparamagnetic structures (iron oxide) that can target receptors through iron oxide surface modifications [43]. Each agent modifies either T1, T2, or T2* relaxation decays for signal contrast. The use of such nonspecific labeling has proven effective but limiting, because cells of interest are isolated, ex vivo labeled, transplanted and then imaged before contrast labels detach. Detachment can be either by physical dislodgement or by chemical secretion. Viable cells strive for homeostasis and efficiently remove foreign particles from their microenvironments obviating the use of this approach for long-term studies.
We demonstrate a method that can be used in experimental and clinical programs and that can identify cells that can be labeled before or after transplantation. Moreover, transplanted cells can be monitored in the same host again and again by injection of the label just prior to MR imaging (Fig 8) negating the need for long-term contrast attachment and eliminating uncertainties of contrast decay. In vivo labeling with antibodies to specific surface markers and tagged to magnetic microbeads makes possible the imaging of specific subpopulations of cells with defined antigenic profiles.
Being able to visualize the target population against the background of other cells will vary with the antigen chosen. We were able to limit the background by using xenogeneic transplants of human hepatic progenitors into immunocompromised murine hosts and using an antigen, EpCAM, expressed only by the human cells [13, 14, 19]. Targeting EpCAM should work also for transplantation into human livers given that the only cells in the liver that express it are hHpSCs and hHBs, both located adjacent to the portal triads of the liver acinus. These progenitor subpopulations constitute a small percentage (<1–2%) of the parenchymal cell populations in pediatric and adult livers. Achieving visibility of a target population by MRI will be straight forward if the target population is antigenically distinct from the surrounding cells such as what would occur with cancer cells, other types of mutated cells, or cells damaged by disease or other insults [26, 27, 44, 45].
The EpCAM-microbeads, with diameters smaller than viruses (<200nm), were able to traverse through the host’s circulatory system and capillary beds to adhere to transplanted cells expressing the antigen (Fig 8). Immunohistochemistry to detect human-specific proteins in sections of the livers confirmed the MRI findings (Fig 1). At day 18, labeled aggregates were found near sinusoids (Fig. 8). In vivo MR comparisons between day 6 and 18 signals illustrate cell growth as day 18 images confirm up to 12 times more cells than on day 6.
Cell therapies are becoming medical treatment options to support patients with diseased organs or to assist with tissue regeneration. However, to assess more rigorously the potential of cell therapies and of any particular method of transplantation, it is necessary to label specific cell types and non-invasively track cells after inoculation, and to follow the location and expansion of the cells thereafter. In this work, labeling of human hepatic progenitors has been verified by in vitro, ex vivo, and in vivo MR signal patterns and correlated with in vivo responses for up to 18 days. These imaging studies confirm in vivo cell tracking of transplanted human hepatic cells is plausible and is a strategic method that can be used to improve methods for transplantation for any form of cell therapy including stem cell therapies.
An alternative use for the method is to diagnose and to follow patients with primary or metastatic tumors, now known to be comprised of mutated stem/progenitor populations with antigenic profiles distinct from those of mature cells [44, 45]. Antigens found on the tumors can be targeted with an antibody bound to microbeads and followed by patient imaging.
Acknowledgments
Funding: Funding derived primarily from a United States Department of Energy (DOE) grant DE-FG02-02ER-63477. It derived also from a grant from the North Carolina Biotechnology Center (NCBC), Vesta Therapeutics (Bethesda, MD), and from NIH grants (AA014243, IP30-DK065933), NIDDK Grant (DK34987), and an NCI grant (CA016086). All of the imaging was done in the Duke Center for In Vivo Microscopy (director: Dr. G.A. Johnson), an NIH/NCRR Biomedical Technology Resource Center (P41 RR005959) and Small Animal Imaging Resource Program (U24 CA092656).
Technical and administrative support was provided by Lucendia English, Victoria Morgan and Dr. Claire Barbier. The microscopy was done in the Michael Hooker Confocal Microscope Facility at UNC (Dr. Michael Chua, director) and the electron microscopy in the Microscope Facility (Dr. Robert Bagnell, director). We thank Dr. Sharon Lubkin for a critical evaluation of the paper, Dr. Claire Barbier for editing the figures.
Abbreviations
- AFP
α-Fetoprotein
- ALB
Albumin
- CK
Cytokeratin
- EpCAM
Epithelial cell adhesion molecule
- HDM
Hormonally defined medium
- hHB
Human hepatoblast
- hHpSC
Human hepatic stem cell
- KM
Kubota’s Medium
- MACS
Magnetically activated cell sorting
- MRI
Magnetic resonance imaging
Footnotes
Conflict of Interest Statement
There is no conflict of interest for any of the authors.
Author contributions
- R.M.: Conception and design, collection of data, assembly of data, data analyses and interpretation, manuscript writing and editing.
- E.W.: development of marking methods of the cells in culture; isolation and culture of human hepatic stem cells; assistance with all transplantation studies, collection of data on cultures.
- T.T.: did editing on an early version of the manuscript.
- L.M.R.: Conception and design especially with respect to the cell biology, assembly of data, data analyses and interpretation, manuscript writing and editing, final approval of manuscript, and financial support.
- E.H. Conception and design, assembly of data especially with respect to magnetic resonance imaging, data analyses and interpretation, manuscript writing and editing, final approval of manuscript, and financial support.
References
- 1.Susick R, Moss N, Kubota H, et al. Hepatic progenitors and strategies for liver cell therapies. Annals of the New York Academy of Science. 2002;943:398–419. doi: 10.1111/j.1749-6632.2001.tb03851.x. [DOI] [PubMed] [Google Scholar]
- 2.Ito M, Nagata H, Miyakawa S, Fox IJ. Review of hepatocyte transplantation. Journal of Hepatobiliary-Pancreatic-Surgery. 2009;2009(16):97–100. doi: 10.1007/s00534-008-0023-0. [DOI] [PubMed] [Google Scholar]
- 3.Khan AA, Shaik MV, Parveen N, et al. Human Fetal Liver-Derived Stem Cell Transplantation as Supportive Modality in the Management of End-Stage Decompensated Liver Cirrhosis. Cell Transplantation. 2010 doi: 10.3727/096368910X498241. In Press. [DOI] [PubMed] [Google Scholar]
- 4.Bulte JW, Douglas T, Witwer B, et al. Magnetodendrimers allow endosomal magnetic labeling and in vivo tracking of stem cells. Nature Biotechnology. 2001;19:1141–7. doi: 10.1038/nbt1201-1141. [DOI] [PubMed] [Google Scholar]
- 5.Lewin M, Carlesso N, Tung CH, et al. Tat peptide-derivatized magnetic nanoparticles allow in vivo tracking and recovery of progenitor cells. Nature Biotechnology. 2000;18:410–4. doi: 10.1038/74464. [DOI] [PubMed] [Google Scholar]
- 6.Gubin AN, Reddy B, Njoroge JM, Miller JL. Long-term, stable expression of green fluorescent protein in mammalian cells. Biochemical and Biophysical Research Communications. 1997;236:347–50. doi: 10.1006/bbrc.1997.6963. [DOI] [PubMed] [Google Scholar]
- 7.Song S, Witek RP, Lu Y, et al. Ex vivo transduced liver progenitor cells as a platform for gene therapy in mice. Hepatology. 2004;40:918–24. doi: 10.1002/hep.20404. [DOI] [PubMed] [Google Scholar]
- 8.Gambhir SS, Barrio JR, Herschman HR, Phelps ME. Assays for noninvasive imaging of reporter gene expression. Nuclear Medicine & Biology. 1999;26:481–90. doi: 10.1016/s0969-8051(99)00021-9. [DOI] [PubMed] [Google Scholar]
- 9.Gupta S, Inada M, Joseph B, Kumaran V, Benten D. Emerging Insites into Liver-Directed Cell Therapy for Genetic and Acquired Disorders. Transplant Immunology. 2004;12:289–302. doi: 10.1016/j.trim.2003.12.014. [DOI] [PubMed] [Google Scholar]
- 10.Wang LJ, Chen YM, George D, et al. Engraftment assessment in human and mouse liver tissue after sex- mismatched liver cell transplantation by real-time quantitative PCR for Y chromosome sequences. Liver Transplantation. 2002;8:822–8. doi: 10.1053/jlts.2002.34891. [DOI] [PubMed] [Google Scholar]
- 11.Mahieu-Caputo D, Allain J, Branger J, et al. Repopulation of athymic mouse liver by cryopreserved early human fetal hepatoblasts. Human Gene Therapy. 2004;15:1219–28. doi: 10.1089/hum.2004.15.1219. [DOI] [PubMed] [Google Scholar]
- 12.Turner R, Gerber D, Reid LM. Transplantation of cells from solid organs requires grafting protocols. Transplantation. 2010 In press. [Google Scholar]
- 13.*Schmelzer E, *Zhang L, *Bruce A, et al. Human hepatic stem cells from fetal and postnatal donors. Journal of Experimental Medicine. 2007;204:1973–87. doi: 10.1084/jem.20061603. [*co-equal first authors] [DOI] [PMC free article] [PubMed] [Google Scholar]
- 14.Wang Y, Yao H-l, Barbier C, et al. Lineage-Dependent Epithelial-Mesenchymal Paracrine Signals Dictate Growth versus Differentiation of Human Hepatic Stem Cells to Adult Fates. Hepatology. 2010 doi: 10.1002/hep.23829. in press. [DOI] [PMC free article] [PubMed] [Google Scholar]
- 15.Schmelzer E, Wauthier E, Reid LM. Phenotypes of pluripotent human hepatic progenitors. Stem Cell. 2006;24:1852–8. doi: 10.1634/stemcells.2006-0036. [DOI] [PubMed] [Google Scholar]
- 16.Sicklick JK, Li YX, Melhem A, et al. Hedgehog signaling maintains resident hepatic progenitors throughout life. [*co-senior authors] American Journal of PhysiologyGastrointestinal Liver Physiology. 2006;290:G859–G70. doi: 10.1152/ajpgi.00456.2005. [DOI] [PubMed] [Google Scholar]
- 17.Schmelzer E, Reid LM. Telomerase activity in human hepatic stem cells, hepatoblasts and hepatocytes from neonatal, pediatric, adult and geriatric donors. European Journal of Hepatology and Gastroenterology. 2009;21:1191–8. doi: 10.1097/MEG.0b013e32832973fc. [DOI] [PMC free article] [PubMed] [Google Scholar]
- 18.Schmelzer E, Wauthier E, Melhem A, et al. Hepatic stem cells. In: Potten C, Clarke R, Wilson J, Renehan A, editors. Tissue Stem Cells. Taylor and Francis; NY: 2006. pp. 161–214. [Google Scholar]
- 19.Zhang L, Theise N, Chua M, Reid LM. Human hepatic stem cells and hepatoblasts: Symmetry between Liver Development and Liver Regeneration. Hepatology. 2008;48:1598–607. doi: 10.1002/hep.22516. [DOI] [PubMed] [Google Scholar]
- 20.Turner WS, Seagle C, Galanko J, et al. Metabolomic Footprinting of Human Hepatic Stem cells and Hepatoblasts Cultured in Engineered Hyaluronan-Matrix Hydrogel Scaffolds. Stem Cell. 2008;26:1547–55. doi: 10.1634/stemcells.2007-0863. [DOI] [PubMed] [Google Scholar]
- 21.Kubota H, Reid LM. Clonogenic hepatoblasts, common precursors for hepatocytic and biliary lineages, are lacking classical major histocompatibility complex class I antigen. Proceedings of the National Academy of Sciences. 2000;97:12132. doi: 10.1073/pnas.97.22.12132. [DOI] [PMC free article] [PubMed] [Google Scholar]
- 22.McClelland R, Wauthier E, Zhang L, et al. Ex vivo conditions for self-replication of human hepatic stem cells. Tissue Engineering. 2008;14:1–11. doi: 10.1089/ten.tec.2008.0073. [DOI] [PMC free article] [PubMed] [Google Scholar]
- 23.Wauthier E, McClelland R, Turner W, et al. Hepatic stem cells and hepatoblasts: identification, isolation and ex vivo maintenance Methods for Cell Biology. Methods for Stem Cells. 2008;86:137–225. doi: 10.1016/S0091-679X(08)00008-3. [DOI] [PubMed] [Google Scholar]
- 24.Kubota H, Yao H, Reid LM. Identification and characterization of vitamin A-storing cells in fetal liver. Stem Cell. 2007;25:2339–49. doi: 10.1634/stemcells.2006-0316. [DOI] [PubMed] [Google Scholar]
- 25.Taylor AE, Granger DW. Exchange of macromolecules across microcapillaries. In: Rankin EM, Michel CC, editors. Section 2: The Cardiovascular System, Microcirulation, part 1. Handbook of Physiology. Vol. 4. American Physiological Society; Bethesda, MD: 1984. pp. 467–520. [Google Scholar]
- 26.Yamashita Y, Ji J, Budhu A, et al. Wnt/β-catenin signaling regulates cancer initiating cells (EpCAM+ AFP+) with stem cell features and metastatic activities in hepatocellular carcinoma. Gastroenterology. 2009;136:1012–24. doi: 10.1053/j.gastro.2008.12.004. [DOI] [PMC free article] [PubMed] [Google Scholar]
- 27.Wicha MS, Liu S, Dontu G. Cancer stem cells: an old idea--a paradigm shift. Cancer Research. 2006;66:1883–90. doi: 10.1158/0008-5472.CAN-05-3153. [DOI] [PubMed] [Google Scholar]
- 28.Benhaj K, Akcali KC, Ozturk M. Redundant expression of canonical Wnt ligands in human breast cancer cell lines. Oncology Reports. 2006;15:701–7. [PubMed] [Google Scholar]
- 29.Schmelzer E, Reid LM. EpCAM Expression in Normal, Non-Pathological Tissues. Frontiers in Biosciences 2008. 2008;13:3096–100. doi: 10.2741/2911. [DOI] [PubMed] [Google Scholar]
- 30.Bulte JW, Duncan ID, Frank JA. In vivo magnetic resonance tracking of magnetically labeled cells after transplantation. Journal of Cerebral Blood Flow Metabolism. 2002;22:899–907. doi: 10.1097/00004647-200208000-00001. [DOI] [PubMed] [Google Scholar]
- 31.Hill JM, Ma MR, Dick AJ, et al. Serial cardiac magnetic resonance imaging of injected mesenchymal stem cells. Circulation. 2003;108:1009–14. doi: 10.1161/01.CIR.0000084537.66419.7A. [DOI] [PMC free article] [PubMed] [Google Scholar]
- 32.Walter GA, Cahill KS, Huard J, et al. Noninvasive monitoring of stem cell transfer for muscle disorders. Magnetic Resonance in Medicine. 2004;51:273–7. doi: 10.1002/mrm.10684. [DOI] [PubMed] [Google Scholar]
- 33.Maxwell DJ, JB, Hess DA, et al. Fluorophore-Conjugated Iron Oxide Nanoparticle Labeling and Analysis of Engrafting Human Hematopoietic Stem Cells. Stem Cells. 2008;26:517–24. doi: 10.1634/stemcells.2007-0016. [DOI] [PMC free article] [PubMed] [Google Scholar]
- 34.Walczak P, Kedziorek DA, Gilad AA, Lin S, Bulte JWM. Instant MR labeling of stem cells using magnetoelectroporation. Magnetic Resonance in Medicine. 2005;54:769–74. doi: 10.1002/mrm.20701. [DOI] [PubMed] [Google Scholar]
- 35.Partlow KC, Chen J, Brant JA, et al. 19F magnetic resonance imaging for stem/progenitor cell tracking with multiple unique perfluorcarbon nanobeacons. FASEB Journal. 2007;21:1647–54. doi: 10.1096/fj.06-6505com. [DOI] [PubMed] [Google Scholar]
- 36.Modo M, Cash D, Mellodew K, et al. Tracking transplanted stem cell migration using bifunctional, contrast agent enhanced magnetic resonance imaging. Neuroimage. 2007;17:803–11. [PubMed] [Google Scholar]
- 37.Naldini L, Blomer U, Gallay P, Gage FH, Verma IM, Trono D. In vivo gene delivery and stable transduction of postmitotic cells by a lentiviral vector. Science. 1996;272:263–7. doi: 10.1126/science.272.5259.263. [DOI] [PubMed] [Google Scholar]
- 38.Gropp M, Itsykson P, Singer O, et al. Stable genetic modification of human embryonic stem cells by lentiviral vectors. Molecular Therapeutics. 2003;7:281–7. doi: 10.1016/s1525-0016(02)00047-3. [DOI] [PubMed] [Google Scholar]
- 39.Blaese R. What is the status of gene therapy for primary immunodeficiency? Immunolological Research. 2007;38:274–84. doi: 10.1007/s12026-007-0009-z. [DOI] [PubMed] [Google Scholar]
- 40.Jansen JF, Shamblott MJ, van Zijl PC, et al. Stem cell profiling by nuclear magnetic resonance spectroscopy. Magnetic Resonance in Medicine. 2006;56:666–70. doi: 10.1002/mrm.20968. [DOI] [PubMed] [Google Scholar]
- 41.Holmes E, Foxall PJD, Spraul M, Duncan Farrant R, Nicholson JK, Lindon JC. 750 MHz 1H NMR spectroscopy characterisation of the complex metabolic pattern of urine from patients with inborn errors of metabolism: 2-hydroxyglutaric aciduria and maple syrup urine disease. Journal of Pharmaceutical and Biomedical Analysis. 1997;15:1647–59. doi: 10.1016/s0731-7085(97)00066-6. [DOI] [PubMed] [Google Scholar]
- 42.Cohen BH, Buiy E, Packer RJ, Sutton LN, Bilaniuk LT, Zimmerman RA. Gadolinium-DTPA-enhanced magnetic resonance imaging in childhood brain tumors. Neurology. 1989;39:1178. doi: 10.1212/wnl.39.9.1178. [DOI] [PubMed] [Google Scholar]
- 43.Schafer R, Kehlbach R, Wiskirchen J, et al. Transferrin receptor upregulation: in vitro labeling of rat mesenchymal stem cells with superparametic iron oxide. Radiology. 2007;244:514–23. doi: 10.1148/radiol.2442060599. [DOI] [PubMed] [Google Scholar]
- 44.Ji J, Yamashita T, Budhu A, et al. Identification of a conserved microRNA-181 family by genome-wide screening as a critical player in hepatic cancer stem cell. Hepatology. 2009;50:880–92. doi: 10.1002/hep.22989. [DOI] [PMC free article] [PubMed] [Google Scholar]
- 45.Yamashita T, Ji J, Budhu A, Forgues M, Jia H, Ye Q, Qin L, Wauthier E, Reid LM, Minato H, Honda M, Kaneko S, Tang Z, Wang X. Bolstering hepatic cancer stem cells by Wnt/β-catenin signaling. Gastroenterology. 2009;136(3):1012–1024. doi: 10.1053/j.gastro.2008.12.004. [DOI] [PMC free article] [PubMed] [Google Scholar]