

Abstract
Background
Although right-sided filling pressures often mirror left-sided filling pressures in systolic heart failure, it is not known whether a similar relationship exists in heart failure with preserved ejection fraction.
Methods and Results
Eleven subjects with heart failure with preserved ejection fraction underwent right heart catheterization at rest and under loading conditions manipulated by lower body negative pressure and saline infusion. Right atrial pressure (RAP) was classified as elevated when ≥10 mm Hg and pulmonary capillary wedge pressure (PCWP) when ≥22 mm Hg. If both the RAP and the PCWP were elevated or both not elevated, they were classified as concordant; otherwise, they were classified as discordant. Correlation of RAP and PCWP was determined by a repeated measures model. Among 66 paired measurements of RAP and PCWP, 44 (67%) had a low RAP and PCWP and 8 (12%) a high RAP and PCWP, yielding a concordance rate of 79%. In a sensitivity analysis performed by varying the definition of elevated RAP (from 8 to 12 mm Hg) and PCWP (from 15 to 25 mm Hg), the mean±SD concordance of RAP and PCWP was 76±10%. The correlation coefficient of RAP and PCWP for the overall cohort was r=0.86 (P<0.0001).
Conclusions
Right-sided filling pressures often reflect left-sided filling pressures in heart failure with preserved ejection fraction, supporting the role of estimation of jugular venous pressure to assess volume status in this condition.
Keywords: heart failure, hemodynamics, physical examination, jugular venous pressure
Assessing volume status (left-sided filling pressures) is an important aspect in the care of the patients with heart failure (HF). Estimation of jugular venous pressure is frequently used to accomplish this goal,1 exploiting the fact that right-sided filling pressures often mirror left-sided filling pressures in patients with HF and reduced left ventricular ejection fraction (LVEF).2–5 Although recent data from implantable monitoring have shown that hemodynamics share similarities between patients with HF and a reduced ejection fraction and those with HF and a preserved ejection fraction,6 to our knowledge, no data demonstrate whether right-sided and left-sided filling pressures mirror each other in the latter patient population. The need to assess this question is highlighted by the observations that the right atrial pressure (RAP) and pulmonary capillary wedge pressure (PCWP) can be discordant in cardiovascular states, as may occur in acute myocardial infarction,7 and because HF with preserved ejection fraction (HFPEF) is commonly encountered in the clinical setting.8 Therefore, we conducted the present study to assess the relationship of the RAP and PCWP in a well-characterized cohort of subjects with HFPEF.9
Methods
Study Cohort
This analysis is a substudy of a larger project conducted to compare static and dynamic left ventricular diastolic properties between healthy elderly seniors and those with HFPEF.9 We screened 2054 patients aged >65 years who had been hospitalized within the preceding 9 months and given a discharge diagnosis of HF. Subjects had to have supporting evidence of congestive HF during the index hospitalization, including an elevated B-type natriuretic peptide, x-ray film of the chest indicating pulmonary congestion, or elevated PCWP during cardiac catheterization. Furthermore, they had to have a documented LVEF >50% both during hospitalization and on a screening echocardiogram, the latter obtained by a modified Simpson method as previously10 and confirmed by a senior investigator (B.D.L). An LVEF also was obtained immediately after the baseline pressure measurements (discussed later). These latter images were analyzed blindly by an experienced sonographer and are the LVEF reported in this study. Subjects were excluded if they had a history or presence of atrial fibrillation/flutter; use of warfarin; previous coronary artery bypass grafting; unrevascularized epicardial coronary stenoses (>50% by prior angiography); angina; myocardial infarction in the past year; creatinine level >2.5 g/dL or end-stage renal disease on dialysis; severe chronic obstructive pulmonary disease or pulmonary disease; moderate or severe valvular heart disease; and an alternative known cause for HF, such as restrictive cardiomyopathy or constrictive pericarditis. Following these exclusion criteria, 23 subjects met the criteria for enrollment, and 11 consented to participate.9 All studies were performed in the outpatient setting, when patients were clinically stable. Informed consent was obtained from all subjects. The Institutional Review Board of the University of Texas Southwestern (Dallas, Tex) approved this study.
Right Heart Catheterization
β-blockers were held for at least 24 to 48 hours, and diuretics were delayed to the end of the study on the morning of the examination. Other antihypertensive drugs such as vasodilators and angiotensin-converting enzyme inhibitors/angiotensin receptor blockers were continued as prescribed. A 6F balloon-tipped fluid-filled catheter was placed under fluoroscopic guidance through an antecubital vein into the pulmonary artery. The wedge position of the catheter was confirmed by fluoroscopy and the presence of typical wave forms. The pressure transducer was set with the zero reference point at 5.0 cm below the sternal angle. Mean PCWPs and mean RAPs were determined in triplicate visually at the end of expiration from paper recordings amplified to 0.4 mm Hg resolution. The RAP was measured from the proximal port of the catheter.
Manipulation of Volume Status
Central blood volume was manipulated to allow 6 individual measurements across a broad physiological range of left ventricular filling pressure, ranging from ≈3 mm Hg to a maximum of 29 mm Hg. As previously described,10 –13 we followed a general protocol of baseline supine measurements, the use of lower body negative pressure (LBNP) to reduce cardiac filling, a repeat set of baseline measurements, and the rapid infusion of warm saline to increase cardiac filling. To achieve LBNP, subjects were placed in an acrylic plastic box sealed at the level of the iliac crest, and suction was achieved by a vacuum pump controlled with a variable autotransformer. If baseline PCWP was ≤16 mm Hg, this was accomplished by 2 levels of LBNP (−15 mm Hg and −30 mm Hg) and 2 doses of saline infusion (≈10 mL/kg and 20 mL/kg at a rate of 100 to 200 mL/min). If baseline PCWP was >16 mm Hg, an additional level of LBNP was used (−40 mm Hg), and only 1 dose of saline was infused (10 mL/kg) to avoid the risk of acute pulmonary edema. Two of 11 subjects were too obese to fit into the LBNP chamber; for these 2 subjects, head-up tilt was substituted for LBNP. The position of the right atrium was marked on the chest using biplane fluoroscopy as described.14 These subjects underwent head-up tilt to 20°, 40°, and 60°, with the transducer carefully releveled to the right atrial position in each case, and measurements were then obtained after 5 minutes.
Data Analysis
For our primary analysis, we used dichotomous threshold values of RAP and PCWP as before.3 The RAP was classified as elevated when ≥10 mm Hg and PCWP when ≥22 mm Hg. We determined how often RAP and PCWP were concordant (both elevated or both not elevated) using these threshold values. In a sensitivity analysis, we assessed the concordance rate of RAP and PCWP over a broad range (RAP, 8 to 12 mm Hg; PCWP, 15 to 25 mm Hg) of threshold values. Values of RAP and PCWP at different loading conditions are reported as mean±SD. Pairwise PCWP was compared at different loading conditions with the Wilcoxon signed-rank test. To determine the effect of RAP on PCWP, given that multiple measurements were made on each subject, a repeated measures model was implemented using the MIXED procedure of SAS version 9.1. PCWP was the outcome variable, and RAP was the fixed effect. Random effects for the patient and patient*RAP also were included, with the covariance parameter of patient*RAP significant (P=0.027). The covariance structure of the random effects was variance components. Using these models, scatterplots with the estimated regression equations were produced for each subject and in toto. The correlation coefficient was calculated using a multivariate mixed model to account for the repeated measures within subject. The structure for the multivariate repeated measures was constructed by taking the Kronecker product of an unstructured matrix with a first-order autoregressive structure. This adequately takes into account the covariance design both between RAP and PCWP measurements at specific loading conditions and across the various loading conditions. Significance was determined by 2-tailed tests, with α=0.05.
Results
The baseline characteristics and hemodynamic responses to volume changes are shown in the Table. The 11 subjects were elderly, hypertensive, and predominantly diabetic and women. Three were black, 2 were Hispanic, and 6 were white. The B-type natriuretic peptide at the time of the index hospitalization was 448±374 pg/mL. The range of LVEF was 51 to 70%.
Table.
Baseline Characteristics and Hemodynamic Response to Volume Changes
| Characteristic | |
|---|---|
| Age, y | 73±7 |
| Women | 64 |
| Race | |
| White | 55 |
| Black | 27 |
| Hispanic | 18 |
| Hypertension | 100 |
| Diabetes mellitus | 55 |
| Baseline hemodynamics | |
| RAP, mm Hg | 9.5±3 |
| PCWP, mm Hg | 15±5 |
| Lowest filling pressures* | |
| RAP, mm Hg | 4±3 |
| PCWP, mm Hg | 6.6±3 |
| Highest filling pressures† | |
| RAP, mm Hg | 13±3 |
| PCWP, mm Hg | 22±3 |
Data are presented as mean±SD or percentage.
After LBNP (n=9) or head-up tilt (n=2).
After normal saline infusion.
The baseline RAP was 9.5±3.3 mm Hg, and the baseline PCWP was 15.2±5.1 mm Hg. The lowest filling pressure achieved after LBNP or head-up tilt is shown in the Table, as is the highest filling pressure after saline infusion. The efficacy of the LBNP and head-up tilt was confirmed as the PCWP decreased to 10.6±3.7 mm Hg at LBNP −15 mm Hg, 7.2±3.3 mm Hg at LBNP −30 mm Hg, and 6.7±0.9 mm Hg at LBNP −40 mm Hg (P<0.001). In the 2 subjects who underwent head-up tilt, the PCWP decreased from 12.9±2.3 mm Hg to 6.6±3.2 mm Hg, and the RAP from 7.7±1.9 mm Hg to 4.8±1.6 mm Hg. The adequacy of volume challenge was confirmed by the increase in RAP to 13.4±2.9 mm Hg (P=0.002) and the increase in PCWP to 21.7±2.9 mm Hg after peak saline infusion (P=0.02).
There were a total of 66 paired measurements of RAP and PCWP (Figure 1). Of these, 44 (67%) occurred with a low RAP and a low PCWP and 8 (12%) with a high RAP and a high PCWP, yielding a concordance rate of 79%. Of the discordant group, all 14 were with an elevated RAP but not an elevated PCWP (21% of all measurements), and there were no cases of an elevated PCWP with a low RAP (0%). When we excluded the 2 subjects with obesity who had head-up tilt done instead of LBNP, the concordance rate was 78% (65% with high RAP and high PCWP and 13% with low RAP and low PCWP). In a sensitivity analysis, we varied the definition of elevated RAP from 8 to 12 mm Hg and the definition of elevated PCWP from 15 to 25 mm Hg. Among these 55 different combinations, the concordance of elevated RAP and PCWP was 76±10%. In the cases when elevated RAP was defined as 10, 11, or 12 mm Hg, the concordance rate with elevated PCWP when defined at any value from 15 to 25 mm Hg was between 71% and 89%. The utility of the RAP to PCWP relationship was suboptimal only when an elevated RAP was defined at the low end of its range (eg, 8 or 9 mm Hg) and PCWP at the high end of its range (from 20 to 25 mm Hg). In these cases, the concordance rate of RAP and PCWP varied between 52% and 67%.
Figure 1.
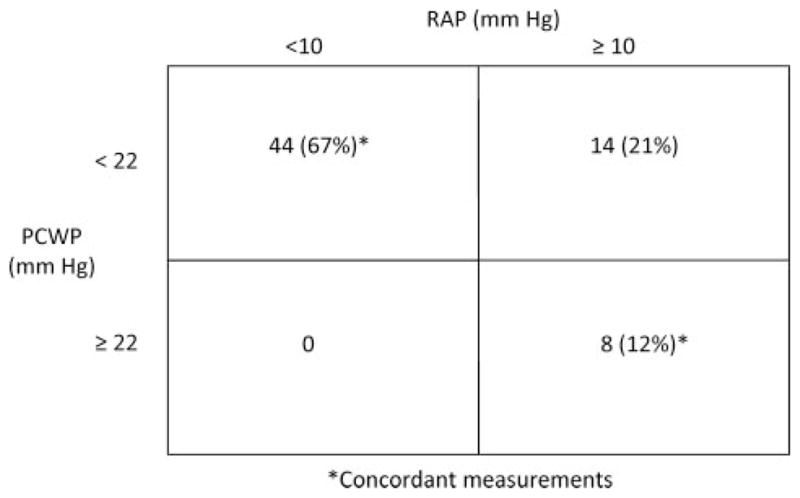
Classification of 66 paired measurements of RAP and PCWP from the 11 subjects in the study cohort with regard to whether RAP was elevated (≥10 mm Hg) and PCWP was elevated (≥22 mm Hg). Data are presented as number of measurements (%).
The relationship of the RAP and PCWP is shown for each individual subject and for the overall cohort in Figure 2 (r=0.86 for the overall cohort). Representative RAP and PCWP tracings from 2 subjects under various loading conditions are shown in Figure 3. In both cases, a decrease (with LBNP) or an increase (with saline infusion) in RAP from baseline was associated with a change in PCWP in the same direction.
Figure 2.

Scatterplot of RAP versus PCWP in individual patients (light gray lines) and the overall cohort (blue line) using all loading conditions. The blue line indicates the overall regression equation in the entire cohort, and the red lines are the 95% CIs. The symbols represent data points from individual patients.
Figure 3.

Representative hemodynamic pressure waveforms of RAP and PCWP in 2 individual subjects under various loading conditions. A simultaneous ECG is shown at the top. Numbers represent pressure measurements. Note that as the RAP increases, the PCWP increases in concert in both cases. LBNP30 indicates LBNP at −30 mm Hg; LBNP15, LBNP at −15 mm Hg; NS1, a normal saline infusion of ≈10 mL/kg at 100 to 200 mL/min; and NS2, an infusion of ≈20 mL/kg at 100 to 200 mL/min.
Discussion
The relationship of RAP to PCWP has not been well explored in patients with HFPEF. Herein, we demonstrate in a well-characterized cohort of subjects with HFPEF that the RAP and PCWP are correlated significantly (r=0.86) and often are concordant (≈80% of cases are either both elevated or both not elevated) when previously chosen,3 clinically relevant dichotomous cut points are used. Furthermore, by manipulating loading conditions with LBNP (n=9) or head-up tilt (n=2) and with saline loading, we demonstrate that dynamic changes in RAP often mirror those of the PCWP. These findings were unaltered when those with head-up tilt were excluded from analysis.
Previous studies of patients with HF and severely reduced LVEF (mean <22%) have demonstrated a significant correlation between RAP and PCWP, with a correlation coefficient of 0.64.2,3 Despite the difference in LVEF between those studies and the present one, the correlation of RAP to PCWP remains significant in the present cohort (r=0.86). Furthermore, the discordance rate (ie, when the RAP is not elevated but the PCWP is, or the RAP is elevated but the PCWP is not) in this study is 21%, remarkably consistent to what we previously reported (21%) in those with largely systolic HF.3 Overall, these data suggest that monitoring the RAP by estimation of jugular venous pressure would provide insights into left-sided filling pressures in HFPEF that were equally useful to that in systolic HF.
In contrast to the similarities noted earlier, there was one apparent difference between the relationship of RAP and PCWP found in this study of HFPEF compared with that previously reported in systolic HF. Specifically, there were no paired measurements where the RAP was low and the PCWP was elevated in the subjects with HFPEF. In contrast, in those with systolic HF, the RAP was low with an elevated PCWP in 13%2 and 15%3 of subjects. The basis of this difference is uncertain, and we cannot exclude the possibility that this finding is simply due to the small sample size of this study. Nevertheless, if confirmed, this observation suggests that the presence of low jugular venous pressure in a patient with HFPEF may be a useful tool to exclude elevated left-sided filling pressures.
There are several potential explanations for the relationship of right- and left-sided filling pressures in HF. Backward transmission of elevated left-sided filling pressures can lead to pulmonary hypertension, in turn causing progressive right ventricular failure and an elevated RAP. An alternative explanation is diastolic ventricular interaction,15,16 which has been shown in patients with HF and a reduced LVEF.15 Here, an increased right ventricular end-diastolic volume due to worsening right HF (and manifest as increased RAP) can impinge on the left ventricular volume due to pericardial constraint and lead to a secondary increase in the PCWP. A third possibility is that increased left-sided filling pressures can lead to progressive mitral annular dilation and mitral regurgitation, which has been shown in subjects with advanced HF and severely depressed LVEF.17 However, this possibility is less likely in this population where subjects with more than minimal valve disease were excluded.
Limitations
The number of subjects included in this study is small (n=11), and the relationship between RAP and PCWP may have been different had 66 independent subjects been studied. However, in contrast to other larger studies in which single measurements of RAP and PCWP were made per subject, there were multiple filling states induced in each subject, thus improving the interpretation of changes in RAP and PCWP pressures with changes in preload. Patients treated for HFPEF in the general community may have a variety of comorbid conditions for which we excluded subjects from enrollment; therefore, the study subjects may not represent the full spectrum of the broad population of patients with HFPEF. If so, then the relationships we describe from a small study cohort may not be generalizable. Our data are based on invasive hemodynamic measurements. Whether the RAP can be estimated noninvasively by the assessment of the jugular venous pressure in this patient population is not known. Finally, we have demonstrated the relationship of RAP and PCWP with acute changes in loading conditions. Whether this represents the conditions present in the setting of chronic changes in volume in patients with HFPEF is not known.
Conclusion
There is a strong relationship between right-sided and left-sided filling pressures in subjects with HFPEF similar to what has been observed previously in subjects with systolic HF. These data support the role of estimation of jugular venous pressure in assessing the volume status of patients with HF, irrespective of their LVEF.
CLINICAL PERSPECTIVE.
Assessment of the left ventricular filling pressure in patients with heart failure (HF) often includes examination of the jugular veins to estimate the central venous pressure (right ventricular filling pressure). This approach has been shown to be useful in patients with systolic HF because right and left ventricular filling pressures often mirror each other in this setting. However, it is not known whether this relationship exists in patients with HF and a preserved left ventricular ejection fraction. In this study, 11 subjects with HF with preserved ejection fraction underwent right heart catheterization at rest and under loading conditions manipulated by lower body negative pressure or head-up tilt and by saline infusion. Right atrial pressure (RAP) was classified as elevated when ≥10 mm Hg, and pulmonary capillary wedge pressure (PCWP) when ≥22 mm Hg. If both the RAP and the PCWP were elevated or both not elevated, the RAP and PCWP were classified as concordant; otherwise, they were classified as discordant. Among 66 paired measurements of RAP and PCWP, 44 (67%) had a low RAP and PCWP and 8 (12%) a high RAP and PCWP, yielding a concordance rate of 79%. The correlation coefficient of RAP and PCWP for the overall cohort was r=0.86 (P<0.0001). We conclude that right-sided filling pressures often reflect left-sided filling pressures in HF with preserved ejection fraction, supporting the role of estimation of jugular venous pressure to assess volume status in this condition.
Acknowledgments
Source of Funding
This project was supported by National Institutes of Health grant R01-AG17479; the S. Finley Ewing Jr. Chair for Wellness at Presbyterian Hospital; and the Harry S. Moss Foundation, Dallas, Tex.
Footnotes
Disclosures
None.
References
- 1.Leier CV, Young JB, Levine TB, Pina I, Armstrong PW, Fowler MB, Warner-Stevenson L, Cohn JN, O’Connell JB, Bristow MR, Nicklas JM, Johnstone DE, Howlett J, Ventura HO, Giles TD, Greenberg BH, Chatterjee K, Bourge RC, Yancy CW, Gottleib SS. Nuggets, pearls, and vignettes of master heart failure clinicians. Part 2-the physical examination. Congest Heart Fail. 2001;7:297–308. doi: 10.1111/j.1527-5299.2001.01167.x. [DOI] [PubMed] [Google Scholar]
- 2.Chakko S, Woska D, Martinez H, de Marchena E, Futterman L, Kessler KM, Myerberg RJ. Clinical, radiographic, and hemodynamic correlations in chronic congestive heart failure: conflicting results may lead to inappropriate care. Am J Med. 1991;90:353–359. doi: 10.1016/0002-9343(91)80016-f. [DOI] [PubMed] [Google Scholar]
- 3.Drazner MH, Hamilton MA, Fonarow G, Creaser J, Flavell C, Stevenson LW. Relationship between right and left-sided filling pressures in 1000 patients with advanced heart failure. J Heart Lung Transplant. 1999;18:1126–1132. doi: 10.1016/s1053-2498(99)00070-4. [DOI] [PubMed] [Google Scholar]
- 4.Butman SM, Ewy GA, Standen JR, Kern KB, Hahn E. Bedside cardiovascular examination in patients with severe chronic heart failure: importance of rest or inducible jugular venous distension. J Am Coll Cardiol. 1993;22:968–974. doi: 10.1016/0735-1097(93)90405-p. [DOI] [PubMed] [Google Scholar]
- 5.Drazner MH, Hellkamp AS, Leier CV, Shah MR, Miller LW, Russell SD, Young JB, Califf RM, Nohria A. Value of clinician assessment of hemodynamics in advanced heart failure: the ESCAPE trial. Circ Heart Fail. 2008;1:170–177. doi: 10.1161/CIRCHEARTFAILURE.108.769778. [DOI] [PMC free article] [PubMed] [Google Scholar]
- 6.Zile MR, Bennett TD, St John Sutton M, Cho YK, Adamson PB, Aaron MF, Aranda JM, Jr, Abraham WT, Smart FW, Stevenson LW, Kueffer FJ, Bourge RC. Transition from chronic compensated to acute decompensated heart failure: pathophysiological insights obtained from continuous monitoring of intracardiac pressures. Circulation. 2008;118:1433–1441. doi: 10.1161/CIRCULATIONAHA.108.783910. [DOI] [PubMed] [Google Scholar]
- 7.Forrester JS, Diamond G, McHugh TJ, Swan HJ. Filling pressures in the right and left sides of the heart in acute myocardial infarction. A reappraisal of central-venous-pressure monitoring. N Engl J Med. 1971;285:190–193. doi: 10.1056/NEJM197107222850402. [DOI] [PubMed] [Google Scholar]
- 8.Bursi F, Weston SA, Redfield MM, Jacobsen SJ, Pakhomov S, Nkomo VT, Meverden RA, Roger VL. Systolic and diastolic heart failure in the community. J Am Med Assoc. 2006;296:2209–2216. doi: 10.1001/jama.296.18.2209. [DOI] [PubMed] [Google Scholar]
- 9.Prasad A, Hastings J, Shibata S, Popovic ZB, Arbab-Zadeh A, Bhella PS, Okazai K, Fu Q, Berk M, Palmer D, Greenberg NL, Garcia MJ, Thomas JD, Levine BD. Characterization of static and dynamic left ventricular diastolic function in patients with heart failure and a preserved ejection fraction. Circ Heart Fail. doi: 10.1161/CIRCHEARTFAILURE.109.867044. In press. [DOI] [PMC free article] [PubMed] [Google Scholar]
- 10.Prasad A, Popovic ZB, Arbab-Zadeh A, Fu Q, Palmer D, Dijk E, Greenberg NL, Garcia MJ, Thomas JD, Levine BD. The effects of aging and physical activity on Doppler measures of diastolic function. Am J Cardiol. 2007;99:1629–1636. doi: 10.1016/j.amjcard.2007.01.050. [DOI] [PMC free article] [PubMed] [Google Scholar]
- 11.Arbab-Zadeh A, Dijk E, Prasad A, Fu Q, Torres P, Zhang R, Thomas JD, Palmer D, Levine BD. Effect of aging and physical activity on left ventricular compliance. Circulation. 2004;110:1799–1805. doi: 10.1161/01.CIR.0000142863.71285.74. [DOI] [PubMed] [Google Scholar]
- 12.Levine BD, Lane LD, Buckey JC, Friedman DB, Blomqvist CG. Left ventricular pressure-volume and Frank-Starling relations in endurance athletes: implications for orthostatic tolerance and exercise performance. Circulation. 1991;84:1016–1023. doi: 10.1161/01.cir.84.3.1016. [DOI] [PubMed] [Google Scholar]
- 13.Levine BD, Zuckerman JH, Pawelczyk JA. Cardiac atrophy after bed-rest deconditioning: a nonneural mechanism for orthostatic intolerance. Circulation. 1997;96:517–525. doi: 10.1161/01.cir.96.2.517. [DOI] [PubMed] [Google Scholar]
- 14.Buckey JC, Jr, Gaffney FA, Lane LD, Levine BD, Watenpaugh DE, Wright SJ, Yancy CW, Jr, Meyer DM, Blomqvist CG. Central venous pressure in space. J Appl Physiol. 1996;81:19–25. doi: 10.1152/jappl.1996.81.1.19. [DOI] [PubMed] [Google Scholar]
- 15.Atherton JJ, Moore TD, Lele SS, Thomson HL, Galbraith AJ, Belenkie I, Tyberg JV, Frenneaux MP. Diastolic ventricular interaction in chronic heart failure. Lancet. 1997;349:1720–1724. doi: 10.1016/S0140-6736(96)05109-4. [DOI] [PubMed] [Google Scholar]
- 16.Belenkie I, Smith ER, Tyberg JV. Ventricular interaction: from bench to bedside. Ann Med. 2001;33:236–241. doi: 10.3109/07853890108998751. [DOI] [PubMed] [Google Scholar]
- 17.Rosario LB, Stevenson LW, Solomon SD, Lee RT, Reimold SC. The mechanism of decrease in dynamic mitral regurgitation during heart failure treatment: importance of reduction in the regurgitant orifice size. J Am Coll Cardiol. 1998;32:1819–1824. doi: 10.1016/s0735-1097(98)00461-6. [DOI] [PubMed] [Google Scholar]