

Details of five very high-resolution accurate structures of bovine trypsin are compared in the context of the reproducibility of models obtained from crystals grown under identical conditions.
Keywords: atomic resolution, structure comparison, trypsin, structural reproducibility
Abstract
Structural studies of proteins usually rely on a model obtained from one crystal. By investigating the details of this model, crystallographers seek to obtain insight into the function of the macromolecule. It is therefore important to know which details of a protein structure are reproducible or to what extent they might differ. To address this question, the high-resolution structures of five crystals of bovine trypsin obtained under analogous conditions were compared. Global parameters and structural details were investigated. All of the models were of similar quality and the pairwise merged intensities had large correlation coefficients. The Cα and backbone atoms of the structures superposed very well. The occupancy of ligands in regions of low thermal motion was reproducible, whereas solvent molecules containing heavier atoms (such as sulfur) or those located on the surface could differ significantly. The coordination lengths of the calcium ion were conserved. A large proportion of the multiple conformations refined to similar occupancies and the residues adopted similar orientations. More than three quarters of the water-molecule sites were conserved within 0.5 Å and more than one third were conserved within 0.1 Å. An investigation of the protonation states of histidine residues and carboxylate moieties was consistent for all of the models. Radiation-damage effects to disulfide bridges were observed for the same residues and to similar extents. Main-chain bond lengths and angles averaged to similar values and were in agreement with the Engh and Huber targets. Other features, such as peptide flips and the double conformation of the inhibitor molecule, were also reproducible in all of the trypsin structures. Therefore, many details are similar in models obtained from different crystals. However, several features of residues or ligands located in flexible parts of the macromolecule may vary significantly, such as side-chain orientations and the occupancies of certain fragments.
1. Introduction
Crystallographic structures represent an average over space and time, i.e. an average of all unit cells of the crystal over the time span of the diffraction experiment. Protein crystals are characterized by a substantial degree of disorder in the solvent-filled voids between macromolecules and, to varying extents, within the macromolecules themselves. Therefore, it is important to determine whether crystallographic models yield the same results when different crystal specimens are used for the experiment. In most cases, even different crystal lattices can yield similar structures, as shown, for example, by the numerous crystal forms of hen egg-white lysozyme. However, although the overall structure might be the same, it is possible that local changes occur, such as different side-chain conformations or water-molecule sites, with the latter affecting the hydrogen-bond network in cavities and in the hydration shell. Furthermore, the coordination of a ligand might change, with bond distances and angles varying from crystal to crystal. It is also important to determine whether the protonation states of charged groups and occupancies of ligands are reproducible in different crystals of the same protein.
The question arises of whether it is sufficient to determine the structure of a protein using one single crystal or whether several crystals should be used in order to verify the reproducibility of the results. Furthermore, in some cases several crystals are used for a single structure determination. Indeed, crystals may suffer from substantial X-ray radiation-sensitivity so that only a small amount of data can be measured before they are significantly damaged (Helliwell et al., 1993 ▶; Yonath et al., 1998 ▶). If, in addition, their size is small and prevents the use of special techniques such as helical data collection (Yamamoto et al., 2010 ▶; Flot et al., 2010 ▶), measuring X-ray diffraction data from several crystals and merging them together represents a compromise for obtaining a reasonably complete data set. It is therefore important to determine whether there are significant structural changes between the crystals used for the experiments, which may have an impact on the final model.
In the context of protein structure accuracy, some comparisons of identical protein structures have been reported in the literature. An early study of two bovine trypsin–inhibitor complexes by Chambers & Stroud (1979 ▶) (resolutions of 1.5 and 1.8 Å) reported a root-mean-square difference (r.m.s.d.) of 0.25 Å between Cα coordinates. Daopin et al. (1994 ▶) undertook a structural comparison of transforming growth factor β and found an r.m.s.d. of 0.3 Å between all 112 Cα pairs (resolutions of 1.8 and 1.95 Å). Both surveys stated that the largest differences were found in flexible regions in which the density of the residues was not clearly visible. Ohlendorf (1994 ▶) re-refined four independently determined structures of human interleukin 1β against a common data set and observed that the solvent-molecule positions were the least reliable part of the structural model (resolution of 2.0–2.1 Å). Fujinaga et al. (1985 ▶) showed that a significant fraction of water sites (24 of 153 molecules, i.e. 15%) did not reappear if they were deleted and redetermined (resolution of 1.7 Å). Fields et al. (1994 ▶) presented a study of two independently refined models of plastocyanin at 173 K (resolution of 1.6 Å). They found that the r.m.s. differences of Cα atoms amounted to 0.08 Å and that about 85% of water-molecule sites occurred within 1 Å of each other. Some differences between the models, such as isotropic displacement parameters, can be attributed to the different refinement programs used. Furthermore, the interpretation of the details is prone to the subjectivity of the modeler.
High-resolution protein structures usually display a lower degree of heterogeneity compared with low-resolution or medium-resolution models because the latter may have intrinsically higher thermal motion, disorder and solvent content as well as higher lattice disorder. However, the choice of studying high-resolution models allows analysis of details such as protonation states, coordinate uncertainties and multiple conformations which are inaccessible from medium-resolution data.
We collected five atomic resolution data sets for a bovine trypsin–inhibitor complex and compared the details of the resulting structural models. Bovine trypsin (BT) is suited to this investigation as it crystallizes readily and the crystals diffract to very high resolution. Furthermore, it contains a calcium ion and an inhibitor molecule which allows the binding modes of small ligands to be assessed. We preserved the nonconsecutive numbering of trypsin residues in order to facilitate comparison with other trypsin models deposited in the Protein Data Bank.
2. Materials and methods
2.1. Crystallization and data collection
Bovine trypsin was obtained from Sigma (lot No. 104K7575) and used without further purification. Single crystals in space group P212121 were obtained using the hanging-drop vapor-diffusion method, mixing protein and well solutions in a 1:1 ratio. The protein solution consisted of 30 mg ml−1 trypsin, 5 mg ml−1 benzamidine, 3 mM CaCl2 in 30 mM HEPES buffer pH 7.0. The well solution consisted of 20% PEG 8000, 200 mM ammonium sulfate, 100 mM cacodylate buffer pH 6.5, 15% glycerol. For cryoprotection during exposure to X-rays, the crystals were soaked for a few seconds in the well solution supplemented with 25% glycerol.
Diffraction data collections were performed on the NE-CAT beamline 24ID at APS, Argonne National Laboratory. For each crystal, at least two passes of data were collected in order to adequately measure the weak (high-resolution) and the strong (low-resolution) reflections. The crystal-to-detector distance, exposure and oscillation angle were adjusted for each pass. X-ray diffraction data were integrated, scaled and merged with the program HKL-2000 (Otwinowski & Minor, 1997 ▶). Diffraction data statistics are summarized in Table 1 ▶.
Table 1. Diffraction data statistics and unit-cell parameters for the five trypsin models.
Values in parentheses are for the highest resolution shell.
| Model | BT1 | BT2 | BT3 | BT4 | BT5 |
|---|---|---|---|---|---|
| Unit-cell parameters | |||||
| a () | 54.22 | 54.34 | 54.25 | 54.21 | 54.22 |
| b () | 58.53 | 58.44 | 58.45 | 58.30 | 58.35 |
| c () | 66.45 | 66.48 | 66.18 | 66.24 | 66.24 |
| Wavelength () | 0.6199 | 0.5904 | 0.6199 | 0.6199 | 0.6199 |
| Resolution () | 300.80 (0.830.80) | 300.75 (0.780.75) | 300.87 (0.890.87) | 300.85 (0.860.85) | 300.87 (0.890.87) |
| Total reflections | 1139729 | 1342804 | 818778 | 786962 | 792486 |
| Unique reflections | 220132 | 254127 | 171230 | 183359 | 171309 |
| Multiplicity | 5.2 (3.8) | 5.3 (4.3) | 4.8 (3.2) | 4.3 (3.5) | 4.6 (3.9) |
| Completeness (%) | 99.8 (99.3) | 94.9 (88.4) | 99.7 (99.9) | 99.7 (99.4) | 99.6 (99.5) |
| R merge (%) | 5.2 (75.7) | 4.0 (63.6) | 6.7 (51.1) | 5.0 (36.5) | 6.2 (40.0) |
| R meas (%) | 5.4 (88.2) | 4.1 (72.2) | 6.8 (60.8) | 5.6 (42.2) | 7.1 (45.1) |
| I/(I) | 24.7 (1.8) | 28.0 (2.3) | 35.3 (2.1) | 39.9 (3.0) | 39.0 (3.1) |
| PDB code | 4i8g | 4i8h | 4i8j | 4i8k | 4i8l |
2.2. Refinement
Initially, we decided to refine all five structures as independently as possible (taking into account that this was performed by the same person), without comparing or ‘consulting’ other models at the stage of refinement and model building. We wanted to apply the same protocols, the same programs and the same ‘experimenter’s personal habits’. This approach was satisfactory for most parts of the subsequent analysis. However, the procedure led to some inconsistencies in the interpretation of double conformations in flexible parts of the models. As a consequence, we carried out some additional refinement steps after comparing the electron-density maps of the models in order to deconvolute the effects of arbitrary differences in interpretation and real differences among the crystals.
The initial phases were obtained by molecular replacement (MR) from the high-resolution model of bovine trypsin deposited in the PDB (Berman et al., 2003 ▶) (PDB entry 3mfj). Model 3mfj originates from an earlier restrained refinement of the BT1 diffraction data (A. Brzuszkiewicz, M. Dauter & Z. Dauter, unpublished work). Prior to MR, the input model was stripped of ligands and water molecules as well as double conformations, and the atomic displacement parameters (ADPs) were converted to isotropic. MR was carried out with MOLREP from the CCP4 suite (Winn et al., 2011 ▶). Rigid-body and isotropic refinement (increasing the resolution stepwise to the maximum value) were performed with REFMAC (Murshudov et al., 2011 ▶). Subsequent refinement steps were carried out with PHENIX (Afonine et al., 2005 ▶; Adams et al., 2010 ▶). ADPs for non-H atoms were refined anisotropically. Every three macrocycles of refinement, the structure was inspected using the graphics program Coot (Emsley & Cowtan, 2004 ▶). In the early stages, water molecules were added automatically using the water-picking algorithm in PHENIX; they were subsequently added manually with Coot. Multiple conformations and solvent molecules were gradually added and examined after the subsequent refinement step. Two sulfate ions, one glycerol molecule and the inhibitor benzamidine were modeled. In the last stages of PHENIX refinement, H atoms were added with phenix.reduce (Word et al., 1999 ▶), except for some of the OH groups of Ser, Tyr and Thr residues and the NH groups of His side chains, in order to avoid bias. The final PHENIX models were used as input models for refinement with SHELXL (Sheldrick, 2008 ▶). The occupancies of multiple conformations were reset to 0.5. The coordinates and ADPs of heavy atoms and the occupancies of water molecules, ligands and multiple conformations were refined until convergence. H atoms were refined as ‘riding’ on their parent atoms. The same set of restraints was applied to all of the models. One last step of full-matrix least-squares refinement was carried out in order to estimate the standard deviations (e.s.d.s) of coordinates and derived parameters (bond lengths and angles). The models from data sets 1 to 5 are hereafter called BT1, BT2 etc.
2.3. Model comparison
In order to assess the similarities and differences between the five BT models, global parameters and structural details were compared. The numbering of the following subsections is analogous to the relevant parts of §3. In §§2.3.1–2.3.8, the BT models from the independent refinement were used. §§2.3.9–2.3.11 refer to the models from the subsequent refinement steps.
2.3.1. Statistical 3σ test
The statistical 3σ test allows the identification of significant differences between parameters such as bond lengths or bond angles. The equation for the 3σ test is
In this formula, li represents the parameter and  is its standard deviation. If the σ level is greater than 3 then the difference between the parameters is considered as significant.
2.3.2. Merging of intensities
The Pearson correlation coefficients between the five individual BT data sets were calculated pairwise using the resolution range 30–0.87 Å. Only reflections that were present in all data sets were considered.
2.3.3. Coordination of calcium ion
The Ca—O distances and their uncertainties were obtained using the BOND command in SHELXL during the block-matrix least-squares refinement step. The statistical 3σ test was applied in order to identify which Ca—O distances vary significantly between different models.
2.3.4. Occupancy of inhibitor and other ligand molecules
The occupancies of the sulfate ions, the inhibitor benzamidine and the glycerol molecule as well as their uncertainties were obtained from the block-matrix least-squares refinement step. The statistical 3σ test was applied in order to identify which occupancies varied significantly between different models.
2.3.5. Comparison of water molecules
Using the superposed models, the numbers of corresponding water molecules at distances of <0.1 Å, within the ranges 0.1–0.5 Å and 0.5–1.0 Å and of >1.0 Å were determined. BT2 served as a reference, i.e. the water molecules of BT2 were compared with those of BT1, BT3, BT4 and BT5. Furthermore, the numbers of water molecules with occupancies of >0.75 and within the ranges 0.5–0.75 and 0.2–0.5 were counted.
2.3.6. Protonation states of charged residues
The protonation states of the histidine imidazole N atoms and of the carboxylate moieties were investigated by analyzing the hydrogen-bond network in the vicinity of the His, Asp and Glu residues and by interpreting difference Fourier electron-density maps. Indeed, at a resolution beyond 1 Å, H atoms in regions of low thermal motion can appear as significant difference density peaks in electron-density maps (Liebschner et al., 2009 ▶; Howard et al., 2004 ▶; Dauter et al., 1997 ▶). In order to obtain additional indications of the protonation state, the C—N—C angles in the imidazole ring (the C∊1—Nδ1—N∊2 and Cδ2—N∊2—C∊1 angles) and the C—O bond lengths in Asp and Glu were examined.
2.3.7. Main-chain bond lengths and angles
Values for main-chain bond lengths (N—Cα, Cα—C, C—N and C=O) and angles (C—N—Cα, N—Cα—C, Cα—C—O, Cα—C—N and O—C—N) as well as their uncertainties were obtained using the BOND command in SHELX. The mean values for each model were compared with values from the library of Engh & Huber (2001 ▶).
2.3.8. Disulfide bridges
The electron density of disulfide bridges was inspected and alternate positions for the Cys side chains were assigned if significant density peaks were present. The S—S bond lengths were compared in order to identify possible effects of radiation damage.
2.3.9. Other features
Some additional features, such as peptide flips, were detected in the models and compared.
2.3.10. Superposition of models
All five BT models were superposed with the ensembler module of the PHENIX software suite, using Cα or backbone atoms of residues 16–245 (corresponding to the whole residue range of the protein). Structural superposition was carried out with models containing double conformations and also with models stripped of disordered residues. To calculate the r.m.s. of the Cα coordinate uncertainties, double conformations were not taken into account. Indeed, their uncertainties are much larger than for ordered residues and considerably influence the value of the r.m.s. Similarly, the r.m.s. deviations of the distances between the Cα coordinates in the five superposed models were only calculated for residues in a single conformation.
2.3.11. Multiple conformations
The occupancies of the A conformations in BT1, BT3, BT4 and BT5 were compared with model BT2, which was determined at the highest resolution. Conformation A refers to the side-chain orientation that has occupancy >0.5 in BT2.
2.3.12. Elongated water-molecule peaks
One elongated electron density in the solvent region of BT was chosen and we investigated different possibilities for water-molecule modeling. Existing water molecules were deleted and the models were refined by five cycles of conjugate-gradient refinement. Afterwards, we placed (i) one anistropic water molecule with B iso = 25 Å2 and occupancy = 0.99, (ii) two isotropic water molecules with B iso = 25 Å2 and occupancy = 0.5 and (iii) two anisotropic water molecules with B iso = 25 Å2 and occupancy = 0.4, and refined each model with five cycles of SHELX refinement. The results were compared in order to determine which procedure leads to the best modeling of the elongated electron-density peak.
Figures showing electron-density maps were created with PyMOL (DeLano, 2002 ▶).
3. Results and discussion
3.1. Data reduction and model refinement
The five BT crystals diffracted in the sub-ångström resolution range, between 0.75 Å (BT2) and 0.87 Å (BT3 and BT5) (Table 1 ▶). The quality of the diffraction data is equivalent, as testified by similar R merge factors (4.0–6.7%), multiplicity and completeness. All crystals are isomorphous in space group P212121; the unit-cell parameters are around a = 54, b = 58, c = 66 Å. The largest difference occurs for the c axis and amounts to 0.3 Å between BT1 and BT3. The data set for BT2 is the best, with the highest resolution, multiplicity and completeness and simultaneously the lowest R merge. The Wilson B factor is comparable for all of the structures, ranging from 6.6 Å2 (BT2) to 7.6 Å2 (BT5). BT2 has the lowest Wilson B factor and also yielded the highest resolution. Low thermal motion is indeed one of the elements that allow high-resolution diffraction data to be obtained (Petrova & Podjarny, 2004 ▶).
The same refinement protocol was used independently for all BT structures. The refinement and model statistics are summarized in Table 2 ▶. The crystallographic agreement factors R and R free are similar and range from 8.7% (BT4) to 9.2% (BT1, BT3 and BT5) and from 9.9% (BT2) to 10.8% (BT3 and BT5), respectively. The final protein models are of high quality and consist of the complete BT chain of 223 residues from the N-terminal Ile16 to the C-terminal Asn245. The nonconsecutive numbering of the BT residues, based on the sequence of chymotrypsin, is preserved and includes deletions at positions 35, 36, 68, 126, 205, 206, 207, 208 and 218 and insertions after residues 184, 188 and 221. All other trypsin models that have been deposited in the PDB also have this numbering. No backbone torsion angles fall into the disallowed regions of the Ramachandran plot. Each BT model contains one calcium ion, the inhibitor molecule benzamidine (BEN), two sulfate ions and one glycerol molecule. Fig. 1 ▶ displays a cartoon representation of the BT1–inhibitor complex. The benzamidine molecule is located in the S1 pocket of the enzyme, with the first sulfate ion (SO4-1) positioned close to the potential position of the scissile carbonyl group of the substrate. The glycerol molecule is on the surface of BT; the second sulfate ion (SO4-2) is also located on the surface but on the opposite side of the protein. The number of modeled water sites varies from 400 (BT1) to 432 (BT4). Between 38 (BT3) and 42 (BT2) double conformations were modeled, corresponding to approximately 15% of all residues. Some side chains, such as Ser236 in BT2, even show indications of a third conformation.
Table 2. Refinement and model statistics.
Crystallographic agreement factors are indicated for F o > 4(F o); values in parentheses represent R factors without a cutoff.
| Model | BT1 | BT2 | BT3 | BT4 | BT5 |
|---|---|---|---|---|---|
| R (%) | 9.2 (10.7) | 8.8 (10.0) | 9.2 (10.5) | 8.7 (9.6) | 9.2 (10.2) |
| R free (%) | 10.6 (12.0) | 9.9 (11.1) | 10.8 (12.0) | 10.2 (11.1) | 10.8 (11.7) |
| R (full-matrix refinement, all data) (%) | 9.2 (10.7) | 9.0 (10.2) | 9.2 (10.5) | 8.8 (9.7) | 9.4 (10.3) |
| Multiple conformations | 38 | 43 | 38 | 38 | 38 |
| Water-molecule sites | 400 | 430 | 414 | 432 | 412 |
| B factors, protein (2) | |||||
| B max | 53.3 | 65.7 | 65.2 | 61.4 | 60.1 |
| B min | 3.8 | 3.1 | 3.6 | 3.6 | 3.8 |
| B ave | 8.3 | 7.6 | 8.6 | 8.3 | 8.7 |
| B factors, solvent (2) | |||||
| B max | 57.8 | 53.7 | 52.4 | 51.2 | 50.8 |
| B min | 4.8 | 4.2 | 4.9 | 4.7 | 5.2 |
| B ave | 20.8 | 18.8 | 20.9 | 19.7 | 21.6 |
| Wilson B factor (2) | 7.3 | 6.6 | 7.4 | 7.2 | 7.6 |
| Ramachandran analysis | |||||
| Favored (%) | 99.1 | 99.1 | 99.1 | 99.1 | 99.1 |
| Allowed (%) | 0.9 | 0.9 | 0.9 | 0.9 | 0.9 |
| Deviation from target values (r.m.s. deviations) | |||||
| Bonds () | 0.017 | 0.028 | 0.018 | 0.017 | 0.018 |
| Angles () | 2.3 | 2.5 | 2.2 | 2.3 | 2.2 |
| Chirality (3) | 0.11 | 0.12 | 0.10 | 0.11 | 0.12 |
| Planarity () | 0.011 | 0.011 | 0.010 | 0.010 | 0.010 |
| Dihedrals () | 12.6 | 12.5 | 12.8 | 13.0 | 12.9 |
Figure 1.

Cartoon representation of the BT1–inhibitor complex. Helices and sheets are represented in red and blue, respectively. Inhibitor and solvent molecules are represented as sticks.
3.2. Merging of intensities
The pairwise Pearson correlation coefficients between the intensities of the five BT data sets are indicated in Table 3 ▶, as well as the maximum percentage differences between the unit-cell dimensions. The intensities of data sets BT3, BT4 and BT5 correlated well, with correlation coefficients that were always larger than 0.96. Data sets BT1 and BT2 correlated with smaller values of between 0.658 and 0.821. This is larger than for the other data sets but is reasonable for intensities from different crystals. It has been estimated that a change of 0.5% in the unit-cell dimensions may produce a change of 10–15% in the intensities of individual reflections (Crick & Magdoff, 1956 ▶). Indeed, the lengths of the c cell axes of BT1 and BT2 differ by 0.3–0.5% compared with those of BT3, BT4 and BT5 (see Table 3 ▶). This may explain why the pairwise correlation coefficients are smaller between BT1 and BT2 and the others.
Table 3. Pearson correlation coefficients between the trypsin data sets.
The maximum percentage difference in the unit-cell dimensions between two crystals is given in parentheses.
| Model | BT1 | BT2 | BT3 | BT4 |
|---|---|---|---|---|
| BT2 | 0.785 (0.2) | |||
| BT3 | 0.795 (0.4) | 0.658 (0.5) | ||
| BT4 | 0.810 (0.4) | 0.670 (0.4) | 0.983 (0.3) | |
| BT5 | 0.821 (0.3) | 0.676 (0.4) | 0.968 (0.2) | 0.983 (0.1) |
3.3. Coordination of the calcium ion
Describing the coordination of a ligand or inhibitor molecule is often part of protein structure analysis; for example, the distance between two coordinated atoms can be used to characterize the strength of the interaction. It is hence interesting to know to what extent the coordination distances may vary from crystal to crystal. Thus, the Ca—O bond lengths in the five BT models were compared in order to ascertain their variability.
The coordination of the calcium ion is displayed in Fig. 2 ▶. The calcium ion coordinates octahedrally to two water molecules, two main-chain O atoms (Val75 and Asn72) and two side chains of glutamic acid residues (O∊1 of Glu70 and O∊2 of Glu80). The protein carbonyl and carboxyl O atoms form a slightly distorted planar quadrangle with the calcium ion in the center. The Ca—O distances are similar, varying between 2.26 and 2.34 Å. One water molecule lies above the quadrangle (HOH1) and the other is located beneath (HOH2); both are slightly away from the idealized octahedron axis.
Figure 2.

Coordination of the calcium ion in structure BT2. The blue 2F obs − F calc electron-density map is contoured at 3.0σ.
The Ca—O bond lengths for all BT models are indicated in Table 4 ▶ and the pairwise confidence σ levels are summarized in Table 5 ▶. Overall, the bond lengths are similar in all five structures. The largest difference between corresponding bond lengths is 0.017 Å for the O atom of HOH1 (see Fig. 2 ▶) in the models BT2 and BT3. The smallest difference is found for the O atom of Asn72 and amounts to 0.006 Å. The 3σ confidence test reveals that no distances differ significantly. However, the pairwise distance differences involving HOH1, which already stands out as having the largest difference between the corresponding bond lengths, are systematically larger than the 1σ level, except between BT1 and BT2 and between BT4 and BT5. The other Ca—O distance variations are generally smaller and rarely exceed a value of 2σ. The coordinates of water molecule HOH1 are therefore more variable than those of the other O atoms. Interestingly, the second calcium-coordinating water molecule HOH2, which is located beneath the plane, is not as flexible. It accepts a hydrogen bond from the main-chain amide group of Asp71 and is at hydrogen-bonding distance from another water molecule. On the other hand, the flexible water molecule HOH1 does not interact directly with protein atoms and is in proximity to other water molecules of the first hydration shell. This O atom is therefore less well confined, which may explain why its Ca coordination lengths vary more. In summary, the calcium-binding site is highly conserved in all five BT structures. The differences in bond lengths are not significant, but we observe that one water molecule systematically displays more flexibility than the other binding partners of the calcium ion.
Table 4. CaO bond lengths in the calcium-binding site of BT ().
The uncertainties of the distances are indicated in parentheses.
| Model | Glu80O2 | Glu70O1 | Val75O | Asn72O | HOH1 | HOH2 |
|---|---|---|---|---|---|---|
| BT1 | 2.323 (4) | 2.269 (3) | 2.288 (3) | 2.318 (3) | 2.334 (4) | 2.378 (4) |
| BT2 | 2.322 (3) | 2.264 (3) | 2.287 (3) | 2.324 (3) | 2.332 (4) | 2.386 (4) |
| BT3 | 2.330 (4) | 2.261 (4) | 2.281 (4) | 2.319 (4) | 2.349 (5) | 2.378 (5) |
| BT4 | 2.323 (4) | 2.257 (4) | 2.285 (4) | 2.322 (4) | 2.341 (4) | 2.379 (4) |
| BT5 | 2.314 (4) | 2.264 (4) | 2.281 (4) | 2.320 (4) | 2.340 (4) | 2.377 (4) |
Table 5. Pairwise significance levels of the CaO bond lengths in all BT models.
| BT1BT2 | BT1BT3 | BT1BT4 | BT1BT5 | BT2BT3 | BT2BT4 | BT2BT5 | BT3BT4 | BT3BT5 | BT4BT5 | |
|---|---|---|---|---|---|---|---|---|---|---|
| Glu80 | 0.2 | 1.2 | 0 | 1.6 | 1.6 | 0.2 | 1.6 | 1.2 | 2.8 | 1.6 |
| Glu70 | 1.2 | 1.6 | 2.4 | 1.0 | 0.6 | 1.4 | 0 | 0.7 | 0.5 | 1.2 |
| Val75 | 0.2 | 1.4 | 0.6 | 1.4 | 1.2 | 0.4 | 1.2 | 0.7 | 0 | 0.7 |
| Asn72 | 1.4 | 0.2 | 0.8 | 0.4 | 1.0 | 0.4 | 0.8 | 0.5 | 0.2 | 0.4 |
| HOH1 | 0.4 | 2.3 | 1.2 | 1.1 | 2.7 | 1.6 | 1.4 | 1.2 | 1.4 | 0.2 |
| HOH2 | 1.4 | 0 | 0.2 | 0.2 | 1.2 | 1.2 | 1.6 | 0.2 | 0.2 | 0.4 |
3.4. Occupancy of inhibitor and other ligand molecules
It is common in macromolecular crystallography to utilize protein–inhibitor or protein–ligand complexes to investigate the functional mechanism. However, the inhibitor or ligand molecules do not necessarily occupy the binding sites with full occupancy, or they may be flexible and display different binding modes. By comparing the occupancy of the inhibitor and solvent moieties in BT, we attempt to assess their reproducibility from crystal to crystal.
The occupancies of the inhibitor and solvent molecules are indicated in Table 6 ▶; the pairwise σ confidence levels are summarized in Supplementary Table S2.1 Interestingly, the inhibitor benzamidine adopts a double conformation in all five structures; a close-up view is represented in Fig. 3 ▶. This double conformation has not yet been reported in other trypsin–inhibitor complex models in the PDB. The position and orientation of the amidine group basically remain unchanged, whereas the phenyl group pivots around the C—C bond that connects the phenyl moiety to the amidine moiety. One conformation pivots clockwise and the other pivots counterclockwise. The occupancy of the A conformation varies between 0.51 in BT1 and 0.61 in BT4. The σ confidence levels are lower than 2.0 and the difference in the occupancy of the benzamidine molecule is therefore not significant.
Table 6. Occupancies of the inhibitor and other ligand molecules.
| Model | BT1 | BT2 | BT3 | BT4 | BT5 |
|---|---|---|---|---|---|
| BEN | |||||
| A | 0.51 (3) | 0.56 (3) | 0.57 (6) | 0.61 (4) | 0.53 (4) |
| B | 0.49 (3) | 0.44 (3) | 0.43 (6) | 0.39 (4) | 0.47 (4) |
| SO4-1 | 0.65 (1) | 0.65 (1) | 0.59 (1) | 0.66 (1) | 0.61 (1) |
| SO4-2 | 0.39 (1) | 0.44 (1) | 0.51 (1) | 0.58 (1) | 0.53 (1) |
| Glycerol | 0.79 (1) | 0.67 (1) | 0.63 (1) | 0.56 (1) | 0.64 (1) |
Figure 3.

Close-up view of the benzamidine inhibitor molecule in model BT5 illustrating the double conformation. The 2F obs − F calc electron-density map (blue) is contoured at 2σ. Note the elongated shape of the electron-density peaks in the phenyl group. Conformations A and B of BEN are represented in orange and green, respectively.
The occupancies of the sulfate ions are determined with a higher certainty than those of the inhibitor and the glycerol molecules. This is owing to the large number of electrons in the S atom. Accordingly, most of the confidence levels are greater than 3σ for both sulfate ions, and reach 7.5 and 14.5 for the partially occupied SO4-1 and SO4-2 molecules, respectively. The occupancies of the glycerol molecules vary between 0.56 in BT4 and 0.79 in BT1. Seven pairwise occupancy confidence levels are significant, most of which involve BT1. If the sulfate and glycerol molecules are not present, it is likely that water molecules occupy the corresponding space, but their electron density will not appear as strong peaks and it is difficult to model or refine them. No water molecules that share their location with glycerol or sulfate molecules were modeled in the five trypsin structures. It is therefore possible that the occupancies of these moieties did not converge to their proper values since water molecules were not taken into account. Furthermore, the occupancy is correlated to the thermal motion of the atoms, which may also influence the outcome of the refinement.
Therefore, the occupancy of molecules in ordered binding grooves is reproducible, whereas the occupancy of moieties that contain heavy atoms such as sulfur, or those located on the surface of the protein (thus displaying a substantial degree of flexibility), can differ significantly.
3.5. Comparison of water molecules
In protein crystals, water molecules occupy the solvent-filled voids between macromolecules and are also present in cavities. Usually, the water molecules in the first hydration shell and those inside cavities are modeled explicitly if their electron density is visible. Water molecules which are further away from the protein may be accounted for by solvent models such as the flat bulk-solvent model (Jiang & Brünger, 1994 ▶) or the exponential solvent model (Moews & Kretsinger, 1975 ▶).
The total number of water sites in the trypsin models varies between 400 in BT1 and 432 in BT4. Table 7 ▶ summarizes the number of water molecules in BT1, BT3, BT4 and BT5 that are within a certain distance compared with the water molecules in BT2. More than one third of the corresponding water molecules are less than 0.1 Å apart. Another third are located between 0.1 and 0.5 Å from water molecules in BT2. Only a few water sites differ by 0.5–1.0 Å and a significant number of waters do not have a corresponding partner within a distance of 1.0 Å. Table 8 ▶ summarizes the number of water molecules that have a certain occupancy value. A large part of the solvent refined to occupancies of between 0.5 and 0.75 and an even larger part to values larger than 0.75. 54–99 water molecules have weaker occupancies of between 0.2 and 0.5. Water molecules in different protein crystals are therefore reproducible to a certain extent: more than three quarters of the water-molecule sites are conserved within 0.5 Å and the number of water molecules within occupancy ranges is similar.
Table 7. Number of water molecules in BT1, BT3, BT4 and BT5 that are within a certain distance compared with the water molecules in BT2.
| Distance cutoff () | BT1BT2 | BT3BT2 | BT4BT2 | BT5BT2 |
|---|---|---|---|---|
| 0.1 | 185 | 156 | 164 | 159 |
| 0.10.5 | 159 | 195 | 197 | 184 |
| 0.51.0 | 11 | 14 | 7 | 18 |
| >1.0 | 75 | 65 | 62 | 69 |
Table 8. Occupancies of water molecules in the five trypsin models.
| BT1 | BT2 | BT3 | BT4 | BT5 | |
|---|---|---|---|---|---|
| Occupancy > 0.75 | 207 | 201 | 233 | 212 | 231 |
| 0.5 occupancy 0.75 | 114 | 130 | 118 | 137 | 127 |
| 0.2 occupancy 0.5 | 79 | 99 | 63 | 83 | 54 |
3.6. Protonation states of catalytic residues
3.6.1. Histidine
The imidazole ring of histidine can have different protonation states. In the neutral form, the Nδ1 or N∊2 atom is protonated; if both of them possess an H atom the histidine moiety is positively charged. A survey of imidazole groups in the Cambridge Structural Database (CSD; Allen, 2002 ▶) shows that the C—N—C angle is wider if the N atom is protonated. In a neutral imidazole group, the mean angles are 105.0 (10)° and 107.1 (6)° for an unprotonated and a protonated N atom, respectively. If both N atoms carry an H atom and the imidazole moiety is positively charged, the mean value is 109.1 (5)° (the search was performed in February 2012 over structures for which three-dimensional coordinates have been determined and that have R < 5%, are not polymeric, are not disordered, i.e. do not display alternate sites, and did not result from a powder diffraction experiment; Table 9 ▶).
Table 9. CNC angles () in neutral and charged histidine moieties, according to data from the Cambridge Structural Database.
| Neutral | Neutral | Charged | |
|---|---|---|---|
| N | NH | NH | |
| No. of structures | 38 | 38 | 194 |
| Average | 105.0 | 107.1 | 109.1 |
| Standard deviation | 1.0 | 0.6 | 0.5 |
By analyzing the stereochemistry, electron-density peaks in F obs − F calc difference maps and the C—N—C imidazole bond angles, the protonation states of the three histidine residues in BT (His40, His57 and His91) were investigated. Fig. 4 ▶ shows an example for each histidine residue. Table 10 ▶ summarizes the σ contour levels of electron density in F obs − F calc maps which may suggest the presence of H atoms belonging to histidine residues or putative hydrogen-bond donors and the C—N—C angles of the imidazole moiety. In the following, each histidine residue is discussed separately.
Figure 4.
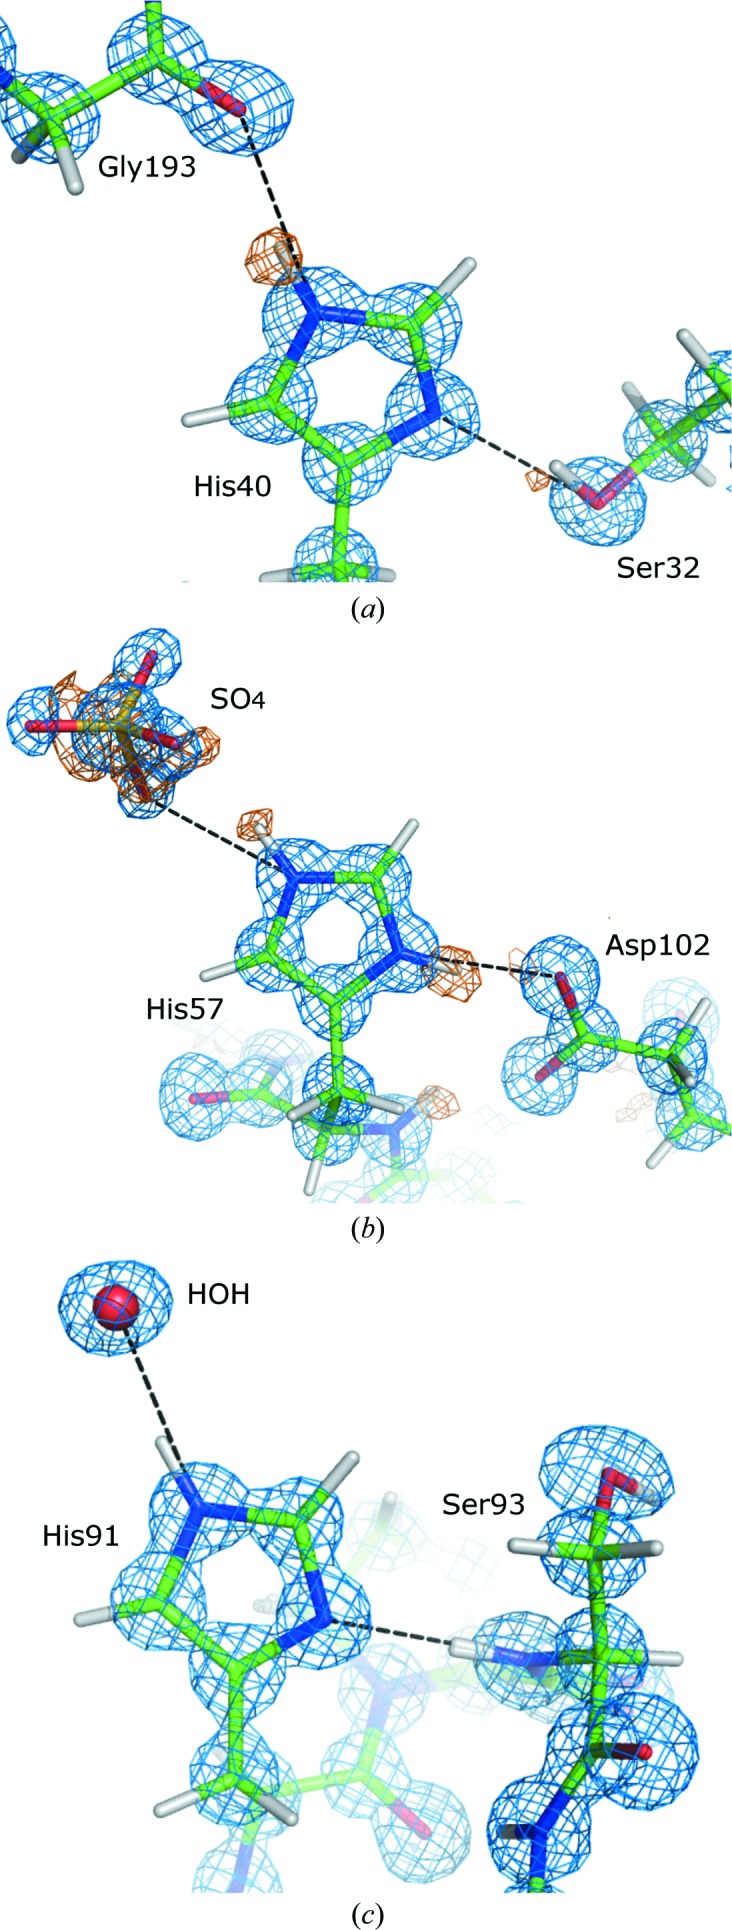
The vicinity of the three histidine residues in BT. The 2F obs − F calc electron-density map (blue) is contoured at 2.0σ and the positive F obs − F calc difference map (orange) is contoured at 2.5σ. For better visibility, the surrounding residues are not displayed. (a) His40 in BT2: the electron density peaks corresponding to the H atoms of N∊2 and of the Ser32 hydroxyl group are clearly visible. (b) His57 in BT5 is doubly protonated. (c) His91 in BT3; N∊2 is protonated.
Table 10. Protonation states of histidine residues in BT models.
(a).
Electron-density peak heights in units of histidine H atoms or of putative hydrogen-bond partners in proximity to the imidazole N1 and N2 atoms. The symbol is used when no electron density was visible above the noise level (1.5).
| His40 | His57 | His91 | ||||
|---|---|---|---|---|---|---|
| N1 | N2H | N1H | N2H | N1 | N2H | |
| Protonated | Protonated | Protonated | Protonated | |||
| Ser32H | Gly193O | Asp102O | SO4 ion | Ser93H0 | Water | |
| BT1 | 2.6 | 2.3 | 3.5 | 2.4 | ||
| BT2 | 2.7 | 3.7 | 3.9 | 3.6 | ||
| BT3 | 2.5 | 4.2 | 2.7 | |||
| BT4 | 1.6 | 3.9 | 2.5 | |||
| BT5 | 2.5 | 2.0 | 3.6 | 3.1 | ||
(b).
CN1C1 and C2N2C1 bond angles ().
| His40 | His57 | His91 | ||||
|---|---|---|---|---|---|---|
| N1 | N2 | N1 | N2 | N1 | N2 | |
| BT1 | 105.7 (4) | 106.4 (4) | 108.6 (4) | 108.7 (4) | 105.4 (4) | 107.4 (4) |
| BT2 | 105.4 (3) | 107.3 (3) | 107.6 (3) | 108.8 (3) | 105.3 (3) | 106.7 (3) |
| BT3 | 105.2 (5) | 107.5 (5) | 108.9 (5) | 109.2 (5) | 105.0 (5) | 107.3 (5) |
| BT4 | 104.9 (4) | 106.8 (4) | 108.9 (4) | 108.4 (4) | 105.7 (4) | 107.1 (4) |
| BT5 | 104.7 (4) | 107.0 (5) | 109.1 (5) | 108.4 (5) | 105.9 (4) | 107.3 (4) |
(a) His40. Two potential hydrogen-bond partners are in the vicinity of Nδ1 and N∊2, namely the hydroxyl group of Ser32, which can act as a donor or an acceptor, and the carbonyl O atom of Gly193. In BT1, BT2, BT4 and BT5, the electron density of the Hγ atom of the Ser32 side chain is visible. This H atom is located between Oγ and Nδ1 of His40; the hydroxyl group of Ser32 therefore acts as a hydrogen-bond donor to His40, suggesting that Nδ1 is not protonated in these structures. However, in BT3 no significant electron-density peaks can be observed in the Fourier difference maps. In the vicinity of the N∊2 atom a difference electron-density peak is visible in BT1, BT2, BT3 and BT5, indicating the presence of an H atom. This H atom fits well to the stereochemistry as it can form a hydrogen bond to the carbonyl O atom of Gly193.
In all five trypsin models the Cγ—Nδ1—C∊1 angle varies between 104.7 and 105.7°, which is close to the mean C—N—C angle of unprotonated N atoms in imidazole moieties [105.0 (10)°]. On the other hand, the Cδ2—N∊2—C∊1 angle is distributed between 106.4° (BT1) and 107.5° (BT3), which is close to the mean value for a protonated N atom [107.1 (6)°]. The bond angles therefore confirm that N∊2 is protonated, while Nδ1 does not carry an H atom. The hydroxyl group of Ser32 acts therefore as a hydrogen-bond donor and Nδ1, which accepts the hydrogen bond, cannot be protonated.
(b) His57. Possible hydrogen-bond partners of this group are the O atom of the sulfate ion SO4-1 for N∊2 and the carboxylate group of Asp102 for Nδ1. In all five models a significant difference electron-density peak (>3.4σ) is visible near Nδ1, indicating the presence of an H atom. Nδ1 therefore acts as a hydrogen-bond donor to Oδ2 of Asp102. We also observed significant electron-density peaks near N∊2 on the interaction line to the sulfate moiety. Both C—N—C angles are distributed between 107.6 (3)° (the Cγ—Nδ1—C∊1 angle in BT2) and 109.2 (5)° (the Cδ2—N∊2—C∊1 angle in BT3), which supports a doubly protonated histidine side chain. His57 is a member of the bovine trypsin catalytic triad. As the inhibitor and sulfate moieties are bound to the active site, N∊2 does not form a hydrogen bond to Ser195.
(c) His91. Nδ1 accepts a hydrogen bond from the main-chain amide NH of Ser93. The protonation of Nδ1 can therefore be excluded. A water molecule is located near N∊2, which can act as a hydrogen-bond acceptor or donor. However, it will most probably act as an acceptor, as the presence of a negatively charged histidine is highly unlikely. In all of the models no electron-density peaks appear beyond the noise level, but the Cγ—Nδ1—C∊1 angle is smaller than the Cδ2—N∊2—C∊1 angle, suggesting that N∊2 is protonated.
In a recent study of protonation-state determination in proteins, which also included the investigation of a 1.2 Å resolution bovine trypsin structure, Fisher et al. (2012 ▶) came to the conclusion that the uncertainty of the angles in histidine residues is too large to definitely determine the presence of an H atom. The authors do not give a final conclusion about the protonation states of trypsin, but in the deposited model (PDB entry 3unr) all three histidine residues are doubly protonated. The angles indicated in Fig. 9 of the paper (note that they compared the Cδ2 and C∊1 angles, so the C atom is in the center) indeed suggest that His57 and His91 are doubly protonated. However, as pointed out above, Nδ1 of His91 definitely cannot be protonated as it accepts a hydrogen bond from a neighboring amide group. Furthermore, the protonation state of His40 is unclear, with the low value of ∼101.7° for the C∊1 angle indicated in Fig. 9 being very far from 107, 109.3 and 111.2°, which are the angles expected for histidine in the charged and neutral states. Therefore, it is preferable to consider several sources of information in order to determine protonation states of histidine residues, i.e. stereochemistry, electron-density maps (if high-resolution data are available) and the geometry of the imidazole moiety. Even if the uncertainty of the angles is too large to statistically validate the protonation state, they may still be suggestive.
3.6.2. Carboxylate groups
Carboxylic acid —COO groups can be protonated or deprotonated. In the latter case the moiety is negatively charged and the carboxylate should be symmetric, i.e. the C—O bond lengths should be similar and amount to 1.256 (15) Å. If one of the O atoms is protonated, the C—OH bond length increases to 1.310 (17) Å and the C—O bond involving the other O atom decreases to 1.210 (16) Å (Fisher et al., 2012 ▶). In order to investigate the protonation of carboxylates in trypsin, the COO bond lengths and electron-density difference maps were analyzed.
There are six Asp residues (Asp71, Asp102, Asp153, Asp165, Asp1189 and Asp194), four Glu residues (Glu70, Glu77, Glu80 and Glu186) and one C-terminus in BT. Among these residues, Asp165, Asp153, Glu77 and Glu186 adopt alternate conformations or are flexible (with B iso larger than 18 Å2), so the uncertainty of the bond length increases and the possibility of observing H atoms in difference maps decreases (Howard et al., 2004 ▶). These residues were therefore not investigated. Interestingly, Fisher et al. (2012 ▶) also reported that Asp153 and Asp165 adopt double conformations in BT and that the thermal motion of Glu77 and Glu186 is above average in their model.
Table 11 ▶ summarizes the carboxylate C—O bond lengths in the five trypsin models. Glu70 and Glu80 must be charged, as their glutamate side chains coordinate the calcium ion. Their C—O bond lengths are indeed similar, with differences reaching only 0.021 Å for Glu70 in BT4. The differences in bond lengths for the aspartate moieties vary between 0.001 Å (Asp194 in BT1) and 0.036 Å (Asp194 in BT3). All of these differences are much smaller than the expected 0.1 Å difference between the C—OH and C—O bond lengths for protonated carboxylates. Therefore, all of the Asp residues seem to be in their charged states. Inspection of electron-density difference maps confirmed this result. The aspartate side chains act as hydrogen-bond acceptors, mainly from main-chain amide groups and in some cases from water molecules, the donated H atom of which appears as a significant peak (>2.5σ) in difference density maps, e.g. for Asp71 Oδ1 (Fig. 5 ▶).
Table 11. CO bond lengths of carboxylate groups in BT ().
The uncertainty in the bond length is indicated in parentheses.
| BT1 | BT2 | BT3 | BT4 | BT5 | ||
|---|---|---|---|---|---|---|
| Asp71 | CO1 | 1.266 (6) | 1.266 (5) | 1.245 (7) | 1.249 (6) | 1.267 (8) |
| CO2 | 1.255 (6) | 1.253 (5) | 1.252 (7) | 1.253 (7) | 1.250 (8) | |
| Asp102 | CO1 | 1.259 (5) | 1.255 (4) | 1.253 (6) | 1.249 (5) | 1.247 (6) |
| CO2 | 1.261 (5) | 1.268 (4) | 1.271 (6) | 1.271 (5) | 1.274 (6) | |
| Asp1189 | CO1 | 1.263 (6) | 1.272 (5) | 1.259 (7) | 1.274 (6) | 1.267 (7) |
| CO2 | 1.250 (6) | 1.250 (5) | 1.279 (8) | 1.253 (6) | 1.259 (7) | |
| Asp194 | CO1 | 1.258 (5) | 1.256 (4) | 1.231 (7) | 1.247 (5) | 1.234 (6) |
| CO2 | 1.257 (5) | 1.264 (4) | 1.267 (6) | 1.262 (5) | 1.260 (6) | |
| Glu70 | CO1 | 1.247 (6) | 1.257 (5) | 1.254 (7) | 1.263 (6) | 1.253 (7) |
| CO2 | 1.247 (6) | 1.258 (5) | 1.246 (7) | 1.242 (6) | 1.240 (6) | |
| Glu80 | CO1 | 1.269 (6) | 1.275 (5) | 1.272 (8) | 1.262 (6) | 1.265 (7) |
| CO2 | 1.260 (6) | 1.266 (5) | 1.258 (7) | 1.257 (6) | 1.275 (7) | |
| C-term | OT1 | 1.252 (10) | 1.222 (10) | 1.242 (17) | 1.220 (15) | 1.169 (15) |
| OT2 | 1.246 (9) | 1.266 (9) | 1.250 (16) | 1.257 (14) | 1.281 (16) |
Figure 5.
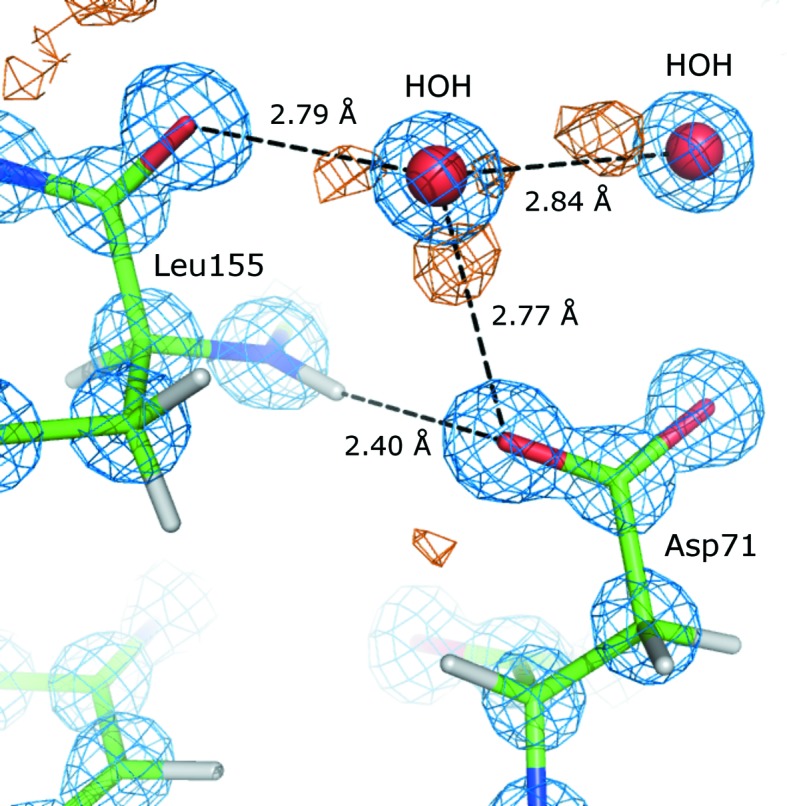
The vicinity of the Oδ1 atom of Asp71 in BT3. The 2F obs − F calc electron-density map (blue) is contoured at 2.5σ and the positive F obs − F calc difference map (orange) is contoured at 2.7σ. For better visibility, the surrounding residues are not displayed. Hydrogen-bond interactions are indicated as black lines. Note the canonical O⋯O distances involving the water molecules.
The C—O bond lengths for the Asn245 C-terminus vary between 0.006 Å in BT1 and 0.112 Å in BT5. For the latter, the difference in bond length may indicate that OT2 is protonated. However, the C-terminus is located on the surface of the protein and the carboxylate O atoms have B iso values of the order of 10–15 Å2, increasing the uncertainties of the bond lengths. Furthermore, there are two lysine residues in the vicinity of Asn245 which can stabilize the charged state of the C-terminus.
Therefore, analyzing the geometry and interpreting the electron-density maps yields the same result in all five BT models. We conclude that protonation states are reproducible in structures determined from different crystals obtained under analogous conditions for crystals analyzed at atomic resolution.
3.7. Main-chain bond lengths and angles
The statistics of the main-chain bond lengths and angles for non-Pro residues in each trypsin model are summarized in Table 12 ▶. Overall, the mean bond lengths and angles of the same type are very similar for different BT models. Furthermore, the spread of the bond lengths and angles around the mean values is relatively narrow, with r.m.s. deviations smaller than 0.014 Å and 2.7°, respectively. The discrepancies of the mean values of bond lengths and angles from the library restraint target values of Engh & Huber (2001 ▶) (EH) amount to 0–0.009 Å and 0–0.8°, respectively, which is much smaller than the spread of the distributions. Furthermore, the deviations from EH targets are significantly smaller than the target σ values used to weigh the restraints during SHELXL refinement, which were 0.02 and 0.04 Å for 1–2 and 1–3 distances (the latter value corresponds to about 3° when expressed as an angle). It can be noted that the N—Cα—C angles have larger r.m.s. deviations than the other main-chain bond angles. Indeed, this angle has been reported to have a wide spread of values and to be dependent on the local main-chain conformation (Ashida et al., 1987 ▶; Karplus, 1996 ▶; Esposito et al., 2000 ▶; Addlagatta et al., 2001 ▶; Berkholz et al., 2009 ▶). The bond lengths and angles are therefore well represented by the EH library and are reproducible in the different trypsin models.
Table 12. Statistics of the main-chain bond lengths () and angles ().
Values in parentheses indicate the spread. The right column (EH) contains the Engh and Huber target values (Engh Huber, 2001 ▶).
| BT1 | BT2 | BT3 | BT4 | BT5 | EH | |
|---|---|---|---|---|---|---|
| NC | 1.455 (10) | 1.457 (12) | 1.454 (13) | 1.454 (12) | 1.453 (12) | 1.459 |
| CC | 1.525 (12) | 1.528 (12) | 1.522 (13) | 1.523 (13) | 1.522 (12) | 1.525 |
| CN | 1.327 (13) | 1.333 (14) | 1.328 (14) | 1.328 (13) | 1.327 (13) | 1.336 |
| CO | 1.233 (12) | 1.234 (13) | 1.231 (13) | 1.232 (13) | 1.231 (15) | 1.229 |
| CNC | 122.0 (2.1) | 121.8 (2.1) | 122.1 (2.2) | 122.2 (2.2) | 122.0 (2.1) | 121.7 |
| NCC | 110.5 (2.6) | 110.5 (2.7) | 110.6 (2.7) | 110.5 (2.6) | 110.5 (2.6) | 111.0 |
| CCO | 120.7 (1.5) | 120.6 (1.4) | 120.6 (1.5) | 120.5 (1.6) | 120.6 (1.6) | 120.1 |
| CCN | 116.5 (1.9) | 116.4 (1.8) | 116.7 (1.9) | 116.6 (1.9) | 116.6 (1.8) | 117.2 |
| OCN | 122.8 (1.4) | 123.0 (1.3) | 122.8 (1.4) | 122.9 (1.4) | 122.9 (1.4) | 122.7 |
3.8. Disulfide bridges
There are six disulfide bridges in trypsin connecting residues 22–157, 42–58, 128–232, 136–201, 168–182 and 191–220. It is well known that disulfide bridges are prone to radiation damage (Weik et al., 2000 ▶; Ravelli & McSweeney, 2000 ▶; Burmeister, 2000 ▶) and first elongate and then break under the influence of absorbed X-rays. The difference electron-density maps around the disulfide bridges were inspected in order to identify signs of breakage, e.g. potential alternate positions of S atoms that are not connected to their partners. Several double conformations were modeled and their occupancies were refined, but some disulfide bridges had ambivalent difference density peaks in their vicinity. Namely, the pair 128–232 shows strong negative density peaks at at least one S atom in all BT models (5–8σ level), whereas positive peaks in the surroundings are significantly weaker (up to the 4σ level) or are even not present at all, so that no alternate position of the S atom could be determined. The disulfide bond 128–232 can thus be considered as damaged to a minor extent. Table 13 ▶ summarizes the occupancies of the double conformations. Cys157 and Cys220 adopt alternate positions in all five BT models and refine to similar values of around 0.85 and 0.70, respectively. In BT2, Cys22, Cys42 and Cys191 were also modeled in double conformations. The occupancies of interacting cysteine residues (for BT2 only) were not constrained but yielded similar values, e.g. 0.80 and 0.78 for the disulfide bond 42–58. In order to identify broken disulfide bridges, the S—S bond length was investigated. Usually, this bond amounts to 2.04 (16) Å according to a survey of models in the PDB (Morris et al., 1992 ▶), so when the bond lengths exceeded 2.20 Å the disulfide bond was considered to be broken. The values of the bond lengths in the trypsin models are indicated in Table 14 ▶. Accordingly, the bonds 42–58, 128–232, 136–201 and 168–182 are intact, except for the B conformation of 42–58 in BT2. The alternate positions of the S atom of Cys157 are such that the S—S bond length is greater than 2.20 Å; the disulfide bridge 22–157 is therefore broken in all of the models except BT4. The bond lengths involving the alternate positions of Cys220 are still in an acceptable range and it is thus not clear whether this disulfide bond displays an alternate conformation or is on the brink of breakage.
Table 13. List of cysteine double conformations in all BT models.
Only the occupancy of the A conformation is indicated; the B conformation is complementary.
| Residue | BT1 | BT2 | BT3 | BT4 | BT5 |
|---|---|---|---|---|---|
| Cys22 | 0.68 | ||||
| Cys157 | 0.85 | 0.83 | 0.86 | 0.71 | 0.80 |
| Cys42 | 0.80 | ||||
| Cys58 | 0.78 | ||||
| Cys191 | 0.76 | ||||
| Cys220 | 0.77 | 0.72 | 0.72 | 0.72 | 0.67 |
Table 14. SS bond lengths in disulfide bridges.
In the BT2 model both cysteines adopt double conformations for the residue pairs 22157, 4258 and 191201. Mixed combinations SaSb and SbSa were not considered as the occupancies of the crossed conformations do not match. Some distances were too long to be recognized as bonding interactions in SHELX; their uncertainty is thus not available.
| Residue | SiSj bond length () | |||||
|---|---|---|---|---|---|---|
| i | j | BT1 | BT2 | BT3 | BT4 | BT5 |
| 22 | 157a | 2.041 (2) | 2.041 (2) | 2.043 (2) | 2.037 (3) | 2.043 (2) |
| 22 | 157b | 2.307 (11) | 2.59 | 2.294 (15) | 2.164 (17) | 2.281 (12) |
| 42 | 58 | 2.059 (2) | 2.044 (3) | 2.056 (3) | 2.050 (3) | 2.058 (3) |
| 42b | 58b | 2.60 | ||||
| 128 | 232 | 2.019 (3) | 2.013 (2) | 2.017 (3) | 2.015 (3) | 2.017 (3) |
| 136 | 201 | 2.031 (2) | 2.029 (2) | 2.017 (3) | 2.019 (3) | 2.020 (3) |
| 168 | 182 | 2.048 (3) | 2.046 (3) | 2.058 (3) | 2.046 (3) | 2.054 (3) |
| 191 | 220a | 2.020 (4) | 2.016 (4) | 2.019 (5) | 2.018 (3) | 2.023 (4) |
| 191 | 220b | 2.208 (7) | 2.58 | 2.185 (12) | 2.183 (9) | 2.188 (9) |
In summary, three disulfide bridges remain intact (42–58 except in BT2, 136–201 and 168–182), two show signs of breakage (128–232 and 191–220) and one is broken (22–157). The results are reproducible for BT1, BT3, BT4 and BT5. The BT2 model, which was determined at the highest resolution, contains four more alternate positions for cysteine S atoms. It is likely that the attempt to collect the highest resolution data resulted in a high absorbed dose of X-rays and therefore in damage to most susceptible disulfide bridges in BT2. Indeed, the overall and high-resolution shell completeness of BT2 is poorer than in the other data sets, supporting the suggestion that the BT2 crystal suffered radiation damage.
3.9. Other features
As mentioned in §3.6, the benzamidine inhibitor molecule adopts a double conformation in all high-resolution trypsin models. We investigated whether other trypsin–inhibitor complexes deposited in the PDB also show signs of a multiple conformation. The following models, which have resolutions of between 1.0 and 1.5 Å, were analyzed: 3plb, 2oxs, 1c1n, 1j8a, 1c5p, 1s0r, 2blv and 3unr. Among these models, only 2blv shows difference electron density suggesting the presence of a second conformation. It is therefore possible that this feature only becomes visible at sub-Ångström resolution, whereas it is smeared out by thermal motion at lower resolutions.
In several BT models the shape of the electron density suggested a peptide flip for residues Ser147-Gly148 and Pro152-Asp153. Fig. 6 ▶ displays residue Pro152 in BT2 prior to modeling. Indeed, the negative F obs − F calc density at the peptide O atom and the positive density near the amide group suggest a peptide flip. Furthermore, a relocation of the water molecules is apparent in the electron density: water molecule HOHL-A is too close to the B-conformation of Pro152 and moves further to the left (HOHL-B). On the other side, water molecule HOHR moves closer to the amide group.
Figure 6.

Flip of the Pro152-Asp153 peptide unit in BT. The electron-density map of an earlier refinement step (in which the double conformation had not yet been modeled) is superposed on the final BT2 model. The 2F obs − F calc electron-density map (blue) is contoured at 1.0σ and the positive (green) and negative (red) F obs − F calc difference maps are contoured at 2.5σ and −2.5σ, respectively. For better visibility, the surrounding residues and parts of the map are not displayed. The B conformation is colored orange.
When the geometry of the models was validated after refinement, it turned out that the Cδ—O∊1 bond length of the carboxylate group in Glu186 was systematically greater than the dictionary value of 1.252 Å, i.e. in all models the bond is at least 0.25 Å longer. Fig. 7 ▶ shows a close-up of Glu186 in BT4 and Table 15 ▶ summarizes the C—O bond lengths of the carboxylate group as well as the isotropic displacement parameters of the Cδ, O∊1 and O∊2 atoms in all BT models. The shape of the 2F o − F c electron density around the O∊1 atom is elongated and reaches further than for O∊2, which explains why the bond length refines to such unusually high values. Some features suggest that the side chain of Glu186 is disordered. Indeed, there is a negative difference density peak at the Cγ atom and the isotropic thermal motion is larger than the average isotropic B factor (around 9 Å2 for protein atoms). Furthermore, the thermal motion of the O∊1 atom is systematically smaller than that of Cγ and O∊2, which might seem strange at first sight. However, it is likely that a water molecule occupies the site of O∊1 when the Glu186 side chain is in another orientation. The combined electron density of the O∊1 atom and the water molecule holds the atom in place and explains why the B factor refines to a smaller value. If the position of the water site is slightly displaced compared with that of O∊1, it is possible that the Cδ—O∊1 bond length elongates, taking into account that the maximum of the electron density is shifted. The Cδ—O∊1 bond length in all five BT models is larger than the dictionary value; even such detailed features are therefore reproducible in different crystals.
Figure 7.
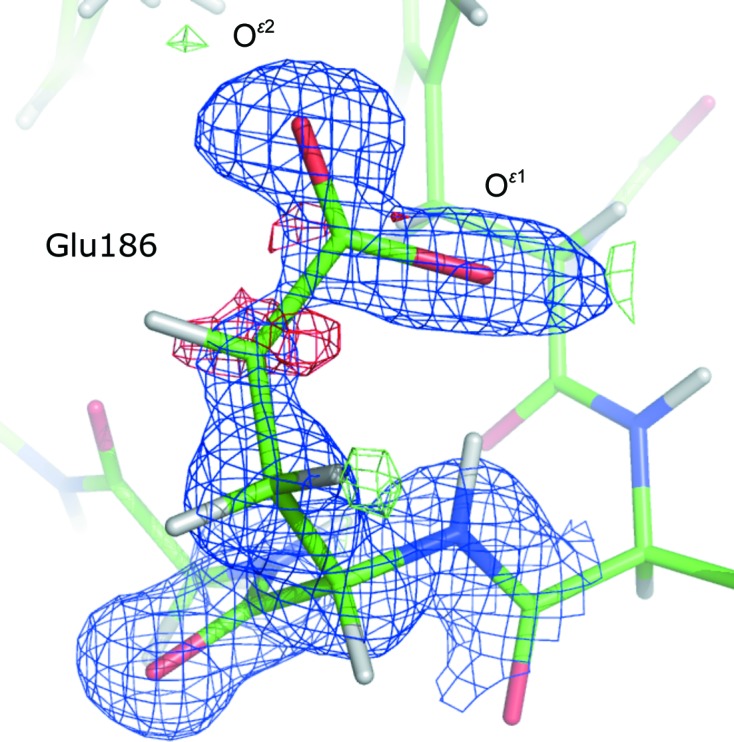
Close-up of Glu186 in BT4. The 2F obs − F calc electron-density map (blue) is contoured at 1.0σ and the positive (green) and negative (red) F obs − F calc difference maps are contoured at 3.0σ and −3.0σ, respectively.
Table 15. CO bond lengths of the carboxylate group of Glu186 and isotropic displacement parameters B iso of the C, O1 and O2 atoms in all BT models.
| Bond length () | B iso (2) | ||||
|---|---|---|---|---|---|
| Model | CO1 | CO2 | C | O1 | O2 |
| BT1 | 1.337(43) | 1.312(36) | 29.8 | 21.9 | 31.1 |
| BT2 | 1.507 (40) | 1.350 (30) | 29.3 | 20.4 | 30.1 |
| BT3 | 1.511 (60) | 1.252 (50) | 31.9 | 24.5 | 34.0 |
| BT4 | 1.526 (45) | 1.204 (35) | 29.4 | 21.4 | 29.1 |
| BT5 | 1.515 (55) | 1.175 (37) | 30.8 | 24.5 | 36.3 |
3.10. Superposition of models
The Cα and backbone atoms of the five trypsin models were superposed and the resulting root-mean-square deviations are indicated in Table 16 ▶. The r.m.s. deviations of the Cα and backbone atoms range from 0.06 to 0.07 Å and from 0.08 to 0.09 Å, respectively. The five structures thus superpose very well. If residues in alternative conformations are not taken into account, the r.m.s. deviations are even lower and are between 0.04 and 0.05 Å. The r.m.s. of the Cα coordinate uncertainties obtained from full-matrix least-squares refinement (without double conformations) ranges from 0.009 in BT2 to 0.013 in BT3. Thus, the r.m.s. deviations between individual models and the coordinate uncertainties do not really match. It might be possible that SHELXL underestimates the coordinate uncertainties. Besides, outliers dominate the r.m.s.d., which might further increase the difference between the estimated uncertainties and the observed differences. Fig. 8 ▶ displays the distribution of the r.m.s. deviations between Cα atoms for residues that adopt a single conformation. Most atoms shift by about 0.03 Å in the five models, which is rather consistent with the SHELX coordinate uncertainty estimates. Therefore, the conformation of the structures is reproducible between different crystals.
Table 16. Root-mean-square deviations of multi-model superposition based on C atoms with (first line) and without (second line) the B conformation.
The last line indicates the r.m.s. of the C coordinate uncertainties estimated from full-matrix least-squares refinement without using A and B fragments of double conformations. All quantities are indicated in .
| Model | BT1 | BT2 | BT3 | BT4 | BT5 |
|---|---|---|---|---|---|
| R.m.s.d. C | 0.07 | 0.06 | 0.07 | 0.06 | 0.06 |
| R.m.s.d. C, no disorder | 0.05 | 0.04 | 0.04 | 0.04 | 0.04 |
| R.m.s. C uncertainties | 0.009 | 0.009 | 0.013 | 0.011 | 0.012 |
Figure 8.

Distribution of the positional r.m.s.d.s between Cα atoms without taking double conformations into account. Most atoms shift by about 0.03 Å in the five models.
3.11. Multiple conformations
Proteins usually display a high degree of disorder, which can be static or dynamic (Trueblood et al., 1996 ▶). In the former case, some atoms, for example a side chain, adopt different conformations in different unit cells, whereas dynamic disorder represents movement of the atoms owing to thermal vibrations. At high resolution, it is possible to observe and refine multiple conformations in protein models (Dauter et al., 1995 ▶). We compared the number of alternate conformations, the values of the occupancies and the orientation of the side chains in the re-refined trypsin models. In the five structures the number of multiple conformations ranges from 38 in BT1, BT3, BT4 and BT5 to 43 in BT2. Supplementary Table S1 summarizes the occupancies of the A conformation in all five trypsin models. Most multiple conformations are present in all of the models, except for cysteine residues 22, 42, 58 and 191, the side chains of which were modeled with an alternate conformation in BT2 only (see §3.8). Furthermore, the second conformation of Lys87 is only visible in BT1 and BT2, and the electron density of Pro92 does not show evidence for an alternate orientation in BT1. Fig. 9 ▶ displays the difference between the occupancies of the A conformation in BT2 and in the other models: Δocc = occBT2 − occBTX (where X = 1, 3, 4, 5). This representation shows whether there are substantial differences between the occupancies. BT2 was chosen as a reference as this model was determined at the highest resolution. The occupancies of Cys22, Cys42, Cys58, Cys191, Lys87 and Pro92 have Δocc > 0.5 as they are not present in at least one other model. The majority of the multiple conformations are present in all of the models and the occupancy difference is mostly less than 0.1 and does not exceed 0.2. Therefore, there are no substantial differences between the occupancies in the five BT models.
Figure 9.

Differences between the occupancies of multiple conformations in BT2 and the other models (BT1, BT3, BT4 and BT5).
Fig. 10 ▶ shows the side chain of Lys87 in BT2 and BT5. In BT5 (Fig. 9 ▶ a) negative difference electron-density peaks are located near the Cγ and C∊ atom positions of Lys87, indicating that this side chain is not fully occupied. However, there are no positive difference density peaks above the 3σ level in the vicinity which could show how a putative second conformation would be oriented. Similarly, we did not observe clear signs for a second conformation of Lys87 in BT3 and BT4. In BT2 (Fig. 9 ▶ b) and BT1 the electron-density maps give further indications. The negative difference density peaks at Cγ, C∊ and Nζ are larger and four positive peaks (the peak at Cδ being rather weak) allow modeling of the alternate conformation. It is likely that Lys87 adopts a similar second conformation in BT3, BT4 and BT5. However, the electron-density peaks do not show up as clearly as in BT1 or BT2, which might be owing to the lower resolution of the diffraction data.
Figure 10.

The Lys87 side chain in (a) BT5 and (b) BT2. The 2F obs − F calc electron-density map (blue) is contoured at 1.0σ and the positive (green) and negative (red) F obs − F calc difference maps are contoured at 3σ and −3σ, respectively. For better visibility, the surrounding residues and parts of the map are not displayed. The B conformation is colored orange. The B conformation was not present in the model in the calculation of the maps.
After modeling and refining the multiple conformations, the orientations of the side chains were compared. In most cases, the orientations are similar and correspond well in each model. However, some residues deviate slightly, which can be explained either by the flexibility of the side chain or by the convergence behavior of the refinement.
(i) Val31 in BT4: the B conformation has a slightly different orientation, although the density appears similar to that in the other models. Furthermore, difference density peaks indicate that the B orientation in BT4 is not optimal. It is likely that the refinement did not converge to the true orientation for the B conformation.
(ii) Val53 in BT5: as for Val31, the B conformation in BT5 has a slightly different orientation while the density appears similar.
(iii) Ser147: this part of the structure is flexible in all of the models so that the Oγ atom of Ser147 cannot be placed with certainty. It is therefore not possible to tell whether there are measurable differences in side-chain orientation. Gly148 and Thr149 also display high flexibility, which is likely to be because they are located on the surface of the protein. The alternate conformations refine to similar orientations but are not as superposable as in ordered parts of the structure.
(iv) Asp153 in BT1. In Asp153, the A and B conformations are relatively close one to another, i.e. the carboxylate group is separated by around 0.8 Å. In BT1, the B conformation of the Asp153 side chain is at the position of the A conformation in BT2 and the other models (the conformations cannot be switched as Pro152 has a peptide-flip double conformation). However, the electron density appears similar in all cases. It is likely that in BT1 Asp153 did not converge to the same orientation.
(v) For Asn48, Ser86, Thr125, Thr134, Gln135, Lys145, Lys1188 and Gln240 the residues are superposable, but the B conformation or the extremities of the side chain (such as the Nζ atom of lysine) are flexible and have higher B factors.
Therefore, multiple conformations are surprisingly well conserved in the different trypsin structures. The occupancies refine to similar values and the conformations adopt reproducible orientations, except in regions of higher flexibility such as at the surface of the protein.
3.12. Elongated water-molecule peaks
It was felt that there were problems with some water molecules, typically those placed in elongated nonspherical electron-density peaks and/or those that refined to weak occupancies. For example, if two partly occupied water molecules were placed in such peaks it was found that after several cycles of refinement one water molecule was ‘kicked’ out of the density, likely owing to the BUMP restraint in SHELX which prevents noncovalently bonded atoms being too close to one another if the sum of their occupancies is larger than 1.1 (the default value). Therefore, we chose one such peak as an example, deleted the existing water molecules, placed new ones and compared the results. The peak in question is in proximity to the Thr26 carbonyl O atom and the Tyr29 OH atom. Fig. 11 ▶ shows different possibilities for models BT2 and BT4 and Table 17 ▶ summarizes the occupancies and isotropic ADPs after refinement. Fig. 11 ▶(a) displays the electron density after removal of the water molecules and five conjugate-gradient refinement steps. The electron density has an elongated shape: the peak protrudes a bit further towards the next residue on the left in the case of BT2. If one anisotropic water molecule is placed in the electron density (Fig. 11 ▶ b) approximately two thirds of the peak is taken into account, but some difference density still remains for BT2 and BT4. Furthermore, there are negative F obs − F calc peaks in BT2, indicating that the thermal ellipsoid is not ‘flat’ enough to describe the elongated peak. For the different models, the occupancy varies between 0.72 (BT1) and 0.86 (BT2 and BT3), whereas the isotropic B factors have values of between 22.2 Å2 (BT2) and 24.3 Å2 (BT3); all of the water molecules therefore have a similar occupancy and thermal motion.
Figure 11.

Different possibilities for modeling water molecules in elongated electron-density peaks. Left column, BT2; right column, BT4. (a) No water molecules, (b) one water molecule with anisotropic ADPs, (c) two water molecules with isotropic and (d) anisotropic ADPs. The 2F obs − F calc electron-density map (blue) is contoured at 1.0σ and the positive (green) and negative (red) F obs − F calc difference maps are contoured at 3σ and −3σ, respectively. The thermal ellipsoids are displayed with a 50% probability surface.
Table 17. Occupancy and isotropic ADPs of water molecules in an elongated electron-density peak.
| Site 1 | Site 2 | |||
|---|---|---|---|---|
| Model | Occupancy | B iso (2) | Occupancy | B iso (2) |
| One anisotropic water molecule | ||||
| BT1 | 0.72 | 23.8 | ||
| BT2 | 0.86 | 22.2 | ||
| BT3 | 0.86 | 24.3 | ||
| BT4 | 0.74 | 22.3 | ||
| BT5 | 0.77 | 22.4 | ||
| Two isotropic water molecules | ||||
| BT1 | 0.35 | 14.0 | 0.36 | 17.5 |
| BT2 | 0.40 | 13.6 | 0.42 | 17.3 |
| BT3 | 0.54 | 16.4 | 0.48 | 17.7 |
| BT4 | 0.44 | 14.3 | 0.43 | 17.4 |
| BT5 | 0.39 | 14.0 | 0.35 | 17.6 |
| Two anisotropic water molecules | ||||
| BT1 | Refinement unstable | |||
| BT2 | Refinement unstable | |||
| BT3 | 0.44 | 14.3 | 0.36 | 15.7 |
| BT4 | 0.32 | 12.6 | 0.31 | 15.8 |
| BT5 | 0.01 | 17.4 | 0.19 | 13.7 |
If two isotropic water molecules are placed, the elongated electron-density peak is better described (Fig. 10 ▶ c). BT4 no longer has positive difference density and there is less remaining density in the case of BT2, which might be described by another water molecule. As in the previous case, the occupancies and isotropic ADPs refine to similar values in all of the models.
If two anisotropic water molecules are placed, the refinement becomes unstable for BT1 and BT2. Furthermore, one water molecule in BT5 was displaced far out of the unit cell (site 1) and thus this can also be considered as an unstable refinement. The two successful refinements of BT3 and BT4 yielded similar values for the occupancy and the B factor.
Therefore, elongated solvent electron-density peaks are best described by clusters of isotropic water molecules. One anisotropic water molecule does not necessarily describe the peak well enough (especially if the refinement program applies restraints preventing high anisotropy) and two anisotropic water moieties increase the number of parameters considerably (20 compared with ten in the other cases) and may result in unstable SHELX refinement.
3.13. Origin of the differences between the crystal structures
According to our results, many features of crystal structures obtained using the same experimental conditions are similar and the variation in both the experimental data and the final models is not very pronounced. Most differences occur in flexible parts of the structure, such as the surface of the protein. Several reasons may explain the variations. It is possible that full equilibration was not reached when the crystals were soaked in the cryosolution. This particularly influences the solvent region. Furthermore, the size of the crystals varied slightly, which produces variable cryocooling conditions. In addition, it is likely that there were minor differences in the crystal-growth conditions. As discussed in §3.2, the c axis is about 0.5% longer in BT1 and BT2 than in BT3, BT4 and BT5. A reason for the distortion could be radiation damage, which can cause an increase in the unit cell during the experiment (Ravelli et al., 2002 ▶).
4. Conclusion
In this paper, we compared five high-resolution X-ray structures of a bovine trypsin–inhibitor complex. The aim of the study was to assess whether some details vary substantially in models obtained from different crystals grown under identical conditions. We found that the intensities correlate well for isomorphous crystals, but if the unit-cell parameters change by more than 0.3% the pairwise Pearson correlation coefficient decreases. The Cα coordinates of the BT models superpose well and their root-mean-square deviations agree with the average coordinate uncertainties estimated from full-matrix refinement. The Ca—O bond lengths of the calcium ion and the occupancy of the double conformation of the inhibitor molecule are similar in all of the trypsin models. However, the occupancies of the sulfate and glycerol moieties can differ significantly. The orientations and occupancies of protein double conformations are common in most cases. For more than three quarters of the water molecules the coordinates do not vary by more than 1.0 Å. The protonation states of histidine residues and COO groups were investigated and we found similar results in each structure. The same disulfide bridges are prone to radiation damage and show signs of breakage. The main-chain bond lengths and angles are in agreement with the Engh and Huber target values and have similar averages in all models. Water sites in elongated electron-density peaks should be modeled with isotropic displacement parameters. We conclude that many details are similar in models obtained from different protein crystals. However, some features of residues or ligands located in flexible parts of the macromolecule may vary significantly and their detailed interpretation may depend on the resolution of the diffraction data.
Supplementary Material
PDB reference: trypsin, model BT1, 4i8g
PDB reference: model BT2, 4i8h
PDB reference: model BT3, 4i8j
PDB reference: model BT4, 4i8k
PDB reference: model BT5, 4i8l
Supporting information file. DOI: 10.1107/S0907444913009050/rr5036sup1.pdf
Acknowledgments
This work was supported in part with Federal funds from the National Cancer Institute, National Institutes of Health contract No. NO1-CO-12400 and the Intramural Research Program of the NIH, National Cancer Institute, Center for Cancer Research. The content of this publication does not necessarily reflect the views or policies of the Department of Health and Human Services, nor does the mention of trade names, commercial products or organizations imply endorsement by the US Government. Diffraction data were collected on the NE-CAT beamline 24-ID at the Advanced Photon Source, Argonne National Laboratory. Use of the Advanced Photon Source was supported by the US Department of Energy, Office of Science, Office of Basic Energy Sciences, under Contract No. W-31-109-Eng-38.
Footnotes
Supplementary material has been deposited in the IUCr electronic archive (Reference: RR5036). Services for accessing this material are described at the back of the journal.
References
- Adams, P. D. et al. (2010). Acta Cryst. D66, 213–221.
- Addlagatta, A., Krzywda, S., Czapinska, H., Otlewski, J. & Jaskolski, M. (2001). Acta Cryst. D57, 649–663. [DOI] [PubMed]
- Afonine, P. V., Grosse-Kunstleve, R. W. & Adams, P. D. (2005). CCP4 Newsl. Protein Crystallogr. 42, contribution 8.
- Allen, F. H. (2002). Acta Cryst. B58, 380–388. [DOI] [PubMed]
- Ashida, T., Tsunogae, Y., Tanaka, I. & Yamane, T. (1987). Acta Cryst. B43, 212–218.
- Berkholz, D. S., Shapovalov, M. V., Dunbrack, R. L. & Karplus, P. A. (2009). Structure, 17, 1316–1325. [DOI] [PMC free article] [PubMed]
- Berman, H., Henrick, K. & Nakamura, H. (2003). Nature Struct. Biol. 10, 980. [DOI] [PubMed]
- Burmeister, W. P. (2000). Acta Cryst. D56, 328–341. [DOI] [PubMed]
- Chambers, J. L. & Stroud, R. M. (1979). Acta Cryst. B35, 1861–1874.
- Crick, F. H. C. & Magdoff, B. S. (1956). Acta Cryst. 9, 901–908.
- Daopin, S., Davies, D. R., Schlunegger, M. P. & Grütter, M. G. (1994). Acta Cryst. D50, 85–92. [DOI] [PubMed]
- Dauter, Z., Lamzin, V. S. & Wilson, K. S. (1995). Curr. Opin. Struct. Biol. 5, 784–790. [DOI] [PubMed]
- Dauter, Z., Lamzin, V. S. & Wilson, K. S. (1997). Curr. Opin. Struct. Biol. 7, 681–688. [DOI] [PubMed]
- DeLano, W. L. (2002). PyMOL http://www.pymol.org.
- Emsley, P. & Cowtan, K. (2004). Acta Cryst. D60, 2126–2132. [DOI] [PubMed]
- Engh, R. A. & Huber, R. (2001). International Tables for Crystallography, Vol. F, edited by M. G. Rossmann & E. Arnold, pp. 382–392. Dordrecht: Kluwer Academic Publishers.
- Esposito, L., Vitagliano, L., Sica, F., Sorrentino, G., Zagari, A. & Mazzarella, L. (2000). J. Mol. Biol. 297, 713–732. [DOI] [PubMed]
- Fields, B. A., Bartsch, H. H., Bartunik, H. D., Cordes, F., Guss, J. M. & Freeman, H. C. (1994). Acta Cryst. D50, 709–730. [DOI] [PubMed]
- Fisher, S. J., Blakeley, M. P., Cianci, M., McSweeney, S. & Helliwell, J. R. (2012). Acta Cryst. D68, 800–809. [DOI] [PubMed]
- Flot, D., Mairs, T., Giraud, T., Guijarro, M., Lesourd, M., Rey, V., van Brussel, D., Morawe, C., Borel, C., Hignette, O., Chavanne, J., Nurizzo, D., McSweeney, S. & Mitchell, E. (2010). J. Synchrotron Rad. 17, 107–118. [DOI] [PMC free article] [PubMed]
- Fujinaga, M., Delbaere, L. T., Brayer, G. D. & James, M. N. G. (1985). J. Mol. Biol. 184, 479–502. [DOI] [PubMed]
- Helliwell, J. R., Ealick, S., Doing, P., Irving, T. & Szebenyi, M. (1993). Acta Cryst. D49, 120–128. [DOI] [PubMed]
- Howard, E. I., Sanishvili, R., Cachau, R. E., Mitschler, A., Chevrier, B., Barth, P., Lamour, V., Van Zandt, M., Sibley, E., Bon, C., Moras, D., Schneider, T. R., Joachimiak, A. & Podjarny, A. (2004). Proteins, 55, 792–804. [DOI] [PubMed]
- Jiang, J.-S. & Brünger, A. T. (1994). J. Mol. Biol. 243, 100–115. [DOI] [PubMed]
- Karplus, P. A. (1996). Protein Sci. 5, 1406–1420. [DOI] [PMC free article] [PubMed]
- Liebschner, D., Elias, M., Moniot, S., Fournier, B., Scott, K., Jelsch, C., Guillot, B., Lecomte, C. & Chabrière, E. (2009). J. Am. Chem. Soc. 131, 7879–7886. [DOI] [PubMed]
- Moews, P. C. & Kretsinger, R. H. (1975). J. Mol. Biol. 91, 201–225. [DOI] [PubMed]
- Morris, A. L., MacArthur, M. W., Hutchinson, E. G. & Thornton, J. M. (1992). Proteins, 12, 345–364. [DOI] [PubMed]
- Murshudov, G. N., Skubák, P., Lebedev, A. A., Pannu, N. S., Steiner, R. A., Nicholls, R. A., Winn, M. D., Long, F. & Vagin, A. A. (2011). Acta Cryst. D67, 355–367. [DOI] [PMC free article] [PubMed]
- Ohlendorf, D. H. (1994). Acta Cryst. D50, 808–812. [DOI] [PubMed]
- Otwinowski, Z. & Minor, W. (1997). Methods Enzymol. 276, 307–326. [DOI] [PubMed]
- Petrova, T. & Podjarny, A. (2004). Rep. Prog. Phys. 67, 1565–1605.
- Ravelli, R. B. G. & McSweeney, S. M. (2000). Structure, 8, 315–328. [DOI] [PubMed]
- Ravelli, R. B. G., Theveneau, P., McSweeney, S. & Caffrey, M. (2002). J. Synchrotron Rad. 9, 355–360. [DOI] [PubMed]
- Sheldrick, G. M. (2008). Acta Cryst. A64, 112–122. [DOI] [PubMed]
- Trueblood, K. N., Bürgi, H.-B., Burzlaff, H., Dunitz, J. D., Gramaccioli, C. M., Schulz, H. H., Shmueli, U. & Abrahams, S. C. (1996). Acta Cryst. A52, 770–781.
- Weik, M., Ravelli, R. B. G., Kryger, G., McSweeney, S., Raves, M. L., Harel, M., Gros, P., Silman, I., Kroon, J. & Sussman, J. L. (2000). Proc. Natl Acad. Sci. USA, 97, 623–628. [DOI] [PMC free article] [PubMed]
- Winn, M. D. et al. (2011). Acta Cryst. D67, 235–242.
- Word, J. M., Lovell, S. C., LaBean, T. H., Taylor, H. C., Zalis, M. E., Presley, B. K., Richardson, J. S. & Richardson, D. C. (1999). J. Mol. Biol. 285, 1711–1733. [DOI] [PubMed]
- Yamamoto, M., Hirata, K., Hikima, T., Kawano, Y. & Ueno, G. (2010). Yakugaku Zasshi, 130, 641–648. [DOI] [PubMed]
- Yonath, A. et al. (1998). Acta Cryst. A54, 945–955. [DOI] [PubMed]
Associated Data
This section collects any data citations, data availability statements, or supplementary materials included in this article.
Supplementary Materials
PDB reference: trypsin, model BT1, 4i8g
PDB reference: model BT2, 4i8h
PDB reference: model BT3, 4i8j
PDB reference: model BT4, 4i8k
PDB reference: model BT5, 4i8l
Supporting information file. DOI: 10.1107/S0907444913009050/rr5036sup1.pdf