

Abstract
Purpose
To determine the feasibility and accuracy of real time 3D echocardiography (RT3DE) in determining the dimensions and anatomical type of the patent ductus arteriosus (PDA).
Methods
The study included 42 pediatric patients with a mean age of 3.6 years (ranging from 2 months to 14 years) who were referred for elective percutaneous PDA closure. All patients underwent full 2D echocardiogram as well as RT3DE with off line analysis using Q lab software within 6 h from their angiograms. The PDA was studied as regard the anatomical type, length of the duct as well as the ampulla and the pulmonary end of the PDA. Data obtained by RT3DE was compared against 2D echocardiogram and the gold standard angiography.
Results
Offline analysis of the PDA was feasible in 97.6% of the cases while determination of the anatomical type using gated color flow 3D acquisitions was achieved in 78.5% of the cases. The pulmonary end of the duct was rather elliptical using 3D echocardiogram. There was significant difference between the pulmonary end measured by 3D echocardiogram and angiography (P < 0.001). There was no significant difference between either the length or the ampulla of the PDA measured by 3D echocardiogram and that measured by angiography (P value = 0.325 and 0.611, respectively). There was a good agreement between both 2D or 3D echocardiogram and angiography in determining the anatomical type of the PDA (K = 0.744 and 0.773, respectively). However 3D echocardiogram could more accurately determine type A and type E ductus compared to 2D echocardiogram.
Conclusion
3D echocardiogram was more accurate than 2D echocardiogram in determining the length and the ampulla of the PDA. The morphologic assessment of the PDA using gated 3D color flow was achieved in 78.5% of the patients. Nevertheless the use of 3D echocardiogram in assessment of small vascular structures like PDA in children with rapid heart rates is still of limited clinical value.
Abbreviations: 2D, two-dimensional; 3D, three-dimensional; CHD, congenital heart disease; MPR, multiplane reformatted mode; PDA, patent ductus arteriosus; RAO, right anterior oblique; RVOT, right ventricular outflow tract
Keywords: PDA, Congenital heart disease, RT3DE, Three-dimensional echocardiography
Introduction
Patent ductus arteriosus (PDA) accounts for 5–10% of all congenital heart diseases (CHD). It occurs more commonly in premature infants, where 8 out of 1000 premature infants have PDA compared to 2 out of 1000 term infants. It is more common in females with a female to male ratio of 3:1 [12].
The physiological impact and clinical significance of the PDA depend largely on its size and the underlying cardiovascular status of the patient. The PDA may be “silent” (not evident clinically but diagnosed incidentally by echocardiography performed for a different reason), small, moderate, or large [14].
In 1989 Krichenco et al. classified PDA according to its angiographic appearance into five types: type A “conical” ductus, with well-defined aortic ampulla and constriction near the pulmonary artery end. Type B, very large “window” ductus, with very short length. Type C, “tubular” ductus, which is without constrictions. Type D, “complex” ductus, which has multiple constrictions. Type E, “elongated” ductus, with the constriction remote from the anterior edge of the trachea [7].
Available treatment modalities include surgical ligation in large ducts not suitable for interventional treatment and transcatheter closure for small to moderate sized ducts whether by coil embolization or occluder devices. Accurate assessment of the size, shape and anatomical type of the PDA represents a crucial step to choosing the most suitable technique that will guarantee complete closure of the PDA without complications [6,13].
Two-dimensional (2D) echocardiography is an important diagnostic tool and is a mainstay for the diagnosis and evaluation prior to management. Cardiac catheterization is also used to revaluate the PDA prior to its percutaneous closure [14]. With the recent introduction of 3D echocardiography and its unique ability to allow real time volumetric imaging and thus improving the accuracy of evaluating the cardiac chambers, the idea of using this unique capability in interrogating extra cardiac vascular structures like the PDA to optimize the management seems appealing. In this study we sought to determine the feasibility and accuracy of real time 3D echocardiography (RT3DE) in determining the dimensions and anatomical type of the PDA and compare the data obtained with that from 2D echocardiography and the gold standard angiography.
Methods
This study was approved by our institutional review board and informed consent was obtained from the parents of all the children enrolled in the study.
This study was a prospective study which included 42 consecutive patients with PDA who were referred for elective percutaneous PDA closure. All patients were subjected to full echocardiographic study including RT3DE using an iE33 Philips machine with matrix array transducer followed by cardiac catheterization. The results obtained from 2D echocardiogram, 3D echocardiogram and angiography were blinded to each other.
Echocardiography
All patients underwent echocardiographic studies using a Philips iE33 machine (Philips Medical Systems, Andover, MA). Standard 2D echocardiogram was done for all patients enrolled in the study using phased array transducers of different frequencies tailored according to each patient’s age, body built and weight. Philips S8-3 Sector Array Transducer with a frequency range from 8 to 3 MHz was generally used for children below 3 years of age and Philips S5-1 Sector Array Transducer with a frequency range from 5 to 1 MHz was used for older children with few exceptions.
The study included 2D, M-mode and color flow Doppler from all standard echocardiographic windows (i.e. subcostal, apical, parasternal and suprasternal) applying the sequential analysis to establish the situs, AV and VA connections, great vessel relation and abnormalities, ventricular dimensions and functions, state of cardiac valves, venous connections, and any intra cardiac shunts [17].
Three views were used in the 2D echocardiogram to visualize the duct and its course; the high left parasternal long-axis scan of the pulmonary artery or the “ductal view”, the suprasternal and parasternal short-axis views (at the level of the pulmonary artery bifurcation). 2D and color flow mapping were used to evaluate the site and shape of the PDA and asses the diameter of the ampulla and the pulmonary end as well as the length of the duct. The pressure gradient across the duct was recorded using continuous wave Doppler [17].
3D echocardiography
After completing the 2D echocardiogram, all the subjects underwent full 3D study using a pediatric matrix probe X7-2 in infants and children up to 3 years of age with a frequency range from 7 to 2 MHz and an adult matrix probe X3-1 in older children with frequency range from 3 to 1 MHz. Image acquisition was adjusted in accordance with the “Practical Guide for Three Dimensional Transthoracic Echocardiography” [20]. Frame rates were generally in the range of 42 for full volume mode and 24 for 3D color mode.
Two modes of acquisition were used in this study; narrow angle live 3D imaging was first performed in all conventional 2D planes followed by ECG gated full volume acquisition. Two fixed full volumes were acquired for all patients; the suprasternal short axis and the left infraclavicular (Fig. 1).
Figure 1.
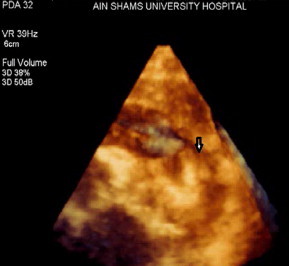
Full volume acquisition as seen from a modified parasternal short-axis view (left infraclavicular approach) showing the entrance of the PDA into the left pulmonary artery (black arrow).
Offline analysis was applied to the volume rendered data using the “QLAB” software system version 7.0 with 3DQ application. Multiplane reformatted mode (MPR) was used to delineate the PDA in three planes at the same time. Each of the three planes is represented by a line in the other two planes. This line allows moving or rotating the plane within the volume data. The point of intersection of the three lines can be moved in the three planes simultaneously to display the multiplanar projection of the PDA (Fig. 2).
Figure 2.
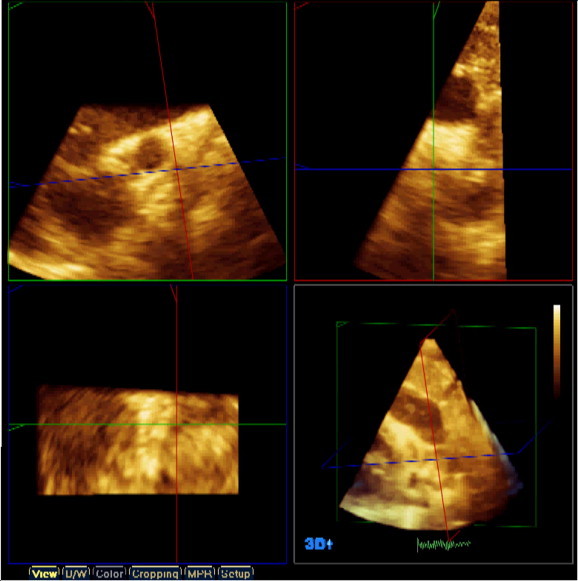
Multiplane reformatted window as seen in the QLAB offline analysis software. Three different projections are seen, the coronal (green square), the sagittal (red square) and the transverse (blue square), the pulmonary end of the duct is marked by the point of intersection of the green and red lines in the blue square.
The MPR planes were used to display the pulmonary end of the duct and measure it in two dimensions by adjusting the pulmonary end in the coronal plane and then measuring it in the transverse plane. The length of the duct as well as the diameter of the ampulla was also measured from the coronal plane.
Gated color volumes
ECG gated color acquisition was taken to assess the flow across the PDA and into the pulmonary artery. The gated color flow 3D acquisition stitches seven consecutive cycles. The color gain was changed to allow for the best display and the most flexible post-processing manipulation. PDA flow was acquired from the suprasternal long-axis view together with the aortic arch flow or from the infraclavicular view (Fig. 3A).
Figure 3.
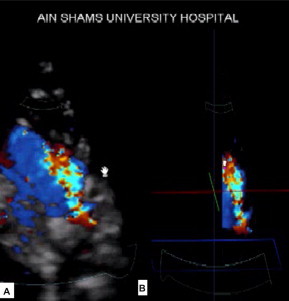
Gated color flow 3D acquisition as seen from the left infraclavicular projection (A) and after cropping and black and white suppression (B).
Gated color flow was useful in determining the shape of the duct by cropping the color flow after adjusting the color gain to get the best display. The crop box was used to crop the duct till the shape of the duct appears. Black and white suppression was also used after cropping to eliminate the surrounding tissue and thus allow better delineation of the duct through its course (Fig. 3B). Gated color flow was considered feasible if we could visualize the three main parts of the PDA; namely the ampulla, the body of the PDA and its pulmonary end as a colored filled cast by 3D color flow. The absence of any of these three parts deemed the patient not suitable for assessment (Fig. 3).
Cardiac catheterization
In all patients arterial and venous access was established using the Seldinger’s technique followed by administration of 50 IU/kg heparin.
Angiographic visualization of the duct
An angiographic catheter was positioned in the descending aorta just distal to the expected location of the PDA. The initial angiogram was taken in the lateral projection if the lateral view showed the PDA shape adequately then the measurements were taken from the lateral view and assessment of the anatomical type was determined based on the Krichenko classification [7]. However in some patients the right anterior oblique (RAO) cranial view 35–40° was needed for further evaluation of the anatomical type of the PDA.
After angiographic evaluation the pulmonary end, the aortic end and the length of the duct were measured in millimeters using the software incorporated within the cath. Lab machine. The duct was measured in lateral angiogram where the pulmonary end was measured as the narrowest part of the duct facing the pulmonary artery, the aortic end was measured as the widest part towards the aorta and the length was measured as a line from the midpoint of the pulmonary end till the midpoint of the ampulla.
Statistical analysis
Data were coded and analyzed using the SPSS program version 18.0 (Statistical Package for Social Sciences). Qualitative data were presented using the frequency and its related percentage, while quantitative data were presented using the mean and standard deviation. Changes in continuous variables were evaluated using the paired t-test. A P-value of <0.05 was chosen as the level of significance. Inter-rater agreement was used to evaluate the agreement between the anatomical types of the PDA determined by either 2D or 3D echocardiography and the gold standard angiogram. Agreement is quantified using Kappa (K). K is 1 when there is perfect agreement between the anatomical types determined by echocardiogram and the gold standard angiography; K is 0 when there is no agreement better than chance between the two methods.
Results
The study included 42 pediatric patients with PDA, 11 males (26%) and 31 females (73%), with a mean age of 3.7 ± 3.6 years (range 2 months to 14 years). Of these patients, 41 (97.6%) had isolated PDA and 1 patient had PDA and VSD (2.3%). The heart rate of the patients had a mean of 113 ± 23.6 beats per minute, the weight of the patients ranged from 6 to 55 kg with a mean of 15 ± 10.8 kg, and the body surface area was 0.7 ± 0.4 m2.
2D echocardiography data
Only two patients (4.7%) had dilated LV dimensions for age, but all patients had normal LV global systolic function with normal fractional shortening and ejection fraction as measured by applying the M-mode at the level of the LV-papillary muscles in the standard parasternal short-axis view using the Teichholtz formula [8]. Table 1 illustrates the data measured by 2D echocardiogram.
Table 1.
2D echocardiographic data of the study group.
| Range | Mean ± SD | |
|---|---|---|
| LV EDD (mm) | 16.0–57.0 | 32.1 ± 8.6 |
| LV ESD (mm) | 8.0–39.0 | 20.1 ± 6.4 |
| IVS (mm) | 3.0–8.0 | 4.5 ± 1.2 |
| FS (%) | 25.0–48.0 | 35.8 ± 5.9 |
| EF (%) | 55.0–80.0 | 67.95 ± 7.55 |
| Gradient (mmHg) | 17.0–130.0 | 73.2 ± 22.7 |
| PDA Pulmonary end (mm) | 1.3–4 | 2.4 ± 0.7 |
| PDA ampulla (mm) | 4–11 | 7.12 ± 1.5 |
| Length of the PDA (mm) | 4–11 | 7.1 ± 1.75 |
LV EDD: left ventricle end diastolic dimension, LV ESD: left ventricle end systolic dimension, IVS: inter ventricular septum, FS: fractional shortening, EF: ejection fraction, PDA: patent ductus arteriosus.
The shape of the duct was then evaluated to determine its anatomical type by 2D echocardiography; 24 cases were type A (57%), 1 case was type B (2.3%), 3 cases were type C (7%), 1 case was type D (2.3%) and 13 cases were type E (30%) (Fig. 4).
Figure 4.
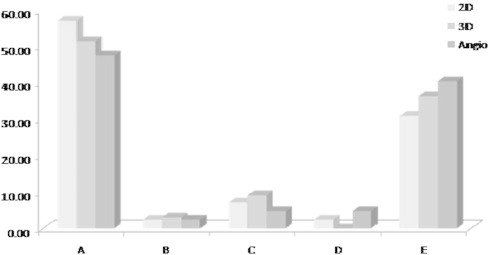
Distribution of the anatomical types of the PDA by 2D, 3D echocardiography and angiography.
3D echocardiography data
Among the 42 patients initially enrolled in the study, 41(97.6%) were successfully assessed using the “QLAB” software while one patient was excluded due to poor image quality. In the 41 patients who were suitable for offline analysis the following measurements were obtained:
The pulmonary end had a mean of 1.8 ± 0.5 mm with a range of 1.1–3.4 mm. The aortic end ranged from 3.4 to 11 mm with a mean of 7.7 ± 1.4 mm and the length of the duct had a mean 7.6 ± 1.8 with a range of 2.8–10 mm.
We were able to assess the anatomical type of the duct by gated color flow and black and white suppression in 33 cases (78.5%) while the anatomical type of the remaining 9 (21.5%) cases could not be assessed utilizing this technique due to the presence of gaps in the color cast obtained by gated 3D color flow mapping.
Out of the 33 cases that were possibly analyzed using gated color flow 3D echocardiography with black and white suppression; 17 were type A (51.5%), 1 case was type B (3%), 3 cases were type C (9%) and 12 cases were type E (36.3%) and none of the ducts was type D (Fig. 4).
Angiographic data
The pulmonary end of the duct, the ampulla and the entire length of the duct for each patient were measured in the lateral aortogram. The pulmonary end of the duct ranged from 1 to 4.1 mm (mean 2.3 ± 0.8 mm), the ampulla was in the range of 2–12 mm (mean 7.5 ± 2.1 mm) and the length ranged from 2.6 to 12.9 mm (mean 7.8 ± 2.4 mm).
The lateral view was first used and adequately visualized the duct in 18 cases (42.8%); however, in the remaining 24 cases (57.1%) the RAO cranial view was necessary to confirm the anatomical type of the duct. The angiographically determined anatomical types were: type A (n = 20, 47.6%), type B (n = 1, 2.3%), type C (n = 2, 4.7%), type D (n = 2, 4.7%) and type E (n = 17, 40.4%) (Fig. 4).
Comparison between the pulmonary end measured by 2D, 3D echocardiography and angiography
Paired t-test was used to compare the pulmonary end measured by the three modalities. There was no significant difference between the pulmonary end measured by 2D echocardiography and that measured by angiography (P = 0.2). There was a significant difference between the dimensions measured by 3D echocardiography and the pulmonary end measured by angiography (P < 0.001) (Table 2).
Table 2.
Comparison between the 2D, 3D echocardiography and angiography regarding the pulmonary end of the duct.
| PDA pulmonary end (in mm) |
||||
|---|---|---|---|---|
| Range | Mean ± SD | Paired test |
||
| t | P-value | |||
| Angiography | 1.00–4.10 | 2.3 ± 0.8 | ||
| 2D | 1.30–4.00 | 2.35 ± 0.7 | 1.07 | 0.289 |
| 3D (narrowest) | 1.10–3.40 | 1.8 ± 0.5 | −3.83 | <0.001 |
| 3D (widest) | 1.6–4.5 | 2.6 ± 0.7 | 3.62 | <0.001 |
Comparison between the ampulla measured by 2D, 3D echocardiography and angiography
The ampulla measured by 2D echocardiography had a mean of 7.12 ± 1.5 mm, while that measured by 3D echocardiography had a mean of 7.7 ± 1.4 mm. Both measurements compared favorably with the gold standard measurement by angiography which had a mean of 7.55 ± 2.1 mm. There was no significant difference between the 3D measurement and that by angiography (P = 0.6); however, there was a tendency toward under-estimation of the aortic end by 2D echocardiography compared to that measured by angiography (P = 0.047).
Comparison between 2D, 3D echocardiography and angiography regarding the length of the duct
The length of the duct measured by 2D echocardiography had a mean of 7.1 ± 1.7 mm, while that measured by 3D echocardiography had a mean of 7.6 ± 1.8 mm. The 3D echocardiography measurement of the PDA length compared favorably with its measurement by angiography which had a mean of 7.8 ± 2.3 mm. (P = 0.3). However there was a significant under-estimation of the PDA length by 2D echocardiography compared to its measurement by angiography (P = 0.004).
Comparison between 2D, 3D echocardiography and angiography regarding the PDA anatomical type
The anatomical types of the PDA determined by either 2D or 3D echocardiography were compared against the gold standard angiography. Table 3 shows the different PDA anatomical types as determined by each modality. There was a tendency to over-diagnose type A ducts using 2D echocardiography compared to angiography (57.14% versus 47.62%). This over-diagnosis improved after using 3D echocardiography (51.52% versus 47.62%). There was also a tendency to under-diagnose type E duct using 2D echocardiography compared to angiography (30.95% versus 40.48%). This under-diagnosis also improved after using 3D echocardiography (36.36% versus 40.48%).
Table 3.
Distribution of the anatomical types of the PDA by 2D, 3D echocardiography and angiography.
| Type | 2D |
3D |
Angio |
|||
|---|---|---|---|---|---|---|
| N | % | N | % | N | % | |
| A | 24 | 57.14 | 17 | 51.52 | 20 | 47.62 |
| B | 1 | 2.38 | 1 | 3.03 | 1 | 2.38 |
| C | 3 | 7.14 | 3 | 9.09 | 2 | 4.76 |
| D | 1 | 2.38 | 0 | 0.00 | 2 | 4.76 |
| E | 13 | 30.95 | 12 | 36.36 | 17 | 40.48 |
| Total | 42 | 100.00 | 33 | 100.00 | 42 | 100.00 |
Nevertheless, the inter-rater agreement (K) between either 2D or 3D echocardiographic determination of the anatomical type of the PDA and that of catheterization was comparable. Both methods showed good agreement with the gold standard angiograms. The inter-rater agreement of 2D echocardiography was 0.744 (standard error of 0.097 and 95% CI 0.553–0.935) versus 0.773 (standard error of 0.096 and 95% CI 0.586–0.961) for 3D echocardiogram (Fig. 5 and 6).
Figure 5.
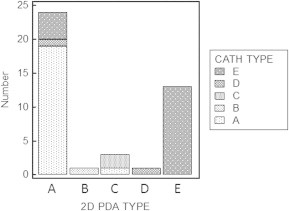
Comparison between the anatomical types of the PDA as determined by 2D echocardiogram versus the gold standard angiography.
Figure 6.
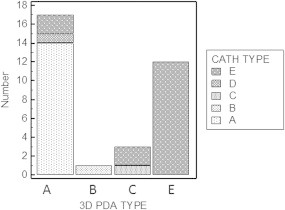
Comparison between the anatomical types of the PDA as determined by 3D echocardiogram versus the gold standard angiography.
Discussion
Echocardiography has evolved into the most predominant diagnostic imaging technique in cardiology. Over the last five decades the diagnostic capability of echocardiography has increased dramatically from M-mode to 2D imaging. Recent advances in ultrasound instrumentation and computer technology has led to the evolution of 3D echocardiography, introducing a new era in cardiovascular imaging [18].
3D echocardiography is still in its evolution and at the phase of early adaptation with respect to its clinical application. It should complement current echocardiographic techniques by providing better understanding of the topographical aspects of pathology and refined definition of the spatial relationships of (intra)cardiac structures [18].
The use of RT3DE in CHD was discussed in several studies with a documented role in assessment of septal defects [3,11]. The present study was designed to assess the value of RT3DE in the evaluation of PDA regarding the anatomical type of the duct and its measurements. The first published report of 3D echocardiographic evaluation of a PDA was that of Sinha et al. in 2004. The authors studied a 24-year-old female where 2D echocardiography was used to reveal the PDA, but the length, shape, size of the duct and its attachment to the pulmonary and descending thoracic aorta could not be evaluated and therefore 3D echocardiography was performed using a Philips Sonos Ultrasound System with TomTec software offline analysis. In this report the images were cropped using the crop box and the color flow was used to delineate the anatomical type of the duct similar to the current study.
Vazquez-Antona et al. back in 2006 published an abstract titled “Three-dimensional echocardiography in evaluation of PDA before and after percutaneous closure”. However the authors of this study stated that the purpose of their study was to assess the ability of 3D echocardiography to accurately view the anatomic details of patients with PDA. They studied 21 patients, and of these 11 had 3D echocardiography actually done after percutaneous closure to assess the spatial relation of the device to the surrounding anatomic structures. In 10 patients the size and morphology of the duct was compared between 2D and 3D echocardiography prior to closure. However the authors did not include any comparative details between the two methods and reviewing the literature showed that this study never materialized into a full text article to be discussed in details [19]. In comparison, the current study included 42 patients for which detailed measurements was taken by 2D and 3D echocardiography and the measurements were compared to the gold standard angiograms.
In 2008, Bharucha and colleagues examined 300 cases with congenital cardiac malformations and found that 3D echocardiography; mainly the MPR mode, was of great use and changed the management plane in 32 cases. However there were no PDA cases in that study [2].
In the current study the MPR mode was used in all the feasible cases (41 cases were feasibly assessed by QLAB out of 42 cases) where after the duct was adequately visualized from the suprasternal short axis or the left infraclavicular view the MPR mode was used to measure the pulmonary end of the duct in two dimensions (minor and major). The shape of the pulmonary end was found to be elliptical rather than rounded and the two dimensions measured differed from those measured by 2D echocardiography or angiography. We postulate that 3D echocardiography might be measuring the pulmonary end from a different angle than that measured by angiography and 2D echocardiography.
Anwar and colleagues studied the right ventricular outflow tract (RVOT) and the pulmonary valve in 50 adult cases. They compared the measurement of RVOT diameter and the PV annulus using both 2D and 3D echocardiography. In accordance to our results, the authors concluded that the RVOT was oval not circular, 2D diameters were underestimated and smaller than 3D diameters which mean they were tangential rather than true cut sections [1].
In the current study the aortic end of the duct measured by 3D guided method was better than 2D echocardiography when both were compared with the gold standard angiography. The length of the duct was also measured in a 3D guided MPR mode and had better agreement with angiography than the classic 2D echocardiogram measurements. We postulate that the third dimension and the ability of 3D echocardiography to determine the depth of anatomic structures improved assessment of the length of the PDA compared to 2D echocardiogram.
The anatomical type of the duct was determined using 3D gated color flow across the PDA followed by black and white suppression. The shape of the duct appeared after cropping of the image as a colored cast that resembles more or less a 3D angiographic display of the duct. When feasible 3D echocardiography color flow mapping provided excellent angiographic display of full extent of the PDA flow from the aortic to the pulmonary ends. Moreover, with rotation of the volume, different views of the duct can be displayed simulating the lateral and RAO angiographic views that allowed better understanding of the ductal morphology. The anatomical type of the duct was determined according to Krichenko classification [7] (Fig. 7).
Figure 7.
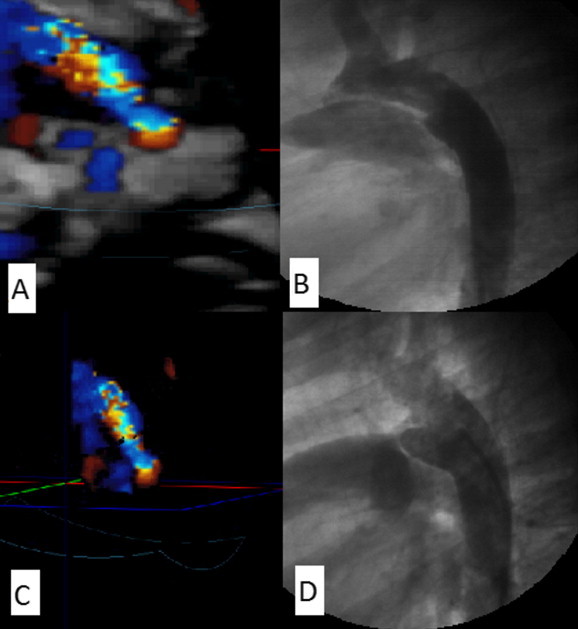
Comparison between 3D color flow imaging to determine the anatomical type of the PDA (left side) and the corresponding anatomical type of the same patient(s) as determined by angiogram (right side), (A and B) type A ductus of the same patient as determined by 3D color flow echocardiogram and angiography, respectively. (C and D) Type E ductus of another patient as determined by 3D color flow echocardiogram with black and white suppression and angiography, respectively.
Our technique of gated 3D color flow with black and white suppression was adopted from the technique used by Mallek et al. who studied the “Angiographic visualization of MBT shunts by 3D echocardiogram” and stated that surgical shunts were by far better visualized using the gated 3D color volumes from origin to insertion into the pulmonary tree with demonstration of the whole extent of the shunt in one image compared to 2D echocardiography [9].
Seliem et al. [15] studied RT3DE imaging of CHD using matrix-array technology in 70 patients. The morphology of the blood flow in the blood vessels (e.g., branch pulmonary arteries, ductus arteriosus, surgical shunts, and aorta) was studied in only five of these patients and yielded color flow echocardiographic angiograms that could be rotated 360° and inspected from different angles.
In the study by Del Pasqua and colleagues both full volumes and gated 3D color volumes provided the diagnosis in 3 cases with extra cardiac anomalies (aberrant left subclavian artery in right sided arch with a ductus arising from Kommerel’s diverticulum, tortuous right PDA in a left sided arch and an aberrant right subclavian artery in a left aortic arch) [5].
There was a good agreement between either 2D or 3D echocardiography and angiography in the determination of the anatomical type of the PDA. However when the study group was examined on individual bases 3D echocardiography did improve the diagnosis in both type A and E ductus.
This can be explained by the nature of type A duct which is short and conical, while type E is elongated and also conical and thus might be mistaken as type A by 2D echocardiography which lacks the depth and the third dimension.
Type C ductus was over-diagnosed by both 2D and 3D echocardiography. This might be due to the tubular nature of type C which lacks a constriction which makes angiography more accurate than echocardiography as the color flow might mask a constriction due to inadequate color flow gains. There were two type D ducts according to angiography where 2D echocardiography detected one of them and 3D echocardiography could not detect any of them this can be explained by the complex nature of type D (with multiple constrictions) which will make echocardiographic diagnosis more challenging.
Study limitations
RT3DE is a relatively new technology, the full potential of which has not been entirely defined especially in the pediatric population, where improved understanding of complex structural CHD by noninvasive imaging is most rewarding.
Despite the advances in 3D echocardiographic techniques, there are challenges which remain. The resolution of the current matrix probes does not quite match those of conventional ultrasound probes, although the development of higher frequency probes for pediatric use has been a major advance.
Acquisition of the volumetric dataset still has to be performed over several cardiac cycles so that the problem of movement or respiratory motion artifact remains. The basic physics of ultrasound is not altered by the acquisition of a 3D dataset, so that the technique remains dependent on cross sectional image quality; i.e. the quality of any 3D echocardiographic study is actually dependant on the quality of the original 2D images from which these 3D data sets are generated.
The frame rates achievable on 3D echocardiography have improved recently but remain lower than those obtained using conventional cross-sectional probes in most of the cases. This remains a problem for fast moving structures especially in children with rapid heart rates.
Several studies have been performed to analyze the usefulness of RT3DE in CHD. Very limited data is available on RT3DE for imaging the PDA [16,10,4]. Further studies are certainly welcome and needed to define the RT3DE use with the highest benefit/cost yield. Ideally, RT3DE should prove to either:
-
a.
Add reliable new information.
-
b.
Be able to replace or meaningfully complement other imaging modalities at no additional cost (financial, manpower, or time).
-
c.
Change either management strategy or outcome.
Conclusions
3D echocardiogram was more accurate than 2D echocardiogram in determining the length and the ampulla of the PDA. The study clarified the role of RT3DE for anatomic description of the PDA using gated 3D color flow which was achieved in 78.5% of the study population. Nevertheless the use of 3D echocardiogram in the setting of pediatric patients with rapid heart rates and small vascular structures like the PDA could not provide major advantage over the standard 2D echocardiogram and angiography from the clinical point of view. The ongoing development in the field of 3D echocardiography should overcome the shortcomings shown in this study and have its impact on the accurate assessment and selection of the management strategies for extra cardiac vascular structures in the near future.
Conflict of Interest
The authors have no conflict of interest to declare.
Acknowledgements
The authors of this work would like to express their appreciation for all members of the congenital and structural heart disease unit in the Cardiology Department of Ain Shams University, Cairo, Egypt, who provide care for all the Egyptian children with CHD in a professional and dedicated manner. The authors would also like to point out that no grants were submitted to complete this work and no relationship with industry exists for any of the authors of this article.
Footnotes
Peer review under responsibility of King Saud University.

References
- 1.Anwar A.M., Soliman O., Van den Bosch A.E., McGhie J.S., Geleijnse M.L., Ten Cate F.J. Assessment of pulmonary valve and right ventricular outflow tract with real-time three-dimensional echocardiography. Int J Cardiovasc Imaging. 2007;23(2):167–175. doi: 10.1007/s10554-006-9142-3. [DOI] [PubMed] [Google Scholar]
- 2.Bharucha T., Roman K.S., Anderson R.H., Vettukattil J.J. Impact of multiplanar review of three-dimensional echocardiographic data on management of congenital heart disease. Ann Thorac Surg. 2008;86:875–881. doi: 10.1016/j.athoracsur.2008.04.106. [DOI] [PubMed] [Google Scholar]
- 3.Cheng T.O., Xie M.X., Wang X.F., Wang Y., Lu Q. Real-time three-dimensional echocardiography in assessing atrial and ventricular septal defects: an echocardiographic–surgical correlative study. Am Heart J. 2004;148:1091–1095. doi: 10.1016/j.ahj.2004.05.050. [DOI] [PubMed] [Google Scholar]
- 4.Chuang Y.C., Yin W.H., Hsiung M.C., Tsai S.K., Lee K.C., Huang H.J. Successful transcatheter closure of a residual PDA with complex anatomy after surgical ligation using an amplatzer ductal occluder guided by live 3D transesophageal echocardiography. Echocardiography. 2011;28(5):e101–e103. doi: 10.1111/j.1540-8175.2010.01343.x. [DOI] [PubMed] [Google Scholar]
- 5.Del Pasqua A., Sanders S.P., de Zorzi A., Toscano A., Iacobelli R., Pierli C. Impact of three-dimensional echocardiography in complex congenital heart defect cases: the surgical view. Pediatr Cardiol. 2009;30(3):293–300. doi: 10.1007/s00246-008-9348-3. [DOI] [PubMed] [Google Scholar]
- 6.Galal O., Nehgme R., Al-Fadley A., DeMoor M., Abbag F.I., Al-Oufi S.H. The role of surgical ligation of patent ductus arteriosus in the era of the Rashkind device. Ann Thorac Surg. 1997;63:434–437. doi: 10.1016/s0003-4975(96)00962-9. [DOI] [PubMed] [Google Scholar]
- 7.Krichenko A., Benson L.N., Burrows P., Moes C.A., McLaughlin P., Freedon R.M. Angiographic classification of the isolated, persistently patent ductus arteriosus and implications for percutaneous catheter occlusion. Am J Cardiol. 1989;63:877–879. doi: 10.1016/0002-9149(89)90064-7. [DOI] [PubMed] [Google Scholar]
- 8.Lang R.M., Bierig M., Devereux R.B., Flachskampf F.A., Foster E., Pellikka P.A. Recommendations for chamber quantification: a report from the American Society of Echocardiography’s Guidelines and Standards Committee and the Chamber Quantification Writing Group, developed in conjunction with the European Association of Echocardiography, a branch of the European Society of Cardiology. J Am Soc Echocardiogr. 2005;18(12):1440–1463. doi: 10.1016/j.echo.2005.10.005. [DOI] [PubMed] [Google Scholar]
- 9.Mallek KZ, El Sayed MH, El Fiky AA, El Shahed GS, Attia HM, Roushdy AM. Angiographic visualization of modified BT shunts by 3D echocardiogram. Eur J Echocardiogr 2009;10(Suppl. 2):ii116–45 [P845].
- 10.Marek T., Zelizko M., Kautzner J. RT3D transesophageal echocardiography imaging: adult PDA before and after transcatheter closure. Circulation. 2009;120:e92–e93. doi: 10.1161/CIRCULATIONAHA.109.867093. [DOI] [PubMed] [Google Scholar]
- 11.Monte I., Grasso S., Licciardi S., Badano L.P. Head-to-head comparison of real-time three-dimensional transthoracic echocardiography with transthoracic and transesophageal two-dimensional contrast echocardiography for the detection of patent foramen ovale. Eur J Echocardiogr. 2010;11(3):245–249. doi: 10.1093/ejechocard/jep195. [DOI] [PubMed] [Google Scholar]
- 12.Moore P, Brook MM, Heymann MA. Patent ductus arterious. In: Allen HD, Gutgesell HP, Clark EB, et al., editors. Moss and Adam’s heart disease in infants, children and adolescents including the fetus and young adult. 6th ed. Philadelphia, USA: Lippincott Williams and Wilkins; 2001. p. 653–69.
- 13.Rao PS. Summary and comparison of patent ductus arteriosus closure methods. In: Rao PS, Kern MJ, editors. Catheter based devices for the treatment of non-coronary cardiovascular disease in adults and children. Philadelphia, PA, USA: Lippincott Williams & Wilkins; 2003. p. 219–28.
- 14.Schneider D.J., Moore J.W. Congenital heart disease for the adult cardiologist: patent ductus arteriosus. Circulation. 2006;114(17):1873–1882. doi: 10.1161/CIRCULATIONAHA.105.592063. [DOI] [PubMed] [Google Scholar]
- 15.Seliem M.A., Fedec A., Cohen M.S., Ewing S., Farrell P.E., Jr., Rychik J. Real-time 3-dimensional echocardiographic imaging of congenital heart disease using matrix-array technology: freehand real-time scanning adds instant morphologic details not well delineated by conventional 2-dimensional imaging. J Am Soc Echocardiogr. 2006;19:121–129. doi: 10.1016/j.echo.2005.09.009. [DOI] [PubMed] [Google Scholar]
- 16.Sinha A., Nanda N.C., Khanna D., Ilgenli F., Sidhu M., Lloyd S.G. Live three-dimensional transthoracic echocardiographic delineation of patent ductus arteriosus. Echocardiography. 2004;21(5):443–448. doi: 10.1111/j.0742-2822.2004.04002.x. [DOI] [PubMed] [Google Scholar]
- 17.Snider A, Serwer G, Ritter S. Echocardiography in pediatric heart disease. 2nd ed. St. Louis, MO, USA: Mosby; 1997. p. 452–9.
- 18.Valocik G., Kamp O., Visser C.A. Three-dimensional echocardiography in mitral valve disease. Eur J Echocardiogr. 2005;6:443–454. doi: 10.1016/j.euje.2005.02.007. [DOI] [PubMed] [Google Scholar]
- 19.Vazquez-Antona C.A., Erdmenger J.R., Viesca-Lobaton R. Three-dimensional (3D) echocardiography in evaluation of PDA before and after percutaneous closure. Eur J Echocardiogr. 2006;7(Suppl. 1):S146–S147. [Google Scholar]
- 20.Yang H.S., Bansal R.C., Mookadam F., Khandheria B.K., Tajik A.J., Chandrasekaran K. Practical guide for three-dimensional transthoracic echocardiography using a fully sampled matrix array transducer. J Am Soc Echocardiogr. 2008;21:979–989. doi: 10.1016/j.echo.2008.06.011. [DOI] [PubMed] [Google Scholar]