

Abstract
Objectives. We examined the pattern of the passage of smoking laws across venues (government and private workplaces, restaurants, bars) and by strength (no law to 100% smoke-free).
Methods. We conducted transition analyses of local and state smoking restrictions passed between 1970 and 2009, with data from the Americans for Nonsmokers’ Rights Ordinance Database.
Results. Each decade, more laws were enacted, from 18 passed in the 1970s to 3172 in the first decade of this century, when 91% of existing state laws were passed. Most laws passed took states and localities from no law to some level of smoking restriction, and most new local (77%; 5148/6648) and state (73%; 115/158) laws passed in the study period did not change strength.
Conclusions. Because these laws are “sticky”—once a law has passed, strength of the law and venues covered do not change often—policymakers and advocates should focus on passing strong laws the first time, rather than settling for less comprehensive laws with the hope of improving them in the future.
Enactment of strong laws that end smoking in restaurants, workplaces, and bars is followed by reduced cardiovascular and pulmonary morbidity and mortality,1–4 reduced tobacco consumption,5,6 and voluntary smoke-free home rules.7 The 2006 surgeon general’s report The Health Effects of Involuntary Exposure to Tobacco Smoke summarized a large body of evidence about the qualitative aspects of cultural norm change, political, and advocacy processes behind enacting smoking laws, including state preemption of local authority and key historical events related to tobacco control and public understanding of the dangers of secondhand smoke.8 Despite the extensive literature on the social and political processes that have led to enactment of smoking restriction laws,8–22 no study has quantitatively examined the pattern of the passage of smoking laws by venue (e.g., whether private workplace laws are passed before or simultaneously with restaurant laws) or by strength within venue (e.g., whether a bar law goes from having partial coverage to 100% coverage). Such a quantitative examination is important because the pattern of the passage of smoking restriction laws in general (at any level of strength) provides a measure of how communities address a known health issue (secondhand smoke) with population-level interventions.
The pattern of passage of smoking laws describes the evolution of laws (often culminating in 100% smoke-free laws) that provide population-level protection from secondhand smoke and smoking-related diseases. Moreover, understanding which venues are covered by smoking laws is important because advocates need to know what has been successful in other localities in order to most effectively influence policy. Specifically, if communities successfully enact workplace, then restaurant, and then bar laws, advocates can engage in an incremental policymaking process, extending coverage by venue, beginning with the least controversial (government workplaces) and building toward the most difficult (bars).23–25 However, if communities enact smoking laws only once or rarely, then it is important to create as strong a policy package as possible. In the latter case, advocates might consider opposing a weak proposed law, because the likelihood of strengthening weak laws or passing additional laws would be low. Finally, it is important to understand how patterns of lawmaking vary at the state and local levels, so that advocates can adjust their strategies accordingly.
To understand in what order states and localities regulate indoor smoking by venue and whether they adopt stronger laws over time, we used transition analyses to examine the venue pattern and strength of smoking laws passed between 1970 and 2009.
METHODS
We used the American Nonsmokers’ Rights Foundation (ANRF) Local Ordinance Database,26 a compilation of tobacco control laws and Board of Health regulations restricting indoor smoking by venue and jurisdiction (state, county, or local place) across time. We defined places as cities, towns, and minor civil divisions (incorporated or unincorporated subcounty places). We collapsed county and place data into a single local category because advocacy and policymaking processes are similar in counties and places but different from state-level processes. We thus had 2 categories: state and local. (For the purpose of our study, we defined the District of Columbia as a local municipality.) Board of health regulations were also considered to be local laws.11
We analyzed 4 venues: restaurants, bars, government workplaces, and private (nongovernment) workplaces. As described in detail elsewhere,27 ANRF analysts coded the strength of each law into 5 categories: 100% smoke-free, qualified (some exceptions, e.g., a separate smoking room for bars), moderate (some coverage but with more exceptions), weak, and no coverage.
Transition Analysis
Transition analysis tracks and compares the transitions that take place between a finite number of possible states over a given period.28 In this analysis, the 2 states we examined were number of venues covered and strength of law. We compared the strength of the law and number of venues covered by laws at the start and end of the periods to see whether any transitions in strength or venue had taken place. We conducted 3 transition analyses. Our unit of analysis was state or locality. Our time periods were decades. We chose decades because we wanted to capture a meaningful number of changes over our study period, and the total number of smoking restriction laws passed per year was low, especially before 1990. We therefore examined transitions in the coverage of types of venues and law strength by decade for the first 2 analyses. For the final analysis we examined whether any change had taken place between the first law passed in each state or locality for each venue and the law for the same jurisdiction and venue in 2009.
We coded the legislation in the ANRF database to account for the fact that a single piece of legislation often covered multiple venues. We coded such a law once for each venue (i.e., a single piece of legislation covering restaurants and bars was counted as 2 laws, once for restaurants and once for bars). ANRF reports a law as changed any time it is amended, regardless of whether the change relates to strength or extent of smoking restrictions. For example, laws that contained tax provisions were reported as changed by ANRF when the tax rate was changed as well as when amendments did not change strength but closed small loopholes in already covered venues. We did not consider such amendments in our analysis. The first recorded smoking restriction law in the ANRF database passed in 1936, and the data set we obtained went through February 6, 2012. Our analysis comprised 13 529 laws enacted across the 4 venues between 1970 and 2009. We excluded 14 laws enacted in 1969 or earlier and 1251 laws enacted or amended in 2010 or later, as well as 54 laws for which ANRF did not have the enactment date.
The first transition analysis examined how frequently laws were passed by strength and by venue. We divided the data by decade (1970–1979, 1980–1989, 1990–1999, and 2000–2009) and compared laws at the beginning and end of each decade to see whether they changed in strength. We categorized passage of a new law or a change in strength as a transition (or as a law passage) and calculated transitions separately for each venue.
Our second analysis compared the number of venues covered by smoking laws at the beginning and end of each decade. We categorized repeal of a law as a transition. By contrast with our first analysis, which focused on laws passed in each of the 4 venues, the second analysis investigated whether the number of venues covered by laws changed between the first and last law passed during the decade for each place in the data set. We classified a change in venue or a change in the strength of the law for an existing venue as a transition.
In our third analysis, we examined whether smoking laws transitioned in strength (became stronger or weaker or were repealed) between the passage of the first law and the final law during the entire study period (1970–2009). We did not include transitions between the first and last law strength in this analysis.
Finally, to detect trends after the study period, we examined transitions in 2010 to 2013 in the ANRF data.
RESULTS
We conducted 3 analyses: (1) the frequency of changes in smoking restriction law strength by decade, (2) changes in the number of venues covered by smoking restriction laws by decade, and (3) transitions between levels of strengths of law between the first law passed and 2009. We found that local governments enacted government workplace smoking restriction laws beginning in the 1990s, then expanded into other venues (Figure 1). Most states first passed 100% smoke-free laws for each venue after the turn of the century, and the passage of 100% smoke-free laws for the 4 venues closely mirrored each other in time (Figure 1).
FIGURE 1—
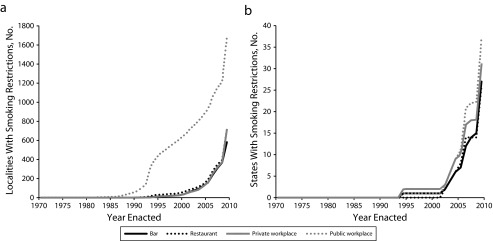
Cumulative frequency of adoption of 100% smoke-free laws at the (a) state level and (b) local level: Americans for Nonsmokers’ Rights Ordinance Database, 1970–2009.
Number of Smoking Laws by Venue and Strength by Decade
Local.
Early local laws (1970–1989) tended to be weak (500/1277) or moderate (722/1277; Table 1). Between 1990 and 1999, the strength of local laws varied by venue. About half (725/1373) the government workplace laws mandated 100% smoke-free facilities; the next-largest group comprised weak laws (385/1373). For private workplaces, we observed no strength category predominating. Among the restaurant laws, 39% (265/687) were qualified, and 45% (309/687) were moderate. Only 48 bar laws passed between 1990 and 1999, of which 14 were smoke-free; the rest were of moderate strength.
TABLE 1—
Enacted Local and State Indoor Smoking Laws: Americans for Nonsmokers’ Rights Ordinance Database, 1970–2009
| Local Level |
State Level |
|||||||
| Strength of Law | 1970–1979, No. | 1980–1989, No. | 1990–1999, No. | 2000–2009, No. | 1970–1979, No. | 1980–1989, No. | 1990–1999, No. | 2000–2009, No. |
| Government workplaces | ||||||||
| Weak | 2 | 250 | 385 | 88 | 1 | 8 | 7 | 1 |
| Moderate | 0 | 160 | 169 | 35 | 0 | 0 | 1 | 1 |
| Qualified | 0 | 1 | 94 | 70 | 0 | 0 | 1 | 3 |
| Smoke-free | 1 | 49 | 725 | 923 | 0 | 0 | 2 | 35 |
| Total | 3 | 460 | 1373 | 1116 | 1 | 8 | 11 | 40 |
| Private workplaces | ||||||||
| Weak | 1 | 187 | 190 | 89 | 1 | 5 | 4 | 2 |
| Moderate | 0 | 156 | 115 | 43 | 0 | 0 | 0 | 1 |
| Qualified | 0 | 0 | 100 | 86 | 0 | 0 | 1 | 5 |
| Smoke-free | 0 | 0 | 118 | 605 | 0 | 0 | 0 | 26 |
| Total | 1 | 343 | 523 | 823 | 1 | 5 | 5 | 34 |
| Restaurants | ||||||||
| Weak | 0 | 60 | 42 | 22 | 0 | 3 | 0 | 0 |
| Moderate | 15 | 387 | 309 | 133 | 2 | 5 | 6 | 5 |
| Qualified | 0 | 4 | 265 | 214 | 0 | 0 | 2 | 4 |
| Smoke-free | 0 | 0 | 71 | 650 | 0 | 0 | 2 | 29 |
| Total | 15 | 451 | 687 | 1019 | 2 | 8 | 10 | 38 |
| Bars | ||||||||
| Weak | 0 | 0 | 0 | 0 | 0 | 0 | 0 | 0 |
| Moderate | 0 | 4 | 34 | 58 | 0 | 1 | 1 | 5 |
| Qualified | 0 | 0 | 0 | 2 | 0 | 0 | 0 | 0 |
| Smoke-free | 0 | 0 | 14 | 154 | 0 | 0 | 1 | 26 |
| Total | 0 | 4 | 48 | 214 | 0 | 1 | 2 | 31 |
Note. We measured strength of laws on a spectrum from partial coverage in a venue (weaker) to requiring the venue to be 100% smoke-free (strongest).
Between 2000 and 2009, 100% smoke-free laws predominated: 83% (923/1116) of government workplace laws, 74% (605/823) of private workplace laws, 64% (650/1019) of restaurant laws, and 72% (154/214) of bar laws.
State.
Few state smoking laws were passed before 2000 (Table 1). Between 1970 and 1989 the 26 state laws were weak (18) or moderate (8). Between 1990 and 1999, most laws were weak (11/28) or moderate (8/28), although some qualified (4/28) and smoke-free (5/28) laws passed. By contrast, in 2000 to 2009, 81% (116/143) of state laws passed were 100% smoke-free (35/40 government workplace laws, 26/34 private workplace laws, 29/38 restaurant laws, and 26/31 bar laws).
Downgrades or repeals.
We counted a downgrade or repeal as a decrease in the strength of a smoking law. From 1970 to 1989 no local or county laws were downgraded or repealed (Table A, available as a supplement to the online version of this article at http://www.ajph.org). However, between 1990 and 2009, 149 of 5952 local laws were downgraded or repealed across the 4 venues; 145 of these had been 100% smoke-free (31 government workplace, 32 private workplace, 52 restaurant, and 14 bar laws). Only 2 state laws (1 restaurant and 1 bar law) were repealed or downgraded between 1970 and 2009, both in South Dakota (Table A); these venues were regulated in 1999, repealed (bars) or downgraded (restaurants) in 2002, and made 100% smoke-free in 2009.
Sequence of Passage Over Time
Local.
Consistent with the analysis of the total number of laws passed over time, the detailed analysis of law sequencing showed that the passage of local laws accelerated over time. Most local smoking laws in the study period were enacted in localities with no existing law (2484/5024). When local laws passed between 1970 and 1979 they almost always (94%; 17/18) included restaurant coverage (Table 2). Although over time restaurant law coverage continued to be important at the local level, between 1980 and 1999 the most common shift was from no law at all to government workplace laws (33%; 773/2366) and from no law to laws simultaneously covering government workplaces, private workplaces, and restaurants (24%; 563/2366). Between 1990 and 1999, many places were covered by only a government workplace law (46%; 813/1776). Among places that passed only government workplace laws in the 1990s, 19% (156/818) changed the strength of their government workplace law. In places that had laws for government workplaces, private workplaces, and restaurants in the 1990s, the majority (294/327) changed the strength of at least 1 of these laws. Between 2000 and 2009, 31% (808/2640) of smoking laws were enacted in places with no previous law. Most of these covered all 4 venues or only government workplaces (both, n = 268). In addition, between 2000 and 2009, 53% (1410/2640) of law transitions represented changes in strength of 1 or more existing laws. Of these cases, 51% (719/1410) represented changes in regulation of government workplaces. Only 30% (417/1410) represented places where the strength was changed for 1 or more of the existing government workplace, private workplace, or restaurant laws.
TABLE 2—
Pattern of Local Indoor Smoking Law Passage and Strength of Laws: Americans for Nonsmokers’ Rights Ordinance Database, 1970–2009
| Transitionsa |
||||
| Venues Regulated by New Laws or Changes to Laws | 1970–1979, No. | 1980–1989, No. | 1990–1999, No. | 2000–2009, No. |
| No law at start of study | ||||
| Government workplaces | 1 | 116 | 657 | 268 |
| Government and private workplaces | 0 | 7 | 11 | 33 |
| Restaurants | 13 | 105 | 60 | 45 |
| Government workplaces and restaurants | 1 | 13 | 30 | 10 |
| Private workplaces and restaurants | 0 | 13 | 3 | 2 |
| Restaurants and bars | 0 | 6 | 11 | 26 |
| Government workplaces, restaurants, and bars | 0 | 0 | 7 | 22 |
| Government and private workplaces and restaurants | 1 | 298 | 265 | 134 |
| Government and private workplaces, restaurants, and bars | 0 | 7 | 51 | 268 |
| Government workplace law at start of study | ||||
| Changes in strength (no added venues) | 0 | 1 | 156 | 719 |
| Government and private workplaces and restaurants | 0 | 0 | 4 | 22 |
| Government workplaces, restaurants, and bars | 0 | 0 | 0 | 14 |
| Government and private workplaces, restaurants, and bars | 0 | 0 | 1 | 57 |
| Restaurant law at start of study | ||||
| Change in strength (no added venues) | 2 | 9 | 80 | 97 |
| Government and private workplaces and restaurants | 0 | 6 | 14 | 11 |
| Government and private workplaces, restaurants, and bars | 0 | 0 | 6 | 21 |
| Government workplace and restaurant laws at start of study: changes in strength (no added venues) | 0 | 0 | 19 | 55 |
| Private workplace and restaurant laws at start of study: changes in strength (no added venues) | 0 | 0 | 12 | 12 |
| Government and private workplace and restaurant laws at start of study | ||||
| Repealed | 0 | 0 | 3 | 20 |
| Changes in strength (no added venues) | 0 | 2 | 294 | 417 |
| Government and private workplaces, restaurants, and bars | 0 | 0 | 30 | 149 |
| Restaurant and bar laws at start of study: changes in strength (no added venues) | 0 | 0 | 4 | 17 |
| Government workplace, restaurant, and bar laws at start of study: government and private workplaces, restaurants, and bars | 0 | 0 | 0 | 16 |
| Government and private workplace, restaurant, and bar laws at start of study: changes in strength (no added venues) | 0 | 0 | 8 | 105 |
| Total changes during study | 18 | 583 | 1726 | 2540 |
| Total changes/decade | 18 | 590 | 1776 | 2640 |
Note. We included only transitions with > 11 cases in each decade of the study period (less frequent patterns of change not shown because of space limitations, n = 34). We measured strength of laws on a spectrum from partial coverage in a venue (weakest) to requiring the venue to be 100% smoke-free (strongest).
Passage of a new law, change in strength of an existing law, or repeal of a law.
State.
Enactment of state laws also accelerated over time. Smoking laws in 2 states changed between 1970 and 1979, in 12 between 1980 and 1989, in 22 between 1990 and 1999, and in 46 between 2000 and 2009 (Table 3). Patterns were simpler in states than in localities. State laws that covered a venue or combination of venues were most often passed where no law existed (50% of the time, 41/82). From 1970 to 2009, 19 states modified existing smoking laws by adding venues and 22 by changing the strength of an existing law. In the 1970s and 1980s, most new smoking laws passed in localities with no existing law (2/2 in the 1970s and 10/12 in the 1980s). In the 1990s, more than half of the law transitions were changes in strength (14/22). However, between 2000 and 2009 a clear pattern of lawmaking emerged: the majority of laws passed at the state level expanded coverage to all 4 venues (29/46).
TABLE 3—
Pattern of State Indoor Smoking Law Passage by Venue and Strength of Laws: Americans for Nonsmokers’ Rights Ordinance Database, 1970–2009
| Transitionsa |
||||
| Venues Regulated by New Laws or Changes to Laws | 1970–1979, No. | 1980–1989, No. | 1990–1999, No. | 2000–2009, No. |
| No law at start of study | ||||
| Government workplaces | 0 | 0 | 1 | 2 |
| Restaurants | 1 | 3 | 0 | 0 |
| Government and private workplaces | 0 | 2 | 0 | 0 |
| Government workplaces and restaurants | 0 | 1 | 1 | 2 |
| Government and private workplaces and restaurants | 1 | 3 | 2 | 4 |
| Government workplaces, restaurants, and bars | 0 | 1 | 0 | 0 |
| Government and private workplaces, restaurants, and bars | 0 | 0 | 1 | 16 |
| Government workplace law at start of study | ||||
| Changes in strength (no added venues) | 0 | 0 | 2 | 2 |
| Government workplaces, restaurants, and bars | 0 | 0 | 0 | 1 |
| Government and private workplace laws at start of study: government and private workplaces and restaurants | 0 | 0 | 2 | 0 |
| Restaurant law at start of study | ||||
| Changes in strength (no added venues) | 0 | 0 | 2 | 0 |
| Government workplaces and restaurants | 0 | 1 | 1 | 0 |
| Government workplaces, restaurants, and bars | 0 | 0 | 0 | 2 |
| Government workplace and restaurant laws at start of study | ||||
| Changes in strength (no added venues) | 0 | 0 | 3 | 4 |
| Government and private workplaces, restaurants, and bars | 0 | 0 | 0 | 1 |
| Government and private workplace and restaurant laws at start of study | ||||
| Changes in strength (no added venues) | 0 | 1 | 6 | 0 |
| Government and private workplaces, restaurants, and bars | 0 | 0 | 0 | 10 |
| Government workplace, restaurant, and bar laws at start of study | ||||
| Changes in strength (no added venues) | 0 | 0 | 1 | 0 |
| Government and private workplaces and restaurants | 0 | 0 | 0 | 1 |
| Government and private workplace, restaurant, and bar law at start of study: changes in strength (no added venues) | 0 | 0 | 0 | 1 |
| Total changes/decade | 2 | 12 | 22 | 46 |
Note. We measured strength of laws on a spectrum from partial coverage in a venue (weakest) to requiring the venue to be 100% smoke-free (strongest).
Passage of a new law, change in strength of an existing law, or repeal of a law.
Changes in Strength Over Time
Local.
The strength of most local laws in effect in 2009 was unchanged from their original form (5148/6648; Table 4). Government workplace laws were strengthened 15% of the time (394/2566), private workplaces 19% of the time (281/1444), restaurant laws 24% of the time (425/1728), and bar laws 5% of the time (44/910). Government workplaces changed from a weaker law to a 100% smoke-free law 13% of the time (336/2566), private workplaces to a 100% smoke-free law 16% of the time (225/1444), restaurants 18% of the time (316/1728), and bars 5% of the time (44/910).
TABLE 4—
Changes in Strength of Local and State Laws Restricting Indoor Smoking by Venue: Americans for Nonsmokers’ Rights Ordinance Database, 1970–2009
| Local |
State |
|||||||
| Strength of Final Law in Study Period | Government | Private | Restaurant | Bar | Government | Private | Restaurant | Bar |
| First law passed was weak, no. | ||||||||
| Repealed | 26 | 31 | 2 | 0 | 0 | 0 | 0 | 0 |
| Weak | 433 | 275 | 73 | 0 | 5 | 4 | 0 | 0 |
| Moderate | 21 | 14 | 9 | 0 | 1 | 0 | 0 | 0 |
| Qualified | 26 | 22 | 10 | 0 | 0 | 0 | 1 | 0 |
| Smoke-free | 190 | 106 | 16 | 0 | 11 | 8 | 2 | 0 |
| First law passed was moderate, no. | ||||||||
| Repealed | 12 | 16 | 36 | 14 | 0 | 0 | 0 | 0 |
| Weak | 6 | 11 | 4 | 0 | 0 | 0 | 0 | 0 |
| Moderate | 160 | 135 | 433 | 178 | 1 | 1 | 6 | 5 |
| Qualified | 11 | 20 | 90 | 0 | 0 | 0 | 2 | 0 |
| Smoke-free | 128 | 103 | 243 | 41 | 0 | 0 | 9 | 2 |
| First law passed was qualified, no. | ||||||||
| Repealed | 1 | 2 | 10 | 3 | 0 | 0 | 0 | 0 |
| Weak | 3 | 2 | 0 | 0 | 0 | 0 | 0 | 0 |
| Moderate | 1 | 0 | 11 | 0 | 0 | 0 | 0 | 0 |
| Qualified | 78 | 104 | 222 | 11 | 2 | 4 | 1 | 0 |
| Smoke-free | 18 | 16 | 57 | 3 | 2 | 2 | 2 | 0 |
| First law passed was smoke-free, no. | ||||||||
| Repealed | 29 | 16 | 16 | 30 | 0 | 0 | 0 | 0 |
| Weak | 15 | 5 | 1 | 0 | 0 | 0 | 0 | 0 |
| Moderate | 5 | 3 | 8 | 11 | 0 | 0 | 0 | 0 |
| Qualified | 12 | 6 | 8 | 0 | 0 | 0 | 0 | 0 |
| Smoke-free | 1391 | 557 | 479 | 619 | 24 | 17 | 19 | 26 |
| Total changes, no. | 2566 | 1444 | 1728 | 910 | 46 | 36 | 42 | 34 |
| Total unchanged, no. | 2062 | 1071 | 1207 | 808 | 32 | 26 | 26 | 31 |
| Unchanged, % | 80 | 74 | 70 | 89 | 70 | 72 | 62 | 91 |
Note. We measured strength of laws on a spectrum from partial coverage in a venue (weakest) to requiring the venue to be 100% smoke-free (strongest).
State.
Like local laws, state laws in effect at the end of 2009 tended to be the same strength as the first law passed for each venue (73%; 115/158; Table 4). Government workplaces changed from a weaker law to a 100% smoke-free law only 24% of the time (13/46), private workplaces 27% of the time (10/36), restaurants 31% of the time (13/42), and bars 5% of the time (2/34). Very few laws decreased in strength. By 2009, 70% (32/46) of state laws required smoke-free venues for government workplaces, 72% (26/36) for private workplaces, 62% (26/42) for restaurants, and 91% (31/34) for bars, mostly because these state laws were initially enacted as smoke-free and probably also because the state laws tended to be passed late in the study period (Table 1).
Downgrades or repeals.
At the local level, downgrades or repeals were rare: 4% (110/2566) for government workplaces, 6% (92/1444) for private workplaces, 6% (96/1728) for restaurants, and 6% (58/910) for bars. At the state level, any law that was repealed was replaced by a future law.
Continuing Trends
In addition to analyzing each decade from 1970 to 2009, we examined the 82 transitions that occurred at the local level from 2010 to 2012. The changes in these 3 years appeared to be an extension of the pattern observed during the first decade of this century. We found that 52% (43/82) of transitions took smoking regulation from no law to either laws covering all 4 venues (28%; 23/82) or laws limited to government workplaces (21%; 17/82).
Seven localities transitioned from a government workplace law to laws covering all 4 venues. Five localities amended their laws covering government workplaces, public workplaces, and restaurants to cover all 4 venues. In 4 cases, laws covering restaurants, private workplaces, and government workplaces transitioned to become laws covering all 4 venues. A single state law transitioned from having restaurant, private workplace, and government workplace laws to having laws covering all 4 venues.
DISCUSSION
Our findings showed that laws tended to be “sticky”: once a locality or state passed a law (1) additional venues were usually not added, and (2) strength changed little from the first to the last law enacted in our study period. Additional venues were added just 11% of the time at the local level. From 1970 to 1999, only 13% of states added venues, but 30% added venues during 2000 to 2009. Between the first and last law passed, strength changed less than 25% of the time at the local level and less than 30% of the time at the state level.
Patterns by Decade
As time progressed, more smoking laws passed, and newer laws tended to be stronger. Although changes to existing laws were less common, changes tended to strengthen rather than weaken the laws' provisions. Laws passed in later decades also covered more venues. The transition analyses also showed a different pattern in the passage of smoking laws between 1970 and 1989 and after 1990. Between 1970 and 1989 local laws tended to regulate only government workplaces, private workplaces, and restaurants; state laws tended to be weak and limited to government workplaces and restaurants. Between 1990 and 1999, most local laws continued to include government workplaces, and many localities only passed or strengthened their government workplace laws. In the 1990s and the following decade, many local governments changed the strength of their laws. Between 2000 and 2009 passage of local and state laws that regulated smoking in bars greatly increased. The detailed analysis of law sequencing showed that the passage of local and state laws accelerated over time. It is possible that laws passed in earlier decades tended to be weaker and covered fewer venues because advocates and policymakers passed state-of-the-art laws for the period, but the state of the art changed over time.
Historical events influenced the US political and social environment and set the stage for the expansion of smoking restriction laws over the past 40 years.8 The 1967 Federal Communications Commission application of the Fairness Doctrine to tobacco advertising on television, which required equal time for anti-tobacco public service announcements22; the 1971 proposal by the surgeon general for a nonsmokers' bill of rights8; the passage of early smoking restriction laws covering various venues at the local, state, and federal levels8; the 1986 surgeon general’s report on involuntary smoking8,29; and the 1992 Environmental Protection Agency risk assessment on secondhand smoke8,30 all helped shift politicians' and the public's attitudes toward indoor smoking.
Case studies of the smoking law policy process have shown that successful implementation of smoking restriction laws requires a broad coalition of activists who work with policy champions to frame the regulation as a public health issue and educate the public about the issue to demonstrate broad constituent support and to change public and political officials’ sentiments.9–13,15–18,21 The tobacco industry and its third-party allies have opposed these laws through political and other processes,31–34 but strong advocacy before, during, and after the passage of smoking restriction laws has supported passage and implementation of strong laws by manifesting and sustaining a visible public consensus and by shifting smoking norms.9,18 These case studies also show that smoking restriction policy can diffuse at the local level through interpersonal networks.20,21
Our analysis indirectly captured the outcomes of these qualitative cultural and political changes. By quantitatively examining smoking ordinance transitions, we showed how smoking regulations changed—or did not change—over time to incorporate venues or changes in strength. This macrolevel perspective supplements the specificity of case studies by showing that a strong majority of laws do not change once they are put into place, or if they change, it is to strengthen coverage in existing venues rather than to incorporate new venues.
Limitations
We did not consider state preemption of local governments’ authority to enact smoking restriction laws in this analysis.35 Between 1985 and 2005, 21 states passed laws preempting local governments from passing indoor smoking restrictions. Although many states subsequently repealed preemption, as of January 2013, 9 states still preempted private workplace laws, 11 preempted regulation in restaurants, and 10 preempted bar regulation. Some states with preemption that includes smoking restrictions have passed 100% smoke-free laws in several venues, but have not repealed preemption. In addition, state preemption may cover different types of local authorities and therefore may not be comparable between states. For these reasons, it was not possible to include preemption in our formal analyses.
We also did not adjust for other potentially important variables, such the urban or rural character of a state or legislative professionalism. Consistent measures for these variables were not available for the full study period. (Most data on these variables are only available from the mid-1990s onward.14) We did not include data from Indian reservations in our analysis. We did not examine patterns in passage of laws covering other venues, such as casinos, beaches, playgrounds, and multiunit housing, because until the beginning of the 21st century, few such laws existed. Finally, our data did not provide information on enforcement of smoking restriction laws. It is possible that enforcement varies across places.
We divided the data analysis period into decades not because of a precipitating event but because decades are the units of time generally discussed in the literature. Our reasons were that (1) it was unclear what an appropriate precipitating event might be (2) the periods needed to be equivalent to make results comparable across time, and (3) a decade was long enough that it captured meaningful changes in early periods where fewer transitions occurred.
Conclusions
Although some advocates and policymakers argue for a gradual approach to lawmaking in which weak laws are passed with the hope of strengthening them over time, our analysis showed that it is much more likely that laws will not be changed, either by increasing their strength or by expanding their reach into more venues. This is especially apparent for localities that start with qualified laws; they are unlikely to upgrade to 100% smoke-free laws. At the same time, older weak or moderate-strength laws at the local level were eventually strengthened to 100% smoke-free in about 1 in 3 cases.
Although some laws may have been weaker because they were enacted early in the ongoing evolution of social and political consensus regarding the dangers of secondhand smoke, we now have a strong public consensus on the health effects of exposure to the toxins in secondhand smoke. At this time, barring barriers such as preemption, it may be better for public health advocates and policymakers to conserve their social capital to expend on a law policy package that covers multiple venues with strong regulations, rather than attempting to pass laws incrementally. When advocates work for and policymakers enact smoking restriction laws, they should advocate for 100% smoke-free laws that cover multiple venues and should not accept partial laws on the grounds that they can come back and improve them later.
Acknowledgments
This work was supported by the National Cancer Institute (grants CA-113710 and CA-61021) and the California Tobacco Related Disease Research Program (20FT-0077).
Richard L. Barnes, JD, and Lauren Lempert, JD, MPH, Center for Tobacco Control Research and Education, provided advice on state preemption.
Note. The funding agencies played no role in the conduct of the research or preparation of the article.
Human Participant Protection
No protocol approval was required because no human participants were involved.
References
- 1.Mackay D, Haw S, Ayres JG, Fischbacher C, Pell JP. Smoke-free legislation and hospitalizations for childhood asthma. N Engl J Med. 2010;363(12):1139–1145. doi: 10.1056/NEJMoa1002861. [DOI] [PubMed] [Google Scholar]
- 2.Pell JP, Haw S, Cobbe S et al. Smoke-free legislation and hospitalizations for acute coronary syndrome. N Engl J Med. 2008;359(5):482–491. doi: 10.1056/NEJMsa0706740. [DOI] [PubMed] [Google Scholar]
- 3.Pierce JP, León ME. Effectiveness of smoke-free policies. Lancet Oncol. 2008;9(7):614–615. doi: 10.1016/s1470-2045(08)70167-0. [DOI] [PubMed] [Google Scholar]
- 4.Tan CE, Glantz SA. Association between smoke-free legislation and hospitalizations for cardiac, cerebrovascular, and respiratory diseases: a meta-analysis. Circulation. 2012;126(18):2177–2183. doi: 10.1161/CIRCULATIONAHA.112.121301. [DOI] [PMC free article] [PubMed] [Google Scholar]
- 5.Fong GT, Hyland A, Borland Ret al. Reductions in tobacco smoke pollution and increases in support for smoke-free public places following the implementation of comprehensive smoke-free workplace legislation in the Republic of Ireland: findings from the ITC Ireland/UK Survey Tob Control 200615suppl 3iii51–iii58 [DOI] [PMC free article] [PubMed] [Google Scholar]
- 6.Fichtenberg CM, Glantz SA. Effect of smoke-free workplaces on smoking behaviour: systematic review. BMJ. 2002;325(7357):188–195. doi: 10.1136/bmj.325.7357.188. [DOI] [PMC free article] [PubMed] [Google Scholar]
- 7.Cheng K-W, Glantz SA, Lightwood JM. Association between smokefree laws and voluntary smokefree-home rules. Am J Prev Med. 2011;41(6):566–572. doi: 10.1016/j.amepre.2011.08.014. [DOI] [PMC free article] [PubMed] [Google Scholar]
- 8.Office of the Surgeon General. The Health Consequences of Involuntary Exposure to Tobacco Smoke: A Report of the Surgeon General. Washington, DC: Public Health Service; 2006. [PubMed] [Google Scholar]
- 9.Samuels B, Glantz SA. The politics of local tobacco control. JAMA. 1991;266(15):2110–2117. [PubMed] [Google Scholar]
- 10.Traynor MP, Begay ME, Glantz SA. New tobacco industry strategy to prevent local tobacco control. JAMA. 1993;270(4):479–486. [PubMed] [Google Scholar]
- 11.Dearlove JV, Glantz SA. Boards of health as venues for clean indoor air policy making. Am J Public Health. 2002;92(2):257–265. doi: 10.2105/ajph.92.2.257. [DOI] [PMC free article] [PubMed] [Google Scholar]
- 12.Givel MS, Glantz SA. Tobacco lobby political influence on US state legislatures in the 1990s. Tob Control. 2001;10(2):124–134. doi: 10.1136/tc.10.2.124. [DOI] [PMC free article] [PubMed] [Google Scholar]
- 13.Morley CP, Cummings KM, Hyland A, Giovino GA, Horan JK. Tobacco Institute lobbying at the state and local levels of government in the 1990s. Tob Control. 2002;11(suppl 1):I102–I109. doi: 10.1136/tc.11.suppl_1.i102. [DOI] [PMC free article] [PubMed] [Google Scholar]
- 14.Squire P. Measuring state legislative professionalism: the squire index revisited. State Polit Policy Q. 2007;7(2):211–227. [Google Scholar]
- 15.Tsoukalas T, Glantz SA. The Duluth clean indoor air ordinance: problems and success in fighting the tobacco industry at the local level in the 21st century. Am J Public Health. 2003;93(8):1214–1221. doi: 10.2105/ajph.93.8.1214. [DOI] [PMC free article] [PubMed] [Google Scholar]
- 16.Rayens MK, York NL, Adkins SM, Kaufman EL, Hahn EJ. Political climate and smoke-free laws in rural Kentucky communities. Policy Polit Nurs Pract. 2012;13(2):90–97. doi: 10.1177/1527154412456434. [DOI] [PMC free article] [PubMed] [Google Scholar]
- 17.Wilson H, Thomson G. “Balancing acts”: the politics and processes of smokefree area policymaking in a small state. Health Policy. 2011;101(1):79–86. doi: 10.1016/j.healthpol.2010.08.017. [DOI] [PubMed] [Google Scholar]
- 18.Satterlund TD, Cassady D, Treiber J, Lemp C. Barriers to adopting and implementing local-level tobacco control policies. J Community Health. 2011;36(4):616–623. doi: 10.1007/s10900-010-9350-6. [DOI] [PMC free article] [PubMed] [Google Scholar]
- 19.Greathouse LW, Hahn EJ, Okoli CT, Warnick TA, Riker CA. Passing a smoke-free law in a pro-tobacco culture: a multiple streams approach. Policy Polit Nurs Pract. 2005;6(3):211–220. doi: 10.1177/1527154405278775. [DOI] [PubMed] [Google Scholar]
- 20.Eriksen MP, Cerak RL. The diffusion and impact of clean indoor air laws. Annu Rev Public Health. 2008;29:171–185. doi: 10.1146/annurev.publhealth.29.020907.090920. [DOI] [PubMed] [Google Scholar]
- 21.Rogers EM, Peterson JC. Diffusion of clean indoor air ordinances in the southwestern United States. Health Educ Behav. 2008;35(5):683–697. doi: 10.1177/1090198106296767. [DOI] [PubMed] [Google Scholar]
- 22.Wagner S. Cigarette Country Tobacco in American History and Politics. New York, NY: Praeger Publishers; 1971. [Google Scholar]
- 23.Tang H, Cowling DW, Lloyd JC et al. Changes of attitudes and patronage behaviors in response to a smoke-free bar law. Am J Public Health. 2003;93(4):611–617. doi: 10.2105/ajph.93.4.611. [DOI] [PMC free article] [PubMed] [Google Scholar]
- 24.Mandel LL, Glantz SA. Hedging their bets: tobacco and gambling industries work against smoke-free policies. Tob Control. 2004;13(3):268–276. doi: 10.1136/tc.2004.007484. [DOI] [PMC free article] [PubMed] [Google Scholar]
- 25.Thalheimer R, Ali MM. The demand for casino gaming with special reference to a smoking ban. Econ Inq. 2008;46(2):273–282. [Google Scholar]
- 26.US Tobacco Control Laws Database. Berkeley, CA: American Nonsmokers' Rights Foundation; 2010. [Google Scholar]
- 27.Gonzalez M, Sanders-Jackson A, Song AV, Cheng KW, Glantz SA. Strong smoke-free law coverage in the United States by race/ethnicity: 2000–2009. Am J Public Health. 2013;103(5):e62–e66. doi: 10.2105/AJPH.2012.301045. [DOI] [PMC free article] [PubMed] [Google Scholar]
- 28.Visser I, Speekenbrink M. depmixS4: An R-package for hidden Markov models. J Stat Softw. 2010;36(7):1–21. [Google Scholar]
- 29.Center for Health Promotion and Education. The Health Consequences of Involuntary Smoking: A Report of the Surgeon General. Rockville, MD: Public Health Service; 1986. [Google Scholar]
- 30.Office of Research and Development. Respiratory Health Effects of Passive Smoking: Lung Cancer and Other Disorders. Washington, DC: Office of Health and Environmental Assessment, Environmental Protection Agency; 1992. EPA/600/6–90/006F. [Google Scholar]
- 31.Saloojee Y, Dagli E. Tobacco industry tactics for resisting public policy on health. Bull World Health Organ. 2000;78(7):902–910. [PMC free article] [PubMed] [Google Scholar]
- 32.Dearlove JV, Bialous SA, Glantz SA. Tobacco industry manipulation of the hospitality industry to maintain smoking in public places. Tob Control. 2002;11(2):94–104. doi: 10.1136/tc.11.2.94. [DOI] [PMC free article] [PubMed] [Google Scholar]
- 33.Landman A, Glantz SA. Tobacco industry efforts to undermine policy-relevant research. Am J Public Health. 2009;99(1):45–58. doi: 10.2105/AJPH.2007.130740. [DOI] [PMC free article] [PubMed] [Google Scholar]
- 34.Nixon ML, Mahmoud L, Glantz SA. Tobacco industry litigation to deter local public health ordinances: the industry usually loses in court. Tob Control. 2004;13(1):65–73. doi: 10.1136/tc.2003.004176. [DOI] [PMC free article] [PubMed] [Google Scholar]
- 35.Centers for Disease Control and Prevention. State preemption of local smoke-free laws in government work sites, private work sites, and restaurants—United States, 2005–2009. MMWR Morb Mortal Wkly Rep. 2010;59(4):105–108. [PubMed] [Google Scholar]