

Abstract
Cortical expansion, both in absolute terms and in relation to subcortical structures, is considered a major trend in mammalian brain evolution with important functional implications, given that cortical computations should add complexity and flexibility to information processing. Here, we investigate the numbers of neurons that compose 4 structures in the visual pathway across 11 non-human primate species to determine the scaling relationships that apply to these structures and among them. We find that primary visual cortex, area V1, as well as the superior colliculus (SC) and lateral geniculate nucleus scale in mass faster than they gain neurons. Areas V1 and MT gain neurons proportionately to the entire cerebral cortex, and represent fairly constant proportions of all cortical neurons (36 and 3 %, respectively), while V1 gains neurons much faster than both subcortical structures examined. Larger primate brains therefore have increased ratios of cortical to subcortical neurons involved in processing visual information, as observed in the auditory pathway, but have a constant proportion of cortical neurons dedicated to the primary visual representation, and a fairly constant ratio of about 45 times more neurons in primary visual than in primary auditory cortical areas.
Keywords: Superior colliculus, Visual cortex, Lateral geniculate nucleus, V1, Area MT, Thalamus, Allometry, Brain size, Evolution
Introduction
Primate brain evolution has been characterized by an expansion of the relative size of the cerebral cortex in the absence of an underlying significant increase in the relative number of brain neurons contained in the cortex (reviewed in Herculano-Houzel 2011). Although larger cortices are built of larger numbers of neurons, it is still unknown whether different functional areas of the cerebral cortex gain neurons coordinately, expanding homogeneously within the cortex, or not. It has been proposed that a major factor in primate brain size evolution is expansion of visual processing (Barton 1998; Allman 1999; Kirk 2006), especially with regard to binocular vision, given that orbit convergence, a morphological surrogate for binocular visual field overlap in mammals (Heesy 2004), is also correlated with the volume of the lateral geniculate nucleus (LGN) in the visual thalamus and of the primary visual cortex (area V1), all of which are correlated with substantial expansion of primate brain volume (Barton 2004). Indeed, V1 increases in volume faster than the LGN across non-human primates (de Sousa et al. 2010). In contrast, studies on the scaling of the primary visual cortex relative to the entire neocortical surface so far give contradictory results. A direct analysis of V1 grey matter volume in primates indicates that it increases more slowly than total cortical grey matter, as a power function of the latter with an exponent of 0.7974 (Frahm et al. 1984). In contrast, a study based on published reconstructions of the cortical surface of several primate species suggests a slightly faster increase in V1 surface area over total neocortical area (with an exponent of 1.086; Kaskan et al. 2005). In any case, an expansion in numbers of neurons in particular functional cortical areas can no longer be simply inferred from the relative size of these areas in different species, as it is now known that the distribution of neurons within the cerebral cortex is not homogeneous (Collins et al. 2010). Neuronal density is highest in the visual cortex than in all other areas in the primates examined and we now know that neuronal density varies across representational zones within V1 and can vary across the entire cortical surface of a given primate species by a factor of five to eight times (Collins et al. 2010).
Because of the different scaling relationships that apply to cortical and non-cortical structures (Herculano-Houzel 2011), the approach of inferring from structure volumes the scaling of numbers of neurons across brain structures within the same functional pathway, such as the visual or auditory system, can no longer be considered valid, although it has resulted in a set of testable predictions about the relative scaling, at the neuronal level, of the LGN and V1. In an influential study by Stevens (2001), the scaling of numbers of neurons between the visual cortical area V1 and the LGN, its major thalamic input, was addressed using an indirect approach to infer numbers of neurons in V1 and LGN from their volumes and neuronal densities. Using this approach, Stevens found that the number of neurons in V1, estimated from variations in the volume of the structure across haplorhine primate species, scales with the number of LGN neurons (also inferred from the volume of the structure) raised to an exponent of 3/2. The author attributed functional significance to this exponent: that would be the scaling exponent expected from a shift from the two-dimensional thalamic representation of visual space to its three-dimensional representation in the primary visual cortex (Stevens 2001). However, Stevens’s conclusions depended on several assumptions, such as the constancy of neuronal densities in V1 across species. Moreover, a 3/2 exponent might not be exclusive to the visual system, and therefore might not have the functional origin that he proposed. Alternatively, for instance, a scaling exponent larger than unity would be expected simply given the joint increase in the ratio of brain neurons situated in the cerebral cortex and cerebellum over the number of neurons in the remaining, subcortical brain structures (Herculano-Houzel 2011), which predicts that cortical areas exhibit a faster addition of neurons over subcortical, functionally related structures.
Here, we analyze, in eleven species of strepsirrhine and haplorhine primates, the scaling of numbers of neurons in four structures of the visual pathway: the superior colliculus (SC), the LGN, primary visual cortex (V1) and the middle temporal area (MT), by dissecting them from the rest of the brain and using the isotropic fractionator (Herculano- Houzel and Lent 2005) to estimate the numbers of neurons and non-neuronal cells in each.
The four brain structures examined here bear direct anatomical and functional relationships to one another (Casagrande and Norton 1991; Casagrande and Kaas 1994; Casagrande et al. 2005). Retinofugal axons terminate in the SC and LGN; visual information is relayed from the LGN to cortical area V1, and V1 provides the major direct and indirect activating inputs to MT. Additionally, V1 provides more inputs to the LGN and SC than the retina provides, with important functions in visual processing. Importantly, since the number of retinofugal projections scales with increasing size of the eye and body (Finlay et al. 2008), and because three-dimensional representations are found for the first time at the level of V1, larger animals, or larger brains, are indeed expected to have increased numbers of neurons in area V1 relative to the SC and LGN, scaling over these with an exponent of 3/2 (Stevens 2001). Here, we are able to directly test Stevens’s hypothesis of the functional scaling relationship between numbers of neurons in V1 and LGN in the visual pathway, and to compare the scaling across structures in the visual system with that found across structures in the auditory system (Wong et al. 2012, see companion paper).
Materials and methods
The primary visual cortex (V1), area MT, LGN and superior colliculus (SC) were dissected from 42 brain hemispheres from 30 individuals of 11 primate species (Table 1). Not all structures were available in all brains (SC, 40 hemispheres from 11 species; LGN, 37 hemispheres from 10 species; V1, 32 hemispheres from 6 species; MT, 18 hemispheres from 3 species; Table 1). All statistical analyses were conducted using species averages pertaining to structures in a single hemisphere. Data pertaining to the entire brain were obtained from Herculano-Houzel et al. (2007) and Gabi et al. (2010), and data on the mass and number of neurons of the grey matter of the cerebral cortex were obtained from Herculano-Houzel et al. (2008). Where applicable, whole brain numbers were divided by two to be comparable to those for the visual structures analyzed, which are each from one hemisphere.
Table 1.
Variation in absolute mass and neuronal composition of visual structures
| Species | N, individuals | N, hemispheres | ½ Brain mass | ½ Brain neur | SC mass | SC neur | LGN mass | LGN neur | V1 mass | V1 neur | MT mass | MT neur | GM mass | GM neur |
|---|---|---|---|---|---|---|---|---|---|---|---|---|---|---|
| Microcebus murinus | 1 | 1 | 0.89 | 127.36 × 10⁶ | 0.014 | 0.76 × 10⁶ | n.a. | n.a. | 0.043 | 5.79 × 10⁶ | n.a. | n.a. | n.a. | n.a. |
| Galago moholi | 1 | 2 | 1.95 | n.a. | 0.022 ± 0.001 | 0.95 ± 0.01 × 10⁶ | 0.018 ± 0.001 | 0.72 ± 0.17 × 10⁶ | n.a. | n.a. | n.a. | n.a. | n.a. | n.a. |
| Callithrix jacchus | 5 | 6 | 3.89 | 317.90 × 10⁶ | 0.029 ± 0.006 | 0.90 ± 0.38 × 10⁶ | 0.030 ± 0.020 | 0.78 ± 0.44 × 10⁶ | 0.297 ± 0.036 | 38.86 ± 3.58 × 10⁶ | 0.046 ± 0.022 | 3.70 ± 2.27 × 10⁶ | 2.042 | 120.33 × 10⁶ |
| Otolemur garnettii | 4 | 6 | 5.08 | 468.00 × 10⁶ | 0.033 ± 0.012 | 1.21 ± 0.47 × 10⁶ | 0.015 ± 0.004 | 0.48 ± 0.19 × 10⁶ | 0.310 ± 0.042 | 36.56 ± 6.81 × 10⁶ | 0.030 ± 0.010 | 1.64 ± 0.50 × 10⁶ | 2.556 | 88.50 × 10⁶ |
| Eulemur mongoz | 1 | 2 | 7.70 | n.a. | 0.045 ± 0.007 | 1.82 ± 0.26 × 10⁶ | 0.043 ± 0014 | 1.68 ± 0.21 × 10⁶ | n.a. | n.a. | n.a. | n.a. | n.a. | n.a. |
| Aotus trivirgatus | 9 | 11 | 7.87 | 734.20 × 10⁶ | 0.032 ± 0.010 | 0.97 ± 0.36 × 10⁶ | 0.032 ± 0.018 | 0.97 ± 0.45 × 10⁶ | 0.520 ± 0.103 | 62.08 ± 16.45 × 10⁶ | 0.096 ± 0.0014 | 5.95 ± 1.55 × 10⁶ | 3.698 | 200.32 × 10⁶ |
| Lemur catta | 1 | 2 | n.a. | n.a. | 0.052 ± 0.006 | 1.28 ± 0.01 × 10⁶ | 0.048 | 1.23 × 10⁶ | n.a. | n.a. | n.a. | n.a. | n.a. | n.a. |
| Propithecus verreauxi | 1 | 2 | 16.35 | n.a. | 0.056 ± 0.005 | 1.10 ± 0.01 × 10⁶ | 0.038 ± 0.002 | 0.64 ± 0.01 × 10⁶ | n.a. | n.a. | n.a. | n.a. | n.a. | n.a. |
| M. mulatta | 2 | 2 | 43.67 | 3.19 × 10⁹ | 0.049 | 1.84 × 10⁶ | 0.185 | 3.25 × 10⁶ | 1.880 ± 0.085 | 213.76 ± 54.27 × 10⁶ | n.a. | n.a. | 21.430 | 687.96 × 10⁶ |
| Papio cynocephalus | 4 | 6 | 75.60 | 5.47 × 10⁹ | 0.182 ± 0.054 | 2.40 ± 0.91 × 10⁶ | 0.252 ± 0.106 | 2.95 ± 0.70 × 10⁶ | 5.632 ± 1.943 | 394.19 ± 122.69 × 10⁶ | n.a. | n.a. | 36.334 | 1.42 × 10⁹ |
| Variation Papio/Callithrix | 19.4× | 6.3× | 2.7× | 8.4× | 3.8× | 19.0× | 10.1× | n.a. | n.a. | 17.8× | 11.8× |
All values are mass ± standard deviation and refer to a single brain hemisphere. Values referring to brain mass, number of brain neurons, cortical gray matter mass and number of neurons are species averages from our prior studies (Herculano-Houzel et al. 2007, 2008; Gabi et al. 2010), except for brain mass in Galago moholi, Eulemur mongoz, Lemur catta and Propithecus verreauxi, which were obtained from Stephan et al. 1981
SC superior colliculus, LGN lateral geniculate nucleus, GM cortical grey mass, n.a. structure not available
Animals
The brains of four prosimian galagos (Otolemur garnetti), five marmosets (Callithrix jacchus), nine owl monkeys (Aotus trivirgatus), one crab-eating macaque (Macaca fascicularis) and two rhesus macaques (Macaca mulatta) were obtained from animals euthanized at Vanderbilt University after terminal experimental procedures under protocols approved by the Vanderbilt Institutional Animal Care and Use Committee. These animals were sacrificed with a lethal dose of sodium pentobarbital, perfused with 0.9 % phosphate-buffered saline (PBS) followed by 2 % paraformal-dehyde in PBS (pH 7.4), and 2 % paraformaldehyde plus 10 % sucrose in PBS. Four baboon brains (Papio cynocephalus) were purchased after perfusion from the University of Washington National Primate Research Center’s tissue distribution program and the brains of one mongoose lemur (Eulemur mongoz), one mouse lemur (Microcebus murinus), one galago (Galago moholi), one ring-tailed lemur (Lemur catta) and one Verreaux’s sifaka (Propithecus verreauxi) were purchased from the Duke University Lemur Center after natural death. The brains were removed and post-fixed by immersion in 4 % paraformaldehyde in 0.1 M PB.
Tissue preparation and dissection
Our dissections were intended to include all of the superior colliculus, all of the LGN, and two cortical visual areas, V1 and MT (Fig. 1). In most cases, the cortex was flattened and viewed on a light box to reveal the boundaries of the dark, heavily myelinated areas such as V1 and MT, which were then dissected from the cortical sheet. Dissections of the LGN and SC in all animals were performed on the intact remainder of the brain using a magnifying lamp. The LGN of the thalamus was dissected completely, either from thick slices of the brain or from the whole, intact thalamus. The LGN can be precisely located by following the optic tract. The LGN is readily accessible on the lateral most aspect of the thalamus and was gently pulled away from the rest of the thalamus using forceps to sever the surrounding white matter. A straight, horizontal cut was made at the base of the SC from its midline edge above the aqueduct of Sylvius to its lateral edge. A midsagittal cut separated the left and right colliculi. In most cases, the visual structures of a single brain hemisphere were examined. All values are reported as averages for a single hemisphere.
Fig. 1.
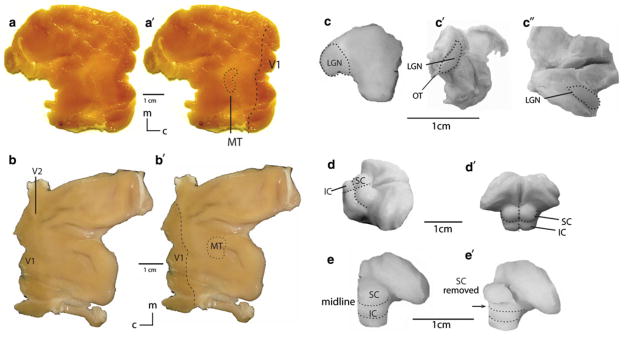
Dissection of brain visual structures. a Marmoset flat left cortex slightly backlit shows the V1/V2 boundary and the boundary of area MT. a′ Boundaries traced on flat hemisphere. b Owl monkey flat cortical hemisphere still has visible boundaries for V1 and V2, even with no backlighting. MT borders were defined by backlighting (b′; not shown). c Macaque monkey left LGN, coronal cut, side (c′) and top (c″) views. Some LGN were dissected from thick slices of thalamus on which the borders of the LGN were readily visible. For intact thalami, the optic tract runs into the LGN (c′), which is encased in white matter and readily dissectable from surrounding thalamus. The right LGN has been removed from c′ and c″. d Prosimian thalamus, midbrain superior colliculus (SC) and inferior colliculus (IC), dorsolateral view and dorsocaudal view (d′). A midline cut separates the two superior colliculi. A single cut between the SC and IC is made and the white matter surrounding the SC is broken with forceps. e Macaque superior colliculus (SC) dissections is more challenging due to the small size of the colliculi. A straight cut is made between the inferior and superior colliculi as in other species. Forceps are used to break surrounding white matter and remove the SC as shown in e′
Isotropic fractionator
The isotropic fractionator method (Herculano-Houzel and Lent 2005) was used to estimate the total number of cells, neurons, and non-neurons in each dissected structure. After weighing, each visual pathway structure was mechanically homogenized in a dissociation solution containing 40 mM sodium citrate and 1 % Triton-X100, yielding a nuclear suspension of known volume that was then made isotropic by agitation. To estimate total cell number, 4′,6-diamidino- 2-phenylindole dihydrochloride (DAPI, Invitrogen), a DNA-specific fluorescent dye, was added to the suspensions, diluted 20–100× from a stock solution of 10 mg/L. Four aliquots of the suspension were placed on a hemo-cytometer and counted under a fluorescence microscope under 400× total magnification in order to determine the average number of cell nuclei per milliliter of suspension. This number was then multiplied by the total suspension volume to determine the total number of cells in the suspension made from the dissected tissue. To find the total number of neurons, a 1 ml sample of the nuclear suspension was centrifuged, resuspended in PBS, centrifuged, then resuspended in a 0.2 M solution of boric acid, pH 9.0, and heated for 45 min at 75 °C for epitope retrieval. The suspension was centrifuged once more to collect the nuclei, washed with PBS, and immunoreacted overnight with a monoclonal antibody against neuronal nuclear antigen (NeuN; 1:300 in PBS, Millipore, Billerica, MA), a neuron-specific antibody that stains all neurons in the central nervous system, except mitral cells, inferior olive cells, and Purkinje cells (Mullen et al. 1992). The nuclei were then washed and resuspended in a solution consisting of 10 % goat serum, 40 % DAPI, 50 % PBS, and a goat anti-mouse IgG secondary antibody tagged with Alexa Fluor 594 (1:400, Invitrogen, Eugene, OR, USA). After washing in PBS, an aliquot of the stained nuclear suspension was again placed on the hemocytometer to evaluate a minimum of 500 DAPI-positive nuclei to determine what proportion of those nuclei were NeuN-immunoreactive. By using the fraction of NeuN-positive neurons multiplied by the total number of cells, the total number of neurons in the original tissue was determined. The total number of non-neuronal cells in each structure was determined by subtracting its total number of neurons from its total number of cells.
Data analysis
Average values for each species were obtained from the individuals of each species. All statistical analyses and regressions were performed utilizing JMP 9.0 (SAS Institute, Cary, NC, USA). Correlations between the variables were calculated using the Spearman correlation coefficient. Regressions of the data to power functions were calculated using least squares regression to log-transformed data. Consistently our prior studies, we chose to report relationships without adjusting them for phylogenetic relatedness in the dataset. This offers the advantage of presenting readily comparable raw, uncorrected relationships that are not based on external premises such as inferred phylogenetic relationships, which is justifiable given the tight distribution of datapoints and the ensuing goodness of fits, which are little affected by phylogenetic relatedness (see Gabi et al. 2010; Herculano-Houzel et al. 2011 for instance).
Results
From Callithrix to Papio, two species for which data were available for all visual structures analyzed (except MT), brain mass varies 19-fold (from 3.89 to 75.6 g), V1 mass varies also 19-fold (from 0.30 to 5.632 g), LGN mass varies 8-fold (from 0.03 to 0.252 g), and SC mass varies 6-fold (from 0.03 g to 0.182; all values, as listed in Table 1, refer to a single brain hemisphere). The difference in variation in mass of the visual cortex, LGN and SC suggests that these structures scale differently with increasing brain mass. The mass of V1 increases almost linearly with brain mass (p = 0.0001, 95 % CI 0.873–1.157), as does the mass of the whole cortical hemisphere, which increases with (p<0.0001, 95 % CI 1.034–1.160), such that V1 mass increases almost linearly with cortical grey matter mass MGM, varying with (p = 0.0006, 95 % CI 0.782–1.014; linear fit, p = 0.0006), and the relative size of V1 compared to brain mass does not vary significantly with brain mass (Spearman correlation, p = 1.000). Similarly, the relative size of V1 compared to the entire cortical grey matter does not vary significantly with brain mass (Spearman correlation, p = 0.1041), such that V1 represents on average 12.2 ± 1.0 % of the cerebral cortical grey mass (from 8.8 % in Macaca mulatta to 14.5 % in Callithrix jacchus; Table 2). Area MT, which could be analyzed in only three species (Callithrix, Otolemur and Aotus; Table 1), represents on average 2.0 % of the cortical grey matter in them, with no significant relationship with cortical mass (Spearman correlation, p = 0.4795; Table 2). Likewise, although the mass of the LGN varies with (p = 0.0003, 95 % CI 0.528–1.116), its relative size does not vary significantly together with brain mass (Spearman correlation, p = 0.1869). In contrast, in the sample of species examined here, the SC becomes relatively smaller in larger primate brains: its mass varies with (p = 0.0002, 95 % CI 0.315–0.656), such that its relative mass (expressed as a percentage of whole brain mass) decreases significantly with increasing brain mass (Spearman correlation, ρ = −0.952, p = 0.0043), varying between 1.6 and 0.1 % of brain mass across species (Table 2; Fig. 2a).
Table 2.
Variation in relative mass and neuronal composition of visual structures
| Species | Relative size compared to brain mass (%)
|
Relative number of brain neurons (%)
|
Percent of GM mass (%)
|
Percent of GM neurons (%)
|
||||||||
|---|---|---|---|---|---|---|---|---|---|---|---|---|
| SC | LGN | V1 | MT | SC | LGN | V1 | MT | V1 | MT | V1 | MT | |
| Microcebus murinus | 1.57 | n.a. | 4.8 | n.a. | 0.60 | n.a. | 4.5 | n.a. | n.a. | n.a. | n.a. | n.a. |
| Galago moholi | 1.13 | 0.92 | n.a. | n.a. | n.a. | n.a. | n.a. | n.a. | n.a. | n.a. | n.a. | n.a. |
| Callithrix jacchus | 0.75 | 0.77 | 7.8 | 1.22 | 0.28 | 0.25 | 12.2 | 1.16 | 14.5 | 2.3 | 35.6 | 3.4 |
| Otolemur garnettii | 0.65 | 0.30 | 6.1 | 0.60 | 0.26 | 0.10 | 7.8 | 0.35 | 12.1 | 1.2 | 45.1 | 2.0 |
| Eulemur mongoz | 0.58 | 0.56 | n.a. | n.a. | n.a. | n.a. | n.a. | n.a. | n.a. | n.a. | n.a. | n.a. |
| Aotus trivirgatus | 0.41 | 0.41 | 6.1 | 1.12 | 0.13 | 0.13 | 8.5 | 0.81 | 14.1 | 2.6 | 35.1 | 3.4 |
| Lemur catta | n.a. | n.a. | n.a. | n.a. | n.a. | n.a. | n.a. | n.a. | n.a. | n.a. | n.a. | n.a. |
| Propithecus verreauxi | 0.34 | 0.23 | n.a. | n.a. | n.a. | n.a. | n.a. | n.a. | n.a. | n.a. | n.a. | n.a. |
| M. mulatta | 0.11 | 0.42 | 4.3 | n.a. | 0.06 | 0.10 | 6.7 | n.a. | 8.8 | n.a. | 31.1 | n.a. |
| Papio cynocephalus | 0.24 | 0.33 | 7.5 | n.a. | 0.04 | 0.05 | 7.2 | n.a. | 11.3 | n.a. | 32.8 | n.a. |
All values are expressed as percentages and are calculated for a single hemisphere. Values for brain mass, number of brain neurons, cortical gray matter mass and number of neurons come from our prior studies (Herculano-Houzel et al. 2007, 2008; Gabi et al. 2010)
SC superior colliculus, LGN lateral geniculate nucleus, GM cortical grey mass, n.a. structure not available
Fig. 2.

Scaling of relative mass and relative number of neurons in visual structures with increasing brain mass. a The relative size of V1, expressed as a percentage of the mass of the cerebral cortical grey matter, does not vary significantly with increasing brain mass (Spearman correlation, p = 0.1041). In contrast, the relative size of the LGN and of the SC, expressed as percentages of brain mass, decreases with increasing brain mass, varying with the mass of one brain hemisphere raised to the exponents indicated. b The relative number of cortical neurons found in V1, expressed as a percentage of all neurons in the cerebral cortical grey matter, does not vary significantly with increasing brain mass (Spearman correlation, p = 0.1041), and neither does the relative size of the LGN, expressed as a percentage of the number of neurons in one brain hemisphere. In contrast, the relative number of neurons in the SC, expressed as a percentage of the number of neurons in one brain hemisphere, decreases with increasing brain mass raised to the exponent indicated. Each point represents the average values for one species. Squares V1, triangles LGN, circles SC
Scaling rules for V1
The mass of area V1 increases as a power function of the number of neurons (NV1) in the structure that is significantly different from linearity, with (p<0.0001, 95 % CI 1.025–1.225; Fig. 2a), and increases slightly above linearity with the number of other cells (OV1) in the structure as (p<0.0001, 95 % CI 0.970–1.226; Fig. 3b). As would be expected for a structure that gains mass faster than it gains neurons, neuronal cell density decreases significantly with increasing V1 mass (MV1) across species, varying proportionately to (p = 0.0393, 95 % CI −0.196 to −0.040) between 134,650 neurons/mg in the mouse lemur and 69,980 neurons/mg in the baboon (Fig. 3c).
Fig. 3.

Cellular scaling rules for the visual structures V1, LGN and SC. a The mass of each of the visual structures increases hypermetrically as the structures gain neurons, varying as power functions of the number of neurons in the structures raised to the exponents indicated. b The mass of V1, LGN and SC vary as similar functions of the numbers of other (non-neuronal) cells in the respective structures, which can be described as power functions with the exponents indicated, or as linear functions of the number of other cells in the structures. c Neuronal densities in the V1, LGN and SC decrease as these structures increase in mass, varying as power functions of respective structure mass raised to the exponents indicated. Each point represents the average values for one species. Squares V1, triangles LGN, circles SC
Although V1 mass scales faster than its number of neurons, we find that the number of neurons in V1 increases linearly with the number of neurons in the entire cortical grey matter, NGM (r2 = 0.998, p<0.0001), which is a better fit than the alternate, approximately linear power fit, varying with (p = 0.0002, 95 % CI 0.819–0.991). Accordingly, V1 represents a relatively constant percentage of all cortical grey matter neurons, on average 35.9 ± 2.4 % (varying between 31.1 and 45.1 %), and this percentage does not correlate with the mass of the entire cortical grey matter nor with the mass of the brain (Spearman correlation p = 0.1041; Fig. 2b). V1 also gains neurons coordinately with the number of brain neurons NBR, with NV1 varying with (p = 0.0008; linear fit, r2 = 0.996, p<0.0001), such that the number of V1 neurons represents on average 7.8 ± 1.0 % of all brain neurons, with no significant correlation with the number of brain neurons (Spearman correlation p = 0.9572; Table 2).
Relative size and number of neurons in MT
Although the cellular scaling rules for MT cannot be calculated from only three species, we find that, like V1, MT holds similar percentages of all cortical grey matter neurons in the three species, on average 2.9 ± 0.8 % (varying between 2.0 and 3.4 %), and this percentage does not correlate with the mass of the entire cortical grey matter (Spearman correlation p = 0.4795; Table 2). Area MT, therefore, has on average 12.9 % of the mass of V1, but only 6.8 % of its neurons, a difference that is explained by the much smaller neuronal density in MT than in V1 (from 53,690 to 80,020 N/mg in MT and 117,940 to 130,840 N/mg in V1 in the same species).
Scaling rules for the LGN
The mass of the LGN scales as a power function of its number of neurons, NLGN, varying with (p<0.0001, 95 % CI 0.943–1.726; Fig. 3a), and also as a power function of its number of other cells, OLGN, varying with (p = 0.0040, 95 % CI 1.000–1.383; Fig. 3b). In accordance with a power scaling of LGN mass with its number of neurons, neuronal density in the LGN decreases significantly with increasing LGN mass, MLGN, varying with (p = 0.0040, 95 % CI −0.531 to −0.142; Fig. 3c), between 40,040 neurons/mg in Galago moholi and 11,740 neurons/mg in the baboon.
The number of LGN neurons increases more slowly than the total number of neurons in the brain, with (p = 0.0124, 95 % CI 0.237–1.088). However, although the percentage of brain neurons located in the LGN varies between 0.25 % in the marmoset and 0.05 % in the baboon, the correlation with brain mass fails to reach statistical significance (Spearman correlation, p = 0.0845; Fig. 2b).
Scaling rules for the superior colliculus (SC)
Like LGN mass, SC mass scales as a power function of its number of neurons, NSC, increasing with (p = 0.0006, 95 % CI 0.912–2.346; Fig. 3a), and also as a power function of its number of other cells, OSC, varying with (p<0.0001, 95 % CI 0.857–1.690; Fig. 3b). In accordance with a power scaling of SC mass with its number of neurons, neuronal density in the SC decreases significantly with increasing SC mass, MSC, varying with (p = 0.0002, 95 % CI −0.744 to −0.340; Fig. 3c), between 54,290 neurons/mg in the mouse lemur and 13,190 neurons/mg in the baboon.
The number of SC neurons increases more slowly than the total number of neurons in the brain, with (p = 0.0007, 95 % CI 0.202–0.413). As a consequence, larger brains have significantly smaller percentages of brain neurons located in the SC, varying with (p<0.0001, 95 % CI −0.692 to −0.506; Fig. 2b).
Intraspecific relationships
Our relatively large sample of Aotus individuals (n = 9) gave us the opportunity to evaluate intraspecific variation. Remarkably, no relationships between structure mass and number of neurons were found to be significant at the p<0.05 level, nor were numbers of neurons found to be significantly correlated across cortical and sub-cortical visual structures across individuals (not shown).
Scaling among the visual structures V1, LGN and SC
Consistent with the observation that V1 scales isometrically with brain mass and cortical grey matter mass across species while the SC represents decreasing percentages of increasing brain mass, we find that, across the species in the sample, the mass of V1 increases as a power function of the mass of the SC raised to a large exponent of 1.865 (p = 0.0044, 95 % CI 1.223–2.507). In contrast, V1 mass scales approximately linearly with LGN mass raised to an exponent of 0.988 (p = 0.0118, 95 % CI 0.630–1.346). LGN mass, in turn, scales faster than SC mass, varying with (p = 0.0024, 95 % CI 0.642–2.070; Fig. 4, top right). The finding that V1 gains mass faster than the LGN, which in turn gains mass faster than the SC, can be illustrated by the observation that while V1 is 10 times larger than both the LGN and the SC in the marmoset, it is 22 times larger than the LGN and 31 times larger than the SC in the baboon.
Fig. 4.

Scaling of mass and number of neurons among visual structures, and across visual and auditory structures. Top scaling of V1, LGN and SC mass with each other, and of these structures with auditory structures. Right scaling of V1, LGN and SC numbers of neurons amongst the structures, and across these and the equivalent auditory structures. Lines indicate relationships best described as linear. Dashed lines indicate preliminary relationships with MT, which in the three species analyzed here shows similar percentages of cortical neurons. Polygons indicate power law scaling relationships whose exponents are proportional to the widths of the extremities of the polygons. For example, V1 scales in mass proportionately to variations in SC mass raised to an exponent of 1.865, but gains neurons proportionately to variations in the number of neurons in the SC raised to a larger exponent of 3.047. Data on auditory structures from Wong et al. (2012)
Because of the different hypermetric scaling of the size of the various visual structures as they gain neurons, we find an even faster scaling of the numbers of neurons in V1 compared to numbers of neurons in the SC and the LGN than expected from the mass relationships across these structures. Numbers of neurons increase faster in V1 than in the LGN, varying with (p = 0.0120, 95 % CI 0.767–1.651), and even faster in V1 than in the SC, varying with (p = 0.0108, 95 % CI 1.695–4.399). The LGN, in turn, gains neurons faster than the SC, with (p = 0.0020, 95 % CI 0.848–2.620; Fig. 4, bottom right). This finding that V1 gains neurons faster than the LGN and even faster than the SC can be illustrated by the observation that while V1 has 50 times more neurons than the LGN and 43 times more neurons than the SC in the marmoset, it holds 133 times more neurons than the LGN and 164 times more neurons than the SC in the baboon.
Scaling relationships across visual and auditory structures
In the companion study (Wong et al. 2012), we found a similar faster scaling in numbers of neurons in the cortical primary auditory area (area A) compared to the functionally related subcortical structures, inferior colliculus (IC) and medial geniculate nucleus (MGN). The similar analysis of scaling among visual structures reported here allowed us to next examine the scaling of cortical and subcortical structure mass and numbers of neurons across the visual and auditory systems. These results are summarized in Fig. 4, for those relationships that met a criterion of p<0.05 (Spearman correlation).
We find scaling relationships across species that are best described as linear between the mass of the IC and all of the examined structures in the visual system (r2>0.8, p<0.01); no relationship between the SC and auditory structures other than the IC, as well as no mass relationship between the MGN and visual structures, nor between the LGN and the auditory thalamus or cortex; and a linear relationship between the mass of areas A and V1 (r2 = 0.994, p = 0.0002; Fig. 4, top). A similar, but not identical, pattern is found for the scaling of numbers of neurons across the two systems: a linear relationship between numbers of neurons in the IC and LGN (r2 = 0.781, p = 0.0194), and between numbers of neurons in area A and V1 (r2 = 0.944, p = 0.0057); a power relationship between numbers of neurons in the IC and SC (exponent 1.679, p = 0.0069); but no relationship across the MGN and LGN, nor between these structures and the respective non-related sensory cortices (Fig. 4, bottom). These findings indicate that numbers of neurons vary coordinately across the auditory and visual colliculi as well as across the primary auditory and visual cortical areas, but not across the auditory and visual thalamic nuclei.
Discussion
Here, we find that, while the superior colliculus and LGN of each hemisphere represent visual space with a number of neurons on the order of one million cells in each structure, the visual representation in cortical area V1 across the same 11 primate species engages from several million to several hundred million neurons, which amount to from 50 to over 130 times more primary cortical neurons than the number of subcortical neurons devoted to the task. With such a large number of neurons available to integrate subcortical information in different combinations, cortical processing is therefore well suited to add resolution, complexity and flexibility to visual processing not only through intracortical networks but also through the numerous corticothalamic projections that far outnumber the number of retinal inputs received by the LGN (Casagrande et al. 2005). Moreover, we find that the larger the brain, the larger is the magnification of the cortical neuronal representation of the visual field over the subcortical representation. In absolute terms, this is a much larger range of increase than observed across the equivalent structures along the auditory pathway, in which the primary auditory area engages only a few million neurons in the same species, representing only about 3 to 6 times more neurons than in the related subcortical structures (Wong et al. 2012). Despite the much larger number of cortical visual over auditory neurons however, the rate of increase in numbers of cortical over thalamic neurons across species is the same in the auditory and visual pathways (see below), such that on average there are 46 times more neurons in primary visual than in primary auditory cortex in the different species regardless of brain size.
Across primate species, the visual structures LGN, SC and V1 scale in mass faster than they gain neurons, with exponents of 1.335, 1.629 and 1.125, respectively. Neuronal densities within the structures, as expected from these exponents, were found to decrease significantly as the structures become larger, which suggests that the average neuronal size in all three visual structures increases as they gain neurons (at a faster rate in the SC than in the LGN, and slowest in V1). The decreasing neuronal density in larger V1 areas is consistent with a previous finding in layer II/III of primates (Sherwood et al. 2007). These results for individual functional areas are slightly different from the scaling relationships found to apply to the entire cerebral cortex (whose mass varies almost linearly with increasing numbers of neurons) and to the whole of the subcortical areas (whose mass varies with its number of neurons raised to an exponent of 1.4; Gabi et al. 2010). Remarkably, the non-linear, hypermetric scaling of the mass of visual structures SC, LGN and V1 as they gain neurons also differs from the linear scaling of the mass of the corresponding auditory structures IC, MGN and area A (Wong et al. 2012). The equivalent visual and auditory structures are functional counterparts with a shared developmental origin at each brain level (IC and SC in the mesencephalon, LGN and MGN in the diencephalon, area A and V1 in the telencephalon; Rubenstein et al. 1998), and can swap function when afferents are rerouted experimentally in early development (Roe et al. 1990; von Melchner et al. 2000). Although genetic factors might lead to different scaling rules within visual or auditory structures, and to much larger neuronal densities in V1 compared to area A, we speculate that the difference in scaling rules across the auditory and visual systems is related to their functional differences in information processing, such that the visual system, but not the auditory, requires neurons to increase in size (for example, with larger dendritic arbors) as they become more numerous.
In a study of the relationship of overall size and numbers of neurons across the LGN and V1 in the visual system of haplorrhine primates, Stevens (2001) concluded that V1 increases in number of neurons as a power function of the number of neurons in the LGN with an exponent of 3/2. Such scaling, he proposed, might be related to the remapping of a two-dimensional representation of the visual world in the LGN onto a three-dimensional representation in V1, which would necessitate the faster scaling of numbers of neurons in the visual cortex over the visual thalamus in order to maintain the same resolution within a pixel of visual space. Stevens, however, did not use direct estimates of numbers of neurons in the structures he compared, but instead based his estimate of the number of V1 neurons on the assumption that neuronal density in this area is constant across species (Rockel et al. 1980)—an assumption that we know is incorrect (Collins et al. 2010) and that we again contradict in the present study, given that the neuronal density in V1 varies systematically with V1 mass across species. We do confirm, however, the scaling of numbers of LGN neurons with LGN mass that he inferred from applying variations of neuronal density (Shulz 1967) to variations in the volume of the LGN (Stephan et al. 1981). His exponents of 0.659 for haplorhines and 0.683 for strepsirrhines bracket closely the exponent of 0.663 calculated from our sample, which combines both haplorhines and strepsirrhines, to describe how the number of LGN neurons scale with LGN size (mass or volume).
Using the direct estimates of numbers of neurons in our sample, we find the number of neurons in V1 to scale with the number of neurons in the LGN raised to a slightly smaller exponent of 1.209. Although the 95 % confidence interval calculated for our exponent is fairly large (0.767–1.651) and includes the value of 1.5 proposed by Stevens (2001), we believe that this exponent, compared to a fairly similar exponent of 1.176 relating numbers of neurons in cortical area A and the MGN in the auditory system (Wong et al. 2012), may exemplify functionally-related adjustments of a general scaling relationship between numbers of neurons across heavily interconnected thalamic and cortical areas. Indeed, Stevens speculated that a disproportionately greater increase in cortical neurons over thalamic neurons occurs as thalamic neuron number grows for all pairs of thalamic nuclei and cortical areas (Stevens 2001). Such a general scaling relationship, with faster addition of neurons to cortical areas than to the related thalamic areas, would be expected from the general trend towards increased numbers of neurons in the cortex (and cerebellum) relative to the remaining subcortical areas in larger brains (Herculano-Houzel 2011), while auditory and visual cortical areas scale only proportionately with cortical expansion in evolution.
Indeed, the joint analysis of scaling in visual and auditory structures carried out here unveils a concerted, linear scaling of numbers of neurons across V1 and area A, and a concerted, faster scaling of numbers of neurons in the IC compared with the SC, while no significant relationship is found between numbers of neurons in the MGN and LGN across species. The concerted expansion of numbers of neurons in the IC and SC agrees with the functional relationship known to exist between the two structures, given the topographic projection from the IC that leads to the formation of a two-dimensional map of auditory space in the SC (Schnupp and King 1997)—although it could be expected that the SC should gain neurons faster than the IC, contrary to our finding, given the directionality of the projection.
Cortical areas V1 and A gain neurons coordinately, even though there are nearly 50 times more neurons in V1 than in area A in each species, as observed above. While numbers of neurons in V1 and area A seem to scale as similar power functions of, respectively, the numbers of neurons in the LGN and MGN, numbers of neurons scale very differently across the pairs IC-area A (with an exponent of 1.327) and SC-V1 (with an exponent of 3.169), as well as across the pairs IC-MGN (linear) and SC-LGN (exponent, 1.734). It seems, therefore, that it is the scaling relationship of the midbrain structures with the others within each of the two functional systems that is the most particular to each system, bearing different relationships to the number of primary cortical neurons in each while possibly making the number of neurons in the thalamic sensory nucleus vary independently across visual and auditory systems. These findings of an interaction in the scaling across sensory systems at the level of the sensory cortex while not at the level of the thalamus offer support simultaneously to two different theories: of mosaic evolution of functionally independent systems, with no significant correlation in numbers of neurons across functionally unrelated structures such as visual and auditory thalami (Barton and Harvey 2000), and of concerted scaling of brain structures through joint developmental control (Finlay and Darlington 1995) such as in the auditory and visual cortices.
Our findings allow us to make predictions about developmental mechanisms that determine numbers of neurons across the functionally related brain structures at each brain level. It is known that there are correlated variations in size across V1, LGN and the optic tract across humans (Andrews et al. 1997), which might argue for a bottom-up regulation of the size of visual structures in the brain depending on the number of afferents. However, because numbers of neurons in the MGN and LGN vary independently across species, if they alone dictated the numbers of neurons in the respective associated primary cortical areas, then the numbers of neurons in V1 and area A should not be correlated across species. To the contrary, the concerted, linear gain of neurons across V1 and area A suggests that cortical neurons are assigned to sensory modalities by a similar, shared mechanism, one that maintains relatively constant the proportion of neurons assigned to each across species (see, for instance, Caviness et al. 2009) in a manner that does not depend on thalamic input (reviewed in Grove and Fukuschi-Shimogori 2003). This would be a complementary mechanism to the one that enables intraspecific variations in the distribution of neurons across cortical areas (Song et al. 2011). Next, another mechanism would result in the adjustment of numbers of neurons in the related thalamic nuclei as non-linear functions of the numbers of neurons in each sensory cortical area, which although similar across thalamic nuclei are not identical possibly due to interactions between each thalamic nucleus and the respective subcortical afferents that are known to affect thalamic size and number of neurons (Finlay et al. 1986). Considering that the majority of synaptic inputs to the thalamus are cortical in origin (Casagrande et al. 2005), it is plausible to expect the number of cortical neurons to influence the scaling of the number of neurons in thalamic nuclei at the same time as these are affected by their subthalamic afferents. Numbers of neurons in different sensory thalamic nuclei might therefore be determined jointly by numbers of sensory and cortical afferents in a manner that leads to similar, but not identical, scaling relationships between each thalamus and the related sensory cortex. In contrast, numbers of neurons in the SC and IC seem to be determined by mechanisms that are coordinated across the two structures, but that are dissimilar in how numbers of neurons in each of them scale with the related thalamic and cortical areas.
Interestingly, the relatively large primary cortical representation of the visual system compared to the auditory representation that we observe here is not unique to primates. In rodents, V1 represents about 12 % of the cortical surface in the squirrel (Campi and Krubitzer 2010), which is about the same percentage that we find here in primates, and is similar to that reported by Frahm et al. (1984) for several non-hominoid species. Campi and Krubitzer (2010) propose that the larger relative size of V1 in the squirrel (12 %) than in the rat (8 %) is due to lifestyle, since the former are diurnal and the latter nocturnal. Applying different analyses to the same datasets, both Frahm et al. (1984) and Barton (2007) also found that diurnal primates tend to have larger visual cortices than nocturnal primates. However, here we find no remarkable differences between the relative size of V1 or its relative number of neurons compared to the entire cortical grey matter across nocturnal (Otolemur) and diurnal (Callithrix) primates. Disambiguation between lifestyle and phylogeny will require a much larger sample of numbers of V1 neurons, but it is nevertheless remarkable that the relative size and number of cortical neurons in V1 is so similar across the present species.
Finally, an issue that remains to be examined regarding the scaling of numbers of neurons across visual structures is the remarkably small relative size of V1 in much larger primate brains such as the gorilla (in which V1 represents 3.5 % of the grey matter cortical volume) and humans (in which V1 represents only 1.5 % of the grey matter; Frahm et al. 1984; similar values obtained by combining V1 volumes in De Sousa et al. 2010 and grey matter volumes in Rilling and Insel 1999). It is unlikely that such a relatively small V1 still contains over one-third of the cortical neurons, as found here. It is possible that, for functional reasons related directly to increasing cortical size, V1 simply fails to increase in absolute size above a certain limit in much larger brains, and thus decreases in relative size compared to the cerebral cortex in gorillas and humans (Kaas 2000). It will therefore be interesting to determine how numbers of neurons in the entire, combined visual areas of the cortex, scale across hominoid and non-hominoid primates, despite the much reduced relative size of V1 in these brains.
Acknowledgments
This research was supported by a grant from the NIH NS 16446 to JHK, and by grants from CNPq, Faperj, and the James S. McDonnell Foundation to SHH. This is publication number 1225 from the Duke University Lemur Center.
Contributor Information
C. E. Collins, Department of Psychology, Vanderbilt University, Nashville, TN, USA
D. B. Leitch, Graduate Program in Neuroscience, Vanderbilt University, Medical Center, Nashville, TN, USA
P. Wong, Department of Psychology, Vanderbilt University, Nashville, TN, USA
J. H. Kaas, Department of Psychology, Vanderbilt University, Nashville, TN, USA
Suzana Herculano-Houzel, Email: suzanahh@gmail.com, Instituto de Ciências Biomédicas, Federal University of Rio de, Janeiro, Rua Carlos Chagas Filho, 373, CCS-sala F1-001, Ilha do Fundão, Rio de Janeiro, RJ 21941-902, Brazil. Instituto Nacional de Neurociência Translacional, Rio de Janeiro, Brazil.
References
- Allman JM. Evolving brains. WH Freeman and Co; New York: 1999. [Google Scholar]
- Andrews TJ, Halpern SD, Purves D. Correlated size variations in human visual cortex, lateral geniculate nucleus, and optic tract. J Neurosci. 1997;17:2859–2868. doi: 10.1523/JNEUROSCI.17-08-02859.1997. [DOI] [PMC free article] [PubMed] [Google Scholar]
- Barton RA. Visual specialization and brain evolution in primates. Proc Roy Soc Lond B. 1998;265:1933–1937. doi: 10.1098/rspb.1998.0523. [DOI] [PMC free article] [PubMed] [Google Scholar]
- Barton RA. Binocularity and brain evolution in primates. Proc Natl Acad Sci USA. 2004;101:10113–10115. doi: 10.1073/pnas.0401955101. [DOI] [PMC free article] [PubMed] [Google Scholar]
- Barton RA. Evolutionary specialization in mammalian cortical structure. J Evol Biol. 2007;20:1504–1511. doi: 10.1111/j.1420-9101.2007.01330.x. [DOI] [PubMed] [Google Scholar]
- Barton RA, Harvey PH. Mosaic evolution of brain structure in mammals. Nature. 2000;405:1055–1058. doi: 10.1038/35016580. [DOI] [PubMed] [Google Scholar]
- Campi KL, Krubitzer L. Comparative studies of diurnal and nocturnal rodents: differences in lifestyle result in alterations in cortical field size and number. J Comp Neurol. 2010;518:4491–4512. doi: 10.1002/cne.22466. [DOI] [PMC free article] [PubMed] [Google Scholar]
- Casagrande V, Kaas JH. The afferent, intrinsic, and efferent connections of primary visual cortex in primates. In: Peters A, Rockland K, editors. Cerebral cortex, vol 10, primary visual cortex in primates. Plenum Press; New York: 1994. pp. 201–259. [Google Scholar]
- Casagrande V, Norton T. Lateral geniculate nucleus: a review of its physiology and function. In: Levelthal A, editor. Vision and visual dysfunction, vol 4: The Neural basis of visual function. MacMillan Press; London: 1991. pp. 41–84. [Google Scholar]
- Casagrande V, Royal DA, Sáry G. Extra-retinal inputs and feedback mechanisms to the lateral geniculate nucleus (LGN) In: Kremers J, editor. The primate visual system: a comparative approach. Wiley; Chichester: 2005. pp. 191–211. [Google Scholar]
- Caviness VS, Jr, Nowakowski RS, Bhide PG. Neocortical neurogenesis: morphogenetic gradients and beyond. Trends Neurosci. 2009;32:443–450. doi: 10.1016/j.tins.2009.05.003. [DOI] [PMC free article] [PubMed] [Google Scholar]
- Collins CE, Airey DC, Young NA, Leitch DB, Kaas JH. Neuron densities vary across and within cortical areas in primates. Proc Natl Acad Sci USA. 2010;107:15927–15932. doi: 10.1073/pnas.1010356107. [DOI] [PMC free article] [PubMed] [Google Scholar]
- De Sousa AA, Sherwood CC, Mohlberg H, Amunts K, Schleicher A, MacLeod CE, Hof PR, Frahm H, Zilles K. Hominoid visual brain structure volumes and the position of the lunate sulcus. J Hum Evol. 2010;58:281–291. doi: 10.1016/j.jhevol.2009.11.011. [DOI] [PubMed] [Google Scholar]
- Finlay BL, Darlington RB. Linked regularities in the development and evolution of mammalian brains. Science. 1995;268:1578–1584. doi: 10.1126/science.7777856. [DOI] [PubMed] [Google Scholar]
- Finlay BL, Sengelaub DR, Berian CA. Control of cell number in the developing mammalian visual system. Prog Neurobiol. 1986;32:207–234. doi: 10.1016/0301-0082(89)90017-8. [DOI] [PubMed] [Google Scholar]
- Finlay BL, Franco ECS, Yamada ES, Crowley JC, Parsons M, Muniz JAPC, Silveira LCL. Number and topography of cones, rods and optic nerve axons in New and Old World primates. Vis Neurosci. 2008;25:289–299. doi: 10.1017/S0952523808080371. [DOI] [PubMed] [Google Scholar]
- Frahm H, Stephan H, Baron G. Comparison of brain structure volumes in insectivora and primates. V. Area Striata (AS) J Hirnforsch. 1984;25:537–557. [PubMed] [Google Scholar]
- Gabi M, Collins CE, Wong P, Torres LB, Kaas JH, Herculano-Houzel S. Cellular scaling rules for the brains of an extended number of primate species. Brain Behav Evol. 2010;76:32–44. doi: 10.1159/000319872. [DOI] [PMC free article] [PubMed] [Google Scholar]
- Grove EA, Fukuschi-Shimogori T. Generating the cerebral cortical area map. Annu Rev Neurosci. 2003;26:355–380. doi: 10.1146/annurev.neuro.26.041002.131137. [DOI] [PubMed] [Google Scholar]
- Heesy CP. On the relationship between orbit orientation and binocular visual field overlap in mammals. Anat Rec. 2004;281A:1104–1110. doi: 10.1002/ar.a.20116. [DOI] [PubMed] [Google Scholar]
- Herculano-Houzel S. Brains matter, bodies maybe not: the case for examining neuron numbers irrespective of body size. Ann NY Acad Sci. 2011;1225:191–199. doi: 10.1111/j.1749-6632.2011.05976.x. [DOI] [PubMed] [Google Scholar]
- Herculano-Houzel S, Lent R. Isotropic fractionator: a simple, rapid method for the quantification of total cell and neuron numbers in the brain. J Neurosci. 2005;25:2518–2521. doi: 10.1523/JNEUROSCI.4526-04.2005. [DOI] [PMC free article] [PubMed] [Google Scholar]
- Herculano-Houzel S, Collins CE, Wong P, Kaas JH. Cellular scaling rules for primate brains. Proc Natl Acad Sci USA. 2007;104:3562–3567. doi: 10.1073/pnas.0611396104. [DOI] [PMC free article] [PubMed] [Google Scholar]
- Herculano-Houzel S, Collins CE, Wong P, Kaas JH, Lent R. The basic non-uniformity of the cerebral cortex. Proc Natl Acad Sci USA. 2008;105:12593–12598. doi: 10.1073/pnas.0805417105. [DOI] [PMC free article] [PubMed] [Google Scholar]
- Herculano-Houzel S, Ribeiro PFM, Campos L, da Silva AV, Torres LB, Catania KC, Kaas JH. Updated neuronal scaling rules for the brains of Glires (rodents/lagomorphs) Brain Behav Evol. 2011;78:302–314. doi: 10.1159/000330825. [DOI] [PMC free article] [PubMed] [Google Scholar]
- Kaas JH. Organizing principles of sensory representations. Novartis Found Symp. 2000;228:188–198. doi: 10.1002/0470846631.ch13. [DOI] [PubMed] [Google Scholar]
- Kaskan PM, Franco ECS, Yamada ES, de Lima Silveira LC, Darlington RB, Finlay BL. Peripheral variability and central constancy in mammalian visual system evolution. Proc R Soc B. 2005;272:91–100. doi: 10.1098/rspb.2004.2925. [DOI] [PMC free article] [PubMed] [Google Scholar]
- Kirk EC. Visual influences on primate encephalization. J Hum Evol. 2006;51:76–90. doi: 10.1016/j.jhevol.2006.01.005. [DOI] [PubMed] [Google Scholar]
- Mullen RJ, Buck CR, Smith AM. NeuN, a neuronal specific nuclear protein in vertebrates. Development. 1992;116:201–211. doi: 10.1242/dev.116.1.201. [DOI] [PubMed] [Google Scholar]
- Rilling JK, Insel TR. The primate neocortex in comparative perspective using magnetic resonance imaging. J Hum Evol. 1999;37:191–223. doi: 10.1006/jhev.1999.0313. [DOI] [PubMed] [Google Scholar]
- Rockel AJ, Hiorns RW, Powell TP. The basic uniformity in structure of the neocortex. Brain. 1980;103:221–244. doi: 10.1093/brain/103.2.221. [DOI] [PubMed] [Google Scholar]
- Roe AW, Pallas SL, Hahm JO, Sur M. A map of visual space induced in primary auditory cortex. Science. 1990;250:818–820. doi: 10.1126/science.2237432. [DOI] [PubMed] [Google Scholar]
- Rubenstein JLR, Shimamura K, Martinez S, Puelles L. Regionalization of the prosencephalic neural plate. Annu Rev Neurosci. 1998;21:445–477. doi: 10.1146/annurev.neuro.21.1.445. [DOI] [PubMed] [Google Scholar]
- Schnupp JW, King AJ. Coding for auditory space in the nucleus of the brachium of the inferior colliculus in the ferret. J Neurophysiol. 1997;78:2717–2731. doi: 10.1152/jn.1997.78.5.2717. [DOI] [PubMed] [Google Scholar]
- Sherwood CC, Raghanti MA, Stimpson CD, Bonar CJ, de Sousa AA, Preuss TM, Hof PR. Scaling of inhibitory interneurons in areas v1 and v2 of anthropoid primates as revealed by calcium-binding protein immunohistochemistry. Brain Behav Evol. 2007;69:176–195. doi: 10.1159/000096986. [DOI] [PubMed] [Google Scholar]
- Shulz H-D. Thesis. Johann Wolfgang Goethe-Universitaet; Frankfurt: 1967. Metrische Untersuchungen an den Schichten des Corpus Geniculatum Laterale tag- und Nachtaktiven Primaten. [Google Scholar]
- Song C, Schwarzkopf DS, Kanai R, Rees G. Reciprocal anatomical relationship between primary sensory and prefrontal cortices in the human brain. J Neurosci. 2011;31:9472–9480. doi: 10.1523/JNEUROSCI.0308-11.2011. [DOI] [PMC free article] [PubMed] [Google Scholar]
- Stephan H, Frahm H, Baron G. New and revised data on volumes of brain structures in insectivores and primates. Folia Primatol. 1981;35:1–29. doi: 10.1159/000155963. [DOI] [PubMed] [Google Scholar]
- Stevens CF. An evolutionary scaling law for the primate visual system and its basis in cortical function. Nature. 2001;411:193–195. doi: 10.1038/35075572. [DOI] [PubMed] [Google Scholar]
- Von Melchner L, Pallas SL, Sur M. Visual behaviour mediated by retinal projections directed to the auditory pathway. Nature. 2000;404:871–876. doi: 10.1038/35009102. [DOI] [PubMed] [Google Scholar]
- Wong P, Peebles JK, Asplund CL, Collins CE, Herculano-Houzel S, Kaas JH. Faster scaling of auditory neurons in cortical areas relative to subcortical structures in primates. 2012. (submitted) [DOI] [PubMed] [Google Scholar]