

This study addresses the mechanisms by which CHOP directs gene regulatory networks and determines cell fate. Transcriptional expression of ATF5 is activated by both CHOP and ATF4 in the integrated stress response. CHOP and ATF5 control a switch to activate apoptotic genes and decrease cell survival in response to loss of proteostatic control.
Abstract
Environmental stresses that disrupt protein homeostasis induce phosphorylation of eIF2, triggering repression of global protein synthesis coincident with preferential translation of ATF4, a transcriptional activator of the integrated stress response (ISR). Depending on the extent of protein disruption, ATF4 may not be able to restore proteostatic control and instead switches to a terminal outcome that features elevated expression of the transcription factor CHOP (GADD153/DDIT3). The focus of this study is to define the mechanisms by which CHOP directs gene regulatory networks that determine cell fate. We find that in response to proteasome inhibition, CHOP enhances the expression of a collection of genes encoding transcription regulators, including ATF5, which is preferentially translated during eIF2 phosphorylation. Transcriptional expression of ATF5 is directly induced by both CHOP and ATF4. Knockdown of ATF5 increases cell survival in response to proteasome inhibition, supporting the idea that both ATF5 and CHOP have proapoptotic functions. Transcriptome analysis of ATF5-dependent genes reveals targets involved in apoptosis, including NOXA, which is important for inducing cell death during proteasome inhibition. This study suggests that the ISR features a feedforward loop of stress-induced transcriptional regulators, each subject to transcriptional and translational control, which can switch cell fate toward apoptosis.
INTRODUCTION
Protein homeostasis is influenced by the synthesis, folding, trafficking, and degradation of proteins (Powers et al., 2009; Ron and Harding, 2012). Cells recognize disruption of protein homeostasis and induce regulatory networks that remediate loss of proteostatic control. The unfolded protein response (UPR) is an important example of a regulatory network that responds to disruptions in protein homeostasis in the endoplasmic reticulum (ER; Walter and Ron, 2011). Perturbations in calcium homeostasis, redox status, and protein turnover can disrupt the ER, leading to accumulation of misfolded proteins that activate the UPR, consisting of translational and transcriptional control networks that serve to expand the protein-processing capacity of the ER (Schroder and Kaufman, 2005; Walter and Ron, 2011). Central to the UPR is an ER transmembrane protein kinase, PERK (EIF2AK3/PEK), which is believed to sense accumulating misfolded proteins in the ER lumen, triggering repression of protein synthesis by phosphorylation of the α subunit of eIF2 (Wek and Cavener, 2007; Baird and Wek, 2012; Walter and Ron, 2011). Translational control limits influx of newly synthesized proteins into the ER, preventing further ER overload. Phosphorylation of eIF2α (eIF2α∼P) is not unique to ER stress, as activation of three other eIF2α kinases, GCN2 (EIF2AK4), HRI (EIF2AK1), and PKR (EIF2AK2), occurs in response to diverse stress conditions that can affect protein homeostasis in the cytoplasm (Chen, 2007; Wek and Cavener, 2007; Baird and Wek, 2012). In a sense these translational changes are believed to act as a “shut-off valve,” which would prevent further organelle stress and cellular damage (Wek and Cavener, 2007; Papa, 2012).
Coincident with dampening of global translation, eIF2α∼P leads to preferential translation of select mRNAs, such as that encoding ATF4 (Harding et al., 2000; Vattem and Wek, 2004). ATF4 is a basic zipper (bZIP) transcription activator of genes involved in protein folding and assembly, metabolism and nutrient uptake, and antioxidation, which together can serve to remedy stress damage (Harding et al., 2003). The eIF2α∼P/ATF4 pathway has been termed the integrated stress response (ISR) because diverse stress conditions that elicit eIF2α∼P converge on a common target, ATF4 (Harding et al., 2003). The ISR shares core features with eIF2α∼P and the general amino acid control pathway in budding yeast (Hinnebusch, 2005). In mammalian cells, however, eIF2α∼P leads to preferential translation of a collection of different genes. In addition to ATF4, eIF2α∼P enhances the translation of CHOP (GADD153/DDIT3) and ATF5 that encode bZIP transcription factors and ultimately a protein phosphatase 1c–targeting subunit encoded by GADD34 (PPP1R15A), which facilitates feedback dephosphorylation of eIF2α∼P (Watatani et al., 2008; Zhou et al., 2008; Lee et al., 2009; Palam et al., 2011; Walter and Ron, 2011). There are two alternatively spliced ATF5 transcripts, with ATF5α being the predominant version, which is expressed postnatally and is subject to enhanced translation in response to eIF2α∼P (Hansen et al., 2002; Watatani et al., 2008; Zhou et al., 2008).
Although the ISR is critical for alleviating damage accrued during acute stress, the eIF2α∼P response can instead switch to a terminal outcome during periods of extended environmental challenge (Tabas and Ron, 2011). This dual nature of the ISR during endoplasmic reticulum stress has been referred to as a “binary switch” (Oslowski and Urano, 2010). Among ISR genes, CHOP is considered a precipitator of stress-induced apoptosis. The underlying mechanisms by which the eIF2∼P/ATF4/CHOP pathway can signal cell death are not well understood. It is suggested that chronic stress leads to protracted and elevated levels of CHOP protein, which can achieve a threshold of activity invoking a network of gene expression favoring apoptosis (Rutkowski et al., 2006; Tabas and Ron, 2011). CHOP is suggested to facilitate cell death through regulation of genes that are central for the control of apoptosis. For example, CHOP is suggested to repress the transcriptional expression of the prosurvival gene BCL2 (McCullough et al., 2001). BCL2 can enhance survival by sequestration of BH3-only proteins, including BIM and PUMA, which are important for BAX-BAK–mediated permeabilization of the mitochondrial membrane, facilitating subsequent release of cytochrome C and apoptosis (Youle and Strasser, 2008). Furthermore, CHOP has been reported to tilt the balance between these BCL2 member proteins toward apoptosis by directly enhancing BIM expression (Puthalakath et al., 2007). Other mechanisms by which CHOP is suggested to trigger apoptosis are by inducing expression of GADD34, which can prematurely enhance protein synthesis during chronic stresses, and increasing ERO1α levels, which can induce cytotoxic reactive oxygen species during prolonged ER stress (Novoa et al., 2001; Harding et al., 2003; Marciniak et al., 2004).
The focus of this study is on the mechanisms by which CHOP and the ISR can control cell survival in response to alterations in protein homeostasis. Of particular interest are transcriptome changes directed by CHOP in response to disruptions in protein degradation, a potent inducer of eIF2α∼P and the ISR, and how these gene expression changes can affect cell survival. We find that CHOP can induce expression of genes favoring remediation of stress damage, as well as those signaling apoptosis. Of interest, central to the changes in the transcriptome directed by CHOP is the finding that CHOP enhances the expression of many additional transcription factors that comprise additional “nodes” of a transcription network that reinforce and amplify stress responses. Included among these CHOP-targeted transcription factors is ATF5, which we show is a direct downstream target of CHOP and ATF4. ATF5 serves to potentiate CHOP-dependent apoptosis in response to inhibition of proteasome inhibition and other disruptions of protein homeostasis. This study places CHOP upstream of a network of transcriptional regulators in the ISR pathway and identifies new target genes of ATF5 that mediate the apoptotic response to stress.
RESULTS
CHOP is required for expression of additional transcriptional regulators in the ISR
Elevated and sustained levels of CHOP protein are suggested to adversely affect cell fates in response to disruptions in protein homeostasis. With this in mind, we measured changes in the transcriptome by microarray analysis in wild-type (WT) and CHOP−/− mouse embryonic fibroblast (MEF) cells upon treatment with 1 μM MG132 for 8 h. MG132 is a proteasome inhibitor and potent pharmacological inducer of eIF2α∼P and CHOP expression (Jiang and Wek, 2005). In response to MG132 treatment, 8321 genes as defined by probe sets were significantly changed (Table 1). Among these genes, 3316 (39.8%) were found to be CHOP dependent, with 1520 genes enhanced (42%) and 1796 genes lowered (38%) in response to proteasome inhibition. These findings are also illustrated in Figure 1A, which features a scatter-plot analysis of stress-induced transcriptome changes in WT cells (x axis) versus CHOP−/− cells (y-axis). The CHOP requirement for changes in the transcriptome is supported by the large number of probe sets that were increased in the WT cells on stress but induced to a lesser extent in CHOP−/- cells.
TABLE 1:
Genes regulated by CHOP in response to treatment with MG132.
| Fold change (treated/untreated)a | |||||
|---|---|---|---|---|---|
| Dependence | Total | >1.0 | ≥2.0 | <1.0 | ≤0.5 |
| Total MG132 | 8321b | 3607 | 695 | 4714 | 966 |
| CHOP-dependent MG132 (%) | 3316c (39.8)d | 1520 (42.1) | 332 (47.7) | 1796 (38.1) | 350 (36.2) |
aExpression profile summary of gene transcripts, as defined by probe sets, that were significantly changed (p ≤ 0.05) after treatment with 1 μM MG132 for 8 h. The number of induced genes is shown for both >1.0-fold and ≥2.0-fold thresholds. The repressed genes are also shown for <1.0- and ≤0.5-fold thresholds.
bTranscripts significantly changed (p ≤ 0.05) by proteasome inhibition.
cThe number of CHOP-dependent transcripts that were significantly changed by proteasome inhibition.
dNumbers in parentheses are the percentage of CHOP-dependent genes compared with the total gene expression changed in response to MG132 treatment.
FIGURE 1:
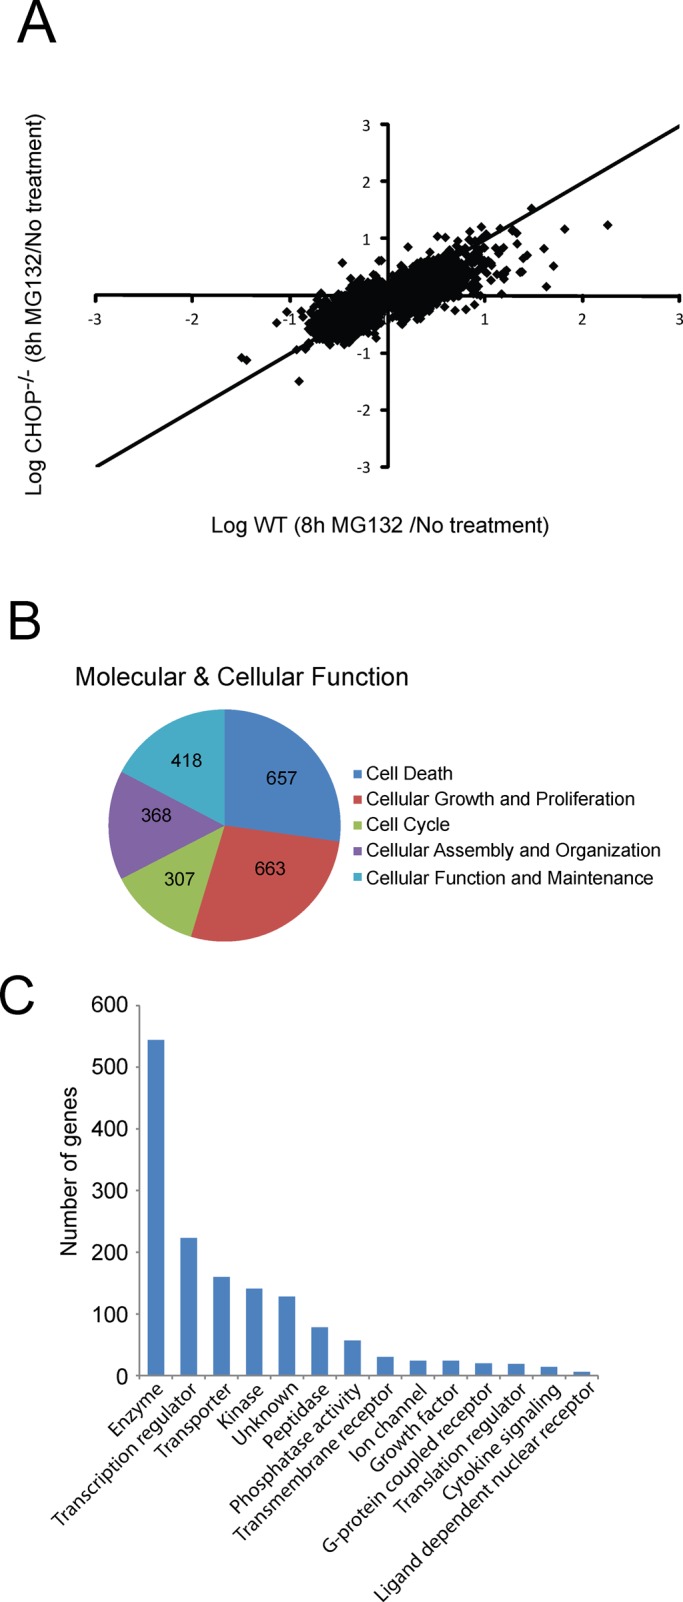
Genome-wide analysis of CHOP-dependent genes regulated by proteasome inhibition. (A) The scatter plot is the log ratio of WT (x-axis) and CHOP−/− MEF cells (y-axis) treated with 1 μM MG132 for 8 h versus no stress. This comparative analysis of gene transcripts illustrates all significant probe sets (p < 0.05) induced or repressed upon MG132 treatment. (B) Pie charts generated by IPA analysis, which highlight functional classes of CHOP-dependent genes. (C) IPA comparison of CHOP-dependent genes classified by role in cells.
Pathway analysis of the CHOP-dependent genes was performed using Ingenuity Pathway Analysis (IPA) software to group the target genes into functional categories. The top functional groups are depicted in Figure 1B, where CHOP-dependent gene networks are found to be associated with a range of molecular and cellular functions in the categories of cell death, cellular growth and proliferation, cell cycle, and cellular assembly, organization, and maintenance. These results suggest that although CHOP-targeted genes participate in cell death, they can also play a role in a diverse set of cellular functions (Figure 1C). CHOP-dependent genes include HSPA1A and DNAJA4 involved in protein folding, NOXA, APAF1, and GAS5 involved in cell death, and 223 genes involved in regulation of transcription, including MLF1, ATF7IP2, and ATF5. This collection of transcription factors is highlighted in Table 2, and an expanded list of all 223 genes is provided in Supplemental Table S1.
TABLE 2:
Functional classes of genes requiring CHOP for full induction in response to proteasome inhibition.
| Probe IDa | Gene name | Gene symbol | Fold-NT (WT/KO)b | Fold-MG132 (WT/KO)c |
|---|---|---|---|---|
| Transcription factor | ||||
| 1417516_at | C/EBP-homologous protein | CHOP | 2.8 | 19.5 |
| 1416967_at | SRY-box–containing gene 2 | SOX2 | 9.6 | 13.9 |
| 1418271_at | Basic helix-loop-helix family, member e22 | BHLHE22 | 2.8 | 6.6 |
| 1440275_at | Runt-related transcription factor 3 | RUNX3 | 7.7 | 4.4 |
| 1421469_a_at | Signal transducer and activator of transcription 5A | STAT5A | 3.1 | 3.4 |
| 1416981_at | Forkhead box O1 | FOXO1 | 3.7 | 2.9 |
| 1427938_at | c-Myc–binding protein | MYCBP | 1.4 | 2.2 |
| 1425927_a_at | Activating transcription factor 5 | ATF5 | 3.6 | 1.8 |
| 1418589_a_at | Myeloid leukemia factor 1 | MLF1 | 2.1 | 2.5 |
| 1427603_at | Activating transcription factor 7 interacting protein 2 | ATF7IP2 | 2.2 | 6.4 |
| Translation initiation | ||||
| 1435904_at | Eukaryotic translation initiation factor 2C, 3 | EIF2C3 | 1.9 | 1.9 |
| Apoptosis | ||||
| 1418203_at | Phorbol-12-myristate-13-acetate–induced protein 1 | NOXA | 2.5 | 3.3 |
| 1436222_at | Growth arrest specific 5 | GAS5 | 2.8 | 2.1 |
| 1435448_at | BCL2-like 11 (apoptosis facilitator) | BIM | 0.7 | 1.3 |
| Phosphatase activity | ||||
| 1429514_at | Phosphatidic acid phosphatase type 2B | PPAP2B | 33.7 | 21.6 |
| 1415834_at | Dual-specificity phosphatase 6 | DUSP6 | 0.5 | 2.3 |
| 1448325_at | Myeloid differentiation primary response gene 116 | GADD34 | 1.6 | 1.4 |
| 1455728_at | Phosphatase and tensin homologue | PTEN | 1.9 | 1.2 |
| Protein folding | ||||
| 1419625_at | Heat shock protein 1A | HSPA1A | 2.7 | 3.0 |
| 1434196_at | DnaJ (Hsp40) homologue, subfamily A, member 4 | DNAJA4 | 1.1 | 2.7 |
| 1426260_a_at | UDP glycosyltransferase 1 family, polypeptide A6 | UGT1A6 | 4.2 | 7.2 |
| 1455346_at | Mannan-binding lectin serine peptidase 1 | MASP1 | 3.3 | 3.7 |
| Cytokine signaling | ||||
| 1451798_at | Interleukin 1 receptor antagonist | IL1RN | 9.0 | 12.8 |
| 1417625_s_at | Chemokine (C-X-C motif) receptor 7 | CXCR7 | 1.9 | 5.6 |
| 1436861_at | Interleukin 7 | IL7 | 1.7 | 2.1 |
| Miscellaneous | ||||
| 1421001_a_at | Carbonic anhydrase 6 | CAR6 | 2.7 | 24.9 |
| 1436555_at | Solute carrier family 7, member 2 | SLC7A2 | 3.3 | 4.5 |
| 1434714_at | ERO1-like β (Saccharomyces cerevisiae) | ERO1LB | 1.7 | 2.4 |
| 1424048_a_at | Cytochrome b5 reductase 1 | CYB5R1 | 1.1 | 1.8 |
| 1418599_at | Collagen, type XI, alpha 1 | COL11A1 | 5.9 | 3.9 |
| 1417421_at | S100 calcium-binding protein A1 | S100A1 | 4.1 | 3.6 |
| 1443250_at | Regulator of G protein signaling 2 | RGS2 | 1.0 | 1.9 |
| Fatty acid synthesis | ||||
| 1439478_at | Acyl-CoA thioesterase 2 | ACOT2 | 2.1 | 11.5 |
| 1424097_at | ELOVL family member 7, elongation of long-chain fatty acids | ELOVL7 | 8.7 | 7.8 |
aAffymetrix Mouse 430 2.0 array, probe set identifier.
bMean fluorescence intensity fold difference between WT and CHOP−/− cells, no treatment (NT).
cMean fluorescence intensity fold difference between WT and CHOP−/− cells, MG132 (8 h).
ATF5 was among the CHOP-dependent genes, and based on microarray data, the ATF5 transcript was 3.6-fold higher in the WT cells under basal conditions and 1.8-fold in stressed conditions when compared with CHOP−/− cells (Table 2). These results suggest that CHOP is required for ATF5 mRNA synthesis in both basal and stressed conditions. We previously reported that ATF5 was subject to preferential translation in response to eIF2α∼P (Zhou et al., 2008), and we elected to characterize the transcriptional activation and biological significance of ATF5 as a new CHOP target gene.
CHOP is required for transcriptional expression of ATF5 and binds to CARE elements in the ATF5 promoter
The importance of CHOP for induced ATF5 mRNA in the ISR was further analyzed by using quantitative PCR (qPCR) and RNA prepared from the WT and CHOP−/− cells. In response to treatment with MG132, there was a 1.5-fold increase in ATF5 mRNA levels in WT cells, whereas in CHOP−/− cells the amount of ATF5 transcript was reduced ∼50% upon proteasome inhibition (Figure 2A). The CHOP requirement for increased ATF5 mRNA was also seen when these MEF cells were treated with thapsigargin, which elicits ER stress and eIF2α∼P due to calcium disruption in this organelle (Figure 2B). In WT cells, there was a fourfold in increase in ATF5 mRNA, which was significantly lowered in CHOP−/− cells. As expected, CHOP mRNA levels were dramatically increased in WT cells during either stress arrangement, and there were no detectable CHOP transcripts in the CHOP−/− cells (Figure 2, A and B). In further controls, we found that CHOP was required for full induction of GADD34 mRNA and repression of the prosurvival BCL2 gene during the ISR (Figure 2A), consistent with earlier reports (McCullough et al., 2001; Marciniak et al., 2004). Supporting the idea that ATF4 is an upstream activator of CHOP transcription in the ISR, the amount of ATF4 mRNA was enhanced in either WT or CHOP−/− cells exposed to MG132 or thapsigargin. In fact, the ATF4 transcripts were further elevated in the stressed CHOP-deficient cells (Figure 2, A and B), suggesting that there is an extended ISR response with loss of expression of CHOP and its downstream target gene GADD34, which is required for feedback control of the ISR. Together these results indicate that CHOP is required for increased ATF5 mRNA in response to different stress conditions that activate the ISR, with the measured dose of the ER stress agent thapsigargin triggering the greatest enhancement of ATF5 mRNA levels compared with MG132 treatment.
FIGURE 2:

CHOP is required for enhanced ATF5 mRNA levels. WT or CHOP−/− MEF cells were treated with 1 μM MG132 (A) or 1 μM thapsigargin (TG; B) for 8 h, and the levels of ATF4, CHOP, ATF5, and GADD34 mRNAs were determined by qPCR. *Statistical significance (p < 0.05) with respect to the untreated control. #Significant difference (p < 0.05) between cell types. n.d., not detectable.
Potential CHOP-binding elements are situated in the ATF5 promoter from the base pair −2500 to −3000 region relative to the ATF5 transcriptional start site. These binding sites, termed CARE elements, can be placed in either orientation (Pan et al., 2007; Kilberg et al., 2009), and in the ATF5 promoter these were designated CARE-1 (5′-TGATGGAAA-3′) and CARE-2 (5′-TGATGCAAC-3′; Figure 3A). We therefore carried out chromatin immunoprecipitation (ChIP) analyses to measure ATF4 and CHOP occupancy on the ATF5 promoter at these CARE sites. Both CHOP and ATF4 were found to associate with DNA including the CARE-2 element (designated P2) in the ATF5 promoter, with significantly enhanced binding in response to MG132 (Figure 3B) or thapsigargin treatment (Figure 3C). By contrast, there was only modest binding of ATF4 and CHOP to the CARE-1 segment (designated P1), which is predicted to be a suboptimal CHOP-binding site due to a G in position 6 (Bruhat et al., 2002; Zhong et al., 2003). The third site tested is located in an exon (designated P3) and was used as a negative control. As expected, there was minimal ATF4 or CHOP binding at the P3 site in the presence or absence of the stresses (Figure 2, B and C). Finally, no signal was detected using a nonspecific immunoglobulin G (IgG) in the ChIP assay (Figure 2B). Enhanced binding of ATF4 and CHOP was also found specifically at the P2 site upon treatment with tunicamycin, which elicits ER stress by impairing N-glycosylation in this organelle (Supplemental Figure S1). These results support the idea that both CHOP and ATF4 bind directly to the ATF5 promoter to facilitate increased transcription in response to diverse stress conditions that elicit the ISR.
FIGURE 3:

CHOP facilitates transcriptional activation of ATF5 by binding to CARE elements in the ATF5 promoter. (A) Diagram of potential CARE sequences present in the ATF5 promoter region, as determined by in silico analysis. The values −2.5 and −3.0 kb are relative to the transcriptional start site. Cells were treated with MG132 (B), thapsigargin (TG; C), or no treatment (NT), and chromatin immunoprecipitation was performed with antibodies specific for ATF4, CHOP, or nonspecific IgG as a negative control. qPCR was performed, and the enrichment relative to input DNA is shown for each of three genomic regions. The regions amplified by primer sets P1 and P2 include the possible CARE sequences, whereas the primer set designated P3 amplified a region located in exon 3 that does not contain a CARE site and serves as a negative control.
CHOP is required for ATF5 protein expression during diverse stress conditions
Because expression of ATF5 is also regulated at the level of mRNA translation, it was important to determine whether CHOP was required for increased ATF5 protein. WT and CHOP−/− MEF cells were treated with MG132 for up to 24 h, and the levels of eIF2α∼P and downstream ISR effectors, ATF4 and CHOP proteins, were enhanced early, within 1–3 h of proteasome inhibition (Figure 4A). As expected, no CHOP protein was detected in the CHOP−/− cells, whereas induction of ATF4 protein and another ISR transcription factor, ATF3, were largely unaffected. ATF5 protein was increased within 3 h of treatment of WT cells with MG132, but there were significantly lowered levels of ATF5 in the CHOP−/− cells, with only modest amounts of ATF5 protein after 12 h of proteasome inhibition.
FIGURE 4:

CHOP is required for ATF5 protein expression in response to proteasome inhibition. (A) WT and CHOP−/− MEF cells were treated with 1 μM MG132 for up to 24 h as indicated. Time 0 indicates no stress treatment. Levels of eIF2α∼P, eIF2α, ATF4, CHOP, ATF3, ATF5, caspase-3 (CASP-3 and the cleaved version), cleaved PARP, and actin were determined by immunoblot analysis using antibody specific to the protein of interest. (B) CHOP−/− cells and those stably expressing CHOP from an FRT locus were exposed to 1 μM MG132 for up to 24 h. Levels of CHOP, ATF4, ATF5, and actin proteins were determined by immunoblot analysis. Levels of ATF5 (C) and GADD34 (D) mRNAs were measured by qPCR in WT, CHOP−/−, and rescued CHOP−/− cells that were stably expressing CHOP. Cells were treated with 1 μM MG132 for up to 12 h or not treated (NT). (E) HEPA1-6 cells stably expressing a control scrambled (Scr) shRNA or a CHOP-targeted shRNA were treated with 1 μM MG132 for 8 h. In lanes 3–5, the RNA Consortium (TRC) ID number indicates the last two digits for the validated CHOP-targeted shRNA identification number obtained from Sigma-Aldrich. Levels of CHOP, ATF5, and actin proteins were determined by immunoblot analysis. (F) WT and CHOP−/− MEF cells were treated for 24 h with 1 μM MG132 or no treatment (NT) and subjected to FACS analyses using annexin V–FITC/PI staining. *Statistical significance (p < 0.05) compared with the untreated control. #Significant difference (p < 0.05) between WT and CHOP−/− cell types.
Stable expression of CHOP into the CHOP−/− MEF cells significantly enhanced ATF5 protein levels in response to MG132 treatment but did not appreciably alter induced expression of the upstream ATF4 (Figure 4B). Of interest, the rescue of CHOP expression in the CHOP−/− MEF cells led to elevated levels of ATF5 mRNA even in the absence of proteasome inhibition (Figure 4C). By contrast, expression of the ISR target gene GADD34 showed induced transcript levels in the rescued CHOP−/− cells in response to MG132 treatment that were comparable to WT cells (Figure 4D). These results support the idea that elevated levels of CHOP can be sufficient for induced ATF5 mRNA, and the subsequent enhancement of ATF5 protein requires preferential translation triggered by eIF2α∼P. Finally, to address whether CHOP is required for enhanced ATF5 expression in other cell types, we used a lentiviral system and short hairpin RNA (shRNA) to stably knock down CHOP expression in mouse liver Hepa1-6 cells subjected to proteasome inhibition. Using stable transfectants derived from three different validated shRNAs, we found that lowered CHOP levels in the Hepa1-6 cells led to reduced expression of ATF5 protein upon treatment with MG132 (Figure 4E).
Given that eIF2α∼P and the ISR are induced by many different stress conditions, we also addressed whether CHOP facilitates increased ATF5 protein in response to treatment with thapsigargin, arsenite, or histidinol (Supplemental Figure S2, A–C). In each stress condition, there was a significant diminishment and delay in the induction of ATF5 protein in the CHOP−/− cells as compared with WT. These results support the idea that CHOP is required for full induction of ATF5 expression in the ISR during different stress conditions and in multiple cell types.
CHOP and ATF5 facilitate apoptosis during proteasome inhibition
CHOP has a potent proapoptotic function in the ISR during extended stress arrangements. This is illustrated by the observation that although cleavage of PARP, a marker of apoptosis, was present in WT cells after 24 h of MG132 exposure, there was minimal detected cleaved PARP in CHOP−/− cells (Figure 4A). Furthermore, cleavage of caspase 3 was reduced during this stress regimen upon loss of CHOP. Consistent with the idea that CHOP can facilitate cell death in response to cellular stresses, CHOP−/− cells showed significantly lower levels of apoptosis during MG132 treatment as compared with WT cells (Figure 4F). Reduced amounts of cleaved caspase 3 and PARP were also seen in the CHOP−/− cells upon thapsigargin and arsenite treatments (Supplemental Figure S2, A and B), supporting the notion that CHOP can signal apoptosis during different chronic stresses.
Having established that ATF5 expression was dependent on CHOP, we next wanted to investigate the role of ATF5 in cell survival during stress. To achieve this goal, we used a lentiviral delivery system and shRNA to stably knock down ATF5 in MEF cells. Using a collection of different shRNAs, we were able to achieve 50–72% knockdown of the ATF5 transcripts compared with no significant difference in knockdown in the scramble control (Figure 5A). Two cell lines, designated ATF5-KD1 and ATF5-KD2, with the highest percentage knockdown of ATF5 mRNA (58 and 72%, respectively) were selected for further characterization. The amount of ATF5 protein in these knockdown cells was also sharply lowered after up to 24 h of MG132 treatment (Figure 5B). Supporting the idea that ATF4 and CHOP proteins are upstream activators of ATF5 expression, the levels of ATF4 and CHOP upon exposure to MG132 were similar between WT cells and the ATF5-knockdown cells (Figure 5B)
FIGURE 5:

ATF5 facilitates apoptosis in response to proteasome inhibition. (A) RNA was isolated from MEF cells stably expressing a scrambled shRNA or an ATF5-targeted shRNA, and ATF5 mRNA levels were determined by qPCR relative to non-shRNA–expressing control. The ID number indicates the last two digits for the shRNA. The percentages of ATF5 knockdown were determined relative to a non-shRNA–expressing control. (B) WT, ATF5-KD1, and ATF5-KD2 MEF cells were treated with MG132 for the indicated time points. Levels of ATF4, CHOP, ATF5, cleaved caspase-9, cleaved caspase-3, cleaved PARP, and actin proteins were measured by immunoblot analysis using specific antibodies. (C) Cell treatment regimen for the data shown in D. Cells were cultured with 1 μM MG132 for 0, 1, 3, 6, 12, or 18 h as indicated by the black bars, and after the stress treatment, cells were cultured in the absence of MG132, as indicated by the gray bars, for a total of 24 h. (D) Measurements of survival of WT, CHOP−/−, ATF5-KD1, and ATF5-KD2 MEF cells were determined by the MTT assay, and the percentage of cell survival is normalized to the untreated controls for each cell type.
The role of ATF5 in the control of cell survival was addressed by treating WT and the ATF5 knockdown cells with proteasome inhibitor, followed by the MTT assay to measure cell viability. WT, CHOP−/−, ATF5-KD1, and ATF5-KD2 cells were exposed to MG132 for between 1 and 18 h as outlined in Figure 5C. After each stress time point, fresh medium with no drug was added, and cells were allowed to recover from the stress insult for the remainder of the time course (total 24 h). Both the ATF5-KD1 and ATF5-KD2 cell lines showed enhanced survival at each time point of MG132 exposure compared with WT cells (Figure 5D). The increased survival of the ATF5-knockdown cells was similar to that determined for CHOP−/− cells. Furthermore, there were significantly lowered levels of cleaved caspase 3 and PARP in the ATF5-KD1 and ATF5-KD2 cells treated with MG132 as compared with WT (Figure 5B). These results support the idea that both CHOP and ATF5 facilitate apoptosis during perturbations in protein homeostasis.
ATF5 is required for activation of proapoptotic target genes in response to proteasome inhibition
To determine the transcriptome changes directed by ATF5 transcription factor and its possible effect on the regulation of apoptosis, we carried out a microarray analysis of WT and ATF5-KD2 cells treated with MG132 or no stress. A total of 8055 genes as defined by probe sets were significantly changed in response to MG132 treatment (Table 3). Among these genes, 3075 (38%) were dependent on ATF5, with 1714 (45%) increased and 1361 (32%) reduced. We again used IPA software to analyze the functional classes of ATF5-dependent genes, which are depicted in Figure 6A. The ATF5-dependent gene network is associated with some different functional classes when compared with the networks characterized for CHOP-dependent genes. Classes of the ATF5-dependent gene network included genes involved in protein synthesis, protein degradation, and gene expression (Figure 6A), as well as those linked with cancers and hematological system development and function. We compared the set of genes requiring ATF5 for full induction with our previous microarray data set of CHOP-dependent genes and found 348 genes that were dependent on both CHOP and ATF5 (Figure 6B). Among these genes were those involved in protein folding, including HSPA1A and DNAJA4, transcriptional regulators ATF7IP2 and MLF1, and proapoptotic genes GAS5 and NOXA (Figure 6C). There were also 1366 genes regulated by ATF5 but independent of CHOP, including APAF1 and TXNIP, involved in apoptosis and the inflammatory response, respectively. Therefore, concerning the roles of ATF5 and CHOP in the ISR-directed transcriptome, there are genes that are ATF5 dependent or CHOP dependent and those requiring both transcription factors for full induction in response to MG132 treatment. We confirmed by qPCR several of the key findings in this microarray data set (Figure 7A). Furthermore, we confirmed by qPCR and immunoblot that ATF5 mRNA and protein are depleted in the ATF5-KD2 cells and the upstream CHOP expression is unaffected (Figures 5B and 7A).
TABLE 3:
Genes regulated by ATF5 in response to treatment with proteasome inhibition.
| Fold change (treated/untreated)a | |||||
|---|---|---|---|---|---|
| Dependence | Total | >1.0 | ≥2.0 | <1.0 | ≤0.5 |
| Total MG132 | 8055b | 3833 | 69 | 4222 | 72 |
| ATF5-dependent MG132 (%) | 3075c (38.1)d | 1714 (44.7) | 52 (75.3) | 1361 (32.2) | 41 (56.9) |
aExpression profile summary of gene transcripts, as defined by probe sets that were significantly changed (p ≤ 0.05) during treatment with 1 μM MG132 for 8 h. The number of induced genes is shown for both >1.0-fold and ≥2.0-fold thresholds. The repressed genes are also shown for <1.0- and <0.5-fold thresholds.
bThe total number of transcripts significantly changed (p ≤ 0.05) by proteasome inhibition.
cThe number of ATF5-dependent transcripts that were significantly changed by proteasome inhibition.
dNumbers in parentheses are the percentage of CHOP-dependent genes compared with the total gene expression changed in response to MG132 treatment.
FIGURE 6:

Genome-wide analysis of gene expression indicates that ATF5 is required for activation of proapoptotic target genes. Results from a microarray analysis of WT and ATF5-KD2 cells treated with MG132 or no stress indicated those genes that significantly required ATF5 for full induction in response to proteasome inhibition. These ATF5-target genes were then analyzed for functional groupings and compared with those genes determined in our microarray analysis to be statistically dependent on CHOP for full induction in response to MG132 treatment. (A) Pie charts generated by IPA analysis, highlighting functional classes of ATF5-dependent genes. (B) Venn diagram indicating the number of genes that required only CHOP for full induction response to MG132 treatment, those genes dependent on both CHOP and ATF5, and genes dependent on only ATF5. (C) Comparative bar graph showing that GADD34 required only CHOP for full induction in response to proteasome inhibition, examples of genes whose induction showed a statistically significant dependence on both CHOP and ATF5, and those genes requiring only ATF5; values represent mean fluorescence intensity (MFI) in WT and ATF5-KD2 cells upon MG132 treatment or no treatment (NT).
FIGURE 7:
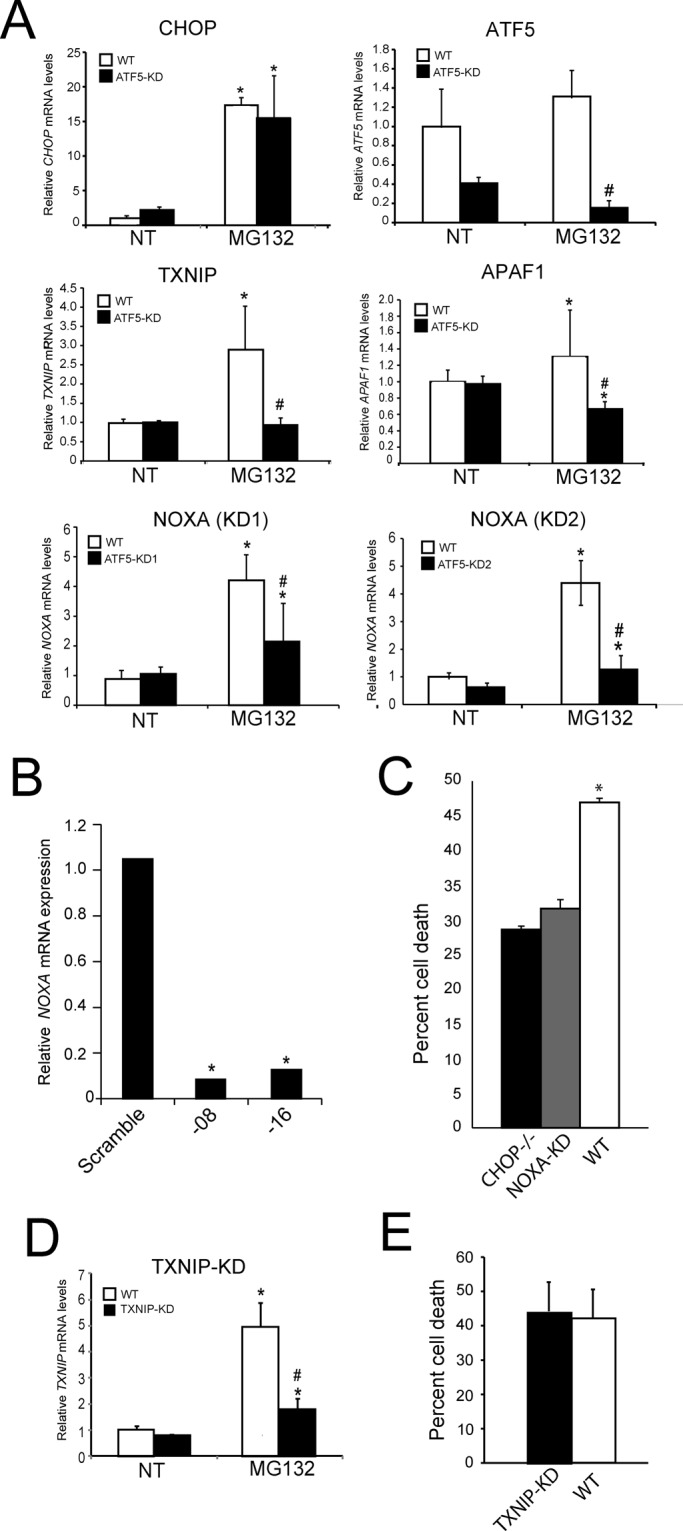
shRNA knockdown of NOXA protects cells from stress induced by MG132 treatment. (A) WT and ATF5-KD2 MEF were treated with 1 μM MG132 for 8 h or no treatment (NT). The mRNA levels for CHOP, ATF5, NOXA, TXNIP, and APAF1 were measured by qPCR. In addition, NOXA mRNA was measured in ATF5-KD1 cells as indicated. *Statistical significance (p < 0.05) with respect to the untreated control. #Difference between cell types. (B) MEF cells expressing an shRNA targeting NOXA or scramble control were treated for 8 h with MG132. The last two digits in the validated shRNA identification number are listed. Relative NOXA mRNA levels were measured by qPCR. *Statistical significance (p < 0.05). (C) WT, CHOP−/−, and NOXA-KD MEF cells were treated with 1 μM MG132 for 24 h, and cell death was determined as the percentage of viable cells as measured by MTT assay upon MG132 treatment compared with untreated controls. (D) WT and TXNIP-KD MEF cells were treated with 1 μM MG132 for 12 h, and the relative level of TXNIP mRNA was measured by qPCR. (E) Death of WT and TXNIP-KD cells was measured as the percentage of viable cells as determined by MTT assays after 24 h of MG132 treatment compared with untreated controls.
ATF5 was required for full mRNA induction of several known proapoptotic genes, including NOXA (PMAIP1), APAF1, and TXNIP (Figure 7A). TXNIP is an example of the ATF5-specific genes reported to be involved in inflammation. ATF5 was recently reported to facilitate increased expression of thioredoxin-interacting protein (TXNIP) during ER stress, and knockdown of TXNIP was found to alleviate inflammation and subsequent apoptosis in pancreatic beta cells (Lerner et al., 2012; Oslowski et al., 2012). By comparison, induction of GADD34 mRNA in response to MG132 was not significantly altered upon knockdown of ATF5, highlighting this gene as an example of a CHOP-specific gene that can facilitate apoptosis during chronic stress (Figure 6C). NOXA is a BH3-only member of the BCL2 family previously shown to be important for activation of apoptosis in response to ER stress (Wang et al., 2009). We found that NOXA mRNA levels were increased in an ATF5- and CHOP-dependent manner in our microarray data sets (Figure 6C and Table 2). Of importance, NOXA transcripts were diminished as judged by qPCR in both ATF5-KD1 and ATF5-KD2 cells lines treated with MG132 as compared with WT cells (Figure 7A). These results suggest that ATF5 and CHOP are nodes in an ISR transcription factor network that participate in the cellular decision to invoke apoptosis during extended disruptions in protein homeostasis.
The ATF5 target gene NOXA is required for increased apoptosis in response to proteasome inhibition
To address the role of ATF5- and CHOP-target gene NOXA in the regulation of cell survival during proteasome inhibition, we used shRNA to knock down NOXA mRNA in MEF cells. NOXA knockdown was confirmed by qPCR, with substantial reductions in NOXA mRNA levels in both of the shRNA-expressing cell lines (Figure 7B). The MEF cells depleted for NOXA expression were treated with MG132 for 24 h and found to significantly enhance cell viability, as judged by the MTT assay. The increase in cell viability was comparable to that determined for the CHOP−/− cells, further supporting the idea that NOXA is an important target for the ISR (Figure 7C). Knockdown of TXNIP by shRNA significantly lowered the induction of TXNIP mRNA in response to MG132 but did not alter survival of the MEF cells (Figure 7, D and E). These results support a model in which ATF5 is an apoptotic transcriptional regulator downstream of CHOP that facilitates apoptosis by enhanced NOXA expression.
DISCUSSION
This study characterized the mechanisms by which CHOP directs gene regulatory networks that determine cell fate. In response to proteasome inhibition, CHOP induces the expression of a collection of transcription regulators, including ATF5 (Figure 1, Table 2, and Supplemental Table S1). Transcriptional expression of ATF5 is suggested to be directly activated by CHOP and ATF4 (Figure 3), coincident with preferential translation of ATF5 in response to eIF2α∼P (Zhou et al., 2008). Like CHOP, ATF5 functions to enhance apoptosis during perturbations in protein homeostasis (Figure 5). Microarray analysis revealed that an ATF5-dependent gene, NOXA, is important for inducing cell death during proteasome inhibition (Figures 6 and 7; Fernandez et al., 2005; Qin et al., 2005; Wang et al., 2009). This study indicates that CHOP and the ISR activate a network of transcriptional regulators featuring ATF5, which triggers apoptosis upon disturbances in protein homeostasis.
The ISR features a network of transcription factors with a feedforward loop that controls cell fate
This study describes three transcriptional factors in the ISR with a network of interactions featuring a feedforward loop (Figure 8). Transcriptional expression of each transcription factor node—ATF4, CHOP, and ATF5—is increased during proteasome inhibition. ATF4 enhances CHOP and ATF5 mRNA levels, whereas CHOP facilitates the induction of ATF5 transcripts (Figure 8). We do not fully understand the underlying processes by which the transcriptional expression of ATF4 is enhanced in the ISR, but eIF2α∼P is suggested to be a contributing factor (Lu et al., 2004). ATF4 and CHOP bind the CARE-2 site in the ATF5 promoter, a finding that is also supported by a recent ChIP-Seq analysis of ATF4- and CHOP-binding sites in MEF cells during tunicamycin treatment (Han et al., 2013). There was appreciable ATF4 and CHOP association at the CARE-2 in the absence of stress, suggesting that there can be some binding of these transcription factors at the ATF5 promoter even when ATF4 and CHOP are not easily measured by immunoblot analysis. Indeed ATF4−/− MEF cells are prone to oxidative stress (Harding et al., 2003), suggesting that even basal levels of ATF4 contribute to the health of cells. Binding of ATF4 and CHOP at the CARE-1 site in the ATF5 promoter was modest, albeit detectable, with some additional binding upon MG132. This suggests that there can be some association of these transcription factors at the suboptimal CARE-1 site. An alternative explanation is that even with aggressive sonication in the ChIP analysis there is the potential of ATF4- and CHOP-precipitated DNA containing both sequences, which are separated by ∼500 base pairs.
FIGURE 8:
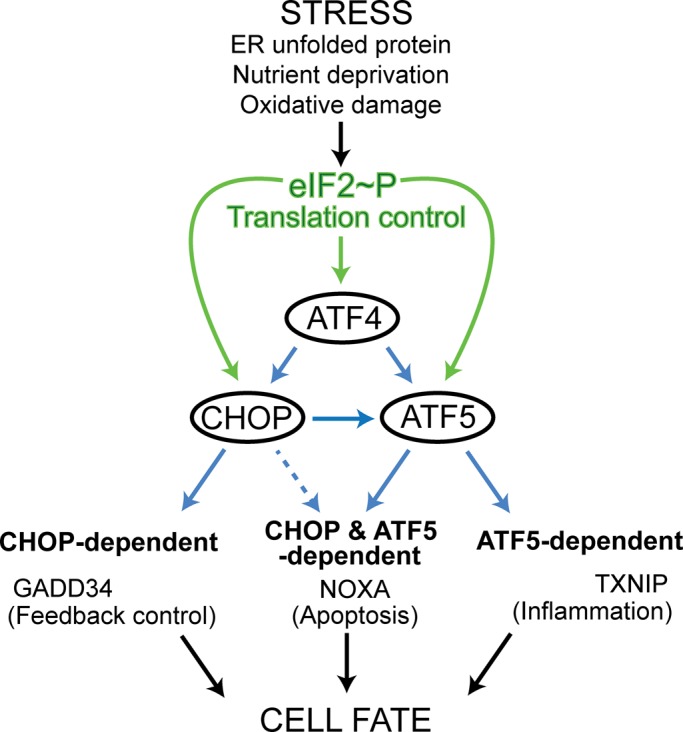
The ISR features a network of ATF4, CHOP, and ATF5 transcription factors in a feedforward loop that controls cell fate. Different stress conditions that disrupt protein homeostasis induce phosphorylation of eIF2, leading to enhanced expression of the bZIP transcription factors ATF4, CHOP, and ATF5 through increased translation, as indicated by the green arrows. ATF4 and CHOP bind the ATF5 promoter and serve to enhance the transcription of ATF5, and CHOP and ATF5, individually or in combination, induce the transcription of target genes (blue arrows). These target gene products affect feedback control, apoptosis, and inflammation, which together can determine cell fate. ATF4 may also serve as a direct contributor to the transcription of some of these target genes, as illustrated by the finding that ATF4, as well as CHOP, can directly bind to the GADD34 promoter to promote transcription (Ma and Hendershot, 2003; Marciniak et al., 2004; Kilberg et al., 2012).
Overexpression of CHOP in the CHOP−/− cells led to elevated levels of ATF5 mRNA even the absence of stress (Figure 4C). This suggests that although ATF4 and CHOP bind directly to the ATF5 promoter, CHOP may be sufficient for induced ATF5 transcription, at least when CHOP is highly expressed. In this regard, regulation of ATF5 transcription follows the pattern of dynamic binding of bZIP transcription factors, such as ATF4 and CHOP, which has been described for the promoters of other ISR target genes (Kilberg et al., 2009). Accompanying this transcriptional mode of regulation, ATF4, CHOP, and ATF5 mRNAs are preferentially translated in response to eIF2α∼P (Figure 8). Therefore with chronic disruptions of protein homeostasis there can be high levels of uninterrupted eIF2α∼P, which will amplify the levels of each transcription factor to a proposed threshold that switches the ISR to a terminal outcome. Heterodimerization with other bZIP transcription factors, posttranslational modifications, and subcellular localization can also contribute to the biological functions of ATF4, CHOP, and ATF5 (Yang et al., 2004; Wei et al., 2008; Chiribau et al., 2010; Liu et al., 2012).
The ISR network of transcription factors can induce the expression of three classes of target genes (Figure 8). The first group is dependent on only the ATF5 transcription factor. Included among the ATF5-specific genes is TXNIP. Elevated levels of TXNIP during certain ER stress conditions can dampen the function of thioredoxins, increasing reactive oxygen species and enhancing caspase-1 cleavage and interleukin-1b production through TXNIP binding to the NLRP3 inflammasome, which together can trigger caspase-3 cleavage and death of pancreatic β-cells (Lerner et al., 2012; Oslowski et al., 2012). ATF5 levels are sharply reduced in the absence of CHOP, suggesting that the promoters of genes targeted solely by ATF5 have a higher affinity for this transcription factor. In addition, shRNA-directed knockdown of TXNIP did not alter survival of MEF cells treated with MG132 (Figure 7, D and E), suggesting that differences in cell types and stress conditions can alter the signaling pathways regulating cell survival. The second group includes CHOP-specific genes, exemplified by GADD34, which functions to dephosphorylate eIF2α∼P in feedback control of the ISR (Figure 8). CHOP induction of GADD34 expression is suggested to lower cell survival during chronic stress, as premature resumption of protein synthesis can lead to further protein misfolding and aggregation (Marciniak et al., 2004). The third group features genes requiring both CHOP and ATF5 for full expression (Figure 8). This codependence may be the consequence of CHOP facilitating elevated expression of ATF5 protein in response to proteasome inhibition, aiding the binding of this transcription factor to the promoters of targeted genes. Alternatively, CHOP and ATF5 could activate gene expression by jointly associating at target promoters. Included among this third group is NOXA, which can induce apoptosis during stresses, such as proteasome inhibition (Fernandez et al., 2005; Qin et al., 2005; Wang et al., 2009). NOXA can bind and inhibit the BCL2 prosurvival family member MCL1, which facilitates permeabilization of the mitochondrial membrane, release of cytochrome C, and activation of the apoptosome complex and cleavage of caspases 3/9 (Ploner et al., 2008; Youle and Strasser, 2008). In addition, ATF5 facilitates expression of APAF1 (Figure 7), a key regulator of the apoptosome and apoptosis (Youle and Strasser, 2008). Therefore CHOP and ATF5 control expression of multiple regulators of the intrinsic pathway of apoptosis in response to disruptions in protein homeostasis, with the overarching theme of induction of proapoptotic factors and repression of those facilitating survival.
Biological roles of ATF5
ATF5 mRNA was first identified in sensory neurons during embryonic development of the olfactory epithelium and vomeronasal organs, suggesting a role for ATF5 in olfactory neuron differentiation (Lee et al., 2009). Elevated ATF5 mRNA has also been observed in gliobastomas and other selected tumors, and it was suggested that ATF5 expression, which is diminished after neural development, can be restored upon cancer differentiation (Angelastro et al., 2005; Greene et al., 2009). These studies suggested that ATF5 is a significant contributor to proliferation of certain cancers. In other cell types, however, ATF5 was reported to reduce cell viability (Shringarpure et al., 2006; Ploner et al., 2008; Wei et al., 2008). In this way ATF5 may contribute to either cell survival or death, depending on the cell type, developmental stage, or stress condition. Our study indicates that CHOP and ATF5 can selectively target genes that adversely affect cells upon disruption of protein homeostasis. An important question for future studies is whether eIF2α∼P and the ISR also contribute to ATF5 expression and its functions in cell fate during neural development and tumorigenesis.
MATERIALS AND METHODS
Cell culture and lentivirus shRNA knockdown
WT and CHOP−/− MEF cells, described previously (Zinszner et al., 1998; Jiang and Wek, 2005), were grown in DMEM (4.5 g/l glucose) and maintained at 37°C in an atmosphere of 5% CO2 and 95% air. Cells were cultured to ∼60–70% confluence so that the cells were still in a growth phase at the onset of the experiment. Mouse hepatoma cell line Hepa1-6 was also cultured in DMEM (4.5 g/l glucose). Cultured cells were treated with 1 μM MG132, 1 μM thapsigargin, 2 μM tunicamycin, 5 mM histidinol, or 20 μM sodium arsenite, as indicated. Specific experimental details regarding length of treatments are provided in the figure legends. Knockdown of CHOP, ATF5, NOXA, and TXNIP were carried out using a lentivirus delivery system featuring the Addgene third-generation series of plasmids and validated mission shRNA TRC clones (Sigma-Aldrich, St. Louis, MO) for generating lentivirus particles. The shRNAs used in the study are as follows: ATF5, TRCN0000075554, TRCN0000075555, TRCN0000075556, and TRCN0000075557; CHOP, TRCN0000305677, TRCN0000103707, and TRCN0000103706; NOXA, TRNC0000009708 and TRNC0000011816; TXNIP, TRNC0000181578. WT MEF cells or Hepa1-6 cells were transduced by replacing growth media with lentivirus-containing media. Transduced cells were then selected in the presence of puromycin, and the shRNA-expressing cells were expanded and used for experiments. To rescue expression in CHOP−/− MEF cells, a CHOP cDNA, which was devoid of an upstream open reading frame that is important for translational control, was inserted by site-directed recombination into a single FRT site introduced in the CHOP-deficient cells.
Microarray analysis
From WT and CHOP−/− MEF cells treated with 1 μM MG132 for 8 h or no stress, total RNA was extracted using TRIzol reagent following the manufacturer's instructions for adherent cells. RNA was purified using an RNeasy Kit (Qiagen, Valencia, CA). Array hybridization was carried out as previously described (Teske et al., 2011b). Briefly, RNA was labeled using the Affymetrix protocol for 3′-IVT arrays (Affymetrix, Santa Clara, CA), and labeled cRNA was hybridized for 17 h to Affymetrix mouse 430 2.0 arrays. Signal values and detection calls were derived using the MAS5 algorithm in Affymetrix GeneChip Operating Software. Probe sets were eliminated from further analysis if an absent call was determined in >50% of the samples in both the WT treated/untreated. These filtered data were imported into Partek Genomics Suite (Partek, St. Louis, MO), and hierarchical clustering and principal components analysis were used to detect any outlier arrays; none were found. Drug treatment significance was determined by t test, and genes were considered significantly changed if the p < 0.05 in the WT samples. CHOP dependence was further defined from within this set of genes with p ≤ 0.05 between the WT and CHOP−/− cells treated with 1 μM MG132 for 8 h or no stress, and the fold change of the drug-treated WT CHOP−/− samples was >1.0. Alternatively, RNA was purified from WT and ATF5-KD2 cells treated with 1 μM MG132 for 8 h or no stress. Total RNA was labeled using the Ambion WT Expression kit (Life Technologies, Carlsbad, CA), followed by the Affymetrix GeneChip WT Terminal labeling kit and hybridized to an Affymetrix Mouse 1.0 ST array. CEL files were imported into Partek Genomics Suite. RMA signals were generated for the core probe sets using the RMA background correction, quantile normalization, and summarization by median polish. Summarized signals for each probe set were log 2 transformed. Venn diagrams were created with the help of an online Venn diagram program (Venny) available at the following link: bioinfogp.cnb.csic.es/tools/venny/. CHOP- and ATF5-dependent gene expression was also analyzed using Ingenuity Pathway Analysis software package (Ingenuity Systems, Redwood City, CA). Microarray data are deposited in Gene Expression Omnibus (www.ncbi.nlm.nih.gov/geo/) under the series number GSE43716. The following link was created to allow review of microarray data: www.ncbi.nlm.nih.gov/geo/query/acc.cgi?token=xfyxlqseyyqkmtm&acc=GSE43716.
Immunoblot blot analyses
Cellular lysates were prepared from cultured cells using RIPA-buffered solution containing 50 mM Tris-HCl (pH 7.9), 150 mM sodium chloride, 1% Nonidet P-40, 0.1% SDS, 100 mM sodium fluoride, 17.5 mM β-glycerophosphate, 0.5% sodium deoxycholate, and 10% glycerol supplemented with EDTA-free protease inhibitor cocktail tablet (Roche, Indianapolis, IN) and then separated by electrophoresis in SDS–polyacrylamide gels. Antibodies for eIF2α∼P (Ser-51) (9721, 1:500 dilution), cleaved caspase-3 (9661, 1:1000 dilution), and PARP (9542, 1:1000 dilution) were purchased from Cell Signaling Technology (Beverly, MA). Monoclonal antibody that recognizes total eIF2α (dilution 1:500) was provided by Scot Kimball (College of Medicine, Pennsylvania State University, Hershey, PA). CHOP/GADD153 (sc-7351, 1:500 dilution), and ATF3 (sc-1888, 1:500 dilution) antibodies were purchased from Santa Cruz Biotechnology (Santa Cruz, CA). Actin antibody (A5441, 1:1000 dilution) was from Sigma-Aldrich. Secondary antibodies were purchased from Bio-Rad (Hercules, CA). ATF4 (1:500 dilution) and ATF5 (1:300 dilution) antibodies were prepared and affinity purified as previously described (Zhou et al., 2008). Autoradiography or the Odyssey infrared imaging system (LI-COR Biosciences, Lincoln, NE) was used in conjunction with the enhanced chemiluminescence method for antibody detection as described (Teske et al., 2011a). Densitometric measurements (integrated density) were taken in Photoshop (Adobe, San Diego, CA) using a scanned image >600 dpi that was inverted for histogram analyses. Background measurements were also recorded and subtracted from final measurements.
Reverse transcription and real-time PCR
Total RNA was extracted from MEF cells using TRIzol reagent (Life Technologies, Grand Island, NY) following the manufacturer's instructions for adherent cells. Levels of the indicated mRNAs were determined by qPCR. Reverse transcription was carried out using 1 μg each of the RNA preparations and the High-Capacity cDNA Reverse Transcription Kit (Applied Biosystems, Foster City, CA) according to the manufacturer's instructions. Primers for SYBR Green detection of cDNAs are listed in Supplemental Table S2. Amplification and detection were performed on the LightCycler 480 (Roche) or the Realplex2 Master Cycler (Eppendorf, Hauppauge, NY). All measurements were recorded in biological and technical triplicates and normalized to β-actin mRNA. Results were obtained by the comparative Ct method and are expressed as fold change with respect to the untreated control.
Cell survival assays
The CellTiter 96 Non-Radioactive Cell Proliferation Assay (Promega, Madison, WI) was used for measuring cell survival. This assay was performed in a 96-well plate format and read on a 96-well plate reader at a wavelength of 570 nm. Initially, 5000 cells were plated in 50 μl of DMEM supplemented with 10% fetal bovine serum, penicillin (100 IU/ml), and streptomycin (100 μg/ml). After overnight incubation and cells adhered to the bottom of the wells, a final concentration of 1 μM MG132, or media control, was added to each well. Cells were incubated in the presence of the MG132 for 1, 3, 6, 12, or 18 h or no treatment. At the indicated times, the medium containing MG132 was removed by gentle aspiration with a 0.5- to 10-μl pipette tip, and cells were then washed with warm media and then cultured in media without stress for a total 24 h from the time of the onset of treatment with MG132. For example, the cells treated with MG312 for 1 h were washed and then cultured in the absence of this stress agent for 23 h. After 24 h, 15 μl of MTT dye solution was added to a final volume of 115 μl and then incubated with the cells for 4 h, followed by the addition of 100 μl of solubilization solution, as described by the manufacturer's protocol. The absorbance of the solution was then measured at 570 nm using a Spectra Max 340 96-well plate reader from Molecular Devices (Sunnyvale, CA).
Cell survival was also measured by fluorescence-activated cell sorting (FACS) using fluorescein isothiocyanate (FITC)–annexin V (556419; BD Biosciences, San Diego, CA) and propidium iodide (PI; BD Biosciences) following the manufacturer's instructions. Before treatment, cells were washed with fresh, warm media and new media containing MG132 or no stress agent was added. After 24 h of drug exposure, medium was removed and transferred to a 50-ml conical tube, and cells that remained attached to the plate were trypsinized and transferred to the 50-ml conical tube. Cells were then collected by low-speed centrifugation at 1000 rpm and washed with PBS. Cells were then transferred to a microcentrifuge tube and stained with the addition of 5 μl annexin V dye and 10 μl PI.
ChIP analysis
ChIP assays were performed as described (Chen et al., 2004) with the following minor modifications. About (5–10) × 106 MEF were used per treatment. Cells were cultured in DMEM supplemented with 1× nonessential amino acids, 2 mM glutamine, 100 mg/ml streptomycin sulfate, 100 U/ml penicillin G, 0.25 mg/ml amphotericin B, 10% (vol/vol) fetal bovine serum, and 1 μM 2-mercaptoethanol. Between 12 and 16 h before initiation of stress treatment, cells were given fresh medium and serum to ensure that no nutrient stress took place before the start of experimental incubations. Cells were replenished with the medium containing 2 μM tunicamycin, 1 μM thapsigargin, or 1 μM MG132 for 12 h. To fragment the chromatin, isolated nuclei were resuspended in 1 ml of lysis buffer and sonicated twice with the Fisher model 100 sonicator with power level at 15 W. Antibodies used are as follows: rabbit anti-ATF4 polyclonal; rabbit anti-GADD153 (CHOP) polyclonal antibody (Santa Cruz Biotechnology), and normal rabbit IgG (Santa Cruz Biotechnology). DNA enrichment was analyzed with real time qPCR with a DNA Engine Opticon 3 system (Bio-Rad, Hercules, CA) and detection with SYBR Green. The reaction mixtures with 2 μl of purified DNA, 10 μl of SYBR Green master mixture, and 5 pmol each of forward and reverse primers in a total volume of 20 μl were incubated at 95°C for 15 min, followed by amplification at 95°C for 15 s and 60°C for 60 s for 35 cycles. The primers used are listed in Supplemental Table S2. All experiments were performed in triplicate. Results are described as the ratio to a portion of total input DNA.
Supplementary Material
Acknowledgments
We acknowledge support from National Institutes of Health Grant GM049164 and the Showalter Research Trust (R.C.W), Predoctoral Fellowship T32DK064466 and the American Heart Association 11PRE7240012 (B.F.T.), and National Institutes of Health Grants DK92062 and DK94729 (M.S.K.). We thank Reddy Palam for creating the CHOP−/− cells stably rescued with the CHOP cDNA. The microarray analyses were carried out in conjunction with the Center for Medical Genomics at the School of Medicine, Indiana University.
Abbreviations used:
- CARE
C/EBP-ATF response element
- ChIP
chromatin immunoprecipitation
- eIF2α∼P
phosphorylation of eIF2α∼P
- ER
endoplasmic reticulum
- ISR
integrated stress response
- MEF
mouse embryonic fibroblast
- qPCR
quantitative PCR
- shRNA
short hairpin RNA
- UPR
unfolded protein response
- WT
wild type
Footnotes
This article was published online ahead of print in MBoC in Press (http://www.molbiolcell.org/cgi/doi/10.1091/mbc.E13-01-0067) on June 12, 2013.
REFERENCES
- Angelastro JM, Mason JL, Ignatova TN, Kukekov VG, Stengren GB, Goldman JE, Greene LA. Downregulation of activating transcription factor 5 is required for differentiation of neural progenitor cells into astrocytes. J Neurosci. 2005;25:3889–3899. doi: 10.1523/JNEUROSCI.3447-04.2005. [DOI] [PMC free article] [PubMed] [Google Scholar]
- Baird TD, Wek RC. Eukaryotic initiation factor 2 phosphorylation and translational control in metabolism. Adv Nutr. 2012;3:307–321. doi: 10.3945/an.112.002113. [DOI] [PMC free article] [PubMed] [Google Scholar]
- Bruhat A, Averous J, Carraro V, Zhong C, Reimold AM, Kilberg MS, Fafournoux P. Differences in the molecular mechanisms involved in the transcriptional activation of the CHOP and asparagine synthetase genes in response to amino acid deprivation or activation of the unfolded protein response. J Biol Chem. 2002;277:48107–48114. doi: 10.1074/jbc.M206149200. [DOI] [PubMed] [Google Scholar]
- Chen C, Pan YX, Dudenhausen EE, Kilberg MS. Amino acid deprivation induces the transcription rate of the human asparagine synthetase gene through a timed program of expression and promoter binding of nutrient-responsive basic region/leucine zipper transcription factors as well as localized histone acetylation. J Biol Chem. 2004;279:50829–50839. doi: 10.1074/jbc.M409173200. [DOI] [PubMed] [Google Scholar]
- Chen JJ. Regulation of protein synthesis by the heme-regulated eIF2alpha kinase: relevance to anemias. Blood. 2007;109:2693–2699. doi: 10.1182/blood-2006-08-041830. [DOI] [PMC free article] [PubMed] [Google Scholar]
- Chiribau CB, Gaccioli F, Huang CC, Yuan CL, Hatzoglou M. Molecular symbiosis of CHOP and C/EBP{beta} isoform LIP contributes to endoplasmic reticulum stress-induced apoptosis. Mol Cell Biol. 2010;30:3722–3731. doi: 10.1128/MCB.01507-09. [DOI] [PMC free article] [PubMed] [Google Scholar]
- Fernandez Y, Verhaegen M, Miller TP, Rush JL, Steiner P, Opipari AW, Jr, Lowe SW, Soengas MS. Differential regulation of noxa in normal melanocytes and melanoma cells by proteasome inhibition: therapeutic implications. Cancer Res. 2005;65:6294–6304. doi: 10.1158/0008-5472.CAN-05-0686. [DOI] [PubMed] [Google Scholar]
- Greene LA, Lee HY, Angelastro JM. The transcription factor ATF5: role in neurodevelopment and neural tumors. J Neurochem. 2009;108:11–22. doi: 10.1111/j.1471-4159.2008.05749.x. [DOI] [PMC free article] [PubMed] [Google Scholar]
- Han J, et al. ER-stress-induced transcriptional regulation increases protein synthesis leading to cell death. Nat Cell Biol. 2013;15:481–490. doi: 10.1038/ncb2738. [DOI] [PMC free article] [PubMed] [Google Scholar]
- Hansen MB, Mitchelmore C, Kjaerulff KM, Rasmussen TE, Pedersen KM, Jensen NA. Mouse Atf5: molecular cloning of two novel mRNAs, genomic organization, and odorant sensory neuron localization. Genomics. 2002;80:344–350. doi: 10.1006/geno.2002.6838. [DOI] [PubMed] [Google Scholar]
- Harding HP, Novoa I, Zhang Y, Zeng H, Wek R, Schapira M, Ron D. Regulated translation initiation controls stress-induced gene expression in mammalian cells. Mol Cell. 2000;6:1099–1108. doi: 10.1016/s1097-2765(00)00108-8. [DOI] [PubMed] [Google Scholar]
- Harding HP, et al. An integrated stress response regulates amino acid metabolism and resistance to oxidative stress. Mol Cell. 2003;11:619–633. doi: 10.1016/s1097-2765(03)00105-9. [DOI] [PubMed] [Google Scholar]
- Hinnebusch AG. Translational regulation of GCN4 and the general amino acid control of yeast. Annu Rev Microbiol. 2005;59:407–450. doi: 10.1146/annurev.micro.59.031805.133833. [DOI] [PubMed] [Google Scholar]
- Jiang HY, Wek RC. Phosphorylation of the alpha-subunit of the eukaryotic initiation factor-2 (eIF2alpha) reduces protein synthesis and enhances apoptosis in response to proteasome inhibition. J Biol Chem. 2005;280:14189–14202. doi: 10.1074/jbc.M413660200. [DOI] [PubMed] [Google Scholar]
- Kilberg MS, Balasubramanian M, Fu L, Shan J. The transcription factor network associated with the amino acid response in mammalian cells. Adv Nutr. 2012;3:295–306. doi: 10.3945/an.112.001891. [DOI] [PMC free article] [PubMed] [Google Scholar]
- Kilberg MS, Shan J, Su N. ATF4-dependent transcription mediates signaling of amino acid limitation. Trends Endocrinol Metab. 2009;20:436–443. doi: 10.1016/j.tem.2009.05.008. [DOI] [PMC free article] [PubMed] [Google Scholar]
- Lee YY, Cevallos RC, Jan E. An upstream open reading frame regulates translation of GADD34 during cellular stresses that induce eIF2alpha phosphorylation. J Biol Chem. 2009;284:6661–6673. doi: 10.1074/jbc.M806735200. [DOI] [PMC free article] [PubMed] [Google Scholar]
- Lerner AG, et al. IRE1alpha induces thioredoxin-interacting protein to activate the NLRP3 inflammasome and promote programmed cell death under irremediable ER stress. Cell Metab. 2012;16:250–264. doi: 10.1016/j.cmet.2012.07.007. [DOI] [PMC free article] [PubMed] [Google Scholar]
- Liu X, Liu D, Qian D, Dai J, An Y, Jiang S, Stanley B, Yang J, Wang B, Liu DX. Nucleophosmin (NPM1/B23) interacts with activating transcription factor 5 (ATF5) protein and promotes proteasome- and caspase-dependent ATF5 degradation in hepatocellular carcinoma cells. J Biol Chem. 2012;287:19599–19609. doi: 10.1074/jbc.M112.363622. [DOI] [PMC free article] [PubMed] [Google Scholar]
- Lu PD, Jousse C, Marciniak SJ, Zhang Y, Novoa I, Scheuner D, Kaufman RJ, Ron D, Harding HP. Cytoprotection by pre-emptive conditional phosphorylation of translation initiation factor 2. EMBO J. 2004;23:169–179. doi: 10.1038/sj.emboj.7600030. [DOI] [PMC free article] [PubMed] [Google Scholar]
- Ma Y, Hendershot LM. Delineation of a negative feedback regulatory loop that controls protein translation during endoplasmic reticulum stress. J Biol Chem. 2003;278:34864–34873. doi: 10.1074/jbc.M301107200. [DOI] [PubMed] [Google Scholar]
- Marciniak SJ, Yun CY, Oyadomari S, Novoa I, Zhang Y, Jungreis R, Nagata K, Harding HP, Ron D. CHOP induces death by promoting protein synthesis and oxidation in the stressed endoplasmic reticulum. Genes Dev. 2004;18:3066–3077. doi: 10.1101/gad.1250704. [DOI] [PMC free article] [PubMed] [Google Scholar]
- McCullough KD, Martindale JL, Klotz LO, Aw TY, Holbrook NJ. Gadd153 sensitizes cells to endoplasmic reticulum stress by downregulating BcL2 and perturbing the cellular redox state. Mol Cell Biol. 2001;21:1249–1259. doi: 10.1128/MCB.21.4.1249-1259.2001. [DOI] [PMC free article] [PubMed] [Google Scholar]
- Novoa I, Zeng H, Harding HP, Ron D. Feedback inhibition of the unfolded protein response by GADD34-mediated dephosphorylation of eIF2alpha. J Cell Biol. 2001;153:1011–1022. doi: 10.1083/jcb.153.5.1011. [DOI] [PMC free article] [PubMed] [Google Scholar]
- Oslowski CM, et al. Thioredoxin-interacting protein mediates ER stress-induced beta cell death through initiation of the inflammasome. Cell Metab. 2012;16:265–273. doi: 10.1016/j.cmet.2012.07.005. [DOI] [PMC free article] [PubMed] [Google Scholar]
- Oslowski CM, Urano F. A switch from life to death in endoplasmic reticulum stressed beta-cells. Diabetes Obes Metab. 2010;12(Suppl 2):58–65. doi: 10.1111/j.1463-1326.2010.01277.x. [DOI] [PMC free article] [PubMed] [Google Scholar]
- Palam LR, Baird TD, Wek RC. Phosphorylation of eIF2 facilitates ribosomal bypass of an inhibitory upstream ORF to enhance CHOP translation. J Biol Chem. 2011;286:10939–10949. doi: 10.1074/jbc.M110.216093. [DOI] [PMC free article] [PubMed] [Google Scholar]
- Pan YX, Chen H, Thiaville MM, Kilberg MS. Activation of the ATF3 gene through a co-ordinated amino acid-sensing response programme that controls transcriptional regulation of responsive genes following amino acid limitation. Biochem J. 2007;401:299–307. doi: 10.1042/BJ20061261. [DOI] [PMC free article] [PubMed] [Google Scholar]
- Papa FR. Endoplasmic reticulum stress, pancreatic beta-cell degeneration, and diabetes. Cold Spring Harb Perspect Med. 2012;2:a007666. doi: 10.1101/cshperspect.a007666. [DOI] [PMC free article] [PubMed] [Google Scholar]
- Ploner C, Kofler R, Villunger A. Noxa: at the tip of the balance between life and death. Oncogene. 2008;27(Suppl 1):S84–S92. doi: 10.1038/onc.2009.46. [DOI] [PMC free article] [PubMed] [Google Scholar]
- Powers ET, Morimoto RI, Dillin A, Kelly JW, Balch WE. Biological and chemical approaches to diseases of proteostasis deficiency. Annu Rev Biochem. 2009;78:959–991. doi: 10.1146/annurev.biochem.052308.114844. [DOI] [PubMed] [Google Scholar]
- Puthalakath H, et al. ER stress triggers apoptosis by activating BH3-only protein Bim. Cell. 2007;129:1337–1349. doi: 10.1016/j.cell.2007.04.027. [DOI] [PubMed] [Google Scholar]
- Qin JZ, et al. Proteasome inhibitors trigger NOXA-mediated apoptosis in melanoma and myeloma cells. Cancer Res. 2005;65:6282–6293. doi: 10.1158/0008-5472.CAN-05-0676. [DOI] [PubMed] [Google Scholar]
- Ron D, Harding HP. Protein-folding homeostasis in the endoplasmic reticulum and nutritional regulation. Cold Spring Harb Perspect. 2012;4:a013177. doi: 10.1101/cshperspect.a013177. [DOI] [PMC free article] [PubMed] [Google Scholar]
- Rutkowski DT, Arnold SM, Miller CN, Wu J, Li J, Gunnison KM, Mori K, Sadighi Akha AA, Raden D, Kaufman RJ. Adaptation to ER stress is mediated by differential stabilities of pro-survival and pro-apoptotic mRNAs and proteins. PLoS Biol. 2006;4:e374. doi: 10.1371/journal.pbio.0040374. [DOI] [PMC free article] [PubMed] [Google Scholar]
- Schroder M, Kaufman RJ. The mammalian unfolded protein response. Annu Rev Biochem. 2005;74:739–789. doi: 10.1146/annurev.biochem.73.011303.074134. [DOI] [PubMed] [Google Scholar]
- Shringarpure R, et al. Gene expression analysis of B-lymphoma cells resistant and sensitive to bortezomib. Br J Haematol. 2006;134:145–156. doi: 10.1111/j.1365-2141.2006.06132.x. [DOI] [PubMed] [Google Scholar]
- Tabas I, Ron D. Integrating the mechanisms of apoptosis induced by endoplasmic reticulum stress. Nat Cell Biol. 2011;13:184–190. doi: 10.1038/ncb0311-184. [DOI] [PMC free article] [PubMed] [Google Scholar]
- Teske BF, Baird TD, Wek RC. Methods for analyzing eIF2 kinases and translational control in the unfolded protein response. Methods Enzymol. 2011a;490:333–356. doi: 10.1016/B978-0-12-385114-7.00019-2. [DOI] [PubMed] [Google Scholar]
- Teske BF, Wek SA, Bunpo P, Cundiff JK, McClintick JN, Anthony TG, Wek RC. The eIF2 kinase PERK and the integrated stress response facilitate activation of ATF6 during endoplasmic reticulum stress. Mol Biol Cell. 2011b;22:4390–4405. doi: 10.1091/mbc.E11-06-0510. [DOI] [PMC free article] [PubMed] [Google Scholar]
- Vattem KM, Wek RC. Reinitiation involving upstream open reading frames regulates ATF4 mRNA translation in mammalian cells. Proc Natl Acad Sci USA. 2004;101:11269–11274. doi: 10.1073/pnas.0400541101. [DOI] [PMC free article] [PubMed] [Google Scholar]
- Walter P, Ron D. The unfolded protein response: from stress pathway to homeostatic regulation. Science. 2011;334:1081–1086. doi: 10.1126/science.1209038. [DOI] [PubMed] [Google Scholar]
- Wang Q, et al. ERAD inhibitors integrate ER stress with an epigenetic mechanism to activate BH3-only protein NOXA in cancer cells. Proc Natl Acad Sci USA. 2009;106:2200–2205. doi: 10.1073/pnas.0807611106. [DOI] [PMC free article] [PubMed] [Google Scholar]
- Watatani Y, Ichikawa K, Nakanishi N, Fujimoto M, Takeda H, Kimura N, Hirose H, Takahashi S, Takahashi Y. Stress-induced translation of ATF5 mRNA is regulated by the 5′ untranslated region. J Biol Chem. 2008;283:2543–2553. doi: 10.1074/jbc.M707781200. [DOI] [PubMed] [Google Scholar]
- Wei Y, Jiang J, Liu D, Zhou J, Chen X, Zhang S, Zong H, Yun X, Gu J. Cdc34-mediated degradation of ATF5 is blocked by cisplatin. J Biol Chem. 2008;283:18773–18781. doi: 10.1074/jbc.M707879200. [DOI] [PubMed] [Google Scholar]
- Wek RC, Cavener DR. Translational control and the unfolded protein response. Antioxid Redox Signal. 2007;9:2357–2371. doi: 10.1089/ars.2007.1764. [DOI] [PubMed] [Google Scholar]
- Yang X, et al. ATF4 is a substrate of RSK2 and an essential regulator of osteoblast biology; implication for Coffin-Lowry syndrome. Cell. 2004;117:387–398. doi: 10.1016/s0092-8674(04)00344-7. [DOI] [PubMed] [Google Scholar]
- Youle RJ, Strasser A. The BCL-2 protein family: opposing activities that mediate cell death. Nat Rev Mol Cell Biol. 2008;9:47–59. doi: 10.1038/nrm2308. [DOI] [PubMed] [Google Scholar]
- Zhong C, Chen C, Kilberg MS. Characterization of the nutrient-sensing response unit in the human asparagine synthetase promoter. Biochem J. 2003;372:603–609. doi: 10.1042/BJ20030076. [DOI] [PMC free article] [PubMed] [Google Scholar]
- Zhou D, Palam LR, Jiang L, Narasimhan J, Staschke KA, Wek RC. Phosphorylation of eIF2 directs ATF5 translational control in response to diverse stress conditions. J Biol Chem. 2008;283:7064–7073. doi: 10.1074/jbc.M708530200. [DOI] [PubMed] [Google Scholar]
- Zinszner H, Kuroda M, Wang X, Batchvarova N, Lightfoot RT, Remotti H, Stevens JL, Ron D. CHOP is implicated in programmed cell death in response to impaired function of the endoplasmic reticulum. Genes Dev. 1998;12:982–995. doi: 10.1101/gad.12.7.982. [DOI] [PMC free article] [PubMed] [Google Scholar]
Associated Data
This section collects any data citations, data availability statements, or supplementary materials included in this article.