Abstract
Background
Node-negative breast cancers from 2 cm to 5 cm in size are classified as stage ii, and smaller cancers, as stage i. We sought to determine if the prognosis of women with a breast cancer exactly 2 cm in size more closely resembles that of women with a stage i or a stage ii breast cancer.
Methods
Using a cohort of 4265 young women with breast cancer, we compared the 10-year breast cancer mortality rates for women who had a tumour 0.1–1.9 cm, exactly 2.0 cm, and 2.1–2.9 cm.
Results
In the first 3 years after diagnosis, the survival pattern of women with a 2.0-cm breast cancer was nearly identical to that of women with a larger cancer (2.1–3.0 cm). From year 3 to year 10, the relative survival of women with a 2.0-cm breast cancer was improved and nearly identical to that of women with a smaller cancer. The 10-year survival rate was 89.3% for women with tumours less than 20 mm, 86.1% for women with tumours equal to 20 mm, and 81.2% for women with 21-mm to 29-mm tumours.
Conclusions
For young women with small breast cancers, the relative mortality from breast cancer is dynamic with increasing tumour size and varies with time from diagnosis.
Keywords: Breast cancer, stage, survival
1. INTRODUCTION
Cancers of exactly 2 cm in size occupy a special niche in breast oncology. That size is the one at which breast cancer is most commonly diagnosed (the “modal size”) and 2.0 cm marks the boundary between stage i and ii for node-negative breast cancers and between stage ii and iii for node-positive breast cancers. The size of the primary tumour and the nodal status are the two most useful parameters for predicting prognosis in breast cancer patients and for planning clinical management. In patients who present with localized breast cancer, increasing tumour size is inversely correlated with breast cancer–specific survival1–5.
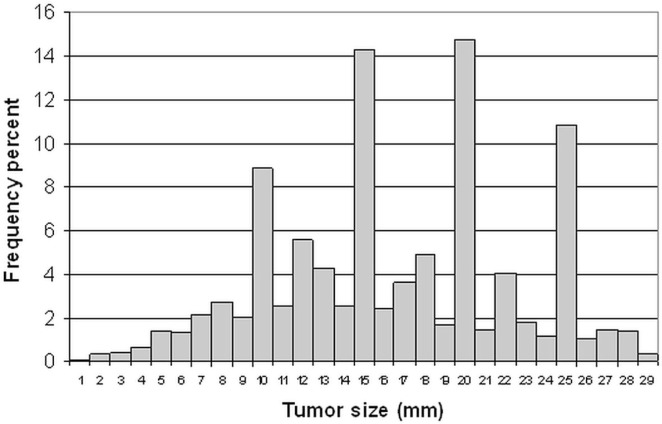
Conventionally, tumour size is measured by the pathologist based on the largest diameter of the resected specimen, estimated to the nearest millimetre. However, size evaluation is inexact, and pathologists tend to round the tumour size to the nearest centimetre or half-centimetre. As a result, many tumours are reported to be 2.0 cm in size, but relatively few are reported to be 1.9 cm or 2.1 cm. Because 2.0-cm breast cancers represent a large proportion of all breast cancer patients, and because 2.0 cm defines the border between stage i and ii breast cancers, a detailed examination of the clinical course of those tumours is of interest. We examined size distribution and tumour characteristics in 4265 unselected breast cancer patients diagnosed at age 50 or younger. We compared the 5- and 10-year survival rates and annual mortality rates for young women with cancers whose size was reported to be exactly 2.0 cm and compared those rates with the rates for women with smaller and larger cancers.
2. METHODS
We studied a cohort of 5502 women with invasive breast cancer who were treated between 1995 and 2008 at one of seventeen clinical centres affiliated with the Pomeranian Medical University of Szczecin, Poland. All patients were 50 years of age or younger at diagnosis. Clinical characteristics were retrieved from the medical records: age at diagnosis, tumour size, lymph node involvement (yes, no); estrogen receptor (er)–status (positive, negative, missing); progesterone receptor status (positive, negative, missing) and her2 (human epidermal growth factor receptor 2) status (positive, negative, missing).
The tumour size was recorded in millimetres and was taken as the greatest dimension of the tumour determined by pathology examination. For the purposes of the present study, tumour size was stratified as follows:
Tumours of 1–19 mm
Tumours equal to 20 mm
Tumours of 21–30 mm
For the analysis, we restricted the study sample to 4265 patients with a tumour size less than or equal to 30 mm, which included 85% of the patients in the database. Follow-up of patients has been maintained by periodic review of medical charts and by telephone contact with individual patients. For deceased patients, the date and cause of death were recorded.
2.1. Statistical Methods
Descriptive statistics were used to calculate frequencies of variables for patients in the three tumour-size categories. The means were compared using the Student t-test, and frequency distributions across the three tumour-size categories were compared using the chi-square test. A survival analysis was conducted for the 4265 patients. Survival was defined as time from the diagnosis of breast cancer until death from breast cancer, death from a non-breast-cancer cause, death from an unknown cause, or date of last contact. The Kaplan–Meier method was used to estimate overall survival. The log-rank test used to test the significance of the differences in survival between groups. A Cox multivariate analysis was used to evaluate the effect of tumour-size category on breast cancer mortality after adjusting for age (years), er status (positive or negative), and nodal status (positive or negative). We also compared the annual mortality rates for women with cancers in the three groups over the first 10 years after diagnosis and determined the times at which the mortality rate peaked. The Statistical Analysis System (SAS, version 9.1.3: SAS Institute, Cary, NC, U.S.A.) was used for all analyses.
3. RESULTS
Figure 1 presents the distribution of sizes for the primary tumours in the study cohort. The distribution is not smooth; it represents rounding by the pathologists. The patients were then stratified by tumour size: 2635 cancers (61.8%) were 0.1–1.9 cm; 629 cancers (14.7%) were 2.0 cm, and 1001 cancers (23.5%) were 2.1–2.9 cm.
FIGURE 1.
Tumour-size distribution of breast cancers.
Table i presents the baseline clinical characteristics of the patients in the three groups. Mean age at diagnosis was similar across the three tumour categories. Compared with smaller tumours, larger tumours were associated with a greater probability of lymph node involvement; they were also more likely to be er-negative and to have been treated with mastectomy.
TABLE I.
Baseline characteristics of patients by the size of primary tumour
| Characteristic |
Tumour size
|
p Value | ||
|---|---|---|---|---|
| 1–19 mm | 20 mm | 21–30 mm | ||
| Patients (n) | 2635 | 629 | 1001 | — |
| Age | ||||
| Mean | 44.3 | 44.2 | 44 | 0.64 |
| Range | 21–50 | 26–50 | 19–50 | |
| Nodal status [n (%)] | ||||
| Node-positive | 914 (37.2) | 293 (49.3) | 534 (55.7) | <0.00001 |
| Node-negative | 1544 (62.8) | 301 (50.7) | 424 (44.3) | |
| er status [n (%)] | ||||
| Positive | 1538 (64.7) | 341 (61.8) | 508 (55) | <0.00001 |
| Negative | 839 (35.3) | 211 (38.2) | 416 (45) | |
| her2 status [n (%)] | ||||
| Positive | 244 (15.5) | 78 (21.6) | 124 (18.7) | 0.01 |
| Negative | 1326 (84.5) | 283 (78.4) | 541 (81.4) | |
| Breast surgery [n (%)] | ||||
| Lumpectomy | 595 (29.1) | 70 (14.6) | 90 (11.9) | <0.0001 |
| Mastectomy | 1447 (70.9) | 411 (85.5) | 666 (88.1) | |
| Radiotherapy [n (%)] | ||||
| Yes | 1176 (56.8) | 271 (54.9) | 459 (58) | 0.54 |
| No | 893 (43.2) | 223 (45.1) | 332 (42) | |
| Radiotherapy among lumpectomy patients [n (%)] | ||||
| Yes | 500 (90.9) | 59 (89.4) | 79 (95.2) | 0.37 |
| No | 50 (9.1) | 7 (10.6) | 4 (4.8) | |
| Chemotherapy [n (%)] | ||||
| Yes | 1653 (74.9) | 477 (88.8) | 806 (94.2) | 0.0001 |
| No | 553 (25.1) | 60 (11.2) | 50 (5.8) | |
| Death [n (%)] | 239 (9.1) | 77 (12.2) | 164 (16.4) | 0.001 |
er = estrogen receptor; her2 = human epidermal growth factor receptor 2.
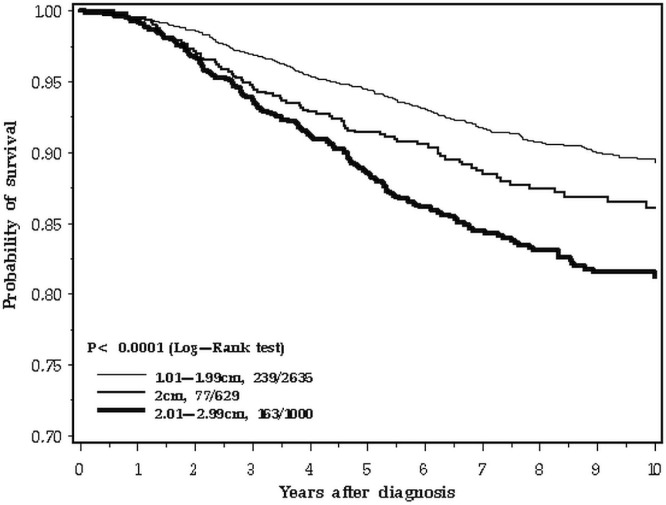
Mean follow-up was 7.7 years (range: 0–16 years). Over the 10-year follow-up period studied, 480 deaths from breast cancer were recorded among the 4265 patients (11.3%). The 5-year overall survival was 95.3% for patients with tumours less than 20 mm in size, 91.9% for patients with tumours equal to 20 mm, and 89.5% for patients with tumours 21–30 mm (p < 0.0001, Figure 2). However, at 10 years, the survival of women with breast cancers of 2.0 cm was similar to that of women with smaller cancers (89.3% for patients with tumours <20 mm, 86.1% for patents with 20-mm tumours, and 81.2.% for patients with tumours 21–29 mm).
FIGURE 2.
Survival by tumour size, 0–10 years.
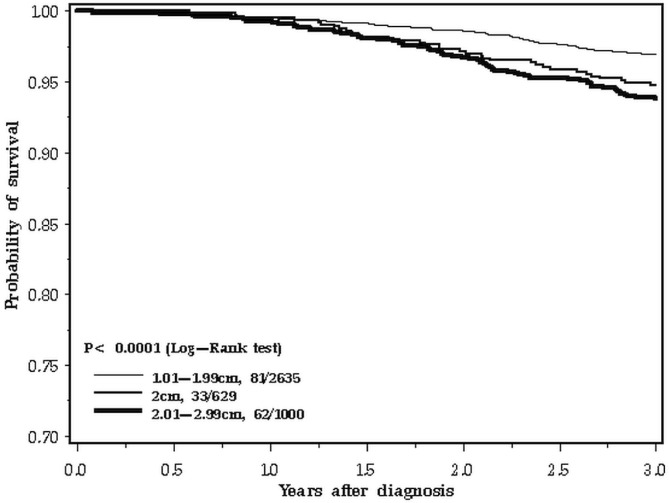
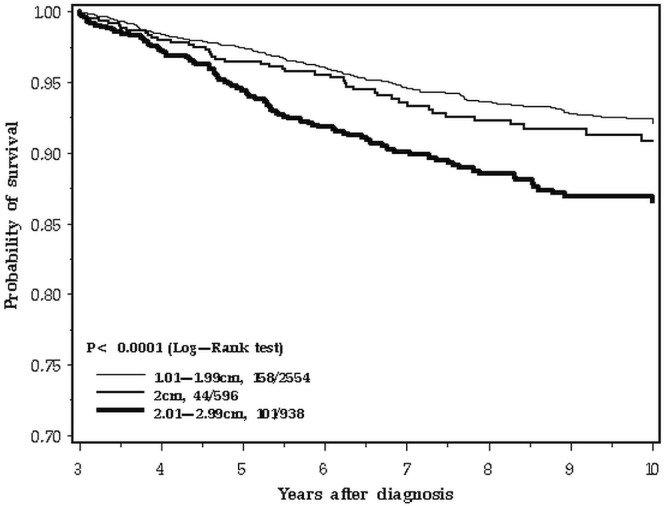
The difference in survival patterns is apparent when the 10-year follow-up period is inspected closely (Figure 2). In the first 3 years after diagnosis, the survival curve for 2.0-cm breast cancers tracks with the larger cancers (Figure 3). In the period from 3 to 10 years, the 2.0-cm cancers track with the smaller cancers (Figure 4). We confirmed those differences in a statistical model, using a Cox proportional hazards analysis of survival and dividing the follow-up period into two. Table ii presents the results of the univariable and multivariable analyses. In the adjusted analysis, the hazard ratio for 2.0-cm cancers compared with smaller cancers was 1.51 in the first 3 years (95% confidence interval: 1.01 to 2.27) and 1.04 for years 3 to 10 (95% confidence interval: 0.74 to 1.45). In contrast, the effect of nodal status on prognosis was similar for the two time periods. The survival advantage for er-positive patients was apparent in the two time periods, but attenuated with time (Table ii).
FIGURE 3.
Survival by tumour size, 0–3 years.
FIGURE 4.
Survival by tumour size, 3–10 years.
TABLE II.
Hazard ratios for mortality associated with tumour size and other prognostic factors, by time since diagnosis
| Variable | Period of analysis | |||||||||||
|---|---|---|---|---|---|---|---|---|---|---|---|---|
|
| ||||||||||||
| Diagnosis to 3 years | 3 to 10 years | |||||||||||
|
|
|
|||||||||||
| Unadjusted | Adjusted | Unadjusted | Adjusted | |||||||||
|
|
|
|
|
|||||||||
| hr | 95% ci | p Value | hr | 95% ci | p Value | hr | 95% ci | p Value | hr | 95% ci | p Value | |
| Age | 0.97 | 0.95 to 1.00 | 0.05 | 0.98 | 0.95 to 1.01 | 0.11 | 0.97 | 0.95 to 0.99 | 0.004 | 0.97 | 0.95 to 0.99 | 0.007 |
| Tumour size | ||||||||||||
| 1–19 mm | 1.0 | 1.0 | 1.0 | 1.0 | ||||||||
| 20 mm | 1.73 | 1.15 to 2.69 | 0.008 | 1.51 | 1.01 to 2.27 | 0.05 | 1.18 | 0.84 to 1.65 | 0.33 | 1.04 | 0.74 to 1.45 | 0.82 |
| 21–29 mm | 2.05 | 1.47 to 2.86 | 0.0001 | 1.59 | 1.14 to 2.23 | 0.006 | 1.89 | 1.47 to 2.43 | 0.0001 | 1.55 | 1.21 to 2.00 | 0.0006 |
| Nodal status | ||||||||||||
| Negative | 1.0 | 1.0 | 1.0 | 1.0 | ||||||||
| Positive | 3.53 | 2.55 to 4.89 | 0.0001 | 3.38 | 2.43 to 4.70 | 0.0001 | 3.48 | 2.71 to 4.46 | 0.0001 | 3.31 | 2.58 to 4.25 | 0.0001 |
| er status | ||||||||||||
| Negative | 1.0 | 1.0 | 1.0 | 1.0 | ||||||||
| Positive | 0.27 | 0.20 to 0.38 | 0.0001 | 0.28 | 0.20 to 0.40 | 0.0001 | 0.68 | 0.54 to 0.86 | 0.70 | 0.55 to 0.88 | 0.002 | |
hr = hazard ratio; ci = confidence interval; er = estrogen receptor.
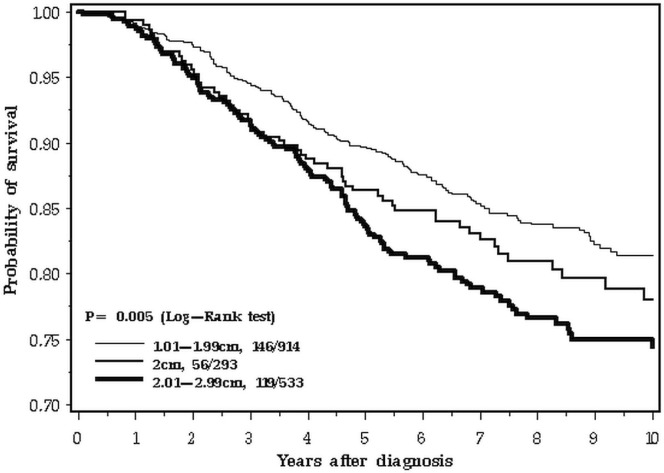
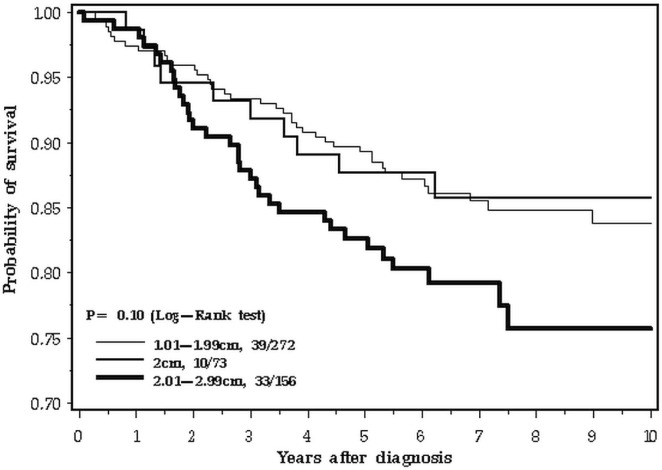
Among the 4265 patients, 2269 had node-negative cancer, and 1741 had node-positive cancer. The shift from poor prognosis to good prognosis at year 3 or thereabouts was particularly evident in the node-positive cancers (Figure 5). Figure 6 presents the experience of the 501 patients with triple-negative cancers. In this subgroup, the survival experience for women with cancers of all sizes was similar for the first 2 years; thereafter, the intermediate-size (2.0-cm) cancers tracked with the smaller cancers.
FIGURE 5.
Survival by tumour size, 0–10 years, node-positive disease only.
FIGURE 6.
Survival by tumour size, 0–10 years, triple-negative disease only.
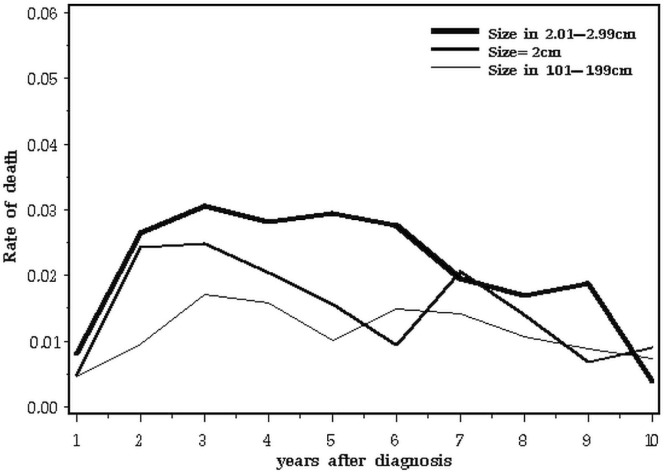
Table iii and Figure 7 present the annual death rate for all patients in the three tumour-size categories.
TABLE III.
Annual mortality rate, by time since diagnosis and tumour size
| Variable |
Annual mortality rate (%)
|
|
|---|---|---|
| Years 1–5 | Years 5–10 | |
| Tumour size | ||
| 1–19 mm | 1.13 | 1.20 |
| 20 mm | 1.79 | 1.25 |
| 21–29 mm | 2.42 | 1.97 |
FIGURE 7.
Annual mortality after breast cancer, by tumour size, all subjects.
4. DISCUSSION
In this study, we closely examined the relationship between tumour size and survival in young women with small breast cancers. Our database was large (4265 patients), and we were able to consider women with tumours of exactly 2.0 cm as a single category. Currently, such cancers (if node-negative) are classified as stage i breast cancers. Not surprisingly, the clinical outcome in women with such tumours was intermediate between those in the stage i and stage ii groups as a whole, but the difference was qualitative as well as quantitative. Over the 10-year follow-up period, the relative survival of women with 2.0-cm cancers improved with respect to women having smaller cancers. However, in the first 3 years after diagnosis, the survival of women with 2.0-cm cancers was significantly worse than that for women with smaller cancers (hazard ratio: 1.73; 95% confidence interval: 1.15 to 2.69; p = 0.008).
Our study illustrates that, in survival analyses, if the hazard ratio is erroneously assumed to be proportional over time, it is possible to overlook subtle differences in outcome. This observation has clinical relevance and also raises important questions about the natural history of breast cancer. We propose that, for women with small breast cancers, changes in size attributable to screening or to improved awareness might have different clinical effects at different time points after diagnosis. To ensure that a clinical study is reliable, it is important that most patients be followed for a long period, ideally for 10 or more years. Studies based on shorter follow-up periods (5 years, say) may lead to erroneous conclusions even if the total number of person–years is large—a situation similar to that with ovarian cancer6,7. Screening studies and studies involving clinical interventions can both potentially be affected.
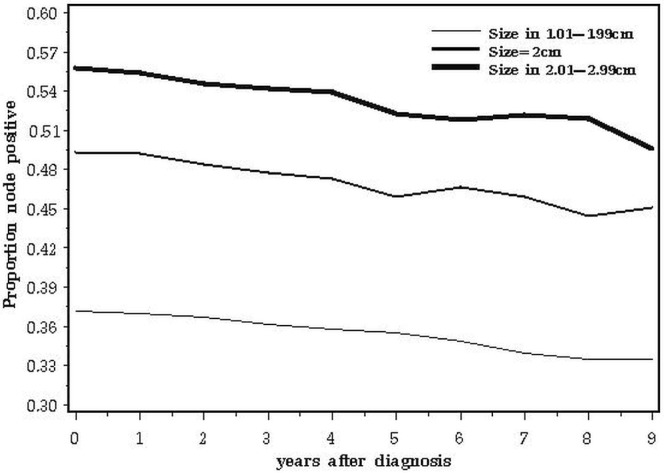
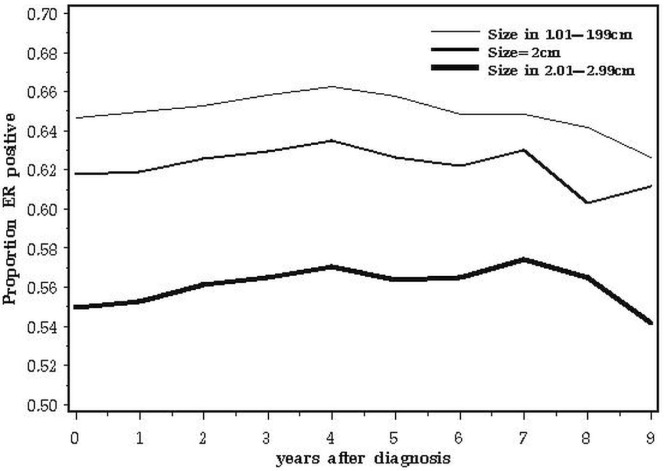
A second issue relates to the biologic basis for our observations. It is possible that the adverse impact of 2.0-cm tumours compared with smaller ones relates to the relative proportions of one or more adverse prognostic factors in the various subgroups at various times after diagnosis. The data are consistent with a prognostic factor that has a negative impact on survival for 3 years only and that is more common in cancers of 2.0 cm than in larger cancers. For example, the adverse prognosis associated with triple negativity is concentrated in years 0–5; thereafter, recurrence rates are similar to or less than those of er-positive cancers8. Our study merged all patients with triple-negative breast cancer because we lacked data on other relevant markers such as epidermal growth factor receptor and cytokeratins 5 and 6. It is possible that, within the triple-negative phenotype, certain subgroups have different patterns of mortality. The expectation is that, if a prognostic factor increases mortality, the proportion of cases positive for that factor decline with time from diagnosis. Positive nodal status had an adverse effect on survival at all time points (Table ii), and the fraction of node-positive cancers declines with time elapsed (Figure 8). At diagnosis, er-positivity is a good prognostic feature, but it adversely affects outcomes later on9. That attenuation is evident in Table ii. As predicted, the prevalence of er-positive cancers rose from year 1 to year 5 and then declined from year 5 to year 10 (Figure 9).
FIGURE 8.
Proportion of node-positive subjects, by years elapsed since diagnosis.
FIGURE 9.
Proportion of estrogen receptor (er)–positive subjects, by years elapsed since diagnosis.
These observations also raise interesting questions about the nature of breast cancer progression. According to the basic model, patients who die of breast cancer are among those in whom latent metastases (residual disease), present after breast surgery completion, fail to be subsequently eradicated by adjuvant chemotherapy. In its simplest form, the model predicts that the probability of death is proportional to the probability that viable residual metastases are present after treatment. If in-breast tumour size alone were an indicator of the probability that latent metastases are present, then the curves in Figure 2 would be expected to be parallel. The data suggest that the model is more complex—that is, that the initial measured size of the tumour influences survival in other ways. For example, it might correlate with the intrinsic metastatic growth rate. The probability of dying in a given time interval after diagnosis is a reflection of the extent of viable residual disease, the time to distant recurrence (growth rate), and the time from distant recurrence to death. In support of this proposition is the observation that the time from diagnosis to local recurrence is highly correlated with the time from recurrence to death10.
Here, we focus on tumour size, albeit within a narrow clinical range, and we extend the findings of others that the statistical effect of tumour size on cancer recurrence is contingent on the presence or absence of other relevant prognostic features. In the past decade, several studies of gene expression profiles have improved our ability to predict distant relapse and death, but even when expression profiles are included, tumour size retains its independent predictive ability11,12. The relationship is attenuated for triple-negative cancers13,14 and for BRCA1-associated breast cancers15. Furthermore, tumour size may influence survival differently according to lymph node status, but that contingency may not be fully captured if nodal status is dichotomized. Among node-positive patients, 5-year survival was seen to be similar for the 2.0-cm tumours and the tumours of 2.1–3.0 cm. In a recent article, Wo et al.16 report that, among women with 4 or more positive nodes, those with very small breast cancers had a much worse prognosis than would have been predicted from the size of their tumours. Similarly, very large tumours that are node-negative may be represent a biologically indolent phenotype17.
5. CONCLUSIONS
We found that the survival experience of women with a 2.0-cm breast cancer tumour was similar to that of women with larger cancers for 3 years and that their survival then tracked that of women with smaller cancers from year 3 to year 10. That observation raises interesting questions about the biologic underpinnings of the dynamic nature of prognostic factors over time.
6. CONFLICT OF INTEREST DISCLOSURES
All authors declare no financial conflicts of interest.
7. REFERENCES
- 1.Crowe JP, Jr, Gordon NH, Shenk RR, Zollinger RM, Jr, Brumberg DJ, Shuck JM. Primary tumor size. Relevance to breast cancer survival. Arch Surg. 1992;127:910–15. doi: 10.1001/archsurg.1992.01420080044007. [DOI] [PubMed] [Google Scholar]
- 2.Elkin EB, Hudis C, Begg CB, Schrag D. The effect of changes in tumor size on breast carcinoma survival in the U.S.: 1975–1999. Cancer. 2005;104:1149–57. doi: 10.1002/cncr.21285. [DOI] [PubMed] [Google Scholar]
- 3.Mirza AN, Mirza NQ, Vlastos G, Singletary SE. Prognostic factors in node-negative breast cancer: a review of studies with sample size more than 200 and follow-up more than 5 years. Ann Surg. 2002;235:10–26. doi: 10.1097/00000658-200201000-00003. [DOI] [PMC free article] [PubMed] [Google Scholar]
- 4.Rosen PP, Groshen S, Saigo PE, Kinne DW, Hellman S. Pathological prognostic factors in stage i (T1N0M0) and stage ii (T1N1M0) breast carcinoma: a study of 644 patients with median follow-up of 18 years. J Clin Oncol. 1989;7:1239–51. doi: 10.1016/j.otc.2012.04.003. [DOI] [PubMed] [Google Scholar]
- 5.Rosen PR, Groshen S, Saigo PE, Kinne DW, Hellman S. A long-term follow-up study of survival in stage i (T1N0M0) and stage ii (T1N1M0) breast carcinoma. J Clin Oncol. 1989;7:355–66. doi: 10.1056/NEJM199811263392207. [DOI] [PubMed] [Google Scholar]
- 6.Bolton KL, Chenevix–Trench G, Goh C, et al. on behalf of embrace, the kConFab Investigators, and the Cancer Genome Atlas Research Network Association between BRCA1 and BRCA2 mutations and survival in women with invasive epithelial ovarian cancer. JAMA. 2012;307:382–90. doi: 10.1001/jama.2012.20. [DOI] [PMC free article] [PubMed] [Google Scholar]
- 7.McLaughlin JR, Rosen B, Moody J, et al. Long-term ovarian cancer survival associated with mutation in BRCA1 or BRCA2. J Natl Cancer Inst. 2013;105:141–8. doi: 10.1093/jnci/djs494. [DOI] [PMC free article] [PubMed] [Google Scholar]
- 8.Dent R, Trudeau M, Pritchard KI, et al. Triple-negative breast cancer: clinical features and patterns of recurrence. Clin Cancer Res. 2007;13:4429–34. doi: 10.1158/1078-0432.CCR-06-3045. [DOI] [PubMed] [Google Scholar]
- 9.Brewster AM, Hortobagyi GN, Broglio KR, et al. Residual risk of breast cancer recurrence 5 years after adjuvant therapy. J Natl Cancer Inst. 2008;100:1179–83. doi: 10.1093/jnci/djn233. [DOI] [PMC free article] [PubMed] [Google Scholar]
- 10.Wapnir IL, Anderson SJ, Mamounas EP, et al. Prognosis after ipsilateral breast tumor recurrence and locoregional recurrences in five National Surgical Adjuvant Breast and Bowel Project node-positive adjuvant breast cancer trials. J Clin Oncol. 2006;24:2028–37. doi: 10.1200/JCO.2005.04.3273. [DOI] [PubMed] [Google Scholar]
- 11.Cortesi L, Marcheselli L, Guarneri V, et al. Tumor size, node status, grading, her2 and estrogen receptor status still retain a strong value in patients with operable breast cancer diagnosed in recent years. Int J Cancer. 2013;132:E58–65. doi: 10.1002/ijc.27795. [DOI] [PubMed] [Google Scholar]
- 12.Wirapati P, Sotiriou C, Kunkel S, et al. Meta-analysis of gene expression profiles in breast cancer: toward a unified understanding of breast cancer subtyping and prognosis signatures. Breast Cancer Res. 2008;10:R65. doi: 10.1186/bcr2124. [DOI] [PMC free article] [PubMed] [Google Scholar]
- 13.Sabri S, Abdulkarim B. Reply to P.G. Tsoutsou et al. and A.H. Trainer et al. J Clin Oncol. 2011;29:4723–4. doi: 10.1200/JCO.2011.38.6672. [DOI] [Google Scholar]
- 14.Hernandez–Aya LF, Chavez–Macgregor M, Lei X, et al. Nodal status and clinical outcomes in a large cohort of patients with triple-negative breast cancer. J Clin Oncol. 2011;29:2628–34. doi: 10.1200/JCO.2010.32.1877. [DOI] [PMC free article] [PubMed] [Google Scholar]
- 15.Narod SA, Metcalfe K, Lynch HT, et al. Should all BRCA1 mutation carriers with stage i breast cancer receive chemotherapy? Breast Cancer Res Treat. 2013;138:273–9. doi: 10.1007/s10549-013-2429-x. [DOI] [PubMed] [Google Scholar]
- 16.Wo JY, Chen K, Neville BA, Lin NU, Punglia RS. Effect of very small tumor size on cancer-specific mortality in node-positive breast cancer. J Clin Oncol. 2011;29:2619–27. doi: 10.1200/JCO.2010.29.5907. [DOI] [PMC free article] [PubMed] [Google Scholar]
- 17.Yu KD, Jiang YZ, Chen S, et al. Effect of large tumor size on cancer-specific mortality in node-negative breast cancer. Mayo Clin Proc. 2012;87:1171–80. doi: 10.1016/j.mayocp.2012.07.023. [DOI] [PMC free article] [PubMed] [Google Scholar]


