Abstract
A high-throughput ion mobility mass spectrometer (IMMS) was used to rapidly separate and analyze peptides and glycopeptides derived from glycoproteins. Two glycoproteins, human α-1-acid glycoprotein and antithrombin III were digested with trypsin and subjected to electrospray traveling wave IMMS analysis. No deglycosylation steps were performed; samples were complex mixtures of peptides and glycopeptides. Peptides and glycosylated peptides with different charge states (up to 4 charges) were observed and fell on distinguishable trend lines in 2-D IMMS spectra in both positive and negative modes. The trend line separation patterns matched between both modes. Peptide sequence was identified based on the corresponding extracted mass spectra and collision induced dissociated (CID) experiments were performed for selected compounds to prove class identification. The signal-to-noise ratio of the glycopeptides was increased dramatically with ion mobility trend line separation compared to non-trend line separation, primarily due to selection of precursor ion subsets within specific mobility windows. In addition, isomeric mobility peaks were detected for specific glycopeptides. IMMS demonstrated unique capabilities and advantages for investigating and separating glycoprotein digests in this study and suggests a novel strategy for rapid glycoproteomics studies in the future.
Keywords: traveling wave ion mobility mass spectrometry, glycoprotein, peptides, glycopeptides, mobility trend line separation, collision induced dissociation
Introduction
Ion mobility spectrometry (IMS) [1] separates gas phase ions according to ions’ traveling velocities under the influence of an electric field in a counter flow of neutral gas through an ion mobility drift tube. IMS has been demonstrated as a powerful detection tool for drugs, explosives and chemical warfare agents [2, 3, 4]. When IMS is combined with mass spectrometry (MS), a novel analytical method called ion mobility mass spectrometry (IMMS) is created [5]. The application of IMMS to complex biological samples has become one of the most rapidly growing areas in the MS field. High throughput separation capability demonstrated by IMMS has found great utility in life science research, such as metabolomics [6, 7], glycomics [8, 9, 10] and proteomics [11, 12, 13]. The unique benefits include charge states and molecule class separation (glycans, peptides and lipids etc.) [14, 15] in the form of different trend lines on the basis of 2-D IMMS spectra as well as separation of isomeric precursor ions of biological origin [16].
Glycoproteomics identifies and characterizes proteins having carbohydrates as post-translational modifications [17]. Aberrant protein glycosylation is related to various diseases [18] including cancer and immune system deficiencies [19]. Current analytical techniques normally require the physical separation of glycans and peptides for analyses [20], which are known as glycomics and proteomics, respectively, and often require tedious sample preparation. Direct analysis of protease digested glycoproteins employs liquid chromatography (LC) separation followed by MS or MSn measurements [21, 22]. Among the numerous LC peaks detected in such analyses, it is difficult to assign peak identities (such as specific peptides and unique structures of glycopeptides). Moreover, no specific patterns have been observed, making analysis considerably more difficult. Compared to the applications of IMMS in the analysis of glycans and peptides, limited studies have been demonstrated for analysis of glycopeptides by IMMS. Mclean et al. [23] reported a related study in 2009, however, the analysis was based on a deglycosylated form of the enzymatically digested glycoprotein. The analyte was a mixture of glycans and peptides and in fact, IMMS separation of glycans and peptides was demonstrated. Olivova et al. [24] separated light and heavy chains of a reduced antibody in the gas phase using IMMS. Additionally, they determined the glycosylation site as well as the glycan sequence using the unique dual-collison-cell design of the instrument. Both studies were performed using traveling wave ion mobility mass spectrometry (TWIMMS) [25]. The TWIMMS instrument is a hybrid quadrupole/ion mobility/orthogonal time of flight MS and has been widely described in the literature [26]. The mobility separation employs traveling wave ion guide technology, having a non-homogeneous electric field under reduced pressure.
In the analysis of glycopeptides derived from glycoproteins, there are three important questions to be addressed. (1) What is the peptide sequence containing the glycosylation site(s), both for N- and O-linked glycosylation and for clustered sites? (2) Where is/are the glycosylation site/sites on a peptide? (3) What are the structures and structural heterogeneity, including isomeric heterogeneity, of the carbohydrate components? Information about which components are glycopeptides, and partial information for the nature of the carbohydrate components can be obtained through collision-induced dissociation (CID), which preferentially cleaves glycopeptides at glycosidic linkages. Partial information for the peptide sequence can be obtained currently using electron transfer dissociation (ETD), both for O- and N-linked glycopeptides, hence the use of both methods in combination typically yields more information about the nature of glycopeptides [27, 28, 29, 30]. A key remaining issue, however, is the isomeric heterogeneity at glycopeptide sites. The presence of a peptide component linked to individual carbohydrate isomers makes the problem of their separation and independent analysis even more difficult than resolution of the carbohydrate isomers themselves. Yet the question as to the specific nature of each carbohydrate variant at each specific peptide site and their relative percentages is an important one to be addressed to fully understand their biological roles. Here, we report an application of IMMS to glycoproteomics in which proteolytic digested glycoproteins were investigated directly, without deglycosylation, by traveling wave ion mobility mass spectrometry. The hypothesis was that glycans attached to peptides would have different ion densities and form identifiable trend lines in the IMMS spectra. To test this hypothesis, two common glycoproteins were digested with trypsin and the resultant entire mixture of peptides/glycopeptides was evaluated by IMMS.
Experimental
Chemicals and materials
Formic acid (FA), methanol and water (LC-MS grade) were purchased from Thermo Fisher Scientific Inc. An equal volume mixture of methanol and water was used as the electrospray ionization (ESI) solvent, and 0.1% FA was added to the ESI solvent for positive mode studies. Two glycoproteins, human α-1-acid glycoprotein (AGP) and human antithrombin III (ANT III), were investigated. Both glycoproteins were obtained from the Red Cross. The AGP was desialylated by treatment with 0.1 N H2SO4 for 1 h (the original hydrolysis conditions described by Spiro [35]), followed by neutralization with sodium bicarbonate and thorough dialysis against water, then freeze-dried. The ANT III was used without removal of sialic acid. The glycoproteins were digested at 1 mg/mL with trypsin (two additions, 24 h apart, 1/20 mg/mg relative to the glycoproteins) for 48 h at pH 7.4 in 20 mM ammonium bicarbonate containing 20% acetonitrile, and then frozen and freeze-dried. A concentration of 0.2 mg/mL AGP digest and 0.4 mg/mL ANT III digest were subjected to ion mobility analysis in both positive and negative modes. Acetonitrile and all the chemicals used in the processes of desialylation and trypsin digestion were purchased from Sigma-Aldrich (St. Louis, MO) and used directly.
Instrument
IMMS experiments were performed on a Synapt G2 High Definition Mass Spectrometer (HDMS) (Waters Corp., Manchester, UK) in both positive and negative modes. It is a hybrid quadrupole/traveling wave ion mobility/orthogonal high resolution TOF MS and has been thoroughly described [25, 26, 31, 32]. For traveling wave ion mobility separations, a wave height of 40 V and a wave velocity of 650 m/s were employed. Trap release time was 200 µs and the separation delay after trap release was 450 µs. Nitrogen with a flow rate of 90 mL/min was used as drift gas, resulting in a pressure of ~3.5 mbar for ion mobility separation. According to Td (Townsend) = E / N, where E is the electric field in V/cm, N is the number density in cm−3, the current experimental settings resulted in a maximum Td value of 115 V·cm2. For IMMS experiments of glycoproteins, the data acquisition time was 3 min for the positive mode and 5 min for the negative mode studies. Selected fragmentation experiments occurred in the trap cell located in front of the ion mobility separator by elevating the collision energy (CE). Samples were injected into the ESI source directly using a syringe pump (Chemyx Inc., Stafford, TX) at a flow rate of 3 µL/min. The program Masslynx V4.1 (Waters Corp., Manchester, UK) was used to collect and analyze the MS data. The 2-dimensional IMMS spectra were generated using the program Driftscope V2.2 (Waters Corp., Manchester, UK). Other instrumental parameters are included in Table S1 in the supporting information.
Results and Discussion
Human α-1-acid-glycoprotein in positive IMMS mode
Human α-1-acid glycoprotein (AGP) is a single polypeptide chain of 183 amino acids with ~45% carbohydrate content at five different N-linked glycosylation sites [33]. The AGP gene encodes two major variants, AGP1 and AGP2, having a 22 amino acid difference. AGP is involved in a number of activities of potential physiological significance, where an immunomodulatory function as well as binding activities have been shown to be dependent on the carbohydrate moiety [33]. The glycosylation patterns of AGP have been extensively characterized [21, 22, 34, 35], expressing di-, tri- and tetra-antennary glycan structures, with many isomeric carbohydrate structures known to be present [34, 36, 37, 38]. Each of the glycosylation sites (Asn-15, −38, −54, −75, −85) can be occupied by branched oligosaccharides of various structures composed of hexose (Hex), N-acetylhexosamine (HexNAc) and fucose (Fuc), resulting in a carbohydrate-rich complex protein. Note that AGP was desialylated in this study, thus no sialic acid was found in the carbohydrate structures.
Fig. 1 displays the 2-D IMMS plot of the AGP trypsin digest with drift time (ms) on the×axis and m/z on the y axis; five separate trend lines were observed. They were identified as trend line I: +1 charged peptides, trend line II: +2 charged peptides, trend line III: +2 charged glycopeptides, trend line IV: +3 charged glycopeptides and trend line V: +4 charged glycopeptides. The class identification was based on the extracted mass spectra (m/z values) from each region and on further fragmentation experiments with a detailed analysis as shown in subsequent figures. Thus in a single analysis by IMMS, peptides and glycopeptides were able to be distinguished in different 2-D regions. Clear charge state separation was also achieved, with up to 2+ peptides and 4+ glycopeptides. In comparison to MS analysis alone, the added separation capability of ion mobility enables the complex biological mixture to be rapidly organized into specific 2-D patterns based on their structural similarities. Bio-molecular structural separation by IMMS has been shown previously, however, this is the first example of the trend line separation of peptides and glycopeptides with different charge states, which is difficult or impossible to achieve with other analytical separation techniques such as GC and LC. Mass spectra extracted from trend lines I (+1 charged peptides) and II (+2 charged peptides) are displayed in Fig. 2a and 2b, respectively. A number of peaks (labeled with asterisks) were identified as tryptic peptides of AGP according to their m/z values. Corresponding peptide sequences and additional identified m/z values of low abundance (not labeled in Fig. 2) are summarized in Table S2 in the supporting information. Additionally, peptide fragments were observed using ESI in this study, presumably resulting from in-source fragmentation. The overall peptide data results in a ~40 % coverage of the amino acid sequence for AGP1 and ~ 35% for AGP2. The relatively low peptide sequence recovery rate may arise in part from an inefficient enzyme digestion, since large glycan moieties at multiple sites may hinder proteolysis and the possibility of missed cleavages increased for the sites close to glycosylated asparagines. Further investigations will be required to identify the source of this low peptide recovery rate. No protein reduction and alkylation were performed prior to trypsin digestion in this study, which may also affect the results. Unidentified peaks in Fig. 2 could result from trypsin autodigestion, peptide fragments generated during electrospray, impurities in the sample or any other potential peptide modifications.
Fig. 1.
2-D IMMS plot of trypsin digested human α-1-acid glycoprotein in positive mode. Trend line I: 2-D region containing +1 charged peptides; Trend line II: 2-D region containing +2 charged peptides; Trend line III: 2-D region containing +2 charged glycopeptides; Trend line IV: 2-D region containing +3 charged glycopeptides; Trend line V: 2-D region containing +4 charged glycopeptides.
Fig. 2.
(a) An extracted mass spectrum corresponding to +1 charged peptides (trend line I in Fig.1). (b) An extracted mass spectrum corresponding to +2 charged peptides (trend line II in Fig. 1). These m/z values represent precursor ions extracted from a line running through the 2-dimensional trend zones shown in Fig. 1. Asterisks indicate major identified m/z values corresponding to peptide sequences derived from human α-1-acid glycoprotein. For the detailed sequence information and additional non-labeled identified m/z values (low abundance), see Table S2 in the supporting information.
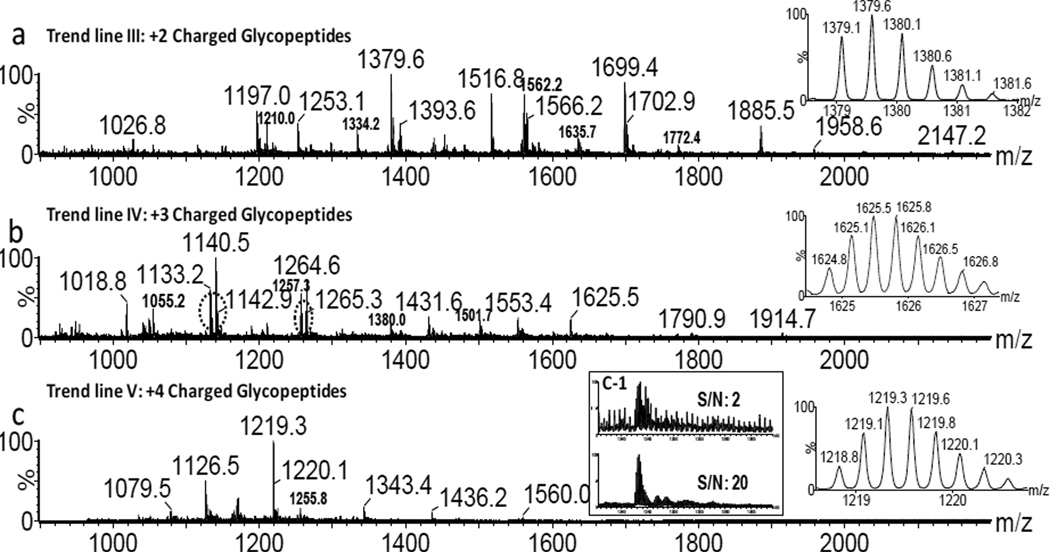
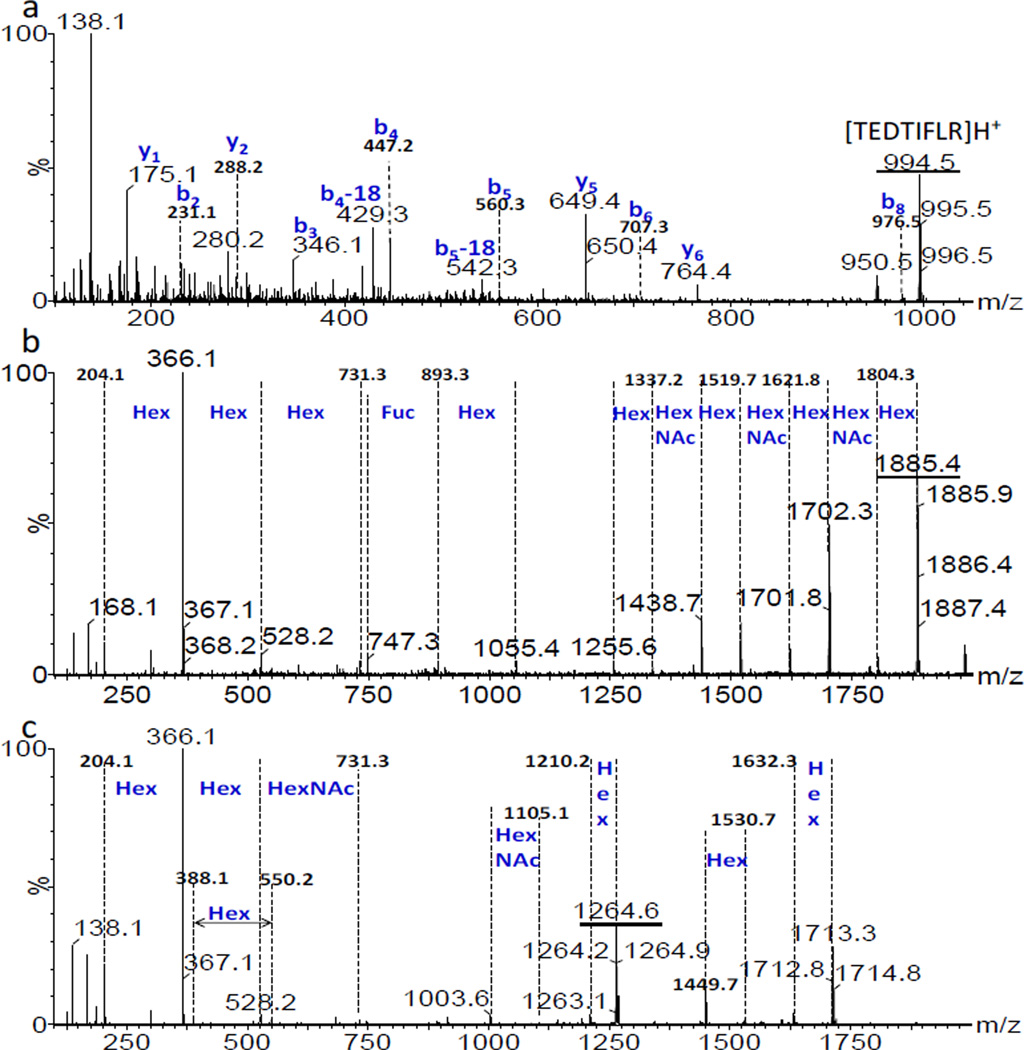
Fig. 3 shows extracted mass spectra for trend lines III (+2 glycopeptides), IV (+3 glycopeptides) and V (+4 charged glycopeptides), respectively. The inset on the right in each spectrum demonstrates the isotopic patterns characteristic of +2, +3 and +4 charged ion. In mixtures, glycopeptides usually have much lower ionization efficiency and sensitivity than peptides, making their analysis more difficult. In direct analysis of glycopeptide digests, peptide components normally tend to dominate the abundance of precursor ions isolated for the mass analyzer, hence ion statistics of glycopeptides selected for MS/MS are often poor. With the added ion mobility trend line separation, the signal (S) to noise (N) ratio of glycopeptides has been greatly improved, mostly as the result of removal of many of the unglycosylated peptides within selected ion mobility time windows. For example, as shown in Fig. 3c-1, the S/N ratio was 2 for m/z 1343.4 with MS only (top spectrum), whereas the ratio increased 10-fold using IMMS separation (bottom spectrum). It is common that carbohydrates tend to form sodium adducts and peptides normally adopt up to two protons in the positive mode. Charge competition between Na+ and H+ was observed for several glycopeptides, since both glycan and peptide are contained in a single compound. Correlated m/z peaks with a mass difference of 22 (m/z difference of 11) were observed for the majority of +2 charged glycopeptides. This indicated one H+ was replaced by a Na+, such as pairs of m/z of 1379.6/1390.6, 1562.2/1573.2 and 1699.4/1710.4, while ions containing Na+ were at much lower intensity. Charge competition was more pronounced for +3 charged glycopeptides as demonstrated by the dash circled peaks in Fig. 3b. The peaks having one or more Na+ (such as m/z 1140.5 and 1264.6) were at higher abundance in this case. Improved sensitivity may be explained in that glycopeptides coordinate with Na+ ions more easily as the carbohydrate portion becomes larger. This scenario was not observed for +4 charged glycopeptides, where the charge distribution appeared to involve two Na+ ions adducted to the glycan and two H+ ions on the peptide chain. Trend line separation provided additional information that was not available with MS analysis alone. To further validate the trend line identities, fragmentation experiments were performed for selected m/z values and representative examples are shown in Fig. 4. Fig. 4a shows the MS/MS spectrum for the singly charged peptide m/z 994.5 having the sequence TEDTIFLR. The b and y product ions that were observed matched with the precursor ion peptide sequence. The MS/MS spectra of +2 (m/z 1885.4) and +3 (m/z 1264.6) charged glycopeptides from trend lines III and IV are displayed in Fig. 4b and 4c, respectively. They both showed sequential carbohydrate unit losses of Hex, HexNAc or Fuc as displayed in spectra. Thus, fragmentation analysis further supported the trend line assignments in Fig. 1. More fragmentation examples of glycopeptides were demonstrated and the spectra are included in Fig. S1 and Fig. S2 in supporting information where primarily sugar monomer unit losses were observed as well. AGP is a highly glycosylated protein, where +4 charged glycopeptides, especially for glycoforms with tri or tetra-antennary glycans, are expected as has been reported previously [24, 33]. Even though no direct fragmentation evidence was obtained for the +4 charged ions due to their low abundance in the sample, trend line V was exclusively assigned to +4 charged glycopeptides.
Fig. 3.
(a) An extracted mass spectrum corresponding to +2 charged glycopeptides (trend line III in Fig. 1). (b) An extracted mass spectrum corresponding to +3 charged glycopeptides (trend line IV in Fig. 1). The m/z values show the extracted precursor ions from a line running through each trend region. The mass difference for circled peaks in (b) is Δm= 22. (c) An extracted mass spectrum corresponding to +4 charged glycopeptides (trend line V in Fig. 1). c-1 shows the expanded mass spectra and S/N ratios for the m/z 1343.4 precursor ion region derived from the mixture (top) and following IMMS, derived from the trend line (bottom). The inset in each spectrum on the right illustrates the isotopic patterns for a +2, +3 and +4 charged glycopeptide, respectively.
Fig. 4.
(a) MS/MS spectrum for the +1 charged peptide of the precursor ion having m/z 994.5 from trend line I in Fig. 1 using a CE of 53 V. (b) MS/MS spectrum for a +2 charged glycopeptide of m/z 1885.4 from trend line III in Fig. 1 using 48 V CE. (c) MS/MS spectrum for a +3 charged glycopeptide of m/z 1264.6 from trend line IV in Fig. 1 using a CE of 33V. Underlined peaks are precursor ions.
Human antithrombin III in positive IMMS mode
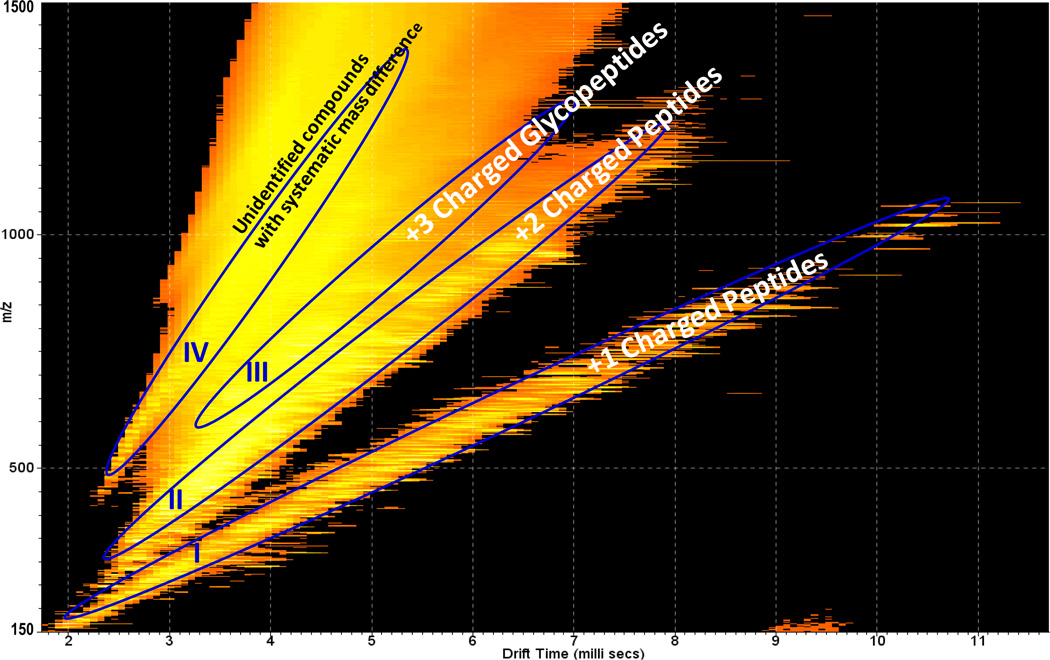
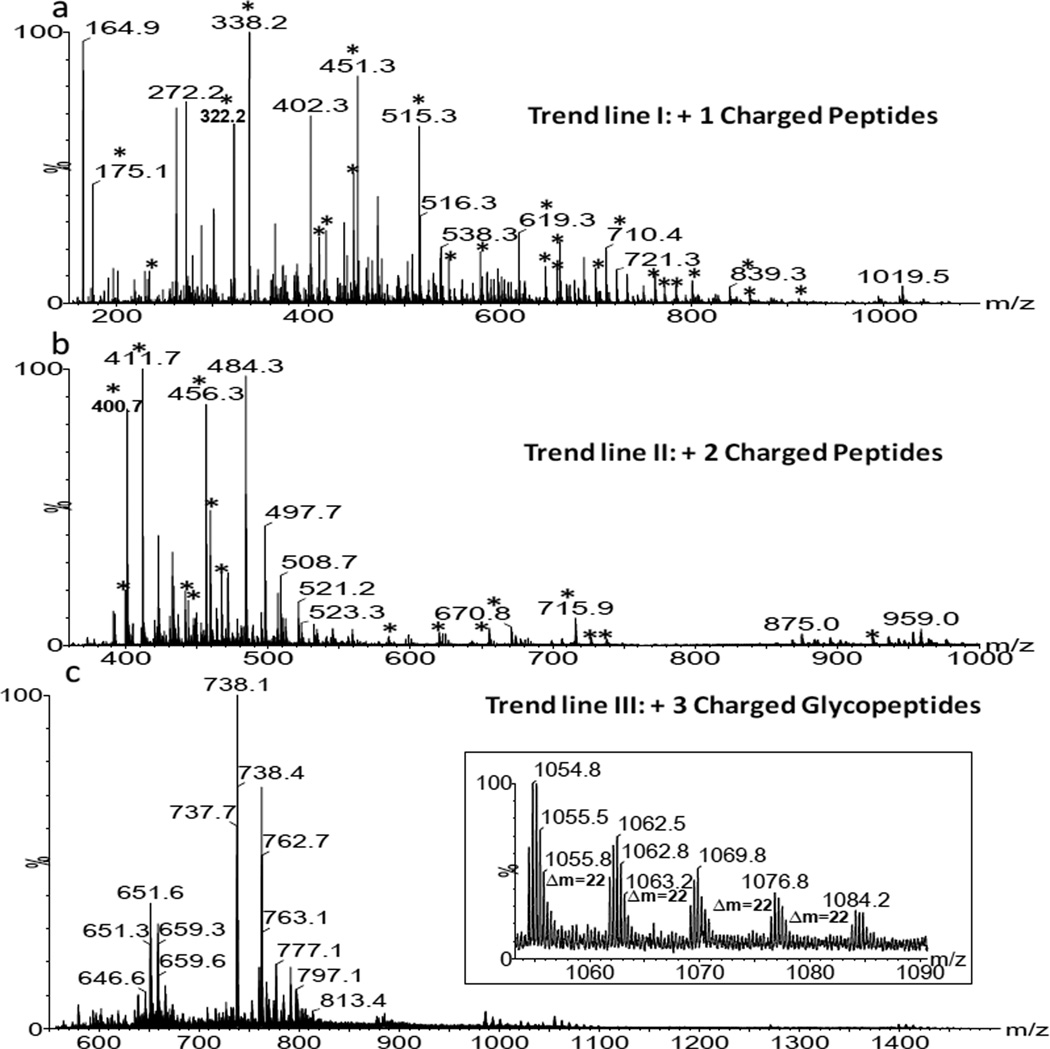
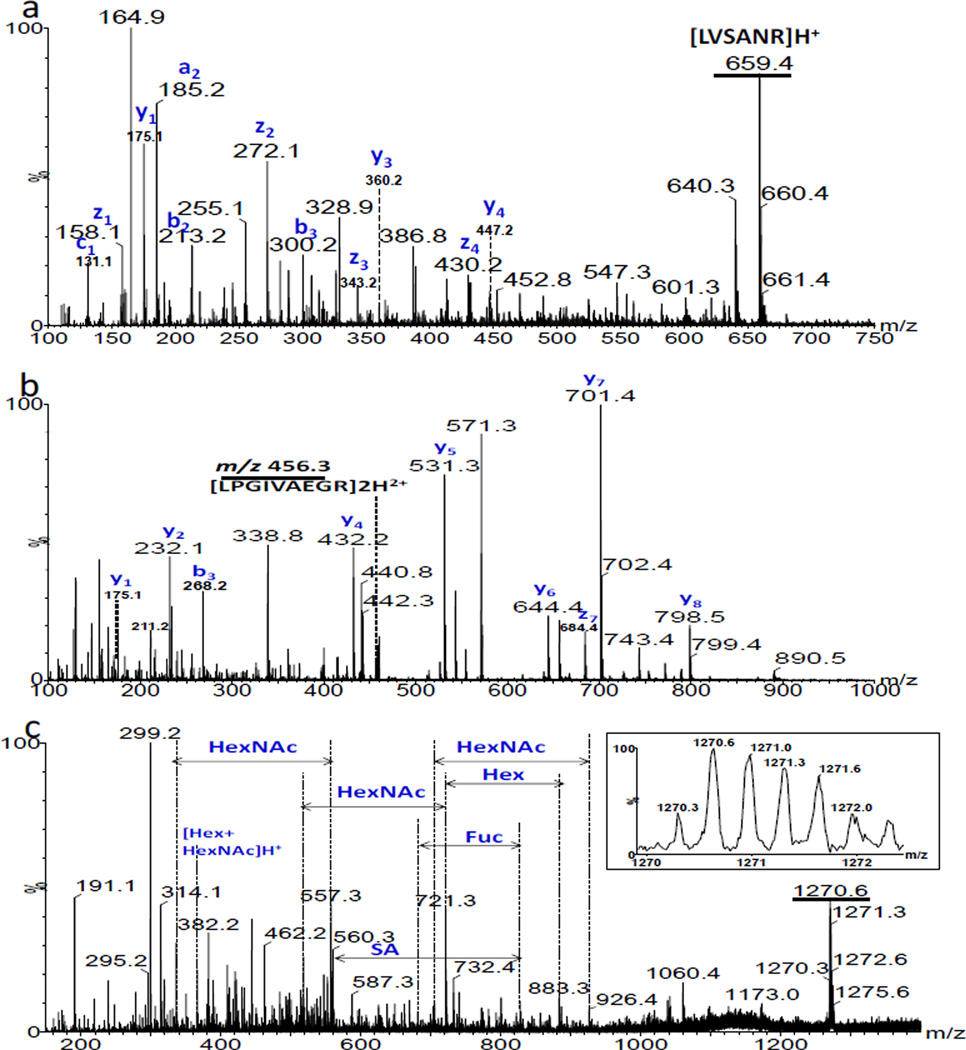
Human antithrombin III (ANT III) is a glycoprotein composed of 464 amino acids having 4 N-linked glycosylation sites (Asn-96, −135, −155 and −192), The carbohydrate chain is primarily of the bi-antennary complex type composed of hexose (Hex), N-acetylhexosamine (HexNAc), fucose (Fuc) and sialic acid (SA) [39, 40]. It functions as a plasma protease inhibitor with physiological anticoagulant activity, circulating in the blood and becoming active when associated with glycosaminoglycans [41]. Fig. 5 displays the IMMS spectrum of ANT III digested with trypsin in the positive mode. The ions were distributed on trend lines I, II and III with class identification of +1 charged peptides, +2 charged peptides and +3 charged glycopeptides, respectively. Their corresponding mass spectra and evidence from dissociation are discussed below. More peptides were observed than glycopeptides for ANT III compared to AGP. This is not surprising since ANT III is a much larger protein and has lower carbohydrate content than AGP. It was observed that the separation between trend lines II and III was slightly obscured in this example. This could presumably be improved by using higher resolution IMS. The traveling wave ion mobility resolving power [32] in this study was ~30–40. It is worth noting that trend line IV denotes a class of compounds with systematic mass differences that may result from the matrix used during the sample preparation or purification steps and is not identified here. A mass spectrum of this trend line (Fig. S3) and an expansion are contained in the supporting information, indicating the presence of some highly regular polymer or polymers as contaminants of the electrosprayed sample. In addition, the region between trend lines III and IV contained high noise levels according to the extracted mass spectrum. IMMS was able to separate the chemical noise from the analytes of interest and was also able to provide information regarding the sample purity. Fig. 6 displays the extracted mass spectra for corresponding trend lines of ANT III. The majority of peaks (labeled with asterisks) in Fig. 6a were identified as singly charged peptides [M+H]+ derived from ANT III. Doubly charged peptides (asterisks labeled) were found in trend line II mainly having the formula [M+2H]2+, while corresponding sodium coordinated peaks were also observed for certain species, for example, m/z 400.7 and 411.7 were the [M+2H]2+ and [M+H+Na]2+ ions for the peptide sequence IPEATNR. Peptide fragments were detected as well; detailed analyses are summarized in Table S3 of the supporting information. A 40% coverage of the amino acid sequence of ANT III was obtained. This relatively low value could be due to inefficient trypsin digestion as discussed above. Fig. 6c is the mass spectrum for trend line III containing triply charged glycopeptides. A series of peaks with mass differences of 22 were observed as shown in the inserted window. However, the situation was different from the charge competition discussed for AGP above. Where all the H+ ion adducts are replaced by Na+ ions stepwise for +3 charged glycopeptides, only four correlated peaks (having mass differences of 22) should be observed which did not match with the experimental spectrum displayed in Fig. 6c. This indicates that an additional –OH has been converted to –ONa, this is likely due to the many hydroxyl groups available on the carbohydrate portion in this specific example. Moreover, it also reflects that a relatively high amount of sodium salt was present in the sample. Further fragmentation was performed for selected compounds within different trend lines from ANT III in Fig. 7. The selected peptide precursor ions were [LVSANR]H+ at m/z 659.4 and [LPGIVAEGR]2H2+ at m/z 456.3. Their corresponding a, b, c, y, and z product ions were observed as shown in Fig. 7a and b, respectively. Fig. 7c shows the MS/MS spectrum of a triply charged glycopeptide of m/z 1270.3 from trend line III and the inset illustrates its isotopic pattern. Neutral losses of Fuc, Hex, HexNAc, SA and the ion of [Hex+HexNAc]H+ were observed as expected, which further supported the class identification of trend line III.
Fig. 5.
2-D IMMS plot of trypsin digested human antithrombin III in positive mode. Trend line I: 2-D region showing separation of +1 charged peptides; Trend line II: 2-D region showing separation of +2 charged peptides; Trend III: 2-D region showing separation of +3 charged glycopeptides; Trend line IV: Unidentified compounds with systematic mass differences.
Fig. 6.
(a) An extracted mass spectrum corresponding to +1 charged peptides (trend line I in Fig. 5). (b) An extracted mass spectrum corresponding to +2 charged peptides (trend line II in Fig. 5.) (c) An extracted mass spectrum corresponding to +3 charged glycopeptides (trend line III in Fig. 5). Asterisks indicate major identified m/z values corresponding to peptide sequences derived from human antithrombin III. For the detailed sequence information and additional non-labeled identified m/z values (low abundance), please see Table S3 in the supporting information.
Fig. 7.
(a) MS/MS spectrum for a +1 charged peptide of m/z 659.4 from tend line I in Fig. 5 using a CE of 36 V. (b) MS/MS spectrum for a +2 charged peptide of m/z 456.3 from trend line II in Fig. 5 using a CE of 25 V. (c) MS/MS spectrum for +3 charged glycopeptide of m/z 1270.3 from trend line III in Fig. 5 using a CE of 50V. The inset illustrates the isotopic pattern for the +3 charged ions. Underlined peaks are precursor ions.
AGP and ANT III in negative IMMS mode
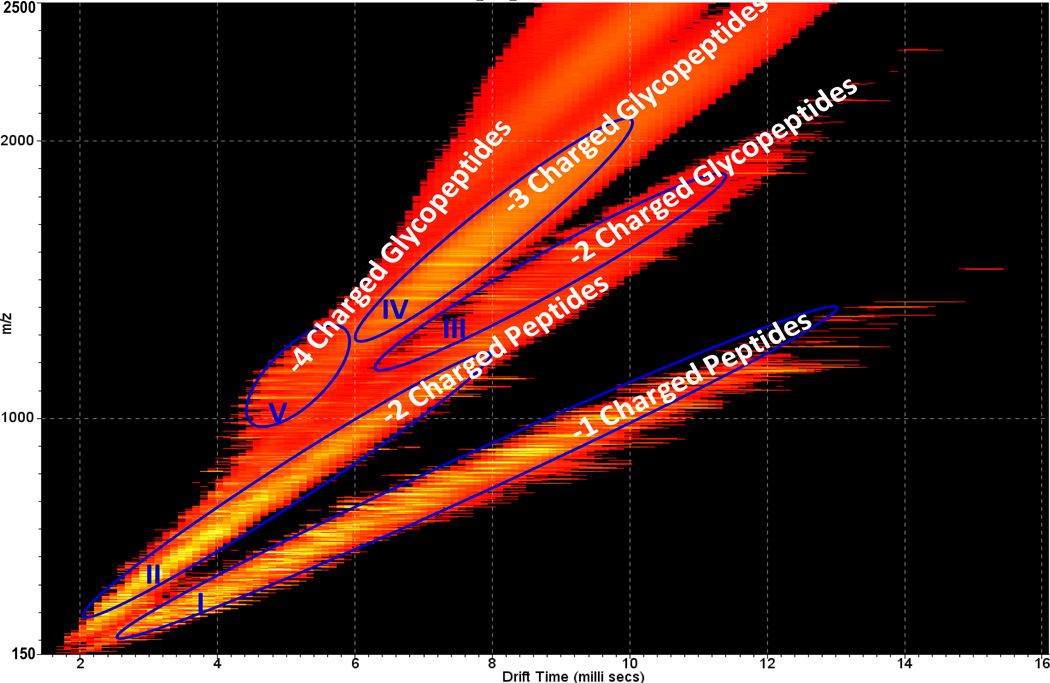
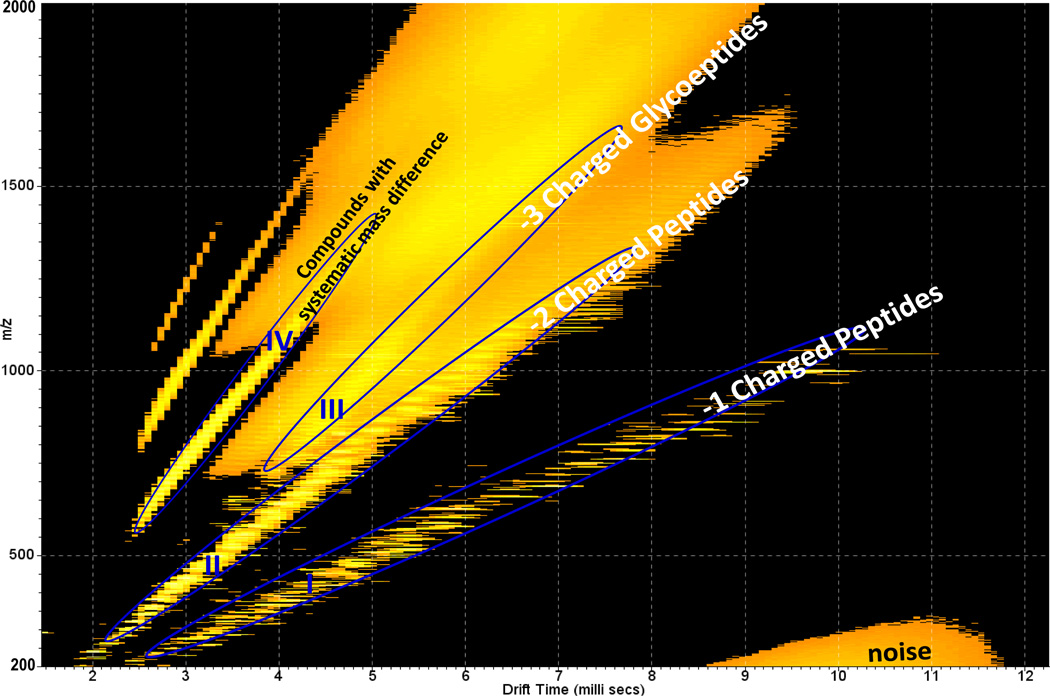
We also evaluated the behavior of glycopeptide ions in negative mode operation of the IMMS instrument. Fig. 8 displays the 2-D IMMS plot of a trypsin digest of AGP in negative mode. Five trend lines were observed including −1 and −2 charged peptides and −2, −3 and −4 charged glycopeptides. The trend line separation obtained was consistent with the results obtained in the positive mode. Fewerions were observed in the negative mode as compared to the positive and this is attributed mainly to the low ionization efficiency of compounds in the negative mode. Data analysis was performed as described above. The extracted mass spectra for trend lines I to V (Fig. S4) and the fragmentation spectra for selected glycopeptides (Fig. S5 and Fig. S6) are included in the supporting information. The negative mode 2-D IMMS plot of the ANT III tryptic digest is shown in Fig. 9. Four trend lines were assigned: they were −1 and −2 charged peptides, −3 charged glycopeptides and unidentified compounds with systematic mass differences, which matched with the positive mode results well as shown in Fig. 5. The region at the bottom of the spectrum was identified as noise according to the extracted mass spectrum (Fig. S7 in supporting information). The same respective region was only slightly visible in the positive mode. The difference may be due to the lower relative sensitivity and S/N ratio in the negative mode as compared to the positive and could be improved by increasing the sample concentration and the data acquisition time. The extracted mass spectra for individual trend lines and MS/MS spectra for selected glycopeptides are displayed in Fig. S8 and Fig. S9 in the supporting information, respectively. The negative mode trend line separation for glycoprotein digests further confirmed and demonstrated the unique separation capability of IMMS, where compounds with structural similarities were able to be grouped into specific 2-D IMMS trend patterns when derived from a complex biological mixture.
Fig. 8.
2-D IMMS plot of trypsin-digested human α-1-acid glycoprotein in negative mode. Trend line I: 2-D region for separation of −1 charged peptides; Trend line II: 2-D region for separation of −2 charged peptides; Trend line III: 2-D region for separation of −2 charged glycopeptides; Trend line IV: 2-D region for separation of −3 charged glycopeptides; Trend line V: 2-D region for separation of −4 charged glycopeptides.
Fig. 9.
2-D IMMS plot of trypsin digested human antithrombin III in negative mode. Trend line I: 2-D region for separation of −1 charged peptides; Trend line II: 2-D region for separation of −2 charged peptides; Trend line III: 2-D region for separation of −3 charged glycopeptides; Trend line IV: Unidentified compounds with systematic mass differences.
Glycopeptide isomer differentiation
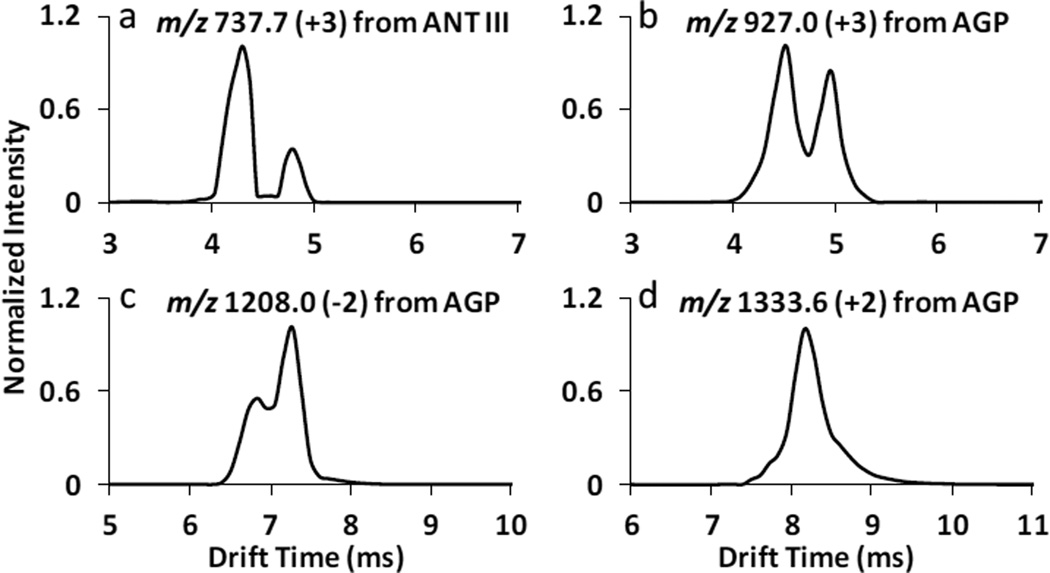
IMS is capable of separating isomeric compounds rapidly [8, 10, 13, 15, 16] based on the ion’s collision cross section. Fig. 10 displays the traveling wave ion mobility spectra of four selected glycopeptides (a) m/z 737.7 with three positive charges from ANT III; (b) m/z 927.0 with three positive charges from AGP; (c) m/z 1208.0 with two negative charges from AGP; (d) m/z 1333.6 with two positive charges from AGP. More than one mobility peak was observed for specific glycopeptides, representing different stereochemical isomers at a single m/z. There were two fully resolved mobility peaks for m/z 737.7; two partially differentiated mobility peaks for m/z 927.0; two isomeric mobility peaks for m/z 1208.0 and a broad mobility peak with barely resolved shoulders for m/z 1333.6. This probably resulted from structure heterogeneity of the carbohydrate components contained in glycopeptides, which may indicate that specific peptides are linked to different carbohydrate isomers. However, the mobility separation shown in Fig. 10 is more complex than the resolution of carbohydrate stereo- or branch isomers themselves. The peptide portion and the interaction between peptide and glycan also affect the overall structural configuration of a glycopeptide, which would influence the mobility resolution. Beside the representative examples in Fig. 10, the majority of glycopeptides had a broad mobility peak detected similar to Fig. 10d, demonstrating that multiple structure variants may co-elute. IMS systems with higher resolving power would be needed for complete and better separation among glycopeprtide isomers.
Fig. 10.
Traveling wave ion mobility spectra of selected glycopeptides (a) +3 charged glycopeptide m/z 737.7 from ANT III (in trend line III in Fig. 5); (b) +3 charged glycopeptide m/z 927.0 from AGP (in trend line IV in Fig. 1); (c) −2 charged glycopeptide m/z 1208.0 from AGP (in trend line III in Fig. 8); (d) +2 charged glycopeptide m/z 1333.6 from AGP (in trend line III in Fig.1). Note: the m/z values labeled are monoisotopic masses.
Conclusion
In this study, we demonstrate the use of ion mobility mass spectrometry to separate and identify peptides and glycopeptides (from trypsin-digested glycoproteins) having different charge states, using both positive and negative ESI. Only standard proteolytic digestion was needed for IMMS analysis, where glycopeptide components separated from peptides in unique 2-D trend regions. This enabled glycopeptides or peptides to be isolated in individual mobility windows in the millisecond time frame with far fewer peptide components, which would typically require LC separations to achieve, sometimes over the course of hours [36]. Overall, the advantages provided by IMMS include structural trend line and charge state separation, millisecond timescales, the capability to assess isomeric heterogeneity of ionic species and reduced chemical noise for the improved detection of low abundance ions. These results may lead to the development of novel strategies for high throughput identification of complex glycoproteins.
Supplementary Material
Acknowledgements
This work was supported in part by the National Institutes of Health with grant # 5R33RR020046.
References
- 1.Eiceman GA, Karpas Z. Ion mobility spectrometry. 2nd edn. Boca Raton: Taylor and Francis Group, LLC; 2005. [Google Scholar]
- 2.Eiceman GA. Ion-mobility spectrometry as a fast monitor of chemical composition. Trends Anal Chem. 2002;21:259–275. [Google Scholar]
- 3.Ewing RG, Atkinson DA, Eiceman GA, Ewing GJ. A critical review of ion mobility spectrometry for the detection of explosives and explosive related compounds. Talanta. 2001;54:515–529. doi: 10.1016/s0039-9140(00)00565-8. [DOI] [PubMed] [Google Scholar]
- 4.Kanu AB, Hill HH., Jr Identity confirmation of drugs and explosives in ion mobility spectrometry using a secondary drift gas. Talanta. 2007;73:692–699. doi: 10.1016/j.talanta.2007.04.058. [DOI] [PubMed] [Google Scholar]
- 5.Kanu AB, Dwivedi P, Tam M, Matz L, Hill HH., Jr Ion mobility-mass spectrometry. J Mass Spectrom. 2008;43:1–22. doi: 10.1002/jms.1383. [DOI] [PubMed] [Google Scholar]
- 6.Dwivedi P, Schultz AJ, Hill HH., Jr Metabolic profiling of human blood by high-resolution ion mobility mass spectrometry (IM-MS) Int J Mass Spectrom. 2010;298:78–90. doi: 10.1016/j.ijms.2010.02.007. [DOI] [PMC free article] [PubMed] [Google Scholar]
- 7.Kaplan K, Dwivedi P, Davidson S, Yang Q, Tso P, Siems W, Hill HH., Jr Monitoring dynamic changes in lymph metabolome of fasting and fed rats by electrospray ionization-ion mobility mass spectrometry (ESI-IMMS) Anal Chem. 2009;81:7944–7953. doi: 10.1021/ac901030k. [DOI] [PMC free article] [PubMed] [Google Scholar]
- 8.Clowers BH, Dwivedi P, Steiner WE, Hill HH., Jr Separation of sodiated isobaric disaccharides and trisaccharides using electrospray ionization-atmospheric pressure ion mobility-time of flight mass spectrometry. J Am Soc Mass Spectrom. 2005;16:660–669. doi: 10.1016/j.jasms.2005.01.010. [DOI] [PubMed] [Google Scholar]
- 9.Isailovic D, Kurulugama RT, Plasencia MD, Stokes ST, Kyselova Z, Goldman R, Mechref Y, Novotny MV, Clemmer DE. Profiling of human serum glycans associated with liver cancer and cirrhosis by IMS-MS. J Proteome Res. 2008;7:1109–1117. doi: 10.1021/pr700702r. [DOI] [PMC free article] [PubMed] [Google Scholar]
- 10.Zhu M, Bendiak B, Clowers BH, Hill HH., Jr Ion mobility mass spectrometry analysis of isomeric carbohydrate precursor ions. Anal Bioanal Chem. 2009;394:1853–1867. doi: 10.1007/s00216-009-2865-y. [DOI] [PMC free article] [PubMed] [Google Scholar]
- 11.Eiceman GA, Young D, Smith GB. Mobility spectrometry of amino acids and peptides with matrix assisted laser desorption and ionization in air at ambient pressure. Microchemical Journal. 2005;81:108–116. [Google Scholar]
- 12.Valentine SJ, Plasencia MD, Liu X, Krishnan M, Naylor S, Udseth HR, Smith RD, Clemmer DE. Toward Plasma Proteome Profiling with Ion Mobility-Mass Spectrometry. J Proteome Res. 2006;5:2977–2984. doi: 10.1021/pr060232i. [DOI] [PubMed] [Google Scholar]
- 13.Wu C, Siems WF, Klasmeier J, Hill HH., Jr Separation of isomeric peptides using electrospray ionization/high-resolution ion mobility spectrometry. Anal Chem. 2000;72:391–395. doi: 10.1021/ac990601c. [DOI] [PubMed] [Google Scholar]
- 14.Fenn LS, Kliman M, Mahsut A, Zhao SR, Mclean JA. Characterizing ion mobility-mass spectrometry conformation space for the analysis of complex biological samples. Anal Bioanal Chem. 2009;394:235–244. doi: 10.1007/s00216-009-2666-3. [DOI] [PMC free article] [PubMed] [Google Scholar]
- 15.Plasencia ND, Isailovic D, Merenbloom SI, Mechref Y, Clemmer DE. Resolving and assigning N-linked glycan structural isomers from ovalbumin by IMS-MS. J Am Soc Mass Spectrom. 2008;19:1706–1715. doi: 10.1016/j.jasms.2008.07.020. [DOI] [PMC free article] [PubMed] [Google Scholar]
- 16.Williams JP, Bugarcic T, Habtemariam A, Giles K, Campuzano I, Rodger PM, Sadler PJ. Isomer separation and gas-phase configurations of organoruthenium anticancer complexes: ion mobility mass spectrometry and modeling. J Am Soc Mass Spectrom. 2009;20:1119–1122. doi: 10.1016/j.jasms.2009.02.016. [DOI] [PubMed] [Google Scholar]
- 17.Morris HR, Chalabi S, Panico M, Sutton-Smith M, Clark GF, Goldberg D, Dell A. Glycoproteomics: Past, present and future. Int J Mass Spectrom. 2007;259:16–31. [Google Scholar]
- 18.An HJ, Kronewitter SR, de Leoz MLA, Lebrilla CB. Glycomics and Disease Markers. Curr Opin Chem Biol. 2009;13:601–607. doi: 10.1016/j.cbpa.2009.08.015. [DOI] [PMC free article] [PubMed] [Google Scholar]
- 19.Rudd PM, Elliott T, Cresswell P, Wilson IA, Dwek RA. Glycosylation and the Immune System. Science. 2001;291:2370–2376. doi: 10.1126/science.291.5512.2370. [DOI] [PubMed] [Google Scholar]
- 20.Morelle W, Michalski JC. Glycomics and Mass Spectrometry. Curr Pharm Des. 2005;11:2615–2645. doi: 10.2174/1381612054546897. [DOI] [PubMed] [Google Scholar]
- 21.Imre T, Schlosser G, Pocsfalvi G, Siciliano R, Szöllösi É, Kremmer T, Malorni A, Vékey K. Glycosylation site analysis of human alpha-1-acid glycoprotein (AGP) by capillary liquid chromatography-electrospray mass spectrometry. J Mass Spectrom. 2005;40:1472–1483. doi: 10.1002/jms.938. [DOI] [PubMed] [Google Scholar]
- 22.Kremmer T, Szöllösi É, Boldizsár M, Vincze B, Ludányi K, Imre T, Schlosser G, Vékey K. Liquid chromatographic and mass spectrometric analysis of human serum acid alpha-1-glycoprotein. Biomed Chromatogr. 2004;18:323–329. doi: 10.1002/bmc.324. [DOI] [PubMed] [Google Scholar]
- 23.Fenn LS, McLean JA. Simultaneous glycoproteomics on the basis of structure using ion mobility-mass spectrometry. Mol BioSyst. 2009;5:1298–1302. doi: 10.1039/b909745g. [DOI] [PubMed] [Google Scholar]
- 24.Olivova P, Chen W, Chakraborty AB, Gebler JC. Determination of N-glycosylation sites and site heterogeneity in a monoclonal antibody by electrospray quadrupole ion-mobility time-of-flight mass spectrometry. Rapid Commun Mass Spectrom. 2008;22:29–40. doi: 10.1002/rcm.3330. [DOI] [PubMed] [Google Scholar]
- 25.Giles K, Pringle SD, Worthington KR, Little D, Wildgoose JL, Bateman RH. Applications of a travelling wave-based radio-frequency only stacked ring ion guide. Rapid Commun Mass Spectrom. 2004;18:2401–2414. doi: 10.1002/rcm.1641. [DOI] [PubMed] [Google Scholar]
- 26.Pringle SD, Giles K, Wildgoose JL, Williams JP, Slade SE, Thalassinos K, Bateman RH, Bowers MT, Scrivens JH. An investigation of the mobility separation of some peptide and protein ions using a new hybrid quadrupole/travelling wave IMS/oa-ToF instrument. Int J Mass Spectrom. 2007;261:1–12. [Google Scholar]
- 27.Alley WR, Jr, Mechref Y, Novotny MV. Characterization of glycopeptides by combining collision-induced dissociation and electron-transfer dissociation mass spectrometry data. Rapid Commun Mass Spectrom. 2009;23:161–170. doi: 10.1002/rcm.3850. [DOI] [PubMed] [Google Scholar]
- 28.Bongers J, Devincentis J, Fu J, Huang P, Kirkley DH, Leister K, Liu P, Ludwig R, Rumney K, Tao L, Wu W, Russell RJ. Characterization of glycosylation sites for a recombinant IgG1 monoclonal antibody and a CTLA4-Ig fusion protein by liquid chromatography-mass spectrometry peptide mapping. J Chromatog A. 2011;1218:8140–8149. doi: 10.1016/j.chroma.2011.08.089. [DOI] [PubMed] [Google Scholar]
- 29.Hanisch FG. O-glycoproteinomics: site-specific O-glycoprotein analysis by CID/ETD electrospray ionization tandem mass spectrometry and top-down glycoprotein sequencing by in-source decay MALDI mass spectrometry. Meth Mol Biol. 2012;842:179–189. doi: 10.1007/978-1-61779-513-8_10. [DOI] [PubMed] [Google Scholar]
- 30.Wang D, Hincapie M, Rejtar T, Karger BL. Ultrasensitive characterization of site-specific glycosylation of affinity-purified haptoglobin from lung cancer patient plasma using 10 μm i.d. porous layer open tubular (PLOT) LC-LTQ-CID/ETD-MS. Anal Chem. 2011;83:2029–2037. doi: 10.1021/ac102825g. [DOI] [PMC free article] [PubMed] [Google Scholar]
- 31.Giles K, Wildgoose JL, Langridge DJ, Campuzano I. A method for direct measurement of ion mobilities using a travelling wave ion guide. Int J Mass Spectrom. 2010;298:10–16. [Google Scholar]
- 32.Shvartsburg AA, Smith RD. Fundamentals of traveling wave ion mobility spectrometry. Anal Chem. 2008;80:9689–9699. doi: 10.1021/ac8016295. [DOI] [PMC free article] [PubMed] [Google Scholar]
- 33.Fournier T, Medjoubi-N N, Porquet D. Alpha-1-acid glycoprotein. Biochimica et Biophysica Acta. 2000;1482:157–171. doi: 10.1016/s0167-4838(00)00153-9. [DOI] [PubMed] [Google Scholar]
- 34.Fournet B, Montreuil J, Strecker G, Dorland L, Haverkamp J, Vliegenthart JFG, Binette JP, Schmid K. Determination of the primary structures of 16 asialo-carbohydrate units derived from human plasma alpha 1-acid glycoprotein by 360-MHz 1H NMR spectroscopy and permethylation analysis. Biochemistry. 1978;17:5206–5214. doi: 10.1021/bi00617a021. [DOI] [PubMed] [Google Scholar]
- 35.Treuheit MJ, Costello CE, Halsall HB. Analysis of the five glycosylation sites of human α1-acid glycoprotein. Biochem J. 1992;283:105–112. doi: 10.1042/bj2830105. [DOI] [PMC free article] [PubMed] [Google Scholar]
- 36.Cardon P, Parente JP, Leroy Y, Montreuil J, Fournet B. Separation of sialyloligosaccharides by high-performance liquid chromatography: Application to the analysis of mono-, di-, tri- and tetrasialyl-oligosaccharides obtained by hydrazinolysis of α1-acid glycoprotein. J Chromatogr. 1986;356:135–146. doi: 10.1016/s0021-9673(00)91473-0. [DOI] [PubMed] [Google Scholar]
- 37.Halbeek HV, Dorland L, Vliegenthart JFG, Montreuil J, Fournet B, Schmid K. Characterization of the microheterogeneity in glycoproteins by 500-MHz 1H NMR spectroscopy of glycopeptide preparations. J Biol Chem. 1981;256:5588–5590. [PubMed] [Google Scholar]
- 38.Spiro RG. Analysis of sugars found in glycoproteins. Meth Enzymol. 1966;8:3–26. [Google Scholar]
- 39.Bunkenborg J, Pilch BJ, Podtelejnikov AV, Wiśniewski JR. Screening for N-glycosylated proteins by liquid chromatography mass spectrometry. Proteomics. 2004;4:454–465. doi: 10.1002/pmic.200300556. [DOI] [PubMed] [Google Scholar]
- 40.Picard V, Ersdal-Badju E, Bock SC. Partial glycosylation of antithrombin III asparagine-135 is caused by the serine in the third position of its N-glycosylation consensus sequence and is responsible for production of the β-antithrombin III isoform with enhanced heparin affinity. Biochemistry. 1995;34:8433–8440. doi: 10.1021/bi00026a026. [DOI] [PubMed] [Google Scholar]
- 41.McCoy AJ, Pei XY, Skinner R, Abrahams JP, Carrell RW. Structure of β-antithrombin and the effect of glycosylation on antithrombin’s heparin affinity and activity. J Mol Biol. 2003;326:823–833. doi: 10.1016/s0022-2836(02)01382-7. [DOI] [PubMed] [Google Scholar]
Associated Data
This section collects any data citations, data availability statements, or supplementary materials included in this article.


