

Abstract
Purpose
The present study aims to investigate whether the combination treatment of cordycepin (an extracted pure compound from Cordyceps sinensis) and cisplatin (a platinum-based chemotherapy drug) has better apoptotic effect in head and neck squamous cell carcinoma (HNSCC).
Methods
The apoptotic influences of cordycepin and/or cisplatin treatments to human OC3, OEC-M1, and FaDu HNSCC cells were investigated by morphological observations, viability assay, flow cytometry assay, and Western blotting methods.
Results
Data showed that the cell death phenomenon increased as the dosage of cordycepin or cisplatin increased, and it appeared more in cordycepin plus cisplatin cotreatment among three cell lines. Cell survival rates significantly decreased as the dosage of cordycepin or cisplatin increased, and the better apoptotic effects were observed in cotreatment. Cell cycle analysis further demonstrated that percentages of subG1 cells in cordycepin or cisplatin treatments significantly increased, suggesting that cells underwent apoptosis, and cordycepin plus cisplatin induced many more subG1 cells. Furthermore, cordycepin or cisplatin induced caspase-8, caspase-9, caspase-3, and poly adenosine diphosphate-ribose polymerase protein cleavages, and stimulated c-Jun NH2-terminal kinase, extracellular signal-regulated kinase, and p38 protein phosphorylations. Moreover, cordycepin plus cisplatin cotreatment significantly activated those proteins with much better effects among three cell lines.
Conclusion
Cordycepin plus cisplatin have better apoptotic effect by activating caspase activation with possible MAPK pathway involvement in HNSCC cells.
Keywords: cordycepin, cisplatin, apoptosis, caspase, MAPK, HNSCC
Introduction
Betel quid-related oral cavity cancer is a unique type of head and neck squamous cell carcinoma (HNSCC) that occurs with an areca nut chewing habit, which is endemic in many areas around the world.1 In Taiwan, there are over 2,000 deaths in oral cavity cancer yearly, and it is still increasing.2 Surgery and radiation are often used to treat local advanced HNSCC,3 but these treatments would damage a patient’s face and affect his or her salivary secretion and taste functions. For late-staged patients, chemotherapy is often used in combination with surgery and/or radiotherapy in order to improve the poor survival rate.4 The addition of platinum-based chemotherapy, such as cisplatin (cis-DDP) or carboplatin (CBDCA), is the major agent in HNSCC treatment.5 Cisplatin is the most efficient agent used to treat HNSCC; however, the development of cisplatin-resistance is the major limitation of treatment.6 Studies have shown the possible mechanisms involved in cisplatin resistance, including the reduction of intracellular accumulation of the chemotherapy drug, the down-regulation of proapoptotic proteins, the increase of glutathione, and the upregulation of antiapoptotic proteins.7
Cordycepin, a pure extracted compound of Cordyceps sinensis, has been shown to have antitumor properties as it activates cysteine aspartic-specific protease (caspase) pathways.8,9 It is reported that cordycepin could inhibit the formation of polyadenylate polymerase or inactivate messenger ribonucleic acid (RNA) polyadenylation to induce tumor cell apoptosis,10 which is characterized by cellular rounding-up, cytoplasmic contraction, plasma membrane blebbing, chromatin condensation, and deoxyribonucleic acid (DNA) fragmentation.11 During the course of apoptosis, the activation of caspases is commonly thought to be one of the earliest points in the no-return pathway of apoptosis.12 In general, caspase can be divided into two groups: initiator caspases (including caspase-8, caspase-9, and caspase-10) and effector caspases (including caspase-3, caspase-6, and caspase-7). Initiator caspases are responsible for cleaving and activating effector caspases.13 The cleavage of caspases, such as caspase-7 and caspase-3, could be activated, which will further cleave poly adenosine diphosphate-ribose polymerase (PARP), which is responsible for DNA repair,12 and result in the execution of cell death.14
Besides caspase cascades, mitogen-activated protein kinases (MAPKs) are also involved in apoptosis regulation.15 MAPKs consist of three family membranes: extracellular signal-regulated kinase (ERK), c-Jun NH2-terminal kinase (JNK), and p38 proteins.16 Studies have been reported that stress signals can activate the stress-activated protein kinases/JNK protein kinases, which mediate cellular steps in the apoptosis of some cell types.17,18 It has been shown that ERK is response to growth stimuli is the important signal for anti-apoptosis;16 however, the involvement of p38 in apoptosis is diverse. Phosphorylation of p38 can be initiated by MKK3 and MKK6 at the threonine and tyrosine regions, which control many transcriptional factors and kinases to enhance cell survival or prompt apoptosis.16 Accordingly, caspase and MAPKs pathways may play important roles in the apoptosis of tumor cells activated by chemotherapy agents.
Cordycepin and cisplatin both have antitumor effects.6,8,9,19 Thus, the attempt to clarify the combined effect of cisplatin plus cordycepin on HNSCC cell death in addition to an investigation of the underlying mechanisms is being conducted in the present study. Three cell lines, OC3, OEC-M1, and FaDu cells, were used in the investigation. It should be noted that better effects in OC3, OEC-M1, and FaDu cells on apoptosis by cordycepin plus cisplatin were observed. These findings could encourage the development of more effective chemotherapy agents with different concomitant administration against betel nut-induced oral cancers.
Materials and methods
Chemicals
Cordycepin, cisplatin, penicillin-streptomycin, methylthiazol tetrazolium (MTT), dimethyltetrazolium bromide (DMSO), ribonuclease A, and propidium iodine (PI) were purchased from Sigma-Aldrich (St Louis, MO, USA). Fetal bovine serum, Dulbecco’s Modified Eagle’s Medium (DMEM), and Keratinocyte-SFM medium were purchased from Gibco® (Life Technologies, Carlsbad, CA, USA). Sodium hydroxide was purchased from Merck KGaA (Darmstadt, Germany). In addition, (4-(2-hydroxyethyl)-1-piperazineethanesulfonic acid) (HEPES) was purchased from Mallinckrodt Baker, Inc, (Phillipsburg, NJ, USA). Sodium bicarbonate, sodium carbonate, and sodium chloride were purchased from Riedel der Haen (Seelze, Germany). Fetal bovine serum, Roswell Park Memorial Institute 1640 medium, and lyophilized trypsin-ethylenediaminetetraacetic acid were purchased from Gibco® (Life Technologies). Tween 20, sodium hydroxide, and hydrochloric acid were purchased from Merck KGaA. Sodium dodecyl sulfate (SDS) and acrylamine, as well as Tris (base) were purchased from JT Baker® (Avantor™ Performance Materials, Phillipsburg, NJ, USA). Antibodies against cleaved caspase-8, caspase-9, caspase-3, and β-actin, as well as antibodies against phosphorylated-JNK, phosphorylated-ERK, and phosphorylated-p38 were purchased from Cell Signaling Technology, Inc, (Beverly, MA, USA). Anti-PARP antibody was purchased from Oncogene Research Products (San Diego, CA, USA).
Cell lines and cell culture
Three HNSCC cell lines – OC3 (established from an oral squamous cell carcinoma [OSCC] in a long-term areca [betel] chewer who does not smoke), OEC-M1 (derived from gingival epidermal carcinoma), and FaDu (a human pharyngeal squamous cell carcinoma) – were used in the experiments. It should be noted that OC3 and OEC-M1 cells are indigenous oral cavity cancer cell lines in Taiwan.20 OC3 cells were maintained in DMEM in addition to a twofold volume of keratinocyte-SFM mixed medium supplemented with 24 mM of NaHCO3, 25 mM of HEPES, 100 ppm of penicillin, 100 ppm of streptomycin, and 10% v/v heat-inactivated fetal bovine serum; pH7.4. OEC-M1 cells were maintained in Roswell Park Memorial Institute 1640 medium supplemented with 24 mM of NaHCO3, 25 mM of HEPES, 10,000 U of penicillin, 10,000 U of streptomycin, and 10% heat-inactivated fetal bovine serum; and pH 7.421 FaDu cells were cultured in high-glucose DMEM supplemented with 10% fetal bovine serum and 0.1% penicillin/streptomycin. Cells were incubated in a humidified atmosphere containing 95% air and 5% CO2 at 37°C.20,21
MTT cell viability test
An MTT assay was employed to determine cell viability with the treatment of cordycepin and/or cisplatin. OC3 and OEC-M1 cells were seeded in a 96-well plate (Techno Plastic Products AG, Trasadingen, Switzerland) with 1 × 10⁴ cells in 100 μL of serum medium among each well, and FaDu cells were seeded in a 96-well plate with 8 × 10³ cells in 100 μL of serum medium among each well. After reaching 70%–80% confluence, cells were treated without or with cordycepin, cisplatin, or both agents in various combinations of concentrations (10 μM, 100 μM, or 1 mM of cordycepin alone; 30 μM, 300 μM, or 600 μM of cisplatin alone; and 300 μM or 600 μM of cisplatin combined with 100 μM of cordycepin, respectively, for 24 hours). MTT was added with a final concentration of 0.5 mg/mL, and then incubated for 4 hours at 37°C. The medium was removed and DMSO (50 μL) was added into each well to dissolve the crystals by gently shaking the plate for 20 minutes in the dark. The absorbance (optical density) values in each treatment were then determined at λ = 590 nm by an enzyme-linked immunosorbent assay microplate reader (VersaMax, Nordion, Ottawa, ON, Canada).
Morphological study
OC3 and OEC-M1 cells were seeded at a concentration of 6 × 10⁵ cells and FaDu cells were seeded at a concentration of 4.5 × 10⁵ cells in a 6 cm Petri dish (Techno Plastic Products AG) supplemented with 2 mL of serum medium. After reaching 70%–80% confluence, cells were treated without or with 100 μM cordycepin, 300 μM cisplatin, 600 μM cisplatin, or 100 μM cordycepin combined with 300 μM or 600 μM cisplatin for 24 hours, respectively. Cell morphology was then observed and recorded under light microscopy (Olympus CK40; Olympus Corporation, Tokyo, Japan).
Flow cytometry analysis
In order to investigate whether cordycepin and/or cisplatin could induce cell apoptosis, flow cytometric analysis was used with PI stain to determine both DNA fragmentation and the redistribution of the cell cycle. OC3 and OEC-M1 cells were seeded in a 6 cm Petri dish with 2 mL of serum medium, which contained 6 × 10⁵ cells, while FaDu cells were seeded at a concentration of 4.5 × 10⁵ cells. After reaching 70%–80% confluence, cells were treated with or without 100 μM of cordycepin only; 300 μM or 600 μM of cisplatin only; or 100 μM of cordycepin combined with 300 μM or 600 μM of cisplatin for 24 hours, respectively. The treated cells were harvested with trypsin, washed with phosphate buffered saline (PBS), and fixed in 75% ethanol for at least 2 hours at −20°C. After fixation, cells were washed in cold PBS and then collected by centrifugation and stained with PI solution (40 μg/mL of PI and 100 μg/mL of ribonuclease in PBS). The stained cells were analyzed using a fluorescence activated cell sorter (FACScan™; BD Biosciences, San Jose, CA, USA) at λ = 488 nm and analyzed by CellQuest™ software (BD Biosciences). The DNA content distribution of normal growing cells is characterized by two peaks phenomenon; G1/G0 and G2/M phases. The G1/G0 phase indicates that cells are arrested at the resting state of the cell cycle with the most diploid DNA content, while cell DNA content in the G2/M phase increases as a consequence of progressing in cell cycle. Cells in the subG1 phase have the least amount of DNA content in the cell cycle distribution, which is called hypodiploid. The hypodiploid DNA content represents the fragmentation of DNA, indicating cell apoptosis.17
Immunoblotting analysis
Cells were lysed and protein extraction was performed. Protein concentration of the cell lysates was determined by the Lowry et al method.22 Cell proteins (30 μg) were separated in 12% of SDS-polyacrylamide gel, which performed at 100 V for 2 hours using a standard running buffer (24 mM Tris-HCl, 0.19 M glycine, 0.5% SDS, pH8.3), and the proteins were electrophoretically transferred to a polyvinylidene difluoride membrane at 400 mA for 2 hours in transfer buffer (20 mM Tris-HCl, 150 mM glycine, 10% methanol, and 0.01% SDS). The membranes were blocked with 4% nonfat milk, washed and subsequently incubated with a specific antibody. After washing, the membrane was incubated with horseradish peroxidase-conjugated goat antimouse antibody or goat antirabbit antibody, and then visualized by an enhanced chemiluminescence detection kit (Amersham-Pharmacia International PLC, Amersham, UK). The optical density of each protein band was quantitated using a computer-assisted image analysis system (Quantity One, Huntington Station, NY, USA).23 The amount of β-actin (43 kDa) in each lane was also detected as a control.
Statistics
Each data point of the bar in the figures represents the mean ± standard error of the mean of three separate experiments. Statistically significant differences between treatments and controls were determined by one-way analysis of variance, and then Tukey’s test was used for post hoc testing. Statistical significance was set at P<0.05.
Results
Effect of cordycepin and/or cisplatin on morphological change in HNSCC cell lines
OC3, OEC-M1, and FaDu cells were treated with 100 μM of cordycepin only; 300 μM or 600 μM of cisplatin only; or 100 μM of cordycepin combined with 300 μM or 600 μM of cisplatin for 24 hours, respectively, and morphological changes related to cell death were examined under light microscopy. Among the three cell lines, cells in the control and 0.5% DMSO treatments showed a polygonal shape with a healthy appearance, which is a normal cell growth phenomenon (Figure 1Aa, Ab, Ba, Bb, Ca, and Cb). Twenty-four hours after treatment with 100 μM of cordycepin and 300 μM of cisplatin, cells appeared to be rounded-up, but they still adhered to the ground matrix (Figure 1Ac, Ad, Bc, Bd, Cc, and Cd). After 24 hours of treatment with 600 μM of cisplatin, many cells rounded up, with some floating in medium (Figure 1Ae, Be, and Ce). A combination of 100 μM of cordycepin plus 300 μM or 600 μM of cisplatin treatments for 24 hours resulted in a greater loss of cell attachment to ground matrix, more appearance of membrane blebbings, and more floating cells (Figure 1Af, Ag, Bf, Bg, Cf, and Cg). These phenomena suggested that a combination of cordycepin plus cisplatin treatments induced apoptotic cell death in all three cell lines, which was more effective than cordycepin or cisplatin alone.
Figure 1.

Effect of cordycepin and/or cisplatin on morphological change in HNSCC cell lines.
Notes: Three oral cavity cancer cell lines ([A] OC3; [B] OEC-M1; and [C] FaDu) were treated in plain medium (a), medium with DMSO (0.5%) (b), medium with 100 μM cordycepin (c), medium with 300 μM cisplatin (d), medium with 600 μM cisplatin (e), medium with 100 μM cordycepin plus 300 μM cisplatin (f), and medium with 100 μM cordycepin plus 600 μM cisplatin (g) for 24 hours. Morphological changes of cells were examined under light microscopy (bar: 0.1 mm; arrow: rounded cells). Round-up cells were readily observed and are indicated by the arrows. Experiments were performed three times with similar results.
Abbreviations: HNSCC, head and neck squamous cell carcinoma; DMSO, dimethyltetrazolium bromide.
Effects of cordycepin and/or cisplatin on cell viability in HNSCC cell lines
HNSCC cell morphological changes suggested that cordycepin and/or cisplatin might be involved in cell death. The MTT viability test was used to further examine cell viability. In the OC3 cell line, the cell survival rate with a treatment of 100 μM of cordycepin alone was 77%; 300 μM or 600 μM of cisplatin alone showed cell survival rates of 82% and 65%, respectively; and cordycepin (100 μM) plus cisplatin (300 μM or 600 μM) showed cell survival rates of 52% and 58%, respectively, which demonstrated that the cordycepin plus cisplatin cotreatment could significantly reduce the cell survival rate (Figure 2A) (P<0.05). In fact, the cordycepin (100 μM) plus cisplatin (600 μM) treatment illustrated a synergistic cell death phenomenon (Figure 2A). In the OEC-M1 cell line, the cell survival rate with a treatment of 100 μM of cordycepin alone was 59%; the cell survival rates with 300 μM or 600 μM of cisplatin alone were 77% and 25%, respectively; and cell survival rates with cordycepin (100 μM) plus cisplatin (300 μM or 600 μM) were 45% and 28%, respectively, which demonstrated that the combination of cordycepin (100 μM) plus cisplatin (300 μM) could significantly reduce the cell survival rate (Figure 2B) (P<0.05). In the FaDu cell line, the cell survival rate with the 100 μM of cordycepin treatment alone was 68%; the cell survival rates with 300 μM or 600 μM of cisplatin alone were 74% and 50%, respectively; and the cell survival rates with the cordycepin (100 μM) plus cisplatin (300 μM or 600 μM) treatments were 45% and 23%, respectively, which demonstrated that the combination of cisplatin plus cordycepin could significantly reduce the cell survival rate (Figure 2C) (P<0.05).
Figure 2.
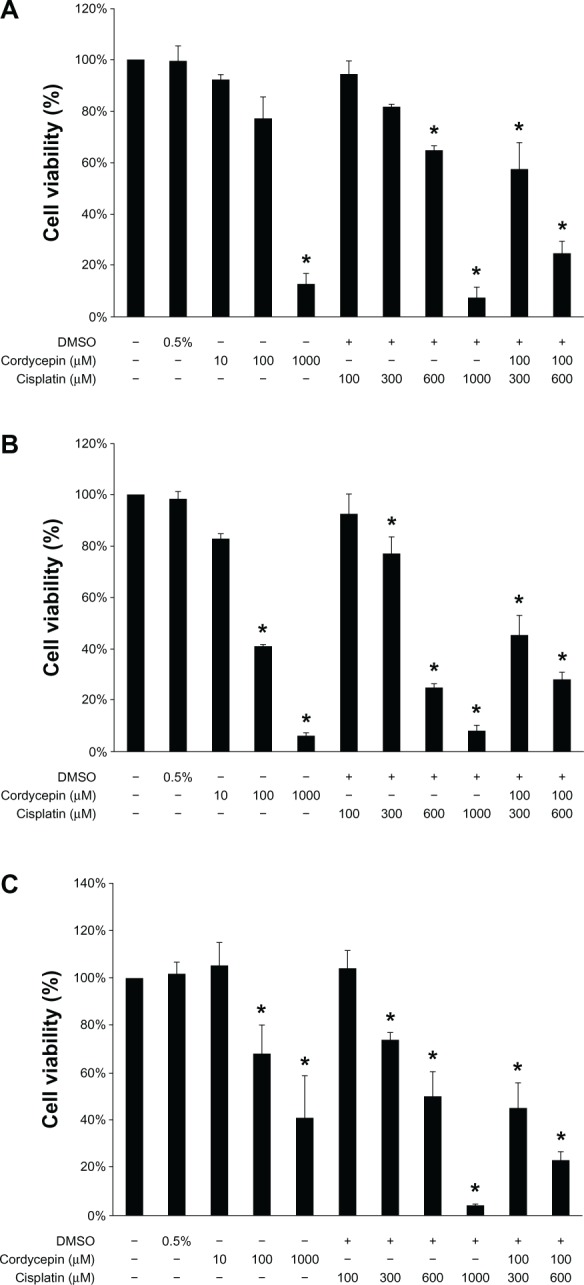
Effects of cordycepin and/or cisplatin on cell viability in HNSCC cell lines.
Notes: Cells (1 × 10⁴ cells/well for OC3 and OEC-M1; 8 × 10³ cells/well for FaDu) were treated with plain medium, medium with DMSO (0.5%), cordycepin alone (10 μM, 100 μM, and 1 mM), cisplatin alone (100 μM, 300 μM, 600 μM, and 1 mM) or cotreatment with cordycepin (100 μM) plus cisplatin (300 and 600 μM, respectively) for 24 hours ([A] OC3; [B] OEC-M1; and [C] FaDu). Cell viability was quantified by MTT assay. Results are expressed as percentages of cell growth relative to the initial number of viable cells in controls (as 100%). Data represent the mean ± standard error of the mean of three separate experiments. Significant difference from the control (plain medium) (P<0.05).
Abbreviations: DMSO, dimethyltetrazolium bromide; HNSCC, head and neck squamous cell carcinoma; MTT, methylthiazoletetrazolium.
Effects of cordycepin and/or cisplatin on cell cycle in HNSCC cell lines
To further investigate whether cordycepin and/or cisplatin could induce apoptosis, OC3, OEC-M1, and FaDu cells were examined by flow cytometry analysis to determine whether DNA fragmentation occurred, and whether there was any change in cell cycle progression. Distribution of the subG1, G1, and G2/M phase cells among the OC3, OEC-M1, and FaDu cells with different treatments were illustrated in Figure 3A–C, respectively. The results showed that cordycepin (100 μM) plus cisplatin (300 μM or 600 μM) could notably induce more subG1 phase cells among the three cell lines (Figure 3A–C). In order to elucidate the changes of the subG1, G1, and G2/M phase cells between different treatments, the cell number percentage among the OC3, OEC-M1, and FaDu cells from Figure 3A–C were statistically analyzed and illustrated in Figure 4A–C, respectively.
Figure 3.

The analysis of cell cycle under cordycepin and/or cisplatin influence in HNSCC cell lines.
Notes: The histogram plots of flow cytometry analysis in three oral cavity cancer cells ([A] OC3; [B] OEC-M1; and [C] FaDu) treated in plain medium, medium with DMSO (0.5%), medium with 100 μM cordycepin, medium with 300 μM cisplatin, medium with 600 μM cisplatin, medium with 100 μM cordycepin plus 300 μM cisplatin, and medium with 100 μM cordycepin plus 600 μM cisplatin for 24 hours were illustrated. After the treatments, cells were fixed, stained with propidium iodide, and analyzed for cell cycle progression by flow cytometry. The subG1 phase refers to cells that have less DNA content than normal cells, indicating apoptosis. Experiments were performed three times with similar results (Control represents control as plain medium). Arrow heads indicate the increase of the subg1 phase.
Abbreviations: DMSO, dimethyltetrazolium bromide; HNSCC, head and neck squamous cell carcinoma; DNA, deoxyribonucleic acid.
Figure 4.

Quantification and analysis in percentage among subG1, G1, and G2/M phase cell number in HNSCC cell lines.
Notes: The statistical analysis from three independent experiments of Figure 3 regarding the change of the cell cycle in terms of percentages of subG1, G1, and G2/M phases was analyzed and illustrated ([A] OC3 cells; [B] OEC-M1 cells; and [C] FaDu cells). (a) subG1 phase; (b) G1 phase; and (c) G2/M phase. Data represent the mean ± standard error of the mean of three separate experiments. *Significant difference when compared with controls (plain medium) in each cell cycle phase (P<0.05) (Control represents control as plain medium).
Abbreviations: HNSCC, head and neck squamous cell carcinoma; DMSO, dimethyltetrazolium bromide.
The percentage of subG1 phase cells in the control groups was 5% in the OC3 cells (Figure 4Aa), 2% in the OEC-M1 cells (Figure 4Ba), and 1% in the FaDu cells (Figure 4Ca), respectively. Cordycepin (100 μM) induced subG1 phase cells to 12% in the OC3 cells (Figure 4Aa), 11% in the OEC-M1 cells (Figure 4Ba), and 5% in the FaDu cells (Figure 4Ca), respectively. In treatment with cisplatin alone, 300 μM of cisplatin induced the subG1 phase cells to 5% in the OC3 cells (Figure 4Aa), 10% in the OEC-M1 cells (Figure 4Ba), and 2% in the FaDu cells (Figure 4Ca), respectively. However, 600 μM of cisplatin induced the subG1 phase cells to 52% in the OC3 cells (Figure 4Aa), 23% in the OEC-M1 cells (Figure 4Ba), and 15% in the FaDu cells (Figure 4Ca), respectively. Interestingly, cordycepin (100 μM) plus cisplatin (300 μM) or cordycepin (100 μM) plus cisplatin (600 μM) cotreatments induced the subG1 phase cells to 27% and 73% in the OC3 cells (Figure 4Aa), 17% and 24% in the OEC-M1 cells (Figure 4Ba), and 23% and 14% in the FaDu cells (Figure 4Ca), respectively. These data illustrated that cordycepin plus cisplatin cotreatments had a better apoptotic effect in the subG1 phase among the three cell lines. It should be noted that cordycepin plus cisplatin (300 μM or 600 μM, respectively) in the OC3 cells and cordycepin plus cisplatin (300 μM) in the FaDu cells did demonstrate a much better apoptotic effect in the subG1 phase.
Effects of cordycepin and/or cisplatin on caspase pathway in HNSCC cell lines
Previous results illustrated that cordycepin and/or cisplatin would cause cell apoptosis among OC3, OEC-M1, and FaDu cells. Thus, the expressions of cleavage caspase and PARP proteins were investigated.
The expression of caspase-8 cleavage in the three cell lines under control and DMSO treatments was very low, and was slightly increased by treatment with cordycepin or cisplatin alone (300 μM or 600 μM, respectively) from 6 hours to 36 hours. However, cordycepin plus cisplatin cotreatment significantly induced more caspase-8 cleavage between 6 hours to 24 hours among OC3, OEC-M1, and FaDu cells (Figures 5A, B, 6A, B, 7A and B) (P<0.05). The expression of cleavage caspase-9 in the three cell lines under the control and DMSO treatments was low, and it was slightly increased by treatment with cordycepin or cisplatin alone (300 μM or 600 μM, respectively) from 6 hours to 24 hours. However, the cordycepin plus cisplatin cotreatment significantly induced more caspase-9 cleavage between 6 hours to 24 hours among OC3, OEC-M1, and FaDu cells (Figures 5A, C, 6A, C, 7A and C) (P<0.05). In addition, the expression of cleavage caspase-3 in these three cell lines under control and DMSO treatments was very low, and it was slightly increased by treatment with cordycepin or cisplatin alone (300 μM or 600 μM, respectively) from 6 hours to 36 hours. However, the cordycepin plus cisplatin cotreatment significantly induced more caspase-3 cleavage between 6 hours to 12 hours in OC3 and FaDu cells ( Figures 5A, D, 6A, D, 7A and D) (P<0.05). Moreover, there was no cleavage of PARP among the three cell lines under control and DMSO treatments, and PARP cleavage slightly increased by treatment with cordycepin or cisplatin alone (300 μM or 600 μM, respectively) from 6 hours to 36 hours. However, the cordycepin plus cisplatin cotreatment significantly induced more PARP cleavage between 6 hours to 24 hours among OC3, OEC-M1, and FaDu cells (Figures 5A, E, 6A, E, 7A and E) (P<0.05). It should be noted that there were different levels of sensitivity among the caspase pathway activated by cordycepin and/or cisplatin between the different cell lines.
Figure 5.

Effects of cordycepin and/or cisplatin on caspase-8, caspase-9, caspase-3, and PARP protein expressions in OC3 cells.
Notes: Cells (6 × 10⁵ cells/well for OC3) were treated with plain medium, medium with DMSO (0.5%), medium with 100 μM cordycepin, medium with 300 μM cisplatin, medium with 600 μM cisplatin medium with 100 μM cordycepin plus 300 μM cisplatin and medium with 100 μM cordycepin plus 600 μM cisplatin for 6 hours 12 hours 24 hours and 36 hours respectively. Cleavage caspase-8- (43 kDa) cleavage caspase-9- (35 kDa) cleavage caspase-3- (16 kDa) and cleavage PARP- (89 kDa) specific bands were detected by Western blot. (A) Immunoblots represent the observations from one single experiment repeated three times. The integrated optical densities of (B) cleaved caspase-8 (C) caspase-9 (D) caspase-3 and (E) PARP proteins were analyzed after normalization with β-actin (43 kDa) in each lane. Data in (B–E) represent the mean ± standard error of the mean of three separate experiments. *Statistical difference when compared to the control group (P<0.05).
Abbreviations: DMSO, dimethyltetrazolium bromide; PARP, poly adenosine diphosphate-ribose polymerase.
Figure 6.

Effects of cordycepin and/or cisplatin on caspase-8, caspase-9, caspase-3, and PARP protein expressions in OEC-M1 cells.
Notes: Cells (6 × 10⁵ cells/well for OEC-M1) were treated with plain medium, medium with DMSO (0.5%), medium with 100 μM cordycepin, medium with 300 μM cisplatin, medium with 600 μM cisplatin, medium with 100 μM cordycepin plus 300 μM cisplatin, and medium with 100 μM cordycepin plus 600 μM cisplatin for 6 hours, 12 hours, 24 hours, and 36 hours, respectively. Cleavage caspase-8- (43 kDa), cleavage caspase-9- (35 kDa), cleavage caspase-3- (16 kDa), and cleavage PARP- (89 kDa) specific bands were detected by Western blot. (A) Immunoblots represent the observations from one single experiment repeated three times. The integrated optical densities of (B) cleaved caspase-8, (C) caspase-9, (D) caspase-3, and (E) PARP proteins were analyzed after normalization with β-actin (43 kDa) in each lane. Data in (B–E) represent the mean ± standard error of the mean of three separate experiments. *Statistical difference when compared to the control group (P<0.05).
Abbreviations: DMSO, dimethyltetrazolium bromide; PARP, poly adenosine diphosphate-ribose polymerase.
Figure 7.

Effects of cordycepin and/or cisplatin on caspase-8, caspase-9, caspase-3, and PARP protein expressions in FaDu cells.
Notes: Cells (4.5 × 10⁵ cells/well for FaDu) were treated with plain medium, medium with DMSO (0.5%), medium with 100 μM cordycepin, medium with 300 μM cisplatin, medium with 600 μM cisplatin, medium with 100 μM cordycepin plus 300 μM cisplatin, and medium with 100 μM cordycepin plus 600 μM cisplatin for 6 hours, 12 hours, 24 hours, and 36 hours, respectively. Cleavage caspase-8- (43 kDa), cleavage caspase-9- (35 kDa), cleavage caspase-3- (16 kDa), and cleavage PARP- (89 kDa) specific bands were detected by Western blot. (A) Immunoblots represent the observations from one single experiment repeated three times. The integrated optical densities of (B) cleaved caspase-8, (C) caspase-9, (D) caspase-3, and (E) PARP proteins were analyzed after normalization with β-actin (43 kDa) in each lane. Data in (B–E) represent the mean ± standard error of the mean of three separate experiments. *Statistical difference when compared to the control group (P<0.05).
Abbreviations: DMSO, dimethyltetrazolium bromide; PARP, poly adenosine diphosphate-ribose polymerase.
Effects of cisplatin and/or cordycepin on the regulation of MAPK pathway in HNSCC cell lines
Studies have shown that the phosphorylation of the MAPK pathway could either positively or negatively regulate cell mitosis, proliferation, and apoptosis.16,24 To determine whether cordycepin- and/or cisplatin-induced HNSCC cell apoptosis would be mediated by the MAPK pathway, the phosphorylation of JNK, ERK1/2, and p38 among the OC3, OEC-M1, and FaDu cells were analyzed by Western blotting.
The expression of the phosphor-JNK protein in three cell lines under the control and DMSO treatments was very low, and slightly increased by treatment with cordycepin or cisplatin alone (300 μM or 600 μM, respectively) from 6 hours to 36 hours. However, the cordycepin plus cisplatin cotreatment significantly induced more phosphor-JNK protein between 6 hours to 36 hours among the OC3, OEC-M1, and FaDu cells (Figures 8A, B, 9A, B, 10A and B) (P<0.05). In addition, the expression of the phosphor-ERK protein in the three cell lines under the control and DMSO treatments was very low, and slightly increased by treatment with cordycepin or cisplatin alone (300 μM or 600 μM, respectively) from 6 hours to 36 hours. However, the cordycepin plus cisplatin cotreatment significantly induced more phosphor-ERK protein between 6 hours to 36 hours among the OC3, OEC-M1, and FaDu cells (Figures 8A, C, 9A, C, 10A and C) (P<0.05). Furthermore, the expression of the phosphor-p38 protein in the three cell lines under the control and DMSO treatments was very low, and slightly increased by treatment with cordycepin or cisplatin alone (300 μM or 600 μM, respectively) from 6 hours to 36 hours. However, the cordycepin plus cisplatin cotreatment significantly induced more phosphor-p38 protein between 12 hours to 36 hours among the OC3, OEC-M1, and FaDu cells (Figures 8A, D, 9A, D, 10A and D) (P<0.05). It should be recognized that there were different levels of sensitivity among the MAPK pathway, which were activated by cordycepin and/or cisplatin between the different cell lines.
Figure 8.

Effects of cordycepin and/or cisplatin on the protein expression of the MAPK pathway in OC3 cells.
Notes: Cells (6 × 10⁵ cells/well for OC3) were treated with plain medium, medium with DMSO (0.5%), medium with 100 μM cordycepin, medium with 300 μM cisplatin, medium with 600 μM cisplatin, medium with 100 μM cordycepin plus 300 μM cisplatin, and medium with 100 μM cordycepin plus 600 μM cisplatin for 6 hours, 12 hours, 24 hours, and 36 hours, respectively. P-JNK- (46, 55 kDa), P-ERK- (44, 42 kDa), and P-p38- (43 kDa) specific bands were detected by Western blot. (A) Immunoblot represents the observations from one single experiment repeated three times. The integrated optical densities of (B) P-JNK, (C) P-ERK1/2, and (D) P-p38 proteins were analyzed after normalization with the total protein in each lane. Data in (B–D) represent the mean ± standard error of the mean of three separate experiments. *Statistical difference when compared to the control group (P<0.05).
Abbreviations: DMSO, dimethyltetrazolium bromide; P, phosphorylated; JNK, Jun NH2-terminal kinase; ERK, signal-regulated kinase; MAPK, mitogen-activated protein kinases.
Figure 9.

Effects of cordycepin and/or cisplatin on the protein expression of the MAPK pathway in OEC-M1 cells.
Notes: Cells (6 × 10⁵ cells/well for OEC-M1) were treated with plain medium, medium with DMSO (0.5%), medium with 100 μM cordycepin, medium with 300 μM cisplatin, medium with 600 μM cisplatin, medium with 100 μM cordycepin plus 300 μM cisplatin, and medium with 100 μM cordycepin plus 600 μM cisplatin for 6 hours, 12 hours, 24 hours, and 36 hours, respectively. P-JNK- (46, 55 kDa), P-ERK- (44, 42 kDa), and P-p38- (43 kDa) specific bands were detected by Western blot. (A) Immunoblot represents the observations from one single experiment repeated three times. The integrated optical densities of (B) P-JNK, (C) P-ERK1/2, (D) and p-p38 proteins were analyzed after normalization with the total protein in each lane. Data in (B–D) represent the mean ± standard error of the mean of three separate experiments. *Statistical difference when compared to the control group (P<0.05).
Abbreviations: DMSO, dimethyltetrazolium bromide; P, phosphorylated; JNK, Jun NH2-terminal kinase; ERK, signal-regulated kinase; MAPK, mitogen-activated protein kinases.
Figure 10.

Effects of cordycepin and/or cisplatin on the protein expression of MAPK pathway in FaDu cells.
Notes: Cells (4.5 × 10⁵ cells/well for FaDu) were treated with plain medium, medium with DMSO (0.5%), medium with 100 μM cordycepin, medium with 300 μM cisplatin, medium with 600 μM cisplatin, medium with 100 μM cordycepin plus 300 μM cisplatin, and medium with 100 μM cordycepin plus 600 μM cisplatin for 6 hours, 12 hours, 24 hours, and 36 hours, respectively. P-JNK- (46, 55 kDa), P-ERK- (44, 42 kDa), and P-p38- (43 kDa) specific bands were detected by Western blot. (A) Immunoblot represents the observations from one single experiment repeated three times. The integrated optical densities of (B) P-JNK, (C) P-ERK1/2, and (D) P-p38 proteins were analyzed after normalization with the total protein in each lane. Data in (B–D) represent the mean ± standard error of the mean of three separate experiments. *Statistical difference when compared to the control group (P<0.05).
Abbreviations: DMSO, dimethyltetrazolium bromide; P, phosphorylated; JNK, Jun NH2-terminal kinase; ERK, signal-regulated kinase; MAPK, mitogen-activated protein kinases.
Discussion
Betel quid chewing is a popular oral habit with potential links to the occurrence of oral cancer.25 In Taiwan, the incidence of oral cancer has increased in recent years.2 Cisplatin is one of the most well-known potent antitumor agents, displaying clinical activity against a wide variety of solid tumors.26 Studies have shown that cisplatin combined with other anticancer drugs can enhance more cell death.6 It has been reported that cordycepin could effectively inhibit tumor cell growth concomitant with the induction of apoptotic and/or autophagic cell death in breast cancer cells, Leydig tumor cells, and oral cavity cancer cells;9,19,27 thus, the combination of different chemicals might be more effective in treating cancer cells.28 In fact, we have just reported that treatment with cordycepin plus cisplatin combined could cause a better effect of cell death in OC3 cells through a very preliminary mechanism investigation.29 In the present study, we used three oral cavity cancer cells lines (OC3, OEC-M1, and FaDu) to further investigate the combined apoptotic effect of cordycepin plus cisplatin with a detailed examination of the cellular mechanisms.
Our data showed that treatment with cordycepin or cisplatin alone induced the cell death phenomenon with the loss of cell attachment to the ground matrix, the appearance of membrane blebbings, and floating cells. Cordycepin plus cisplatin cotreatments induced more cell death, which showed a greater effect on three HNSCC cell lines. In fact, similar results have been illustrated on other oral cavity cancer cell lines, and the same appearance induced by cisplatin can also be found on other tumor cells.7,28 Indeed, other studies have shown that many factors could activate different cellular pathways and can respond to enhance cisplatin antitumor effects; for instance, luteolin enhanced p53 stabilization and accumulation,30 and dexamethasone enhanced angiostatic activity and modulating cell cycle kinetics in different cell types.31 Our study showed that cordycepin could induce a greater expression of caspase and the MAPK protein to enhance the antitumor effect of cisplatin in HNSCC cells. Hence, our observations are parallel to those studies. Moreover, cell viability results showed that the cordycepin plus cisplatin cotreatment could induce more cell death among the three HNSCC cell lines as compared to cordycepin or cisplatin treatment alone, and an enhanced effect could be observed in the OC3 cells. Interestingly, the amount of cell death among the OEC-M1 and FaDu cells affected by cordycepin or cisplatin was higher than in the OC3 cells, which demonstrated that there were different sensitivities among the three HNSCC cell lines to cordycepin and/or cisplatin. In fact, these phenomena are also found in other studies.32,33
In the cell cycle analysis, the percentage of subG1 phase cells increased to 11%–12% in the OC3 and OEC-M1 cells after treatment with cordycepin alone, which demonstrated greater efficiency than in the FaDu cells (only 5%). The percentage of subG1 phase cells significantly increased to 54% after treatment with 600 μM of cisplatin alone in the OC3 cells, and increased to 15%–20% in the OCE-M1 and FaDu cells, respectively. Exclusively, the percentage of subG1 phase cells in the cordycepin (100 μM) plus cisplatin (300 μM) cotreatment group significantly increased in all three cell lines. It should be noted that cordycepin plus cisplatin (300 μM and 600 μM, respectively) in the OC3 cells and cordycepin plus cisplatin (300 μM) in the FaDu cells did demonstrate a synergistically apoptotic effect in the subG1 phase. In fact, the synergistic/additive effect of cisplatin plus other drugs has been demonstrated in nasopharyngeal cancer (NPC) cell lines (NPC-TW01 and NPC-TW04), human HNSCC cell line SCC25, and human epidermoid carcinoma A431 cells.34,35 It has also been shown that a combination of different agents could induce more antitumor efficiency;36 thus, our findings are consistent with those investigations.
In the present study, the cordycepin plus cisplatin cotreatment significantly induced greater expressions of cleavage caspase-3 and PARP compared to treatment with cordycepin or cisplatin alone. We further investigated whether the caspase-8 (extrinsic) and/or caspase-9 (intrinsic) pathways would be activated. Results showed that both extrinsic and intrinsic caspase pathways were activated by the cordycepin plus cisplatin cotreatment. Many studies have shown the synergistic effect on caspase and/or PARP protein cleavages to induce apoptosis among different tumor cell types.37 Therefore, our results are not unprecedented. It should be noted that the better effects in caspase-8, caspase-3, and PARP cleavages by cordycepin plus cisplatin cotreatment could be observed in OC3, but not in the OEC-M1 and FaDu cells. Also, it should be recognized that there are different levels of sensitivity among the caspase pathway activated by cordycepin and/or cisplatin between the OC3, OEC-M1, and FaDu cells.
In our observations, the cordycepin alone treatment slightly increased the expression of the MAPK proteins. However, cordycepin plus cisplatin induced a greater expression of phosphorylated-JNK and phosphorylated-ERK among the OC3, OEC-M1, and FaDu cells. The phosphorylated-p38 could be hardly detected in the OC3 and FaDu cells, but could be observed in the OEC-M1 cells from 6 hours to 12 hours after combined treatment. A higher dosage of the combination showed a greater expression of phosphorylated-p38. These findings suggest that cordycepin and/or cisplatin could activate the phosphorylation of JNK and ERK proteins to induce HNSCC cell apoptosis; however, only the cordycepin plus cisplatin combinations could activate the phosphorylation of the p38 protein to induce HNSCC cell apoptosis. It should be noted that the greater effect of phosphorylated-JNK, phosphorylated-ERK, and phosphorylated-p38 protein expressions could be observed by cordycepin plus cisplatin (300 μM) among the OC-3, OEC-M1, and FaDu cells. Also, it should be noted that there were different levels of sensitivity among the MAPK pathway activated by cordycepin and/or cisplatin between the OC-3, OEC-M1, and FaDu cell lines.
Conclusion
In conclusion, cordycepin and cisplatin possess better apoptotic effects by activating the expression of extrinsic and intrinsic caspase and MAPK pathways in human oral cavity cancer cell lines, which highly suggests that the combination treatment of cordycepin and cisplatin might be a potential anticancer drug when compared to the single agent chemotherapy.
Acknowledgments
This work was supported by National Science Council Grants NSC101-2320-B-006-005-MY3 (BMH), Taiwan.
Footnotes
Disclosure
The authors report no conflicts of interest in this work.
References
- 1.Gupta PC, Warnakulasuriya S. Global epidemiology of areca nut usage. Addict Biol. 2002;7(1):77–83. doi: 10.1080/13556210020091437. [DOI] [PubMed] [Google Scholar]
- 2.Ho PS, Ko YC, Yang YH, Shieh TY, Tsai CC. The incidence of oropharyngeal cancer in Taiwan: an endemic betel quid chewing area. J Oral Pathol Med. 2002;31(4):213–219. doi: 10.1034/j.1600-0714.2002.310404.x. [DOI] [PubMed] [Google Scholar]
- 3.Forastiere AA. Is there a new role for induction chemotherapy in the treatment of head and neck cancer? J Natl Cancer Inst. 2004;96(22):1647–1649. doi: 10.1093/jnci/djh339. [DOI] [PubMed] [Google Scholar]
- 4.Forastiere AA, Goepfert H, Maor M, et al. Concurrent chemotherapy and radiotherapy for organ preservation in advanced laryngeal cancer. N Engl J Med. 2003;349(22):2091–2098. doi: 10.1056/NEJMoa031317. [DOI] [PubMed] [Google Scholar]
- 5.Adelstein DJ, Li Y, Adams GL, et al. An intergroup phase III comparison of standard radiation therapy and two schedules of concurrent chemoradiotherapy in patients with unresectable squamous cell head and neck cancer. J Clin Oncol. 2003;21(1):92–98. doi: 10.1200/JCO.2003.01.008. [DOI] [PubMed] [Google Scholar]
- 6.Boulikas T, Vougiouka M. Recent clinical trials using cisplatin, carboplatin and their combination chemotherapy drugs (review) Oncol Rep. 2004;11(3):559–595. [PubMed] [Google Scholar]
- 7.Li R, Zang Y, Li C, Patel NS, Grandis JR, Johnson DE. ABT-737 synergizes with chemotherapy to kill head and neck squamous cell carcinoma cells via a Noxa-mediated pathway. Mol Pharmacol. 2009;75(5):1231–1239. doi: 10.1124/mol.108.052969. [DOI] [PMC free article] [PubMed] [Google Scholar]
- 8.Jen CY, Lin CY, Huang BM, Leu SF. Cordycepin induced MA-10 mouse Leydig tumor cell apoptosis through caspase-9 pathway. Evid Based Complement Alternat Med. 2011;2011:984537. doi: 10.1093/ecam/nen084. [DOI] [PMC free article] [PubMed] [Google Scholar]
- 9.Wu WC, Hsiao JR, Lian YY, Lin CY, Huang BM. The apoptotic effect of cordycepin on human OEC-M1 oral cancer cell line. Cancer Chemother Pharmacol. 2007;60(1):103–111. doi: 10.1007/s00280-006-0354-y. [DOI] [PubMed] [Google Scholar]
- 10.Thomadaki H, Tsiapalis CM, Scorilas A. Polyadenylate polymerase modulations in human epithelioid cervix and breast cancer cell lines, treated with etoposide or cordycepin, follow cell cycle rather than apoptosis induction. Biol Chem. 2005;386(5):471–480. doi: 10.1515/BC.2005.056. [DOI] [PubMed] [Google Scholar]
- 11.Lallas GC, Courtis N, Havredaki M. K562 cell sensitization to 5-fluorouracil- or interferon-alpha-induced apoptosis via cordycepin (3′-deoxyadenosine): fine control of cell apoptosis via poly(A) polymerase upregulation. Int J Biol Markers. 2004;19(1):58–66. doi: 10.1177/172460080401900108. [DOI] [PubMed] [Google Scholar]
- 12.Gupta S. Molecular steps of death receptor and mitochondrial pathways of apoptosis. Life Sci. 2001;69(25–26):2957–2964. doi: 10.1016/s0024-3205(01)01404-7. [DOI] [PubMed] [Google Scholar]
- 13.Thornberry NA, Lazebnik Y. Caspases: enemies within. Science. 1998;281(5381):1312–1316. doi: 10.1126/science.281.5381.1312. [DOI] [PubMed] [Google Scholar]
- 14.Yang X, Chang HY, Baltimore D. Autoproteolytic activation of pro-caspases by oligomerization. Mol Cell. 1998;1(2):319–325. doi: 10.1016/s1097-2765(00)80032-5. [DOI] [PubMed] [Google Scholar]
- 15.Wang LG, Liu XM, Kreis W, Budman DR. The effect of antimicrotubule agents on signal transduction pathways of apoptosis: a review. Cancer Chemother Pharmacol. 1999;44(5):355–361. doi: 10.1007/s002800050989. [DOI] [PubMed] [Google Scholar]
- 16.Wada T, Penninger JM. Mitogen-activated protein kinases in apoptosis regulation. Oncogene. 2004;23(16):2838–2849. doi: 10.1038/sj.onc.1207556. [DOI] [PubMed] [Google Scholar]
- 17.Kim GY, Mercer SE, Ewton DZ, Yan Z, Jin K, Friedman E. The stress-activated protein kinases p38 alpha and JNK1stabilize p21(Cip1) by phosphorylation. J Biol Chem. 2002;277(33):29792–29802. doi: 10.1074/jbc.M201299200. [DOI] [PubMed] [Google Scholar]
- 18.Toh WH, Siddique MM, Boominathan L, Lin KW, Sabapathy K. C-Jun regulates the stability and activity of the p53 homologue, p73. J Biol Chem. 2004;279(43):44713–44722. doi: 10.1074/jbc.M407672200. [DOI] [PubMed] [Google Scholar]
- 19.Pan BS, Lin CY, Huang BM. The effect of cordycepin on steroidogenesis and apoptosis in MA-10 mouse Leydig tumor cells. Evid Based Complement Alternat Med. 2011;750468 doi: 10.1155/2011/750468. [DOI] [PMC free article] [PubMed] [Google Scholar]
- 20.Lin SC, Liu CJ, Chiu CP, Chang SM, Lu SY, Chen YJ. Establishment of OC3 oral carcinoma cell line and identification of NF-kappa B activation responses to areca nut extract. J Oral Pathol Med. 2004;33(2):79–86. doi: 10.1111/j.1600-0714.2004.00034.x. [DOI] [PubMed] [Google Scholar]
- 21.Meng CL, Yang CY, Shen KL, Wong PY, Lee HK. Inhibition of the synthesis of eicosanoid-like substances in a human oral cancer cell line by interferon-gamma and eicosapentaenoic acid. Arch Oral Biol. 1998;43(12):979–986. doi: 10.1016/s0003-9969(98)00078-8. [DOI] [PubMed] [Google Scholar]
- 22.Lowry OH, Rosenbrough NJ, Farr AL, Randall RJ. Protein measurement with the Folin phenol reagent. J Biol Chem. 1951;193(1):265–275. [PubMed] [Google Scholar]
- 23.Chen YC, Huang YL, Huang BM. Cordyceps sinensis mycelium activates PKA and PKC signal pathways to stimulate steroidogenesis in MA-10 mouse Leydig tumor cells. Int J Biochem Cell Biol. 2005;37(1):214–223. doi: 10.1016/j.biocel.2004.05.019. [DOI] [PubMed] [Google Scholar]
- 24.Pearson G, Robinson F, Beers Gibson T, et al. Mitogen-activated protein (MAP) kinase pathways: regulation and physiological functions. Endocr Rev. 2001;22(2):153–183. doi: 10.1210/edrv.22.2.0428. [DOI] [PubMed] [Google Scholar]
- 25.Jeng JH, Chang MC, Hahn LJ. Role of areca nut in betel quid-associated chemical carcinogenesis: current awareness and future perspectives. Oral Oncol. 2001;37(6):477–492. doi: 10.1016/s1368-8375(01)00003-3. [DOI] [PubMed] [Google Scholar]
- 26.Siddik ZH. Cisplatin: mode of cytotoxic action and molecular basis of resistance. Oncogene. 2003;22(47):7265–7279. doi: 10.1038/sj.onc.1206933. [DOI] [PubMed] [Google Scholar]
- 27.Choi S, Lim MH, Kim KM, Jeon BH, Song WO, Kim TW. Cordycepin-induced apoptosis and autophagy in breast cancer cells are independent of the estrogen receptor. Toxicol Appl Pharmacol. 2011;257(2):165–173. doi: 10.1016/j.taap.2011.08.030. [DOI] [PubMed] [Google Scholar]
- 28.Yoon CY, Park MJ, Lee JS, et al. Abdullajanov M. The histone deacety-lase inhibitor trichostatin A synergistically resensitizes a cisplatin resistant human bladder cancer cell line. J Urol. 2011;185(3):1102–1111. doi: 10.1016/j.juro.2010.10.034. [DOI] [PubMed] [Google Scholar]
- 29.Chen YH, Hao LJ, Hung CP, Chen JW, Leu SF, Huang BM. Apoptotic effect of cisplatin and cordycepin on OC3 human oral cancer cells. Chin J Integr Med. 2013 Apr 1; doi: 10.1007/s11655-013-1453-3. Epub. [DOI] [PubMed] [Google Scholar]
- 30.Shi R, Huang Q, Zhu X, et al. Luteolin sensitizes the anticancer effect of cisplatin via c-Jun NH2-terminal kinase-mediated p53 phosphorylation and stabilization. Mol Cancer Ther. 2007;6(4):1338–1347. doi: 10.1158/1535-7163.MCT-06-0638. [DOI] [PubMed] [Google Scholar]
- 31.Arafa HM, Abdel-Hamid MA, El-Khouly AA, Elmazar MM, Osman AM. Enhancement by dexamethasone of the therapeutic benefits of cisplatin via regulation of tumor angiogenesis and cell cycle kinetics in a murine tumor paradigm. Toxicology. 2006;222(1–2):103–113. doi: 10.1016/j.tox.2006.02.007. [DOI] [PubMed] [Google Scholar]
- 32.Kaczirek K, Schindl M, Weinhäusel A, et al. Cytotoxic activity of camptothecin and paclitaxel in newly established continuous human medullary thyroid carcinoma cell lines. J Clin Endocrinol Metab. 2004;89(5):2397–2401. doi: 10.1210/jc.2003-031314. [DOI] [PubMed] [Google Scholar]
- 33.Pushkarev VM, Starenki DV, Saenko VA, et al. Molecular mechanisms of the effects of low concentrations of taxol in anaplastic thyroid canacer cells. Endocrinology. 2004;145(7):3143–3152. doi: 10.1210/en.2004-0127. [DOI] [PubMed] [Google Scholar]
- 34.Chan LP, Chou TH, Ding HY, et al. Apigenin induces apoptosis via tumor necrosis factor receptor- and Bcl-2-mediated pathway and enhances susceptibility of head and neck squamous cell carcinoma to 5-fluorouracil and cisplatin. Biochim Biophys Acta. 2012;1820(7):1081–1091. doi: 10.1016/j.bbagen.2012.04.013. [DOI] [PubMed] [Google Scholar]
- 35.Hung SH, Lee FP, Su CH, Tseng H. Effect of all-trans retinoic acid on the growth of two nasopharyngeal cancer cell lines and its treatment potential in combination with cisplatin. Eur Arch Otorhinolaryngol. 2013;270(2):695–704. doi: 10.1007/s00405-012-2068-6. [DOI] [PubMed] [Google Scholar]
- 36.van den Broek GB, Wildeman M, Rasch CR, et al. Molecular markers predict outcome in squamous cell carcinoma of the head and neck after concomitant cisplatin-based chemoradiation. Int J Cancer. 2009;124(11):2643–2650. doi: 10.1002/ijc.24254. [DOI] [PubMed] [Google Scholar]
- 37.Sung ES, Park KJ, Choi HJ, Kim CH, Kim YS. The proteasome inhibitor MG132 potentiates TRAIL receptor agonist-induced apoptosis by stabilizing tBid and Bik in human head and neck squamous cell carcinoma cells. Exp Cell Res. 2012;318(13):1564–1576. doi: 10.1016/j.yexcr.2012.04.003. [DOI] [PubMed] [Google Scholar]