

Abstract
The dorsal lateral geniculate nucleus (dLGN) receives visual information from the retina and transmits it to the cortex. In this study, we made extracellular recordings in the dLGN of both anesthetized and awake mice, and found that a surprisingly high proportion of cells were selective for stimulus orientation. The orientation selectivity of dLGN cells was unchanged after silencing the visual cortex pharmacologically, indicating that it is not due to cortical feedback. The orientation tuning of some dLGN cells correlated with their elongated receptive fields, while in others orientation selectivity was observed despite the fact that their receptive fields were circular, suggesting that their retinal input might already be orientation selective. Consistently, we revealed orientation/axis-selective ganglion cells in the mouse retina using multielectrode arrays in an in vitro preparation. Furthermore, the orientation tuning of dLGN cells was largely maintained at different stimulus contrasts, which could be sufficiently explained by a simple linear feedforward model. We also compared the degree of orientation selectivity in different visual structures under the same recording condition. Compared with the dLGN, orientation selectivity is greatly improved in the visual cortex, but is similar in the superior colliculus, another major retinal target. Together, our results demonstrate prominent orientation selectivity in the mouse dLGN, which may potentially contribute to visual processing in the cortex.
Introduction
Visual information is first processed by the retina and then transmitted through the dorsal lateral geniculate nucleus (dLGN) to the cortex. Although scattered studies have reported that dLGN cells may be involved in coding diverse spatial-temporal visual features (Daniels et al., 1977; Lee et al., 1979; Vidyasagar and Urbas, 1982; Soodak et al., 1987; Moore et al., 2011), the dLGN is still largely viewed as a pure relay center that is optimally stimulated by small spots of light or darkness, just like retinal ganglion cells (RGCs). The detection of more complicated features, especially stimulus orientations, is believed to be a signature property emerged in the cortex (Ferster and Miller, 2000).
Recent studies have started to change this view. First, given the functional complexity of RGCs, it is unlikely that all dLGN cells only encode local contrast. In particular, a substantial portion of RGCs are sensitive to specific orientations or motion directions (Barlow and Hill, 1963; Weng et al., 2005). These RGCs were thought to project exclusively to the accessory optic system (Simpson, 1984). It was, however, recently discovered in mice that at least two subpopulations of direction-selective RGCs project to the dLGN (Huberman et al., 2009; Rivlin-Etzion et al., 2011), raising the possibility that they may influence the response properties in the dLGN and in turn the cortex. Second, the dLGN is clearly more than a relay. Multiple RGCs can converge on to single dLGN cells (Chen and Regehr, 2000), which are also innervated by local interneurons, other thalamic nuclei, and cortical feedback (Olsen et al., 2012). The integration of these inputs could potentially produce new response properties in the dLGN.
Mouse has become an important model in vision research during the past decade. For example, extensive efforts are being made to decipher the mechanisms underlying orientation selectivity in the mouse visual cortex (Liu et al., 2011; Tan et al., 2011; Lee et al., 2012; Wilson et al., 2012). The computation in cortical circuits, however, cannot be fully understood without knowing the properties of its input, the dLGN. The initial characterization of mouse dLGN (Grubb and Thompson, 2003) confirmed several canonical properties, but did not investigate direction/orientation selectivity. Very recently, direction- and orientation-selective cells were indeed revealed in the mouse dLGN (Marshel et al., 2012; Piscopo et al., 2013).
In this study, we performed electrophysiology recordings to show that a substantial population of dLGN cells in mice displays orientation-selective responses and that the orientation selectivity does not require cortical feedback. We further show that the orientation tuning of some dLGN cells can be ascribed to their elongated receptive fields (RFs), while in others the selectivity is likely inherited from retinal inputs. Finally, the orientation tuning of dLGN cells is largely maintained at different stimulus contrasts, which can be sufficiently explained by a linear feedforward model. Together, our results indicate that orientation selectivity is surprisingly prominent in the mouse dLGN and may play a significant role in constructing cortical responses.
Materials and Methods
Animal preparation
Adult (postnatal day 60–90) wild-type C57BL/6 mice of either sex were used in all experiments. In anesthetized recordings, mice were first sedated with chlorprothixene (5 mg/kg in water, i.p.) and then anesthetized with urethane (1–1.25 g/kg in 10% saline solution, i.p.). Atropine (0.3 mg/kg, in 10% saline) and dexamethasone (2 mg/kg, in 10% saline) were administrated subcutaneously, as described previously (Niell and Stryker, 2008; Wang et al., 2010a). Toe-pinch reflex was monitored throughout recordings, and additional urethane (0.2–0.3 g/kg) was supplemented as needed. The animal's body temperature was monitored with a rectal thermoprobe and maintained at 37°C through a feedback heater control module (FHC).
The animal was placed in a stereotaxic apparatus. A small craniotomy (∼2 mm2) was made ∼2 mm lateral and ∼2.6 mm posterior from the bregma. dLGN cells were recorded from 2.4–3.1 mm below the pial surface. For V1 recordings, the craniotomy was made ∼3 mm lateral and 0.5 mm anterior from the Lambda point, and cortical cells were recorded from 200–600 μm below the pial. Note that the V1 data in the present article included cells that were published before (Wang et al., 2010a). In experiments of dLGN recordings with V1 silencing, a large craniotomy (∼6 mm2) was made to access both dLGN and V1.
In awake recordings, mice were first anesthetized with isoflurane (∼1.25%) to implant a metal head plate with MetaBond (Parkell). Carprofen (1 g/kg, in 10% saline solution) was injected subcutaneously after the surgery to reduce pain. On the second day, the animal was anesthetized again with isoflurane and a craniotomy performed as described above. The exposed brain was covered with Kwik-Sil Adhesive (World Precision Instruments). The animal was allowed to recover from the anesthesia for 1–2 h and then was head-fixed in a holder via the head plate. The animal's body was restricted in a plastic tube during the experiment. All experimental procedures were approved by Northwestern University Institutional Animal Care and Use Committee.
In vivo extracellular recording and visual stimuli
For dLGN recordings, tungsten electrodes (5–10 MΩ; FHC) were inserted vertically into the brain. Electrical signals were sampled at 25 kHz using a System 3 workstation (Tucker Davis Technologies). The signal was filtered between 0.3 and 5 kHz for spikes, and between 10 and 300 Hz for local field potentials. Only one unit at a time was recorded in nearly all cases. OpenSorter (Tucker Davis Technologies) was used to remove occasional large electrical artifacts or to sort two very different waveforms in a few cases. Interspike intervals were checked in all recordings to ensure single units.
Visual stimuli were generated with a Matlab Psychophysics toolbox (Pelli, 1997), as described previously (Niell and Stryker, 2008; Wang et al., 2010a). Stimuli were presented using a CRT monitor (60 Hz refresh rate, ∼35 cd/m2 luminance) placed 25 cm away and in front of the animal. The viewing angle was ∼40° on each side, 45° above, and 15° below (Fig. 1A).
Figure 1.
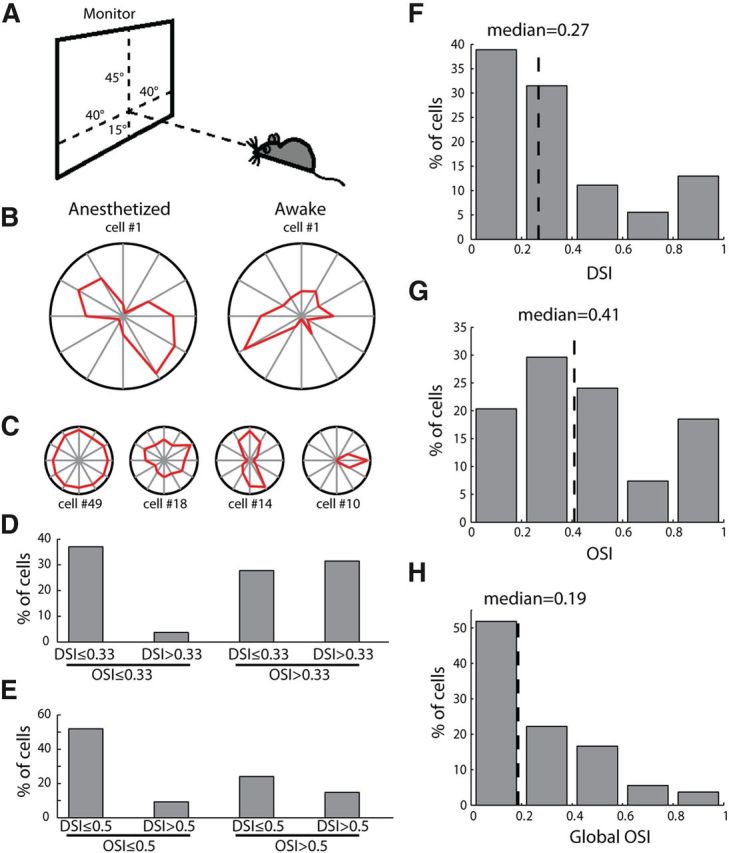
Direction- and orientation-selective responses in the mouse dLGN. A, Placement of visual stimulation. B, Polar plots of example orientation-selective responses in anesthetized and awake recordings. The radius was 6.1 spikes/s for the left panel and 6.7 spikes/s for the right panel. C, Example cells with diverse response properties. The four examples represented cells with different DSI and OSI values, and were aligned with the groups classified in D and E. The radius of each plot was 19.1, 11.7, 11.0, and 12.6 spikes/s, from left to right. D, Distribution of direction/orientation-selective cells, with a cutoff of 0.33 for DSI and OSI (n = 54). E, The same distribution with a cutoff of 0.5. F, Distribution of DSI (n = 54, median = 0.27). G, Distribution of OSI (n = 54, median = 0.41). H, Distribution of global OSI (n = 54, median = 0.19).
For testing direction/orientation selectivity, full-field sinusoidal gratings drifting perpendicular to their orientations were used. Drifting direction varied between 0° and 330° (12 steps at 30° spacing) in a pseudorandom sequence. Spatial frequency varied between 0.01 and 0.08 cycle/° (cpd; four logarithmic steps). Temporal frequency was fixed at 2 cycle/s. Each stimulus contained three cycles (1.5 s), with a 0.5 s interstimulus interval. In a subset of cells, single bright or dark bars (80° long and 5° wide) of various orientations (0° to 165°, 12 steps at 15° spacing) were centered at the RF and flashed on for 500 ms. The contrast of the bars was chosen to match the ON/OFF sign of the receptive field for each cell.
For mapping RFs in the dLGN, Gaussian noise movies were generated in the frequency domain and filtered (low-pass, spatial frequency cutoff at 0.08 cpd, temporal frequency at 4 Hz; Niell and Stryker, 2008; Sarnaik et al., 2013). The movie was generated at 60 × 60 pixels and displayed at 600 × 600 pixels on the monitor, covering ∼60 × 60° in visual space. It contained 9000 frames and was presented at 30 Hz (5 min in duration). The movie was multiplied with a sinusoidally varying contrast of 0.1 Hz to prevent response adaptation and was presented three to four times to evoke a sufficient number of spikes. The visual stimuli were gamma corrected and displayed on a gray scale of 255 levels.
Silencing the visual cortex
Muscimol (Sigma-Aldrich) was use to acutely silence the visual cortex. A glass pipette with a tip of ∼10 μm was filled with 40 mm muscimol and 0.25% Fast Green in ACSF. A tiny amount of sun flower oil (Sigma-Aldrich) was sucked into the tip of the pipette to prevent the drug solution from leaking. The pipette was inserted into V1 (∼3 mm lateral and 0.5 mm anterior to the Lambda point) at 700 μm deep. Single units were first recorded in the dLGN, and then 0.5 μl of the muscimol solution was pressure injected into V1, using a syringe connected to the pipette. The color of Fast Green could be seen within ∼1 mm from the injection site. The same single units were recorded again 1 min after muscimol injection.
Two sets of control experiments were performed to validate the effect and spread of muscimol injections. In one, the electrode was placed in V1 to record visually evoked local field potentials (VEPs) in response to a flashing black-and-white checkerboard stimulus (12.5 × 12.5° for each checker) at 200, 400, 600, and 800 μm depths. The VEPs were recorded again after the muscimol solution was injected ∼300 μm from the recording site to confirm the lack of cortical response. Additionally, we used intrinsic imaging to examine the responsiveness of the entire visual cortex before and after muscimol injections. The cortical retinotopic map at the elevation axis was obtained through the contralateral eye using our published method (Cang et al., 2005), and its magnitude was analyzed as an indicator of cortical responsiveness.
In vitro retinal recording
Mice were dark adapted for at least 30 min before being killed by direct cervical dislocation. Retinas were then isolated under infrared illumination, and their superior edge was marked during the dissection. The retinas were transferred into the recording chamber with the ganglion cell layer in contact with a 256-channel multielectrode array (256 MEA-200/30iR-ITO, Multichannel Systems). Throughout the experiment, oxygenated (95% O2, 5% CO2) ACSF (in mm: NaCl 124, KCl 2.5, CaCl2 2, MgCl2 2, NaH2PO4 1.25, glucose 22, NaHCO3 26, and HEPES 20) was perfused, and the temperature was maintained at 33.5°C (Cantrell et al., 2010).
Visual stimulus was projected onto the retina through an LCD display (KCD-VDCF-BA, Kopin). Full-field drifting gratings at 4 different spatial frequencies (125, 250, 500, and 1000 μm/cycle) and 12 orientations (0–330°, 12 steps at 30°spacing) were presented in a pseudorandom sequence. The temporal frequency was fixed at 2 cycles/s. Each stimulus contained 5 cycles (2.5 s), and was repeated four times. For mapping RFs, a Gaussian white-noise stimulus composed of 36 × 48 of 100 × 100 μm square checkers was used as described previously (Cantrell et al., 2010). Full-field flash (1 s ON and 1 s OFF) was used to study their ON/OFF properties. The electrical signal was sampled at 25 kHz, and spike waveforms were sorted into single units in an Offline Sorter (Plexon).
Data analysis
Orientation and direction selectivity.
In one set of experiments, all dLGN cells that could be isolated as single units were recorded, unbiased by the response selectivity. Four to five repeats were recorded for each stimulus condition. Data from these experiments were used to analyze orientation and direction selectivity in the dLGN. In another set of experiments, the recording would be discontinued after sampling each stimulus condition by two to three repeats if the cell's response was obviously not orientation selective. Only orientation-selective cells were further investigated for their receptive field structures or contrast tuning. Data from these experiments were included in analyses specific for orientation-selective cells, but were not included for analyzing the overall distribution of dLGN selectivity since the sampling was biased. The amplitude of visually evoked responses was calculated by subtracting the spontaneous spiking rate from that to each stimulus condition.
Direction selectivity index (DSI) was calculated as the ratio of (Rpref − Ropp)/(Rpref + Ropp), where Rpref was the response at the preferred direction and Ropp was the response at the opposite direction. Orientation selectivity index (OSI) was calculated as the ratio of (Rpref − Rorth)/(Rpref + Rorth), where Rorth was the mean response at the two directions orthogonal to the preferred one. Global OSI was calculated as 1 − circular variance (Piscopo et al., 2013). To analyze response modulation, F0, F1, and F2 were calculated as the mean response magnitude, and the amplitude of the first and second harmonics in the Fourier transform.
The responses at 12 orientations were fitted with a bimodal Gaussian, as follows:
 |
where R is the response, θ is the direction, R0 is the baseline, θpref is the preferred direction, σ is the SD, and A1 and A2 are the peak amplitudes. Tuning width (TW) was quantified based on the peak of the fitted curve around the preferred direction and was calculated as the half-width of the half-maximum above the baseline of the fitted tuning curve.
Half of the complex phase of ΣR(θ)e2iθ/ΣR(θ) was calculated and then converted to stimulus orientation in the range of 0–180 (Wang et al., 2010a).
For retinal recording, direction and orientation selectivity were quantified following the same method. Within each stimulus trial, the first cycle (0.5 s) was excluded from the analysis because it was often contaminated by strong transient responses to the appearance of the gratings.
Receptive field mapping.
The spatial–temporal RF was obtained for each cell using the spike-triggered average (STA) method (Jones and Palmer, 1987; Ringach et al., 1997) by calculating the mean of the movie frames preceding each spike. In this study, we focused only on the spatial aspect of the RF. The frame at which the maximal STA magnitude occurred was selected for further analysis.
The STA was first thresholded to remove noise. Two different methods were used. In one, the STA magnitude at each pixel was first transformed into its absolute value. For each cell, the mean noise level was calculated within a 20 × 20° area at the top left corner, which did not overlap with the RFs in any of our recordings. The threshold was set as 5× the mean. In a few cases, some blobs of noise remained after thresholding and were removed manually. All such noise blobs were discontinuous and far away from the obvious RF. The values in the STA were then returned to their original signs. In the other method, the threshold was set as the mean ± 3× the SD of the noise area (without taking absolute value). The results using the first method were presented in the article, but the same conclusions were reached using both methods.
The RF was then fitted by a single 2-dimensional (2D) Gaussian to determine its orientation and aspect ratio. In the two cells where multi-Gaussian fitting was attempted, we first showed that their RFs contained multiple peaks. Because the long axis of the RFs happened to be vertical in both cells, the STA values were summed along each row of the horizontal axis. The integrated intensity curves were then fitted with multiple 1D Gaussians. For both 1D and 2D fittings, the number of Gaussians was manually set, and all other parameters were automatically estimated by the fitting algorithm (MATLAB, Mathworks).
For RF analysis of RGCs, we only included cells that had STA contrast (Cantrell et al., 2010) larger than 15 and the fitted RF area larger than 2 square checkers of the noise stimulus. A response dominance index (RDI) was calculated for each RGC as (RON − ROFF)/(RON + ROFF) to full-field flash (Cantrell et al., 2010), where RON and ROFF were calculated as the peak responses with a 10 ms bin width.
Contrast tuning property.
After characterizing direction and spatial frequency tuning, the cells' responses were recorded to drifting gratings at their preferred direction and spatial frequency, at four different contrasts: 25, 50, 75, and 100%. The contrast tuning curve was fitted with the following equation to estimate the contrast that evoked 50% of response (C50):
 |
where R is the response, Rmax is the maximal response, and C is the contrast.
The estimated C50 was then used to study the cells' orientation tuning at different contrasts. In the majority of experiments (n = 14/18 cells), drifting gratings with 12 orientations at the C50 were presented. In a small number of experiments (n = 4/18), the orientation tuning was characterized at one of the three tested contrasts (25, 50, and 75%), whichever was the closest to the estimated C50. Data were pooled together from these two sets of experiments for analysis.
A simple feedforward model was used to explain the maintained orientation tuning at different contrasts. Assuming that the input–output transformation is a threshold-linear function, the responses at high and low contrasts can be described as follows:
where Rhigh and Rlow are the responses at two different contrasts, x is the input strength at the low contrast, K is the ratio of the two input strengths, s is the slope of the input–output transformation above the threshold, and T is the threshold (see text for the assumptions and reasoning of the equations).
Substitute Rlow for x in the second equation gives:
Since K > 1 (input at the higher contrast is stronger than that at the lower contrast), the equation represents a straight line with a positive slope and y-intercept.
Results
Orientation- and direction-selective responses in the mouse dLGN
In the first set of experiments, 54 single units were recorded in the dLGN of urethane-anesthetized mice. These included cells driven by the contralateral eye (n = 48/54, 88.9%) and those by the ipsilateral eye (n = 6/54, 11.1%). Many cells showed strong orientation- and/or direction-selective responses to full-field drifting gratings (Fig. 1B). To quantify this, we calculated the DSI and OSI for each cell by comparing the response magnitude at different directions/orientations (see Materials and Methods for details). A wide range of direction and orientation selectivity was observed (Fig. 1C), with a median DSI of 0.27 and median OSI of 0.41 (Fig. 1F,G). Using a cutoff of 0.33, a 2:1 ratio for the preferred over nonpreferred responses, 37.0% were classified as nonselective (OSI < 0.33 and DSI < 0.33), and 63.0% as selective (OSI > 0.33 or DSI > 0.33; Fig. 1D). Even with a stricter criterion, nearly half of the cells (n = 26/54, 48.2%) had either OSI or DSI >0.5 (a 3:1 ratio for the preferred over nonpreferred responses; Fig. 1E). The selective responses were observed through both contralateral and ipsilateral eyes. In the six ipsilaterally responsive cells included in this analysis, two had OSI values >0.33. Furthermore, orientation/direction-selective responses were seen in the dLGN of awake mice (n = 8/14 had OSI or DSI > 0.5, as in the example shown in Fig. 1B). We also calculated a global OSI that takes into account the responses at all orientations (Tan et al., 2011; Piscopo et al., 2013). The global OSI had a median of 0.19 (Fig. 1H), slightly greater than what has recently been reported by Piscopo et al. (2013).
To further characterize the tuning properties of orientation-selective cells (OSI ≥ 0.33, as widely used in the studies of mouse cortical selectivity: Wang et al., 2010a; Liu et al., 2011), we quantified their tuning widths and preferred orientations. The tuning widths distributed between 20° and 50° in most cells, with a median of 37.7° (Fig. 2A). Interestingly, the distribution of the preferred orientations was biased toward the vertical orientation (p < 0.05, χ2 test), although it spanned the entire range from vertical to horizontal (Fig. 2B). We next analyzed the linearity of the recorded cells by calculating F0 (mean), F1 (modulation at the drifting frequency), and F2 (at twice of the drifting frequency) components of their responses. The F1/F0 ratio was >1 in most dLGN cells (indication of linear response), but, on average, it was significantly smaller in the highly selective cells that had OSI values >0.5 (p < 0.05; Fig. 2C), which is consistent with a recent report (Piscopo et al., 2013). On the other hand, the F2 values were nearly always smaller than F1 values, resulting in similarly small F2/F1 ratios in the two groups (p = 0.97; Fig. 2D).
Figure 2.

Response properties of orientation-selective cells in the mouse dLGN. A, Distribution of the tuning width (TW) of orientation-selective cells (n = 44, median = 37.7°). Inset, Measurement of TW (see Materials and Methods for details). B, Distribution of the preferred orientations of the selective cells (n = 50). C, D, Scatter plots of F1 versus F0 (C) and F2 vs F1 (D) for highly selective (red) and other (black) cells. Insets, Mean F1/F0 and F2/F1 in the two groups (n = 21 for highly selective group and n = 33 for others; p < 0.05 for F1/F0; p = 0.95 for F2/F1, Kolmogorov–Smirnov test).
Orientation selectivity improves in the primary visual cortex
Orientation selectivity is a signature feature of the primary visual cortex (V1), and is conserved in rodents, carnivores, and primates (Hubel and Wiesel, 1962, 1968; Niell and Stryker, 2008). The discovery that a substantial portion of dLGN cells are selective for stimulus orientation raises the possibility that orientation selectivity in mouse V1 may originate subcortically. We thus compared orientation selectivity in the dLGN and V1 in anesthetized mice. While cells in the two areas showed no difference in DSI (Fig. 3A), the OSI and global OSI were much higher in V1 than in dLGN (Fig. 3B,C). In fact, 78.6% of V1 cells (n = 77/98) had OSI values >0.5, compared with 38.9% in the dLGN. The tuning width was also significantly sharper in V1 (Fig. 3D). Furthermore, unlike the dLGN cells, V1 cells did not show any bias in their preferred orientations across the population (p = 0.7, χ2 test; Fig. 3E), which is consistent with a previous report (Rochefort et al., 2011). These observations thus confirm that cortical circuits play an essential role in implementing orientation selectivity, although the process may actually start subcortically in mice.
Figure 3.

Comparison of orientation tuning in dLGN and V1. A, Cumulative distributions of DSI in the dLGN (red) and V1 (black; n = 54 for dLGN and n = 98 for V1, p = 0.73, Kolmogorov–Smirnov test). B, C, Cumulative distributions of OSI and global OSI in the dLGN (red) and V1 (black; n = 54 for dLGN and n = 98 for V1, p < 0.001, Kolmogorov–Smirnov test). D, Cumulative distributions of TW of orientation-selective cells in the dLGN (red) and V1 (black; n = 44 for dLGN and n = 75 for V1, p < 0.05, Kolmogorov–Smirnov test). E, Distribution of the preferred orientations of selective cells in V1. F, Distributions of the preferred spatial frequency in the dLGN (red) and V1 (black). G, Distribution of direction/orientation-selective dLGN cells when analyzing responses at 0.02 or 0.04 cpd (whichever spatial frequency evoked a larger response, n = 46). Cells not responding to either spatial frequency were excluded.
In cats and primates, orientation-selective responses were also observed in the dLGN (Daniels et al., 1977; Lee et al., 1979). But they were primarily found at higher spatial frequencies than what most V1 cells prefer (Soodak et al., 1987), suggesting a limited contribution of the dLGN to cortical selectivity in those species. In mice, we found that the dLGN cells prefer lower spatial frequency than V1 cells (Fig. 3F). Importantly, at the preferred spatial frequencies of most V1 cells (0.02 and 0.04 cpd), >60% of dLGN cells had OSI values >0.33 (Fig. 3G), suggesting that the dLGN selectivity could contribute to cortical responses.
Orientation selectivity in the dLGN is not due to cortical feedback
We next investigated the origin of orientation selectivity in the dLGN. In addition to the feedforward inputs from RGCs, dLGN cells also receive inputs from several other sources, including feedback inputs from layer 6 neurons in V1. Layer 6 cells can influence the dLGN directly or indirectly through the reticular nucleus (RTN; Fig. 4A). Since the majority of V1 layer 6 cells are orientation selective (Niell and Stryker, 2008), it is possible that the selectivity in the dLGN may be due to cortical feedback.
Figure 4.
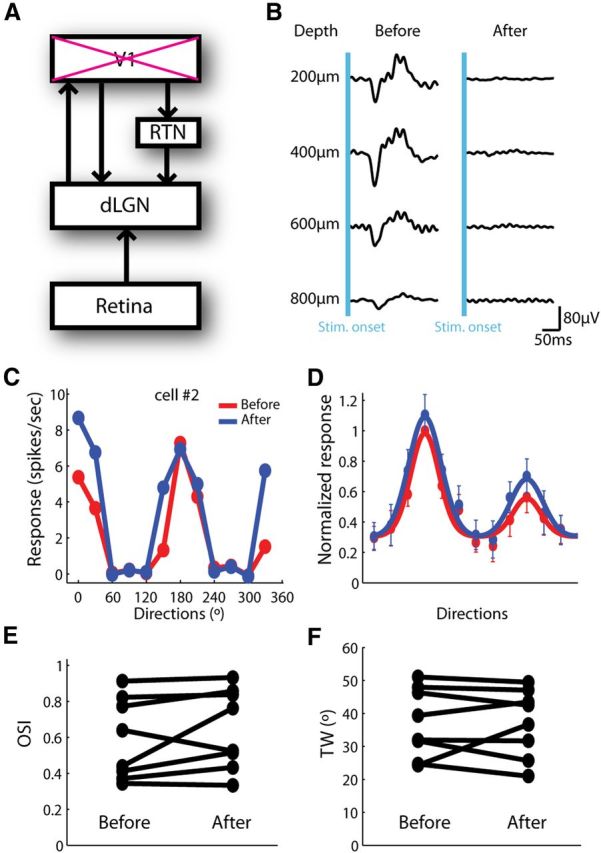
Orientation selectivity in the dLGN does not require cortical feedback. A, The dLGN receives feedforward input from the retina, and feedback input directly and indirectly from the cortex. B, Injection of muscimol solution completely abolished VEPs at different depths in V1. C, Responses before (red) and after (blue) muscimol injection in an example cell. D, Normalized responses before (red) and after (blue) muscimol injection (n = 8). All responses were normalized by the peak response before injection, and the preferred direction of each cell was aligned. E, F, OSI and TW before and after muscimol injection (n = 8, p = 0.22 for OSI and n = 0.99 for TW, paired t test).
To test this possibility, we injected muscimol solution (0.5 μl, 40 mm) to silence V1, and recorded the same dLGN cells before and after injection. After injection, VEPs were completely eliminated at all tested depths (Fig. 4B) and the effect spread across the entire V1, as validated by the nearly abolished intrinsic signals (data not shown). As shown in Figure 4C, the example cell increased its responses at some orientations after silencing V1, but the selectivity persisted. The averaged tuning curves of all recorded cells (n = 8) showed the same trend: silencing V1 slightly increased dLGN responses at or near the preferred orientations (Fig. 4D), consistent with a previous report that the impact of the inhibitory pathway through the RTN is stronger than the direct excitatory pathway (Olsen et al., 2012). More importantly, the shape of the tuning curve maintained in the absence of V1 input (Fig. 4D), and the OSI and tuning width did not change (Fig. 4E,F). These results indicate that the observed selectivity in the dLGN is not due to cortical feedback. The feedforward retinal input, therefore, is a possible source for orientation selectivity in the mouse dLGN.
Receptive field structures of orientation-selective dLGN cells
We next studied the RF structures of orientation-selective cells in the mouse dLGN. A noise movie with modulated contrast was used to elicit visual responses, and the RF was mapped by calculating the STA of the movie frames (see Materials and Methods for details). Thirty of the 31 RFs mapped with this method were of a single sign of ON or OFF, likely because the RF surround in mice is too weak to be revealed by our method. In some cells, the RF was elongated and the orientation of its major axis appeared to match with the cell's preferred orientation (Fig. 5A). Interestingly, other cells showed circular RFs, but were orientation selective nevertheless (Fig. 5B).
Figure 5.
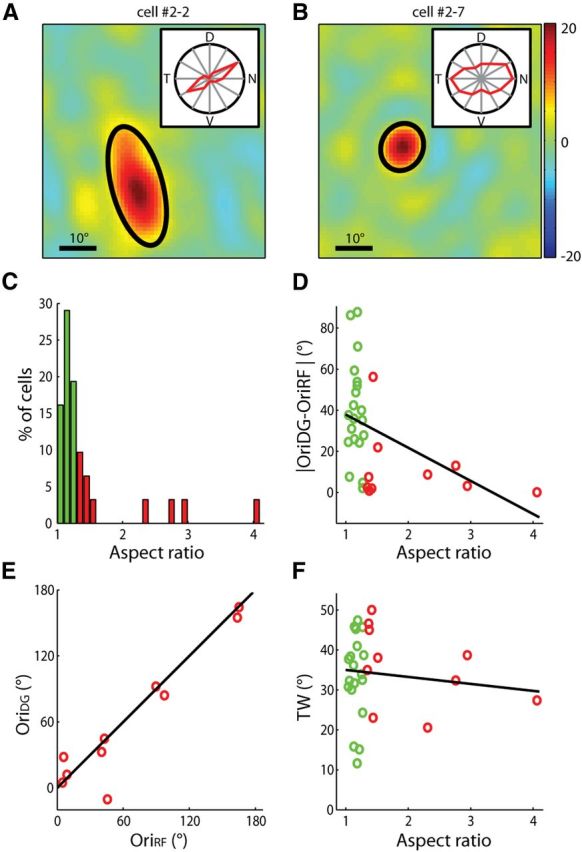
Receptive field structures of orientation-selective dLGN cells. A, B, Examples of elongated (A) and circular (B) RFs. Contours of fitted Gaussians at 2× SD were superimposed (black line). In both panels, the color scale ranged from −20 to 20 (the full range of visual stimulus was from −127 to 127). Inset, Polar plot of the cell's responses to drifting gratings. The radius of the polar plot represented 19.1 and 15.8 spikes/s, respectively. C, Distribution of aspect ratios of the RFs. Cells in the first three columns were classified as circular RFs (green), and the rest as elongated RFs (red; n = 30). D, The difference between the cell's preferred orientation and the orientation of the major axis of its RF decreased with the aspect ratio (n = 30, correlation coefficient = −0.43, p = 0.02). E, The RF orientation predicted the preferred orientation in the cells with elongated RFs. F, TW plotted as a function of the RF's aspect ratio (n = 30, correlation coefficient = −0.12, p = 0.55).
We fitted each RF with a single 2-dimensional Gaussian (Fig. 5A,B; see Materials and Methods for details) and calculated its aspect ratio (major axis over minor axis). The RFs were classified into circular (Fig. 5C–F, green) and elongated (Fig. 5C–F, red), based on whether their aspect ratios were >1.3. For the vast majority of cells that had elongated RFs, the orientation preferences were well predicted by their RFs (difference <25°, n = 9/10; Fig. 5D,E). On the other hand, most circular RFs showed a difference of >25° (n = 15/20; Fig. 5D). Furthermore, the tuning width of the circular RF cells ranged from 10° to 50°, suggesting that their selectivity is probably determined by their tuned synaptic inputs instead of the RF shape (Fig. 5F).
The elongated RFs in some dLGN cells could be either inherited from single RGCs that have elongated RFs or achieved by combining inputs from several RGCs with spatially offset circular RFs. Although we did not map RGC–dLGN connectivity directly, some clues in our data suggested the existence of the second scenario. In two dLGN cells, their RFs displayed multiple peaks and were apparently better fitted by multiple Gaussian distributions, rather than a single one (Fig. 6) The multiple peaks may reflect the RFs of the different RGCs that converge on to the dLGN cells.
Figure 6.

Receptive fields containing multiple peaks. A, B, Two RFs that appeared to contain multiple peaks. RFs were fitted with multiple Gaussians, and the contour of each individual Gaussian at 2× SD was superimposed (black). Inset, Polar plot of the cell's responses to drifting gratings. C, D, Thresholded RFs (see Materials and Methods for details) and the integrated intensity along each row (blue circle). Each individual Gaussian (green dotted line) and the summated fitting curve (black) were plotted. Scale bars, 10°.
We next examined whether the selective dLGN cells, especially the ones that have circular RFs, are selective for orientation or axis of motion. We flashed single bars of various orientations that were centered at the RF of the recorded cells. The dLGN cells that were selective to drifting gratings [OSI to drifting gratings (OSIDG) >0.33] indeed showed orientation-selective responses to the flashed bars (Fig. 7A–C), with most of them (14/17) having an OSI to flash bars (OSIFB) >0.33 (Fig. 7D). Most of these cells were also tuned to similar orientations in response to the two types of stimuli (p < 0.01, n = 17; Fig. 7E). These results thus indicate that a substantial population of dLGN cells are truly selective for stimulus orientation.
Figure 7.

Orientation-selective responses to flashed bars in mouse dLGN. A, An example dLGN cell with a circular RF. B, Polar plot of the example cell's responses to drifting gratings. The radius of the plot was 19.3 spikes/s. C, Polar plot of the same cell's response to flashed bars. The radius of the plot was 33.2 spikes/s. Note that each value was represented twice on this plot as the orientation was varied in the range of 0–180°. D, Scatter plot of OSIDG and OSIFB (n = 17). Cells with circular RFs are in green, and cells with elongated RFs are in red. The unity line (solid black) and the cutoff value for the selective group (dashed black) were marked. E, Scatter plot of the preferred orientations in response to drifting gratings and flashing bars (n = 17, correlation coefficient = 0.76, p < 0.01).
Orientation-selective RGCs in the mouse retina
The orientation selectivity of dLGN cells that have circular RFs is likely inherited from orientation-selective RGCs or by combining two direction-selective RGCs that prefer opposite directions. Many RGCs in the mouse retina are known to be direction selective (Weng et al., 2005; Elstrott et al., 2008). Orientation-selective (also called “axis-selective”) RGCs have been observed in primates, cats, and rabbits (Levick and Thibos, 1982; Passaglia et al., 2002; Venkataramani and Taylor, 2010), and after repetitive stimulations in mice (Rivlin-Etzion et al., 2012). We thus recorded visual responses of mouse RGCs in vitro using a multielectrode array without conditioning stimuli (Fig. 8A). The retina was stimulated by full-field drifting gratings of different orientations and spatial frequencies (see Materials and Methods for details). Direction and orientation selectivity was analyzed at the optimal spatial frequency for each cell. Orientation-selective RGCs were indeed observed (Fig. 8B,C), with 42.8% of our recorded RGCs having OSIs >0.33 (n = 332/776) and 21.9% >0.5 (n = 170/776, Fig. 8D,E). Similar distributions of OSIs were observed in the four quadrants of the retina (Fig. 8F). Note that these high OSI cells included truly orientation- or axis-selective cells, as about half of them had small DSI values (n = 159/332 cells that had OSI >0.33 also had DSI <0.33), i.e., similarly high responses to the two opposite directions of the same orientation.
Figure 8.

Orientation/axis-selective RGCs in the mouse retina. A, Retinal recordings using a multielectrode array. B, Tuning curve of an example orientation/axis-selective RGC. The radius of the polar plot was 6.6 spikes/s. C, Distribution of direction/orientation-selective cells (n = 776, from 2 retinas). D, Distribution of DSI (n = 776, median = 0.21). E, Distribution of OSI (n = 776, median = 0.29). F, Cumulative distributions of OSI of cells in the superior (black, n = 103), inferior (blue, n = 236), temporal (green, n = 257), and nasal (red, n = 180) quadrants. p > 0.05 for comparing every pair, Kolmogorov–Smirnov test. G, Cumulative distribution of RDI, in response to full-field flash, of highly selective (red) and other cells (black; n = 146 for the selective group and n = 628 for the nonselective group, p < 0.001, Kolmogorov–Smirnov test). H, Cumulative distribution of F1/F0 in response to drifting gratings (median = 1.34 for highly selective cells and 0.86 for nonselective cells, p < 0.01, Kolmogorov–Smirnov test). I, Cumulative distribution F2/F1 (median = 0.75 for highly selective cells and 0.78 for nonselective cells, p = 0.17, Kolmogorov–Smirnov test).
We also analyzed the ON/OFF properties of the highly selective RGCs (OSI >0.5) by calculating an RDI to full-field flashes (Cantrell et al., 2010). These selective RGCs included more cells that had positive RDIs (i.e., single-signed ON cells) than the nonselective group (p < 0.001; n = 146 for the selective group and n = 628 for the nonselective group; Fig. 8G). Consistently, the selective RGCs also had a larger F1/F0 ratio (more linear) in response to drifting gratings (p < 0.01; Fig. 8H). The F2/F1 ratio was similar between the two groups (p = 0.17; Fig. 8I), as in the dLGN. The fact that the selective cells are more linear in the retina and less linear in the dLGN (Fig. 2C) could be in part due to a targeting specificity, where orientation/axis-selective ON RGCs may preferentially project to other brain areas such as the superior colliculus (SC) and accessory optic system.
We next mapped the RFs of the selective RGCs (OSI >0.33, n = 101) with a Gaussian white noise stimulus (see Materials and Methods for details). These selective cells bore either circular (Fig. 9A,B) or elongated RFs (Fig. 9C,D). The long axis of some elongated RFs matched with their preferred orientations in response to drifting gratings, while the others did not (Fig. 9E; p = 0.43, n = 101). Because our RF mapping method with extracellular recordings and minimized spatial–temporal correlation in the stimulus was likely only able to reveal the excitatory core of the RF, these results indicate that the shape of the excitatory RF alone is not the principal determinant of RGC selectivity. This is consistent with previous reports that both direction and orientation selectivity of RGCs are mediated by the asymmetric interaction of excitation and inhibition in retinal circuits, without requiring elongated RFs (Venkataramani and Taylor, 2010; Briggman et al., 2011; Wei et al., 2011). Alternatively, RGCs could acquire orientation preference through electrical coupling with neighboring RGCs of the same sign (Völgyi et al., 2009), where the coupled cells may respond more to orientations that activate them simultaneously (but such coupling may be too weak to be revealed by the RF mapping method).
Figure 9.

Receptive field structure of orientation/axis-selective RGCs. A–C, Examples of RF structures (left) and tuning curves (right). Contours of fitted Gaussians at 2× SD were superimposed (black line). The radius of the polar plot represented 8.0, 20.8, and 2.1 spikes/s, respectively. D, Distribution of RF aspect ratio. Cells were classified into circular (green) or elongated (red) by the same criteria used for dLGN analysis (cutoff of 1.3). E, No correlation between the RF aspect ratio and the difference between the preferred orientation and RF orientation (n = 101, correlation coefficient = −0.1, p = 0.43). F, Possible emergence of orientation selectivity in the dLGN by converging two direction-selective RGCs that have asymmetric excitation/inhibition in their RFs. The dLGN cell could be orientation selective to flashed bars due to its elongated inhibitory RF.
These selective RGCs could give rise to orientation selectivity in the dLGN directly or by converging inputs from two cells that prefer opposite directions. In the second scenario, the RFs of the two presynaptic RGCs, if aligned in their excitatory regions, could make the postsynaptic dLGN cell not only selective for two opposite moving directions (motion axis), but also for a particular orientation of static stimuli (e.g., flashed bars) due to the elongated inhibitory subfield, even though its excitatory RF is circular (Fig. 9F).
Contrast invariance of orientation selectivity in the dLGN
In V1, the response of orientation-selective cells increases with stimulus contrast, but their orientation selectivity is preserved, a phenomenon conventionally referred to as contrast invariance (Skottun et al., 1987). Since we revealed substantial selectivity in the mouse dLGN, we sought to understand how contrast influences the orientation tuning of dLGN cells.
We compared the orientation tuning of dLGN cells at 100% contrast and at a low contrast that evoked ∼50% response at the preferred orientation (49.6 ± 3.0%, n = 18). The choice of half-peak contrast was to avoid complications from nonreliable responses at very low contrasts and saturated responses at high contrasts. The response magnitudes were greater at the 100% contrast across all orientations (Fig. 10A,B), while the shapes of the tuning curves were nearly identical (Fig. 10B, inset; note the slightly elevated baseline at the high contrast after normalization).
Figure 10.
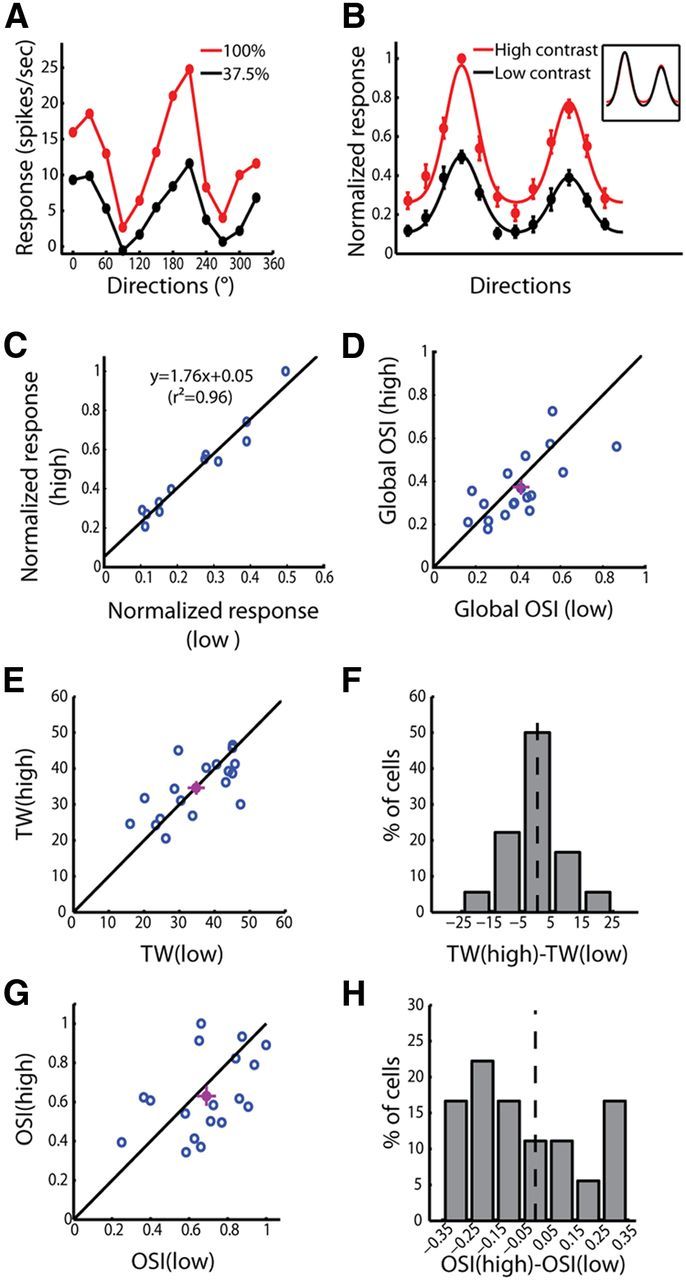
Contrast invariance of orientation selectivity in the mouse dLGN. A, Responses of an example cell at high (red) and low (black) contrasts. B, Normalized responses at high (red) and low (black) contrasts (n = 18). All responses were normalized by the peak response at the high contrast, and the preferred direction of each cell was aligned. Inset, Tuning curves at high and low contrasts were scaled to the same peak. C, Relationship between the normalized responses at high and low contrasts. The data were fitted with a linear function. D, Correlation between global OSI at high and low contrasts (p < 0.01). The mean ± SEM for each axis was plotted as the purple dot and bars. The unity line was plotted as well (black). E, Correlation between TWs at high and low contrasts (p < 0.001). F, Distribution of the differences between the TWs at high and low contrasts. The black dotted line marked 0. G, Weak correlation between the OSIs at high and low contrasts (p = 0.06). H, Distribution of the differences between OSIs at high and low contrasts. The black dotted line marked 0.
A central problem to explain V1 contrast invariance arises from the relationship between the cell's synaptic input and its spiking threshold (Finn et al., 2007). Cortical cells receive substantial inputs even at the nonpreferred orientations. These inputs could potentially reach the threshold with increasing contrast and thus weaken orientation selectivity (i.e., the iceberg effect). Either intracortical inhibition or contrast-modulated variability is needed to account for contrast invariance (Anderson et al., 2000; Li et al., 2012). Such an iceberg effect is not a major issue in the mouse dLGN due to the broad orientation tuning. The tuning curve was already above zero at all orientations, even at the low contrast (Fig. 10B). Higher contrast, therefore, would not unmask responses at more orientations.
Even with nonzero responses across all orientations, the tuning curves at different contrasts could still differ in shape. We next tested quantitatively whether a simple feedforward model can account for the largely maintained tuning curves at different contrasts. If we assume the input strength increases with the contrast across all orientations proportionally and a threshold-linear input–output function in the dLGN cells, the relationship between the Rlow and Rhigh values is a straight line with a positive y-intercept, when inputs are above the threshold at both conditions (see Materials and Methods for details):
where K is the ratio of the two input strengths, s is the slope of the input–output transformation above the threshold, and T is the threshold.
Indeed, the relationship of the normalized responses at the high versus low contrast was well described by Rhigh =1.76Rlow + 0.05 (Fig. 10C). The scaling part (multiplied by 1.76) would change neither TW nor OSI, while the small positive y-intercept would slightly decrease OSI but not TW. Consistently, the TWs at low and high contrasts closely correlated (Fig. 10E), and the distribution of TW difference (TWhigh − TWlow) peaked at zero (Fig. 10F). The OSI and global OSI values at the two contrasts were similar as well (Fig. 10D,G), but the distribution of OSI difference skewed toward negative (Fig. 10H). The difference of OSI at the two contrasts was moderate and did not reach the significance level (p = 0.29 for OSI and p = 0.20 for global OSI, paired t test), which is consistent with the very small y-intercept (0.05) of the transformation line. The positive intercept (i.e., no response at the low contrast and a positive response at the high contrast) may reflect to a certain extent the distance between the cell's spiking threshold and its resting membrane potential. Indeed, a high spontaneous spiking rate was observed in the dLGN (2.66 ± 0.42 spikes/s for dLGN, n = 54; vs 0.49 ± 0.11 spikes/s for V1, n = 98; mean ± SEM; p < 0.001, Kolmogorov–Smirnov test), indicating that the average membrane potential was already close to the threshold in the absence of any visual stimulation, and thus only a small intercept would occur.
Previous studies on cat cortical cells have demonstrated that a proportional scaling of feedforward inputs at different contrasts could not account for the maintained orientation tuning width. Nonlinear mechanisms have to be added to explain contrast invariance (Finn et al., 2007; Sadagopan and Ferster, 2012). In contrast to the sharply tuned cortical cells (Fig. 3B–D), our results showed that a simple feedforward model is sufficient to explain contrast invariance in the broadly tuned dLGN cells without the need of any nonlinear computations.
Comparison of functional properties of the dLGN and superior colliculus
We finally compared the functional properties of the dLGN and SC, the two major targets of retinal projections. The SC data were taken from our previously published study reporting direction- and orientation-selective responses in the mouse SC (Wang et al., 2010b). It should be noted that, in the SC recordings, the visual stimulus was placed to cover the visual field contralateral to the recorded hemisphere, which was more temporal than in the current study.
Both dLGN and SC cells showed similar distributions of direction and orientation selectivity (Fig. 11A–C). The most striking functional dichotomy between the two structures is their response linearity. The majority of SC cells showed small F1/F0 ratios, indicating a nonlinear response (Fig. 11D), which has been shown to result from their overlapping ON/OFF RFs (Wang et al., 2010b). In contrast, the majority of dLGN cells had high F1/F0 ratios, presumably due to their single-sign RFs. The larger overlap of ON/OFF pathways in the SC than dLGN could be in part ascribed to the higher convergence ratio in SC (Chandrasekaran et al., 2007). However, it may be of interest for future studies to determine whether any molecular cues and/or plasticity rules are responsible for the distinct ON/OFF convergence patterns in the two structures.
Figure 11.

Comparison of functional properties in the dLGN and SC. A, Cumulative distributions of the DSI in the dLGN (red) and SC (black; n = 54 for dLGN and n = 125 for SC, p = 0.34, Kolmogorov–Smirnov test). B, C, Cumulative distributions of the OSI (B) and global OSI (C) in the dLGN (red) and SC (black; n = 54 for dLGN and n = 125 for SC, p = 0.79, Kolmogorov–Smirnov test). D, Distributions of the F1/F0 ratio in the dLGN (red) and SC (black; n = 54 for dLGN and n = 125 for SC, p < 0.001, Kolmogorov–Smirnov test). E, Distributions of the preferred spatial frequency in the dLGN (red) and SC (black; n = 54 for dLGN and n = 125 for SC, p < 0.001, χ2 test).
Another difference between the SC and dLGN is their spatial frequency tuning. More SC cells preferred higher spatial frequencies than the dLGN cells (Fig. 11E). This distinction may be due to a potential difference in their RF sizes. Additionally or alternatively, the difference in response linearity may contribute to the different spatial frequency preference. For dLGN cells, which have single-sign RFs, a high spatial frequency grating with its half wavelength smaller than the diameter of the RF can only activate the RF partially at any given time. For SC cells with overlapping ON/OFF subfields, however, the same grating could activate a part of the ON and a part of the OFF subfields simultaneously, which could potentially evoke a strong response.
Discussion
Orientation selectivity in the dLGN
In this study, we performed electrophysiological recordings to study orientation-selective cells in the mouse dLGN. Almost 60% of the recorded dLGN cells had OSI >0.33, meaning that their responses at the preferred orientations were at least twice as large as those at the orthogonal orientations. Direction/orientation-selective cells were recently observed in a superficial layer on the dorsal side of the dLGN (the “dorsal shell”) in a functional imaging study (Marshel et al., 2012). This observation is consistent with the anatomical projections of some subgroups of direction-selective RGCs to the superficial dLGN (Huberman et al., 2009; Rivlin-Etzion et al., 2011). Another recent study of mouse dLGN also found direction/orientation-selective cells that are enriched in the area where the direction-selective RGCs terminate (Piscopo et al., 2013). Although we did not reconstruct the precise depth of our recordings, the observation that some orientation-selective responses were driven by the ipsilateral eye suggests that the selective dLGN cells are not restricted to the dorsal surface, since ipsilaterally responsive neurons cluster in a patch underneath the dorsal shell (Huberman et al., 2008).
Orientation-selective dLGN cells have been reported in cats and primates, including macaques, owl monkeys, and marmosets (Smith et al., 1990; White et al., 1998; Xu et al., 2002), but the selectivity appeared less prominent in those species than what we reported here in mice. We converted the reported values in cats (Daniels et al., 1977; Vidyasagar and Urbas, 1982) to the same orientation selectivity index used here for comparisons. In cats, the percentage of dLGN cells that had OSI >0.33 were ∼20–40% (Table 1). Highly selective cells (OSI >0.5) were ∼5–8%, compared with almost 40% in our recordings in mice. Despite the difference in the percentage of selective cells, a couple of common features are shared across species. First, a lesion of V1 did not significantly alter the percentage of orientation-selective dLGN cells in cats (Vidyasagar and Urbas, 1982), consistent with our result that the dLGN selectivity was not due to cortical feedback. Second, as in mice, the preferred orientation was found to correlate with the RF shape in the dLGN cells that had elongated RFs in cats and primates (Soodak et al., 1987; Smith et al., 1990). One difference is that the preferred orientations of dLGN cells were found to be biased toward the horizontal orientation in cats and primates (Vidyasagar and Urbas, 1982; Smith et al., 1990), rather than a vertical bias observed in mice (also seen in the recent imaging study), which might be related to the laterally located eyes in mice. In a recent study of marmosets, a sparse population of koniocellular dLGN cells was found to have simple cell-like RFs (segregated ON/OFF) and was orientation selective (Cheong et al., 2013). In our recordings of mouse dLGN cells, however, the RFs of nearly all cells (n = 30/31) were of single sign.
Table 1.
Comparison of dLGN orientation selectivity in different species
| Mouse | Cat | Macaque | |
|---|---|---|---|
| Orientation-selective cells (based on OSI) | 59% (OSI >0.33)a | 26–41% (OSI >0.33)b,c | “Only a small number of cells”d |
| 39% (OSI >0.5)a | 5–8% (OSI >0.5)b,c | ||
| Distribution of the preferred orientation | Vertical biasa,e,f | Horizontal biasc | Horizontal biasd |
| Independent of cortical feedback | Yesa | Yesc | |
| Preferred orientation predicted from the elongated RF | Yesa,f | Yesg | Yesd |
| Orientation-selective cells that have circular RFs | Yesa,f | ||
| Orientation-selective to static stimuli | Yesa | Yesd | |
| Largely similar orientation tuning at different contrasts | Yesa |
apresent study.
Contribution of dLGN orientation selectivity to cortical orientation selectivity
The functional significance of orientation selectivity in the dLGN relies critically on how it contributes to response properties in V1. Although dLGN orientation selectivity has been observed in cats and monkeys, three arguments have been made to challenge its significance in building up cortical selectivity (Ferster and Koch, 1987; Ferster, 1987): (1) only a small portion of dLGN cells are orientation selective in these species; (2) most dLGN cells are only selective at high spatial frequencies (at most times, higher than their preferred spatial frequencies), while most cortical cells prefer lower spatial frequencies (Soodak et al., 1987); and (3) the convergence ratio from dLGN relay cells to single cortical cells is high so that any orientation preference in individual dLGN cells will likely be averaged out.
The first two arguments are not applicable to mice. First, we showed over half of mouse dLGN cells are selective. Second, the dLGN orientation selectivity was always analyzed at the cell's preferred spatial frequency, and similarly selective responses were observed at the spatial frequencies preferred by most V1 cells. For the convergence ratio from the dLGN to V1, electrical stimulation and cross-correlation studies estimated it to be ∼30 in cats (Alonso et al., 2001). Although such experiments have not been done in mouse V1, studies of other cortical areas in rodents reported weak unitary EPSPs of the thalamocortical input, compared with the total input that single cortical cells receive during sensory stimulation (Bruno and Sakmann, 2006). It is thus likely that the dLGN/V1 convergence ratio is also high in mice. High convergence ratio, however, does not rule out the possibility that individual selective dLGN cells may contribute to the postsynaptic cortical cell's selectivity. The distribution of the preferred orientations of the presynaptic cells may be biased or the synaptic strength may be stronger for inputs that prefer particular orientations, either of which could result in an orientation bias in the postsynaptic cell's synaptic input. It was observed that individual mouse V1 neurons receive inputs that are tuned to widespread orientations, and the overall orientation preference is determined by the summation of the heterogeneously tuned synaptic inputs (Jia et al., 2010). Some of those inputs may originate from the orientation-selective dLGN cells and could thus contribute to the overall tuning. Furthermore, it has been suggested for intracortical connections that some plasticity mechanisms may exist during development to boost the convergence of presynaptic cells with similar preferred orientations (Ko et al., 2011). If similar mechanisms also work for thalamocortical connections, the orientation-selective dLGN cells may help determine cortical selectivity developmentally.
Our data thus suggest that orientation-selective responses in the mouse dLGN could play a significant role in establishing cortical selectivity. However, it is important to note that our data do not argue against the importance of cortical circuits in implementing orientation selectivity, but in fact support it by showing that V1 selectivity is much better than in the dLGN.
Mechanisms underlying orientation selectivity in the dLGN
Our experiments ruled out the possibility that orientation selectivity in the dLGN may arise from cortical feedback. Three other mechanisms may underlie orientation selectivity in the mouse dLGN: (1) individual dLGN cells may combine inputs from the RGCs whose RFs are displaced spatially; (2) dLGN cells may directly inherit their selectivity from selective RGCs; and (3) the dLGN may compute orientation selectivity locally.
The convergence ratio from RGCs to dLGN cells is known to be low (2–3:1; Chen and Regehr, 2000), making the first mechanism likely (but note that more RGCs may indirectly influence single dLGN cells through their gap junctions with other RGCs; Völgyi et al., 2009). For example, if a dLGN cell receives inputs from two RGCs, any spatial displacement of the RGCs' RF centers will potentially lead to an orientation bias. This possibility is supported by our observations of multiple-peak RFs in some dLGN cells and the correlation between the preferred orientation and RF shape. This mechanism, however, is unlikely to be the dominant cause, because more than half of the selective dLGN cells have nearly circular RFs. Both mechanisms 2 and 3 can give rise to orientation selectivity in such cells, and our methods do not allow us to tell them apart. The contribution of retinal versus intrageniculate circuits to dLGN selectivity has been studied in cats and is still controversial. Synaptic inputs, revealed by “S-potentials” (Cleland et al., 1971), were shown to be as tuned as spikes in orientation-selective dLGN cells in cats (Soodak et al., 1987), indicating a feedforward (retinal) origin of orientation selectivity. On the other hand, blocking GABAergic transmission in the dLGN dramatically weakened orientation selectivity (Vidyasagar, 1984), interpreted to support the idea that dLGN orientation selectivity originates from local inhibitory circuits. This type of manipulation, however, is confounded by the saturation of the postsynaptic cell's responses. Inhibition may just play a permissive role in generating selective output by expanding the cell's dynamic range, while the bias to specific stimulus orientations may still be established by the excitatory input. The remaining orientation selectivity after the application of GABA receptor blocker, though diminished, is consistent with this interpretation. In addition, our result of the contrast's effect on dLGN orientation tuning is consistent with a dominant role of retinal inputs. With only a very simple assumption, the feedforward model was able to fully explain the observed relationship between dLGN responses at high and low contrasts, without the need of any nonlinear computation.
Consistent with the retinal origin of orientation selectivity in the dLGN, direction-selective RGCs are known to exist in the mouse retina for years. Our retinal recordings further reveal a substantial portion of orientation-selective RGCs, as reported in cats, rabbits, and primates. These results thus support the possibility that some dLGN cells directly inherit selectivity from their retinal inputs. Future studies are needed to test this possibility directly by taking advantage of genetic approaches to trace synaptic connections and manipulate neuronal activity in mice.
Footnotes
This work was supported by National Institutes of Health Grants EY018621 and EY020950 to J.C., and EY019034 to X.L.; and by a Howard Hughes Medical Institute International Student Fellowship to X.Z. We thank Dr. Bor-Shuen Wang for help with cortical recording.
The authors declare no competing financial interests.
References
- Alonso JM, Usrey WM, Reid RC. Rules of connectivity between geniculate cells and simple cells in cat primary visual cortex. J Neurosci. 2001;21:4002–4015. doi: 10.1523/JNEUROSCI.21-11-04002.2001. [DOI] [PMC free article] [PubMed] [Google Scholar]
- Anderson JS, Lampl I, Gillespie DC, Ferster D. The contribution of noise to contrast invariance of orientation tuning in cat visual cortex. Science. 2000;290:1968–1972. doi: 10.1126/science.290.5498.1968. [DOI] [PubMed] [Google Scholar]
- Barlow HB, Hill RM. Selective sensitivity to direction of movement in ganglion cells of the rabbit retina. Science. 1963;139:412–414. doi: 10.1126/science.139.3553.412. [DOI] [PubMed] [Google Scholar]
- Briggman KL, Helmstaedter M, Denk W. Wiring specificity in the direction-selectivity circuit of the retina. Nature. 2011;471:183–188. doi: 10.1038/nature09818. [DOI] [PubMed] [Google Scholar]
- Bruno RM, Sakmann B. Cortex is driven by weak but synchronously active thalamocortical synapses. Science. 2006;312:1622–1627. doi: 10.1126/science.1124593. [DOI] [PubMed] [Google Scholar]
- Cang J, Kalatsky VA, Löwel S, Stryker MP. Optical imaging of the intrinsic signal as a measure of cortical plasticity in the mouse. Vis Neurosci. 2005;22:685–691. doi: 10.1017/S0952523805225178. [DOI] [PMC free article] [PubMed] [Google Scholar]
- Cantrell DR, Cang J, Troy JB, Liu X. Non-centered spike-triggered covariance analysis reveals neurotrophin-3 as a developmental regulator of receptive field properties of ON-OFF retinal ganglion cells. PLoS Comput Biol. 2010;6:e1000967. doi: 10.1371/journal.pcbi.1000967. [DOI] [PMC free article] [PubMed] [Google Scholar]
- Chandrasekaran AR, Shah RD, Crair MC. Developmental homeostasis of mouse retinocollicular synapses. J Neurosci. 2007;27:1746–1755. doi: 10.1523/JNEUROSCI.4383-06.2007. [DOI] [PMC free article] [PubMed] [Google Scholar]
- Chen C, Regehr WG. Developmental remodeling of the retinogeniculate synapse. Neuron. 2000;28:955–966. doi: 10.1016/S0896-6273(00)00166-5. [DOI] [PubMed] [Google Scholar]
- Cheong SK, Tailby C, Solomon SG, Martin PR. Cortical-like receptive fields in the lateral geniculate nucleus of marmoset monkeys. J Neurosci. 2013;33:6864–6876. doi: 10.1523/JNEUROSCI.5208-12.2013. [DOI] [PMC free article] [PubMed] [Google Scholar]
- Cleland BG, Dubin MW, Levick WR. Simultaneous recording of input and output of lateral geniculate neurones. Nat New Biol. 1971;231:191–192. doi: 10.1038/newbio231191a0. [DOI] [PubMed] [Google Scholar]
- Daniels JD, Norman JL, Pettigrew JD. Biases for oriented moving bars in lateral geniculate nucleus neurons of normal and stripe-reared cats. Exp Brain Res. 1977;29:155–172. doi: 10.1007/BF00237039. [DOI] [PubMed] [Google Scholar]
- Elstrott J, Anishchenko A, Greschner M, Sher A, Litke AM, Chichilnisky EJ, Feller MB. Direction selectivity in the retina is established independent of visual experience and cholinergic retinal waves. Neuron. 2008;58:499–506. doi: 10.1016/j.neuron.2008.03.013. [DOI] [PMC free article] [PubMed] [Google Scholar]
- Ferster D. Origin of orientation-selective EPSPs in simple cells of cat visual cortex. J Neurosci. 1987;7:1780–1791. doi: 10.1523/JNEUROSCI.07-06-01780.1987. [DOI] [PMC free article] [PubMed] [Google Scholar]
- Ferster D, Koch C. Neuronal connections underlying orientation selectivity in cat visual cortex. Trends Neurosci. 1987;10:487–492. [Google Scholar]
- Ferster D, Miller KD. Neural mechanisms of orientation selectivity in the visual cortex. Annu Rev Neurosci. 2000;23:441–471. doi: 10.1146/annurev.neuro.23.1.441. [DOI] [PubMed] [Google Scholar]
- Finn IM, Priebe NJ, Ferster D. The emergence of contrast-invariant orientation tuning in simple cells of cat visual cortex. Neuron. 2007;54:137–152. doi: 10.1016/j.neuron.2007.02.029. [DOI] [PMC free article] [PubMed] [Google Scholar]
- Grubb MS, Thompson ID. Quantitative characterization of visual response properties in the mouse dorsal lateral geniculate nucleus. J Neurophysiol. 2003;90:3594–3607. doi: 10.1152/jn.00699.2003. [DOI] [PubMed] [Google Scholar]
- Hubel DH, Wiesel TN. Receptive fields, binocular interaction and functional architecture in the cat's visual cortex. J Physiol. 1962;160:106–154. doi: 10.1113/jphysiol.1962.sp006837. [DOI] [PMC free article] [PubMed] [Google Scholar]
- Hubel DH, Wiesel TN. Receptive fields and functional architecture of monkey striate cortex. J Physiol. 1968;195:215–243. doi: 10.1113/jphysiol.1968.sp008455. [DOI] [PMC free article] [PubMed] [Google Scholar]
- Huberman AD, Feller MB, Chapman B. Mechanisms underlying development of visual maps and receptive fields. Annu Rev Neurosci. 2008;31:479–509. doi: 10.1146/annurev.neuro.31.060407.125533. [DOI] [PMC free article] [PubMed] [Google Scholar]
- Huberman AD, Wei W, Elstrott J, Stafford BK, Feller MB, Barres BA. Genetic identification of an On-Off direction-selective retinal ganglion cell subtype reveals a layer-specific subcortical map of posterior motion. Neuron. 2009;62:327–334. doi: 10.1016/j.neuron.2009.04.014. [DOI] [PMC free article] [PubMed] [Google Scholar]
- Jia H, Rochefort NL, Chen X, Konnerth A. Dendritic organization of sensory input to cortical neurons in vivo. Nature. 2010;464:1307–1312. doi: 10.1038/nature08947. [DOI] [PubMed] [Google Scholar]
- Jones JP, Palmer LA. The two-dimensional spatial structure of simple receptive fields in cat striate cortex. J Neurophysiol. 1987;58:1187–1211. doi: 10.1152/jn.1987.58.6.1187. [DOI] [PubMed] [Google Scholar]
- Ko H, Hofer SB, Pichler B, Buchanan KA, Sjöström PJ, Mrsic-Flogel TD. Functional specificity of local synaptic connections in neocortical networks. Nature. 2011;473:87–91. doi: 10.1038/nature09880. [DOI] [PMC free article] [PubMed] [Google Scholar]
- Lee BB, Creutzfeldt OD, Elepfandt A. The responses of magno- and parvocellular cells of the monkey's lateral geniculate body to moving stimuli. Exp Brain Res. 1979;35:547–557. doi: 10.1007/BF00236771. [DOI] [PubMed] [Google Scholar]
- Lee SH, Kwan AC, Zhang S, Phoumthipphavong V, Flannery JG, Masmanidis SC, Taniguchi H, Huang ZJ, Zhang F, Boyden ES, Deisseroth K, Dan Y. Activation of specific interneurons improves V1 feature selectivity and visual perception. Nature. 2012;488:379–383. doi: 10.1038/nature11312. [DOI] [PMC free article] [PubMed] [Google Scholar]
- Levick WR, Thibos LN. Analysis of orientation bias in cat retina. J Physiol. 1982;329:243–261. doi: 10.1113/jphysiol.1982.sp014301. [DOI] [PMC free article] [PubMed] [Google Scholar]
- Li YT, Ma WP, Li LY, Ibrahim LA, Wang SZ, Tao HW. Broadening of inhibitory tuning underlies contrast-dependent sharpening of orientation selectivity in mouse visual cortex. J Neurosci. 2012;32:16466–16477. doi: 10.1523/JNEUROSCI.3221-12.2012. [DOI] [PMC free article] [PubMed] [Google Scholar]
- Liu BH, Li YT, Ma WP, Pan CJ, Zhang LI, Tao HW. Broad inhibition sharpens orientation selectivity by expanding input dynamic range in mouse simple cells. Neuron. 2011;71:542–554. doi: 10.1016/j.neuron.2011.06.017. [DOI] [PMC free article] [PubMed] [Google Scholar]
- Marshel JH, Kaye AP, Nauhaus I, Callaway EM. Anterior-posterior direction opponency in the superficial mouse lateral geniculate nucleus. Neuron. 2012;76:713–720. doi: 10.1016/j.neuron.2012.09.021. [DOI] [PMC free article] [PubMed] [Google Scholar]
- Moore BD, 4th, Kiley CW, Sun C, Usrey WM. Rapid plasticity of visual responses in the adult lateral geniculate nucleus. Neuron. 2011;71:812–819. doi: 10.1016/j.neuron.2011.06.025. [DOI] [PMC free article] [PubMed] [Google Scholar]
- Niell CM, Stryker MP. Highly selective receptive fields in mouse visual cortex. J Neurosci. 2008;28:7520–7536. doi: 10.1523/JNEUROSCI.0623-08.2008. [DOI] [PMC free article] [PubMed] [Google Scholar]
- Olsen SR, Bortone DS, Adesnik H, Scanziani M. Gain control by layer six in cortical circuits of vision. Nature. 2012;483:47–52. doi: 10.1038/nature10835. [DOI] [PMC free article] [PubMed] [Google Scholar]
- Passaglia CL, Troy JB, Rüttiger L, Lee BB. Orientation sensitivity of ganglion cells in primate retina. Vision Res. 2002;42:683–694. doi: 10.1016/S0042-6989(01)00312-1. [DOI] [PMC free article] [PubMed] [Google Scholar]
- Pelli DG. The VideoToolbox software for visual psychophysics: transforming numbers into movies. Spat Vis. 1997;10:437–442. doi: 10.1163/156856897X00366. [DOI] [PubMed] [Google Scholar]
- Piscopo DM, El-Danaf RN, Huberman AD, Niell CM. Diverse visual features encoded in mouse lateral geniculate nucleus. J Neurosci. 2013;33:4642–4656. doi: 10.1523/JNEUROSCI.5187-12.2013. [DOI] [PMC free article] [PubMed] [Google Scholar]
- Ringach DL, Sapiro G, Shapley R. A subspace reverse-correlation technique for the study of visual neurons. Vision Res. 1997;37:2455–2464. doi: 10.1016/S0042-6989(96)00247-7. [DOI] [PubMed] [Google Scholar]
- Rivlin-Etzion M, Zhou K, Wei W, Elstrott J, Nguyen PL, Barres BA, Huberman AD, Feller MB. Transgenic mice reveal unexpected diversity of on-off direction-selective retinal ganglion cell subtypes and brain structures involved in motion processing. J Neurosci. 2011;31:8760–8769. doi: 10.1523/JNEUROSCI.0564-11.2011. [DOI] [PMC free article] [PubMed] [Google Scholar]
- Rivlin-Etzion M, Wei W, Feller MB. Visual stimulation reverses the directional preference of direction-selective retinal ganglion cells. Neuron. 2012;76:518–525. doi: 10.1016/j.neuron.2012.08.041. [DOI] [PMC free article] [PubMed] [Google Scholar]
- Rochefort NL, Narushima M, Grienberger C, Marandi N, Hill DN, Konnerth A. Development of direction selectivity in mouse cortical neurons. Neuron. 2011;71:425–432. doi: 10.1016/j.neuron.2011.06.013. [DOI] [PubMed] [Google Scholar]
- Sadagopan S, Ferster D. Feedforward origins of response variability underlying contrast invariant orientation tuning in cat visual cortex. Neuron. 2012;74:911–923. doi: 10.1016/j.neuron.2012.05.007. [DOI] [PMC free article] [PubMed] [Google Scholar]
- Sarnaik R, Wang BS, Cang J. Experience-dependent and independent binocular correspondence of receptive field subregions in mouse visual cortex. Cereb Cortex. 2013 doi: 10.1093/cercor/bht027. doi: 10.1093/cercor/bht027. Advance online publication. Retrieved Feb 6, 2013. [DOI] [PMC free article] [PubMed] [Google Scholar]
- Simpson JI. The accessory optic system. Annu Rev Neurosci. 1984;7:13–41. doi: 10.1146/annurev.ne.07.030184.000305. [DOI] [PubMed] [Google Scholar]
- Skottun BC, Bradley A, Sclar G, Ohzawa I, Freeman RD. The effects of contrast on visual orientation and spatial frequency discrimination: a comparison of single cells and behavior. J Neurophysiol. 1987;57:773–786. doi: 10.1152/jn.1987.57.3.773. [DOI] [PubMed] [Google Scholar]
- Smith EL, 3rd, Chino YM, Ridder WH, 3rd, Kitagawa K, Langston A. Orientation bias of neurons in the lateral geniculate nucleus of macaque monkeys. Vis Neurosci. 1990;5:525–545. doi: 10.1017/S0952523800000699. [DOI] [PubMed] [Google Scholar]
- Soodak RE, Shapley RM, Kaplan E. Linear mechanism of orientation tuning in the retina and lateral geniculate nucleus of the cat. J Neurophysiol. 1987;58:267–275. doi: 10.1152/jn.1987.58.2.267. [DOI] [PubMed] [Google Scholar]
- Tan AY, Brown BD, Scholl B, Mohanty D, Priebe NJ. Orientation selectivity of synaptic input to neurons in mouse and cat primary visual cortex. J Neurosci. 2011;31:12339–12350. doi: 10.1523/JNEUROSCI.2039-11.2011. [DOI] [PMC free article] [PubMed] [Google Scholar]
- Venkataramani S, Taylor WR. Orientation selectivity in rabbit retinal ganglion cells is mediated by presynaptic inhibition. J Neurosci. 2010;30:15664–15676. doi: 10.1523/JNEUROSCI.2081-10.2010. [DOI] [PMC free article] [PubMed] [Google Scholar]
- Vidyasagar TR. Contribution of inhibitory mechanisms to the orientation sensitivity of cat dLGN Neurones. Exp Brain Res. 1984;55:192–195. doi: 10.1007/BF00240517. [DOI] [PubMed] [Google Scholar]
- Vidyasagar TR, Urbas JV. Orientation sensitivity of cat LGN neurones with and without inputs from visual cortical areas 17 and 18. Exp Brain Res. 1982;46:157–169. doi: 10.1007/BF00237172. [DOI] [PubMed] [Google Scholar]
- Völgyi B, Chheda S, Bloomfield SA. Tracer coupling patterns of the ganglion cell subtypes in the mouse retina. J Comp Neurol. 2009;512:664–687. doi: 10.1002/cne.21912. [DOI] [PMC free article] [PubMed] [Google Scholar]
- Wang BS, Sarnaik R, Cang J. Critical period plasticity matches binocular orientation preference in the visual cortex. Neuron. 2010a;65:246–256. doi: 10.1016/j.neuron.2010.01.002. [DOI] [PMC free article] [PubMed] [Google Scholar]
- Wang L, Sarnaik R, Rangarajan K, Liu X, Cang J. Visual receptive field properties of neurons in the superficial superior colliculus of the mouse. J Neurosci. 2010b;30:16573–16584. doi: 10.1523/JNEUROSCI.3305-10.2010. [DOI] [PMC free article] [PubMed] [Google Scholar]
- Wei W, Hamby AM, Zhou K, Feller MB. Development of asymmetric inhibition underlying direction selectivity in the retina. Nature. 2011;469:402–406. doi: 10.1038/nature09600. [DOI] [PMC free article] [PubMed] [Google Scholar]
- Weng S, Sun W, He S. Identification of ON-OFF direction-selective ganglion cells in the mouse retina. J Physiol. 2005;562:915–923. doi: 10.1113/jphysiol.2004.076695. [DOI] [PMC free article] [PubMed] [Google Scholar]
- White AJ, Wilder HD, Goodchild AK, Sefton AJ, Martin PR. Segregation of receptive field properties in the lateral geniculate nucleus of a New-World monkey, the marmoset Callithrix jacchus. J Neurophysiol. 1998;80:2063–2076. doi: 10.1152/jn.1998.80.4.2063. [DOI] [PubMed] [Google Scholar]
- Wilson NR, Runyan CA, Wang FL, Sur M. Division and subtraction by distinct cortical inhibitory networks in vivo. Nature. 2012;488:343–348. doi: 10.1038/nature11347. [DOI] [PMC free article] [PubMed] [Google Scholar]
- Xu X, Ichida J, Shostak Y, Bonds AB, Casagrande VA. Are primate lateral geniculate nucleus (LGN) cells really sensitive to orientation or direction? Vis Neurosci. 2002;19:97–108. doi: 10.1017/S0952523802191097. [DOI] [PubMed] [Google Scholar]