

Abstract
ImagePlane is a modular pipeline for automated, high-throughput image analysis and information extraction. Designed to support planarian research, ImagePlane offers a self-parameterizing adaptive thresholding algorithm; an algorithm that can automatically segment animals into anterior–posterior/left–right quadrants for automated identification of region-specific differences in gene and protein expression; and a novel algorithm for quantification of morphology of animals, independent of their orientations and sizes. ImagePlane also provides methods for automatic report generation, and its outputs can be easily imported into third-party tools such as R and Excel. Here we demonstrate the pipeline's utility for identification of genes involved in stem cell proliferation in the planarian Schmidtea mediterranea. Although designed to support planarian studies, ImagePlane will prove useful for cell-based studies as well.
Key words: biology, functional genomics, genomics
1. Introduction
The commercial availability of automated microscopes equipped with robotic sample-handling capabilities is making possible complex image-based assays that employ functional genomics techniques such as RNAi to investigate gene function at the genome scale (Kamath and Ahringer, 2003; Paddison and Hannon, 2003; Boutros et al., 2004; Kuttenkeuler and Boutros, 2004). These screens typically generate many thousands of images that must be processed and analyzed. Current paradigms of image processing and analysis generally involve graphical user interfaces (GUIs) to prepackaged collections of image-processing algorithms. Users typically employ these packages to process images one at a time or in batch mode using pull-down menus and check buttons. Although these software packages are useful, they also present researchers with practical difficulties when modification and customization are required. Obtaining the legal permissions and corporate support for customization, for example, is often a troublesome task. These have driven the development of publicly available image-processing libraries such as ImageJ (Collins, 2007; Papadopulos et al., 2007).
Although GUI-based packages are extremely useful, using them to process thousands of images even in batch mode can be time-consuming and exhausting. The large numbers of images generated by high-throughput image-based screens thus necessitate more automated approaches that minimize the need for GUI-mediated user interactions. Indeed, the ultimate goal of such automation (somewhat paradoxically) is the creation of image analysis pipelines that can rapidly extract information from large numbers of images without anyone ever actually looking at the images. In many respects, the challenges here resemble those previously encountered in the domain of genome annotation. Early genome annotation efforts were human-driven, with teams of investigators manually inspecting the details of aligned expressed sequence tags (ESTs) and proteins to a sequenced genome in order to deduce the intron–exon structures of novel genes (Oliver et al., 1992; Fleischmann et al., 1995). For reasons of economy and scale, the genomics field has gradually moved away from manual approaches, and today most genomes are annotated in an automated fashion (Curwen et al., 2004; Liang et al., 2009; Holt and Yandell, 2011). Today's image-based screens offer very similar challenges, and similar solutions are needed. A key point to appreciate in this regard is the distinction between solutions to basic problems in image processing—such as segmentation, registration, and thresholding—and the issues surrounding practical approaches to automated high-throughput image analysis. Like today's automated genome annotation pipelines (Curwen et al., 2004; Holt and Yandell, 2011), the challenge here is not so much to develop new techniques and algorithms, but rather to integrate existing tools and approaches into efficient, reliable, and accurate pipelines for automated information extraction and analyses of large collections of images.
Some of the most exciting opportunities for high-throughput image analyses involve screens of differentiating cells and embryos that employ RNAi and siRNA techniques to systematically perturb gene function at the genome scale. One problem here is the three-dimensionality of developing plant and animal embryos, which significantly complicates automated analyses. The need to register and segment images of un-orientated, morphologically complex embryos is a great challenge, one being addressed by many researchers today (Eliceiri et al., 2012). Although algorithmic breakthroughs are something to look forward to, there are other alternatives. One is to restrict the dimensionality of the problem by choosing less irregularly shaped organisms and tissues. In this regard, the planarian Schmidtea mediterranea is an obvious choice. Long renowned for its ability to regenerate, recent work has also shown that this planarian is an excellent model for stem cell biology. Equally important, planarians are literally flatworms. This fact greatly simplifies automated analyses. As our results demonstrate, S. mediterranea can be treated as two-dimensional for many image analysis applications; this has allowed us to largely circumvent the complexities associated with analyses of embryos and tissues having complex three-dimensional morphologies.
With these considerations in mind, we have developed an automated image analysis pipeline for planarian research called ImagePlane. This pipeline provides a self-configuring means to automatically threshold images, and to automatically identify and count stained cells. ImagePlane can also automatically segment images of planarians into anterior–posterior (A-P)/left–right (L-R) quadrants, a prerequisite for automated identification of region-specific differences in gene and protein expression. ImagePlane also provides a novel algorithm that allows rough, but rapid, quantification of morphological phenotypes independent of differences in animal orientation and size. This is an important step forward for planarian researchers, as animals can, and usually do, vary in size from individual to individual and between experimental batches. ImagePlane also provides practical methods for automatic report generation, and its outputs can be easily imported into third-party tools such as R and Excel. Here we demonstrate ImagePlane's utility using an image-based RNAi screen to identify genes involved in stem cell proliferation in the planarian S. mediterranea. Although designed primarily to support planarian studies, ImagePlane should prove useful for any high-throughput image-based investigation of approximately two-dimensional biological samples, including cell-based studies, and sectioned histological samples.
2. Methods
2.1. Basic screen
We used a high-affinity antibody for phosphorylated histone 3 (H3P) (Millipore, Billerica, MA) to identify mitotic cells in S. mediterranea. Previous work has shown that this antibody provides effective means to identify neoblastic stem cells that are maintained throughout adult life (Hendzel et al., 1997; Newmark and Sánchez Alvarado, 2000; Reddien et al., 2005a). The screen proceeds as follows. First, animals are fed E. coli transformed with a plasmid designed to produce dsRNA of a chosen gene. Whole animals are fixed and stained with H3P antibody. cdc23 was used as a positive RNAi control; this gene causes a twofold increase in the numbers of H3P-positive nuclei upon RNAi feeding (Reddien et al., 2005a). The Caenorhabditis elegans unc-22 gene was used as a negative (placebo) control (Moerman et al., 1986; Yandell et al., 1994; Reddien et al., 2005a). Up to this point, this screen is identical to the one used by Reddien et al. (2005a). Next, animals were imaged using a BD Pathway Bioimager with a 10× objective. Animals were arrayed on 96-well plates with 44 RNAi-fed animals for three different genes, including 18 positive control (cdc23) and 15 negative control (unc-22) animals.
2.2. Determining animal outline and size
First, a simple algorithm is employed that iteratively computes an average weighted-by-pixel intensity to find the valley between the signal and background for each image. This algorithm works by starting with a guess, and then iteratively changing this guess until the number of background pixels weighted by intensity is equal to the foreground pixels weighted by intensity.
Next, each image is binarized by setting all the pixels below this value to 0 (minimum intensity) and above this value to 255 (maximum intensity). Ideally, every pixel with intensity above this threshold value is part of an animal. However, it is possible to have an image that has other objects (dust, etc.) outside the worm that also pass this particular thresholding filter. If objects exterior to the worm are not excluded, then the size of the worm will be miscalculated. Thus, objects exterior to the worm need to be differentiated. This is done using a recursive algorithm to determine which of the objects that passed the threshold is the largest. The following seven steps give a conceptual overview of how this is done. (1) Consider every pixel in the image as unvisited. (2) Move through the image-row by column until an unvisited pixel is found that is above the previously determined threshold. Call this pixel P, and create an image object called O. (3) Mark P as visited and add P to O. (4) Consider the neighbors (pixels within one row or column) of P. For each neighbor that is above the threshold, call the neighbor P and repeat from step three. (5) Once steps 3 and 4 have concluded, O is a complete object in the image. Repeat from step 2. (6) Once all the pixels are visited, the O with the largest amount of pixels is considered the worm. (7) Set all pixels not in the largest O to 0. Relative animal size is then calculated as the number of pixels contained within its boundaries. Absolute size is obtained using scaling information contained in image metadata, or passed as an additional parameter. For cell-based studies, in which there may be multiple objects of interest in the same image, an optional size parameter can be set so that every object exceeding this value is identified.
2.3. A self-parameterizing thresholding algorithm
Once the locations, boundaries, and size of each animal are determined, the next task is to count H3-P-stained nuclei. Once absolute numbers are obtained, these can be converted to densities by dividing by animal size, effectively controlling for differences in animal sizes. The fact that stained neoblasts are often present at different pixel intensities complicates this operation, as there is no single threshold value that could be applied to the entire image that could accurately isolate the neoblasts. For these reasons, we implemented two different adaptive thresholding algorithms for inclusion in ImagePlane, a scale-dependent and scale-independent method. Complete details of these algorithms are given by Blayvas et al. (2006). In our hands, the adaptive thresholding methods performed best. This algorithm computes the threshold value for each pixel in the image through local weighted averages that are derived from max–min calculations across the interior of the animal in each image (Blayvas et al., 2006) (see Figs. 1 and 2 for additional details).
FIG. 1.
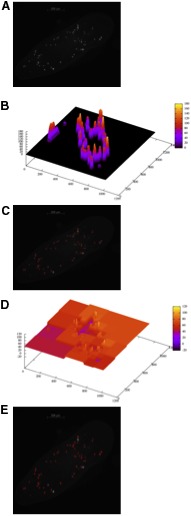
Operation of the Niblac (scale dependent) and multiresolution (scale independent) automatic thresholding algorithms. These algorithms compute a thresholding surface that is used to isolate stained neoblasts. (A) A typical image of stained neoblasts in a flatworm. (B) The threshold surface computed by the Niblac algorithm for the image in (A). (C) The automatically identified neoblasts (in red) after applying the computed threshold surface shown in (B). (D) The threshold surface computed by the multiresolution algorithm for the image in (A). (E) The automatically identified neoblasts (in red) after applying the computed threshold surface shown in (D).
FIG. 2.

Performance comparisons of Niblac (scale dependent) and multiresolution (scale independent) thresholding algorithms. X-axis, manual counts; Y-axis, automated counts. (A) Scale dependent. (B) Scale independent. The Pearson correlation coefficients are 0.94 for both (A) and (B). Although the scale-dependent algorithm (A) is more accurate, it suffers from the requirement that users must select a threshold value, whereas the multiresolution scale-independent algorithm (B), although less accurate, has the advantage of requiring no user configuration. ImagePlane supports both methods.
2.4. Image sectorization
Adapting previous work in C. elegans (Peng et al., 2008), we implemented a graph-based algorithm to automatically find the midline and left and right sides of an animal (see Fig. 3 for an example). Interestingly, we found that this algorithm performed poorly on some of our images. Further analyses determined that its performance was inversely proportional to the animals overall eccentricity; for example, it does well on long, thin animals, but poorly on more oval-shaped animals—a finding consistent with the algorithm of Peng et al. (2008), since it was developed for processing images of C. elegans, which are long and thin, whereas planarians are more oval-shaped. Supplementary Figure S1 (Supplementary Material is available online at www.liebertonline.com/cmb) documents this phenomenon. It also demonstrates that our algorithm, which is based on a segmentation approach, performs much better on oval-shaped animals—the vast majority of planarian images (Fig. 3 and Supplementary Fig. S1). Asymmetric expression can be quantified by taking the ratio between the numbers of stained nuclei in an animal's A-P halves and L-R sides—note that even in the absence of knowledge of which end of an animal is anterior or which side is left, asymmetric expression along the A-P and L-R axes can still be measured and compared between sets of images. The statistical significance of the asymmetries is evaluated by randomly permuting the x,y coordinates of fluorescing nuclei, and rescoring each quadrant 100 times. Asymmetries larger than any of those found in the 100 permuted images are judged statistically significant.
FIG. 3.
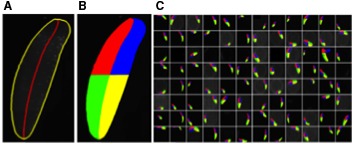
Automated segmentation and sectorization of a 96-well plate. (A) Each worm's outline and midline are first determined. (B) The animals are then sectorized into four quadrants before counting cells (not shown). (C) A sample 96-well plate, automatically processed by ImagePlane in situ.
2.5. Quantitation of results
With methods in place to determine the size, location, and neoblast count of the animal in the image, the neoblast density is computed as the neoblast count divided by the size (in pixels) of the animal. These counts are output as simple tab-delimited files containing columns for image id, animal size, neoblast counts, and density. These files are easily imported into Excel and R for subsequent analyses and figure generation. Figure 4 shows an example output processed using an R macro (provided in software download) to generate a simple graphical report.
FIG. 4.

Results summary for two different threshold algorithms. Summary of neoblast densities obtained automatically with ImagePlane for a dataset of 44 images with 18 cdc23 knockdown animals, 11 piwi2 knockdown animals, and a control set of 15 unc22 animals. (A) Results using Niblac thresholding. Tukey adjusted p-values for comparisons between groups: cdc23 to piwi2 = 0.06, cdc23 to unc22 < 0.01, piwi2 to unc22 = 0.33. (B) Results using multiresolution thresholding. Tukey adjusted p-values for comparisons between groups: cdc23 to piwi2 = 0.51, cdc23 to unc22 < 0.01, piwi2 to unc22 = 0.08. Error bars denote variance.
2.6. Quantifying morphologies
ImagePlane also includes an orientation and scale-invariant algorithm for detection, quantification, and analyses of morphological abnormalities such as those produced by RNAi gene knockdown experiments. The algorithm operates by first finding the outline of any automatically detected animal; this is accomplished using the algorithm previously described. ImagePlane then deduces the orientation of the animal by comparing the number of rows and columns transversed by the animal. Depending on the orientation of the animal, either the row or column lengths between the outline points are normalized by dividing by the size of the animal (in pixels) and recorded. Variation in the normalized distances produces a two-dimensional signature of the shape. Examples are shown in Figure 5A. These signatures have several important properties. First, they are orientation resistant, meaning that the orientation of the animal does not drastically affect the shape. Second, they are scale invariant; in other words, two animals with the same shape but of very different sizes will have similar signatures. Third, differences in any two signatures can be easily quantified, allowing us to group similar expression patterns and body morphologies (see Fig. 5B for an example).
FIG. 5.
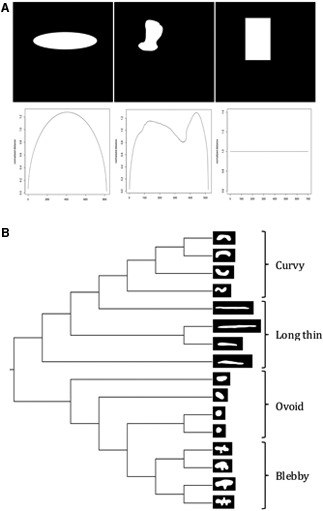
A scale-invariant algorithm for quantifying morphologies. (A) Three randomly chosen shapes. Their corresponding morphological signatures are shown below each shape. (B) Cladogram representation of a neighbor-joining tree created using distances between the morphological signature for each shape shown on the tree's leaves.
3. Results and Discussion
Planarians are renowned for their ability to regenerate (Reddien et al., 2005a); this ability is based on specialized neoblasts (Newmark and Sánchez Alvarado, 2000; Reddien et al., 2005b). These cells are the only proliferating cells in the planarian (Baguñà, 1974), and are found scattered throughout the animal. Neoblast progeny replace cells lost though normal cell turnover and are stimulated to proliferate when the animal is injured. With the successful introduction of dsRNA technology into planarians (Sánchez Alvarado and Newmark, 1999; Reddien et al., 2005a), S. mediterranea has become the first invertebrate regeneration model system in which gene function can be analyzed. These facts, coupled with the availability of its annotated genome sequence (Cantarel et al., 2008; Robb et al., 2008), make S. mediterranea an ideal system to carry out functional genomics screens aimed at identification of genes involved in regulating stem cell proliferation. S. mediterranea has another equally important characteristic: it is literally a flatworm. This makes it ideal for image-based screens. To date, however, no general-purpose image analysis pipeline has been available to assist with high-throughput analyses of planarian images. We have developed ImagePlane to fill this need.
Automated analyses typically begin with automatic binarization of 96-well plate images, such as those generated by an automated confocal microscope, such at the BD imager. This step identifies the animal's outline and calculates its total pixel area. Next, an adaptive thresholding algorithm (Blayvas et al., 2006) is used to distinguish signal from noise within the interior of each animal's outline. This is necessary because the intensity of stained cells and nuclei differ from image to image and even within individual images (Fig. 1). Thus, an adaptive approach is desirable because it allows this threshold to vary in a dynamic fashion within the animal boundaries and between individual images. Another advantage of adaptive approaches such as Niback's (Blayvas et al., 2006) is that it requires minimal user inputs in order to determine the optimal threshold. This is a significant advantage, as it circumvents the need for users to manually inspect each image and to laboriously determine an optimal threshold by trial and error, as they would using a GUI-based platform such as Metamorph, Volocity, and ImageJ. After thresholding, ImagePlane uses its automated cell/particle counting algorithm—the same one used to identify animal boundaries in the first step of the pipeline—to identify stained cells and nuclei within animal boundaries.
To assess the accuracy of each of these steps, we carried out a double-blind experiment in which animals were H3-P-stained for neoblasts, which were manually counted, and compared these results to those produced automatically by ImagePlane. As Figure 2 indicates, the accuracy of the automated approach is very good as judged by a Pearson's R of both the Niblack and multiresolution methods. The Pearson correlation of both the Niblack and multiresolution methods is 0.94. A paired t-test was used to test for differences between the manual and automated counts. Niblack's method was not significantly different from the manual count, but the multiresolution was judged significantly different with a p-value <0.01. The high correlation but significant difference between the manual counting and the multiresolution method is because of moderate but consistent undercounting.
ImagePlane also provides automated means for identifying A-P and L-R inhomogeneity in neoblast densities, such as those that might be produced in RNAi knockdown experiments of morphogens governing cell proliferation (Reddien et al., 2005b). This is accomplished using a modified form of the algorithm developed by Peng et al. (2008) for C. elegans studies. ImagePlane's algorithm sectorizes animals into four quadrants: anterior, posterior, left, and right. This algorithm allows users to automatically identify differences in expression along the length of an animal and between its and L–R halves. Asymmetric expression is quantified by taking the ratio between the numbers of staining nuclei in each quadrant—note that even in the absence of knowledge of which end of an animal is anterior or which side is left, asymmetric expression along the A-P and L-R axes can still be measured and compared between sets of images. Figure 3 shows a sample 96-well plate for which each well's image has been automatically processed to identify the animal outlines and to sectorize them. Also provided is an automated means for determining the statistical significance of these asymmetries. This is done by randomly permuting the x,y coordinates of fluorescing nuclei, and rescoring each quadrant 100 times. Asymmetries larger than any of those found in the 100 permuted images are judged statistically significant. Although our results did not contain any such asymmetries for the genes we analyzed, this functionality will likely prove useful for those carrying out screens aimed at identification of asymmetrically localized transcripts and proteins.
Figure 4 summarizes a proof-of-principle analysis. This figure demonstrates the automated detection of the effects of RNAi knockdowns of two genes, piwi2 and cdc23, known to be involved in planarian neoblast maintenance, and proliferation (Reddien et al., 2005a, 2005b); these are compared with a negative control, unc22 (Moerman et al., 1986; Yandell et al., 1994; Reddien et al., 2005a) (see Methods). Previous experiments have shown that when the gene cdc23 is knocked down (silenced) in S. mediterranea, the neoblast density increases as compared with wild-type animals (Reddien et al., 2005a). It has also been shown that when the gene piwi2 is knocked down, the neoblast density remains the same as compared with a wild-type animal, but that progeny cells fail to divide (Reddien et al., 2005b). For our proof-of-principle analyses, a dataset of 44 images was collected with 18 animals fed RNAi knockdown constructs for cdc23, 11 animals for piwi2, and a control set of 15 animals that were treated to knock down unc22. All 44 images were analyzed using ImagePlane's scale-dependent and scale-independent algorithms (Fig. 4A and B, respectively), and for each image, the neoblast density was computed 7 days post-feeding of the RNAi construct. These results demonstrate that ImagePlane, using either algorithm, was able to automatically detect a significant difference between unc22 and cdc23 (p<0.05)—with no difference between piwi2 and unc22 (p>0.05), Tukey multiple comparison method (R Core Team, 2012).
ImagePlane also addresses another challenge frequently encountered in high-throughput image-based screens of whole cells and animals: the need to automatically detect and quantify morphological changes. To speed such analyses, we have developed a scale-invariant algorithm that can automatically quantitate changes in body morphology. Although techniques currently exist to detect and quantify particular morphological changes, to our knowledge, our algorithm is the first to do so in an entirely ab initio fashion, and should be widely applicable to many different types of high-throughput biological screening assays. The algorithm operates by creating a two-dimensional summary or signature of each animal's outline. Examples are shown in Figure 5A. These signatures have several important properties. First, they are orientation resistant, meaning that the animal's orientation does not alter the signature appreciably. Second, the signatures are scale invariant; in other words, two animals with the same shape but of different sizes will have the same signature. This is a very desirable property for biological applications, especially for planarian research, as planarians differ quite dramatically in size from animal to animal and between experimental batches. A third advantage of this approach is that differences in any two signatures can be easily quantified. This makes it possible to rapidly and automatically group images with similar body morphologies. Figure 5B demonstrates this functionality, showing a neighbor-joining tree (Saitou and Nei, 1987) based on the signatures produced for images shown on the leaves.
3.1. Implementation and availability
ImagePlane is written in the Python programming language. ImagePlane consists of five basic Python modules that provide a set of interlocked methods that cover the essential activities that typify these screens: automatic determination of animal outlines and size; automatic image thresholding; methods for counting labeled populations of cells; and sectorization for quantitation of morphological changes induced by experimental manipulations. It is free for academic use and is available for download.
4. Conclusions
ImagePlane provides a set of interlocked methods that cover the essential activities of automatic determination of animal outlines and size; automatic image thresholding; methods for counting labeled populations of cells; and sectorization and quantitation of morphological changes induced by experimental manipulations. In the tradition of genome annotation pipelines, our goal has been to produce a practical pipeline for automated analysis of large collections of images, rather than to advance the basic science of image processing. As such, ImagePlane is an example of the new and growing domain of Bioimage informatics (Eliceiri et al., 2012) and is designed to support high-throughput 96-well screens such as the one described here (see Methods). Our goal has been to enable analyses of large numbers of images in an entirely automated fashion, without having to inspect a single image, and without extensive training or pipeline tuning procedures. As our results demonstrate, ImagePlane can analyze large numbers of images rapidly, accurately, and in an ab initio fashion.
Supplementary Material
Acknowledgments
The authors would like to thank J. Jenkin, S. Robb, and J. Robb for their help and advice regarding experimental techniques; J. Pellettieri for help counting worms; Deepak Anthony for preliminary work on the project; and A. Sánchez Alvarado for help and encouragement throughout. This work was supported by R01GM088269 to M.Y.
Author Disclosure Statement
No competing financial interests exist.
References
- Baguñà J. Dramatic mitotic response in planarians after feeding, and a hypothesis for the control mechanism. J. Exp. Zool. 1974;190:117–122. doi: 10.1002/jez.1401900111. [DOI] [PubMed] [Google Scholar]
- Blayvas I. Bruckstein A. Kimmel R. Efficient computation of adaptive threshold surfaces for image binarization. Pattern Recognit. 2006;39:89–101. [Google Scholar]
- Boutros M. Kiger A.A. Armknecht S., et al. Genome-wide RNAi analysis of growth and viability in Drosophila cells. Science. 2004;303:832–835. doi: 10.1126/science.1091266. [DOI] [PubMed] [Google Scholar]
- Cantarel B.L. Korf I. Robb S.M.C., et al. MAKER: an easy-to-use annotation pipeline designed for emerging model organism genomes. Genome Res. 2008;18:188–196. doi: 10.1101/gr.6743907. [DOI] [PMC free article] [PubMed] [Google Scholar]
- Collins T.J. ImageJ for microscopy. BioTechniques. 2007;43:25–30. doi: 10.2144/000112517. [DOI] [PubMed] [Google Scholar]
- Curwen V. Eyras E. Andrews T.D., et al. The Ensembl automatic gene annotation system. Genome Res. 2004;14:942–950. doi: 10.1101/gr.1858004. [DOI] [PMC free article] [PubMed] [Google Scholar]
- Eliceiri K.W. Berthold M.R. Goldberg I.G., et al. Biological imaging software tools. Nat. Methods. 2012;9:697–710. doi: 10.1038/nmeth.2084. [DOI] [PMC free article] [PubMed] [Google Scholar]
- Fleischmann R.D. Adams M.D. White O., et al. Whole-genome random sequencing and assembly of Haemophilus influenzae Rd. Science. 1995;269:496–512. doi: 10.1126/science.7542800. [DOI] [PubMed] [Google Scholar]
- Hendzel M.J. Wei Y. Mancini M.A., et al. Mitosis-specific phosphorylation of histone H3 initiates primarily within pericentromeric heterochromatin during G2 and spreads in an ordered fashion coincident with mitotic chromosome condensation. Chromosoma. 1997;106:348–360. doi: 10.1007/s004120050256. [DOI] [PubMed] [Google Scholar]
- Holt C. Yandell M. MAKER2: an annotation pipeline and genome-database management tool for second-generation genome projects. BMC Bioinform. 2011;12:491. doi: 10.1186/1471-2105-12-491. [DOI] [PMC free article] [PubMed] [Google Scholar]
- Kamath R.S. Ahringer J. Genome-wide RNAi screening in Caenorhabditis elegans. Methods. 2003;30:313–321. doi: 10.1016/s1046-2023(03)00050-1. [DOI] [PubMed] [Google Scholar]
- Kuttenkeuler D. Boutros M. Genome-wide RNAi as a route to gene function in Drosophila. Brief Funct. Genomic. Proteomic. 2004;3:168–176. doi: 10.1093/bfgp/3.2.168. [DOI] [PubMed] [Google Scholar]
- Liang C. Mao L. Ware D., et al. Evidence-based gene predictions in plant genomes. Genome Res. 2009;19:1912–1923. doi: 10.1101/gr.088997.108. [DOI] [PMC free article] [PubMed] [Google Scholar]
- Moerman D.G. Benian G.M. Waterston R.H. Molecular cloning of the muscle gene unc-22 in Caenorhabditis elegans by Tc1 transposon tagging. Proc. Natl. Acad. Sci. U. S. A. 1986;83:2579–2583. doi: 10.1073/pnas.83.8.2579. [DOI] [PMC free article] [PubMed] [Google Scholar]
- Newmark P.A. Sánchez Alvarado A. Bromodeoxyuridine specifically labels the regenerative stem cells of planarians. Dev. Biol. 2000;220:142–153. doi: 10.1006/dbio.2000.9645. [DOI] [PubMed] [Google Scholar]
- Oliver S.G. Van der Aart Q.J. Agostoni-Carbone M.L., et al. The complete DNA sequence of yeast chromosome III. Nature. 1992;357:38–46. doi: 10.1038/357038a0. [DOI] [PubMed] [Google Scholar]
- Paddison P.J. Hannon G.J. siRNAs and shRNAs: skeleton keys to the human genome. Curr. Opin. Mol. Ther. 2003;5:217–224. [PubMed] [Google Scholar]
- Papadopulos F. Spinelli M. Valente S., et al. Common tasks in microscopic and ultrastructural image analysis using ImageJ. Ultrastruct. Pathol. 2007;31:401–407. doi: 10.1080/01913120701719189. [DOI] [PubMed] [Google Scholar]
- Peng H. Long F. Liu X., et al. Straightening Caenorhabditis elegans images. Bioinformatics. 2008;24:234–242. doi: 10.1093/bioinformatics/btm569. [DOI] [PMC free article] [PubMed] [Google Scholar]
- Reddien P.W. Bermange A.L. Murfitt K.J., et al. Identification of genes needed for regeneration, stem cell function, and tissue homeostasis by systematic gene perturbation in planaria. Dev. Cell. 2005a;8:635–649. doi: 10.1016/j.devcel.2005.02.014. [DOI] [PMC free article] [PubMed] [Google Scholar]
- Reddien P.W. Oviedo N.J. Jennings J.R., et al. SMEDWI-2 is a PIWI-like protein that regulates planarian stem cells. Science. 2005b;310:1327–1330. doi: 10.1126/science.1116110. [DOI] [PubMed] [Google Scholar]
- Robb S.M.C. Ross E. Sánchez Alvarado A. SmedGD: the Schmidtea mediterranea genome database. Nucleic Acids Res. 2008;36:D599–D606. doi: 10.1093/nar/gkm684. [DOI] [PMC free article] [PubMed] [Google Scholar]
- Saitou N. Nei M. The neighbor-joining method: a new method for reconstructing phylogenetic trees. Mol. Biol. Evol. 1987;4:406–425. doi: 10.1093/oxfordjournals.molbev.a040454. [DOI] [PubMed] [Google Scholar]
- Sánchez Alvarado A. Newmark P.A. Double-stranded RNA specifically disrupts gene expression during planarian regeneration. Proc. Natl. Acad. Sci. U. S. A. 1999;96:5049–5054. doi: 10.1073/pnas.96.9.5049. [DOI] [PMC free article] [PubMed] [Google Scholar]
- Yandell M.D. Edgar L.G. Wood W.B. Trimethylpsoralen induces small deletion mutations in Caenorhabditis elegans. Proc. Natl. Acad. Sci. U. S. A. 1994;91:1381–1385. doi: 10.1073/pnas.91.4.1381. [DOI] [PMC free article] [PubMed] [Google Scholar]
Associated Data
This section collects any data citations, data availability statements, or supplementary materials included in this article.